Article

Influence of the Hanjiang River’s Inlet Sediment Decrease on Modern Sedimentation in the Underwater Delta

1
Haikou Marine Geological Survey Center, China Geological Survey, Haikou 570100, China
2
Hubei Key Laboratory of Marine Geological Resources, China University of Geosciences, Wuhan 430074, China
*
Authors to whom correspondence should be addressed.
Appl. Sci. 2023, 13(14), 8039; https://doi.org/10.3390/app13148039
Submission received: 8 May 2023 / Revised: 29 June 2023 / Accepted: 6 July 2023 / Published: 10 July 2023
(This article belongs to the Special Issue Advances in Applied Marine Sciences and Engineering—2nd Edition)

Abstract

:
The Hanjiang River is the second-largest river in Guangdong Province, China. The modern sedimentation pattern of the Hanjiang subaqueous delta has been significantly affected by changes in the sediment delivered by the Hanjiang River. Based on multiperiod charts and columnar samples from the Hanjiang subaqueous delta, the influence of a sharp decrease in the sediment flux from the Hanjiang River on the deposition of the Hanjiang subaqueous delta in the past 60 years was studied through a combination of chart-based analysis of the evolution of erosion and deposition and the analysis of sediment samples. The results showed that the significant reductions in sediment fluxes from the Hanjiang River and Rongjiang River had obviously spatially differentiated effects on the deposition pattern of the Hanjiang subaqueous delta. The significant decreases in sediment fluxes from the Hanjiang River and the Rongjiang River caused the sediment grain size of the columnar samples in the near-estuary area of the Hanjiang River subaqueous delta to coarsen upward, the deposition rate to decrease, and the depositional state to change to an erosional state. Since the sediments discharged into the ocean after reservoir impoundment are mainly fine-grained suspended sediments, the supply of coarse-grained sediments in the Hanjiang subaqueous delta decreased, resulting in the upward fining of the columnar samples. The spatial response pattern of the Hanjiang subaqueous delta to the sharp decrease in sediment flux into the sea differed significantly from those of the Yangtze and Yellow subaqueous deltas.

1. Introduction

With the rapid development of society and the economy, human activities in river basins and estuaries have intensified, and changes in the external environments of large river deltas are becoming increasingly complex. Studying the changes in river sediment flux into seawater and the responses of estuary deltas to them is needed not only in the fields of geology, geomorphology, hydrological engineering, and sediment dynamics but also for social and economic development. The effects of water storage and sediment retention in large reservoirs in basins have caused a continuous reduction in the sediment input of rivers to the sea, and the insufficient sediment supply has caused erosion crises in river deltas [1,2,3,4,5,6,7,8]. Nienhuis et al. (2020) analyzed the evolution process of 11,000 global delta landforms and concluded that the erosion and retreat of deltas are constrained by a variety of factors. In addition to the influence of sea level rise, changes in the sediment flux into the sea caused by deforestation and dam construction are important factors affecting the evolution of delta deposition [9]. The most important impact of dam construction in the middle and upper reaches of the river is the interception of a large amount of sediment that would otherwise enter the sea. Thus, the sediment supplies of deltas have decreased, and the deposition rates have been significantly affected.
The changes in underwater delta deposition are mainly reflected in the transformation of underwater delta erosion and deposition, changes in the deposition rate, and changes in the sediment particle size. The key factor affecting the erosion crises of large river deltas is the sharp reduction in the sediment flux into the sea [2,10]. In previous studies, it was found that the significant reduction in the sediment flux from rivers into the sea had an important impact on the evolution of the underwater delta topography, and this impact reduced the deposition rate of the underwater deltas or changed the delta from a depositional state to an erosional/alluvial deposition equilibrium state. Gao et al. (2019) calculated the deposition rates of six columnar samples (collected in 2014–2015) from the Yangtze underwater delta based on 210Pb dating and found that the Yangtze underwater delta experienced a transition from rapid deposition to slow deposition [11].
In recent years, the changes in the sediments delivered by the Hanjiang River into the sea and the sedimentation pattern of the Hanjiang underwater delta have gradually attracted the attention of scholars. Yang Chuanxun et al. (2017) analyzed the hydrological data of Chao’an Station from 1955 to 2012 and concluded that since 2000, the construction of many hydropower stations and the increase in land vegetation coverage have led to a significant decrease in sediment discharge from the Hanjiang River to the sea. Moreover, the main reason for the reduction in sand flux was investigated [12]. Zhao Lan (2019) used the MK test to analyze water and sediment data from 1955 to 2016, and the results showed that the sediment load changed abruptly in 1998 [13]. Zhang Yupo (2016), based on the analysis of the various characteristics of the sediment load at Chao’an Station from 1951 to 2011, concluded that the sudden change point was in 2001, and the main reason for the sudden change was that after the 1990s, the construction of multiple upstream cascade power stations, reservoirs, and junctions intercepted some sediment [14]. From the 1950s to the 1980s, several small hydropower stations were built in the upper reaches of the Hanjiang River, and since the 1990s, large hydropower stations have been built. The Qingxi Hydropower Station, completed in 1997, has a total installed capacity of 144 MW and a total storage capacity of 75 million m3. The Mianhuatan Hydropower Station, constructed from 1998 to 2003, has a total installed capacity of 600 MW and a total storage capacity of 2.035 billion m3. Wang Yufei (2022) studied the changes in the sediment flux entering the sea from the Hanjiang River and its impact on the adjacent sea areas over the past 60 years. The results of the study showed that there was no significant change in the runoff of the Hanjiang River into the sea, whereas the sediment flux into the sea showed a significant decreasing trend [15]. The large-scale hydropower stations (Qingxi and Mianhuatan hydropower stations) in the Hanjiang River Basin are the main factors causing the significant reduction in the sediment flux into the sea. The years in which notable changes occurred identified by the above studies are not very different, and the difference may be caused by the inconsistencies in the starting and ending years of the hydrological data. When analyzing the driving factors of the sudden change in sediment discharge at Chao’an Station, the above studies suggested that the construction of many reservoirs and the increase in vegetation coverage (water and soil conservation) were the main influencing factors. Zhang Jiahao et al. (2020) compared the nautical charts of the sea area near Hanjiangkoumen in 1971, 2010, and 2016 and analyzed the topographical evolution of the sea area from 1971 to 2016. They found that there was a slight siltation trend from 1971 to 2016 [16]. The slight siltation trend was similar to the slight erosion trend from 2010 to 2016.
It can be seen from previous studies that there is relatively little understanding of the erosion and deposition, deposition rate, and sediment particle size change of the Hanjiang subaqueous delta. Therefore, this study focused on the Hanjiang underwater delta and used a combination of chart-based erosion and sedimentation evolution analysis and sediment sample analysis to reveal the impact of Hanjiang inflowing sediment changes on Hanjiang underwater delta deposition.

2. Materials and Methods

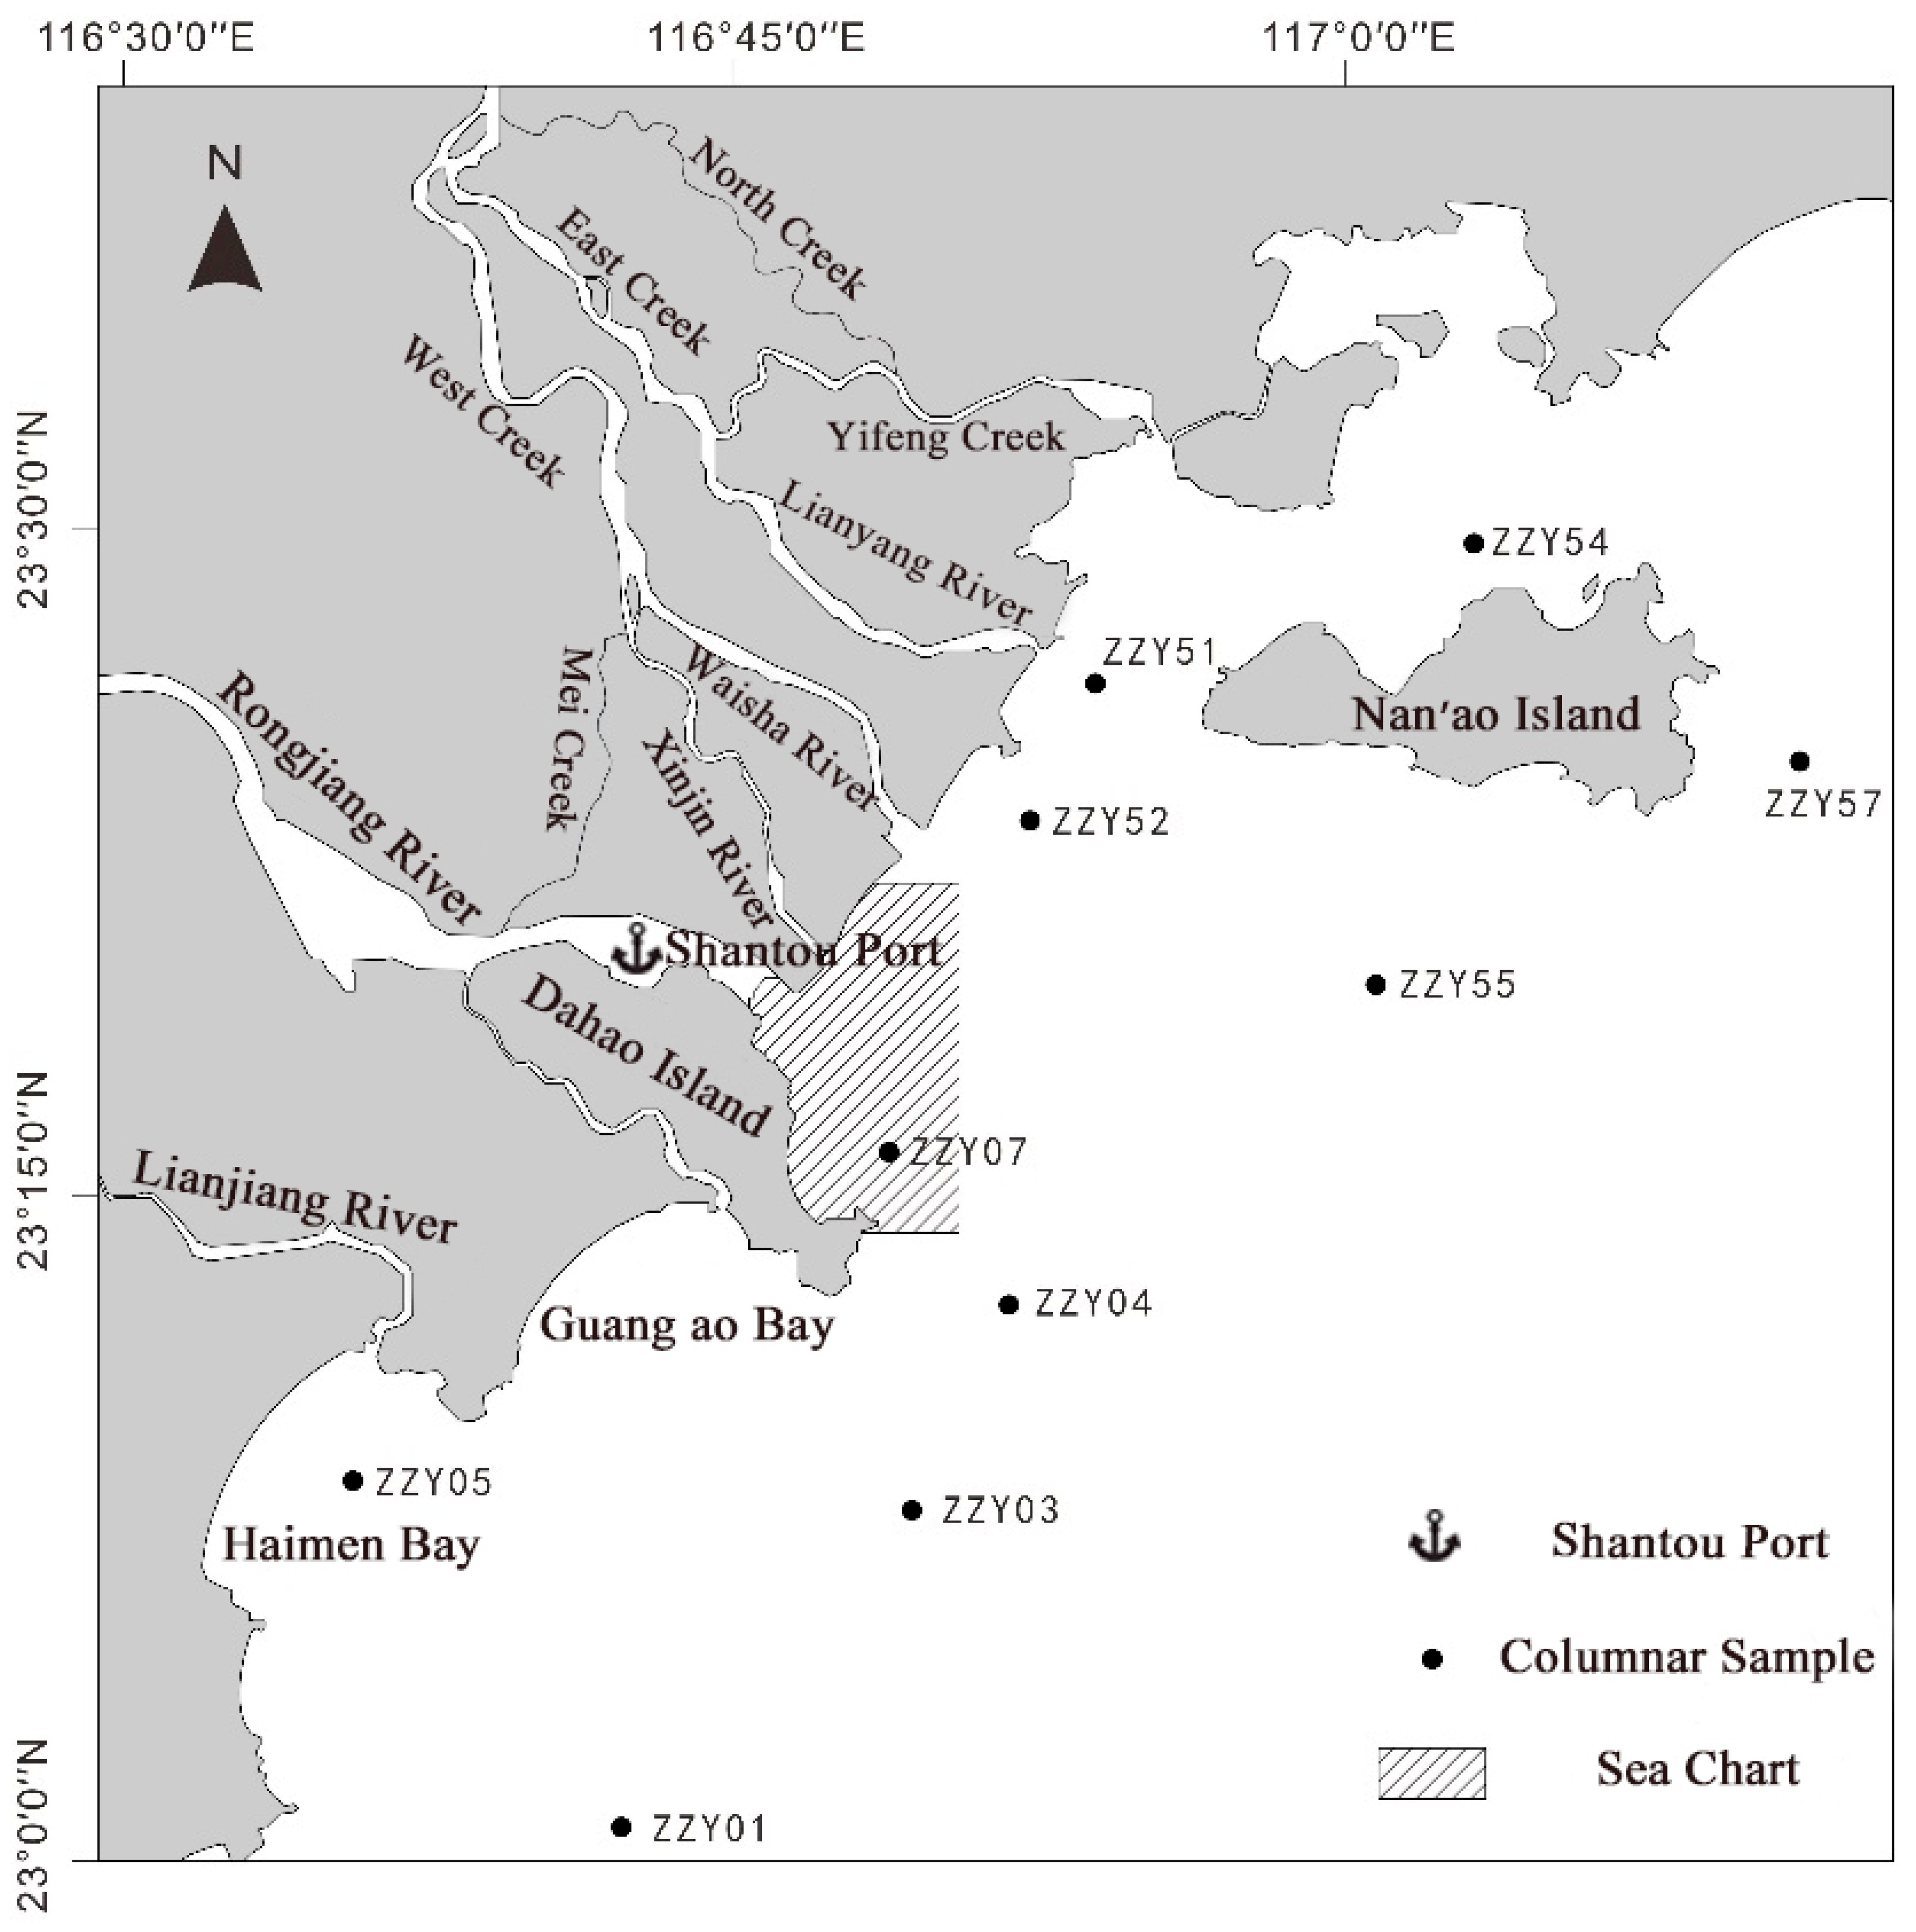
2.1. Research Materials

The materials used in this paper can be divided into two main parts: (1) the nautical chart data of the waterway outside Shantou Port in the Hanjiang underwater delta in the past 40 years; and (2) ten column samples from the Hanjiang underwater delta.
The chart depth data came from the Navigation Assurance Department of the Naval Command of the Chinese People’s Liberation Army and the Hydrographic Bureau of the Chinese People’s Liberation Army. The scale was 1:15,000 to 1:25,000 (Table 1). The support projection method and the WGS 1984 coordinate system were used. The areas of charts 15,112 and 15,113 were the outer channels of Shantou Port (15,112 and 15,113 are charts of different periods in the same sea area, and the distribution area is shown in the shaded area in Figure 1).
Among them, four nautical charts of the Shantou Port Outer Channel (Map Nos. 15,112 and 15,113) were published in 1984, 1993, 2013, and 2018, and the actual survey years for most of the areas were 1980, 1989, 2012, and 2016. The numbers of water depth points were 1583, 1784, 1692, and 2349, respectively.
In August 2020 and July 2021, under the organization of the project “Comprehensive Geological Survey of Chaoshan Coastal Zone” carried out by the Haikou Marine Geological Survey Center of the China Geological Survey, 10 columnar samples were collected in the Hanjiang Estuary and coastal waters (Figure 1), and four of them were selected for 210Pb dating and grain size analysis. The instrument used for columnar sample collection was a shallow sea gravity sampler, and the maximum working water depth was 50 m. The sampling diameter was 70 mm.

2.2. Research Methods

2.2.1. Calculation of the Erosion and Deposition Evolution of the Underwater Delta

First, the chart was geographically registered and digitized. Second, the water depth point interpolation was carried out. According to the water depth data for each period, kriging interpolation was carried out by using the spatial analysis (3D Analyst) function to establish an elevation model. Finally, according to the kriging interpolation results, erosion and deposition analysis were carried out in 3D Analyst and Spatial Analyst. The erosion and deposition volume, erosion, and deposition rate, etc., were determined, and the calculated results and graphics were produced and output.
When calculating erosion and deposition, the average water depth of the previous period was subtracted from the average water depth of the later period in each grid area to obtain the erosional or depositional thickness of the area (a positive value indicated deposition, and a negative value indicated erosion). The erosion and deposition volume of the entire area was calculated by adding up the deposition volume and then dividing it by the total area and the time interval (years) to obtain the annual average erosion and deposition rate of the area.

2.2.2. 210Pb Dating of Columnar Samples

The deposition rate measured by 210Pb dating can objectively reflect the trend of deposition. The data processing methods for 210Pb included a constant initial concentration mode and a constant replenishment rate mode. The constant initial concentration mode (CIC) was selected for this treatment. The calculation formula for the CIC mode is:
S = λ D/ln(A0/Ax) (3.10)
where S is the average deposition rate, cm/a; λ is the decay constant of 210Pb, λ = 0.031/a; D is the deposition depth, cm; A0 is the specific activity of the surface sediment, dpm/g; and Ax is the specific activity of the sediment at depth x, dpm/g.
In this paper, the average deposition rate of the entire columnar sample was first calculated according to the CIC model, and then the columnar sample was divided into upper and lower sections according to the horizons where the particle size of the columnar sample changed significantly. The average deposition rate of the upper section was also calculated according to the CIC model. The variation trend of the underwater delta deposition rate could be obtained from the change in the deposition rate of the whole section.

2.2.3. Particle Size Analysis

This test used a laser particle size analyzer at the Geological Survey Experiment Center of the China University of Geosciences (Wuhan) Institute of Geological Survey. The instrument model was the Mastersizer-3000 laser particle size analyzer, produced by Malvern, UK. The instrument measurement range was 0.01–3500 μm, and the measurement accuracy and repeatability exceeded 0.5%.
The Folk classification scheme for marine sediments was adopted for the classification and naming of surface sediments. The Udden-Wentworth grade scale was used as the standard grain size of the borehole sediments, and it was used to calculate the limit and classification of the Udden-Wentworth scale and the average particle size (Mz), sorting coefficient (σ), skewness (SK), and kurtosis (KG).

3. Results

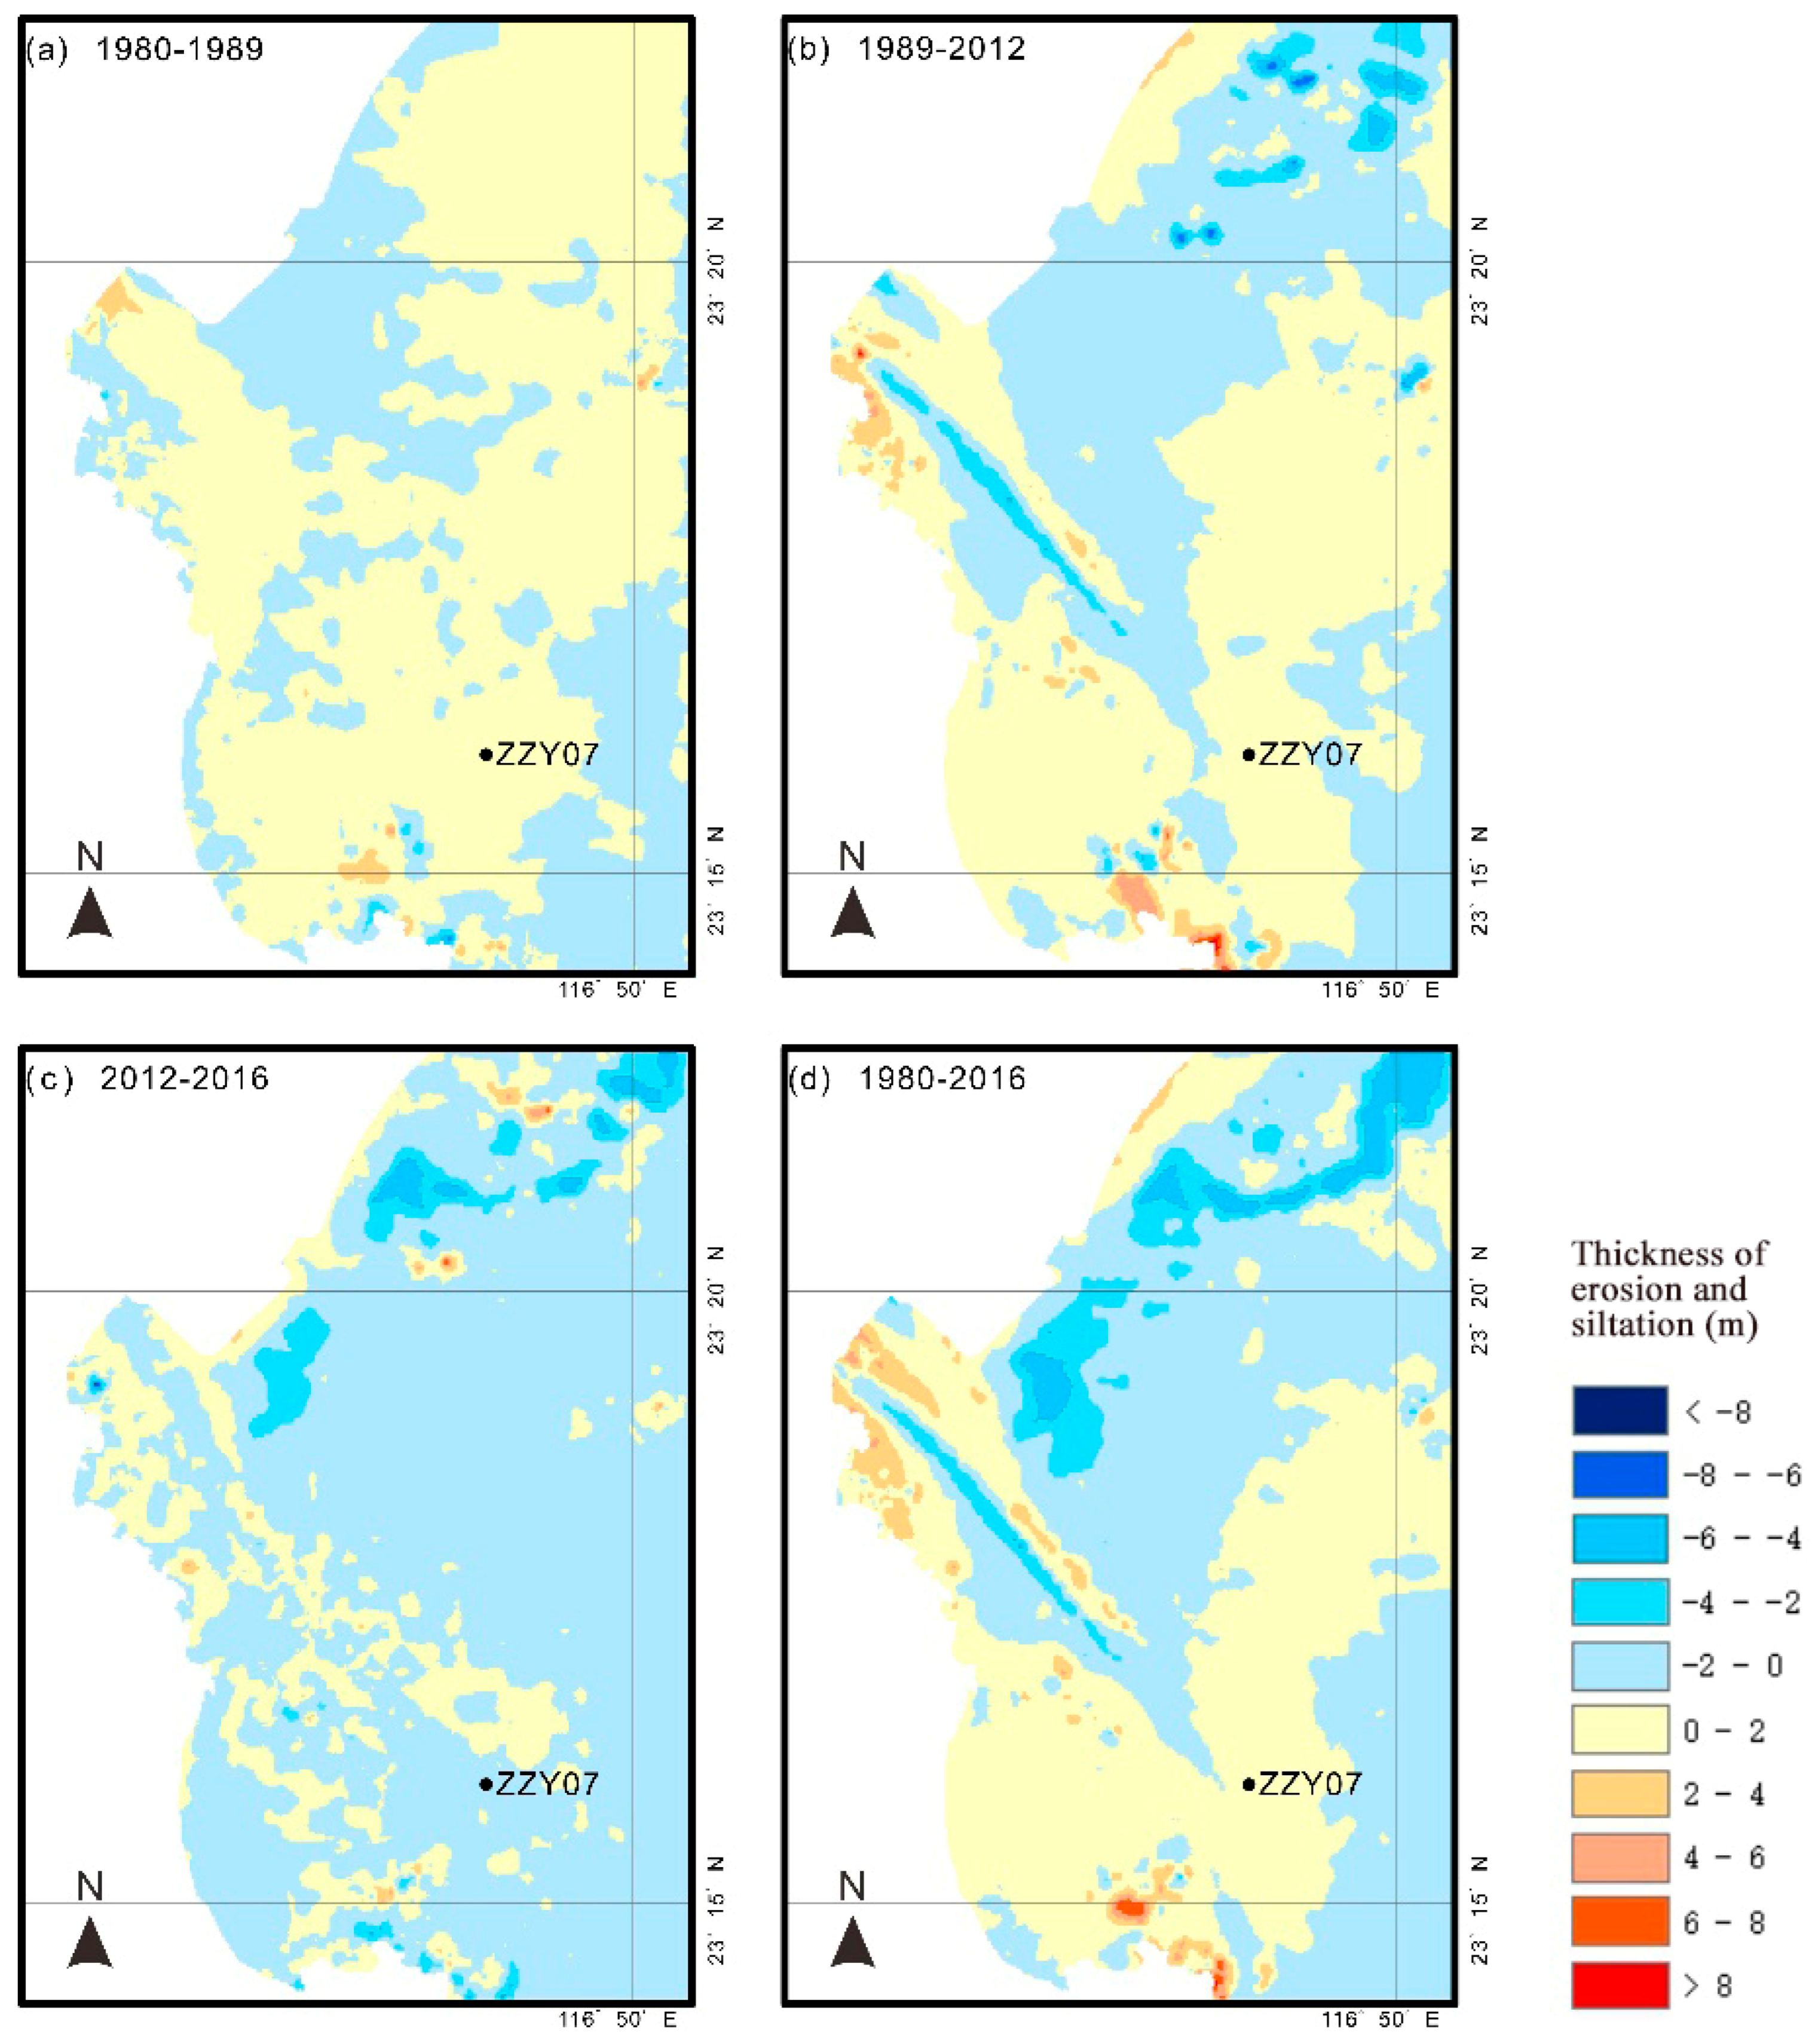
3.1. Underwater Delta Erosion and Deposition Evolution

By digitizing and comparing the four seaway charts outside Shantou Port, the overall erosion and deposition results (Table 2) and the spatial distribution maps of erosion and deposition in the region in different periods (Figure 2) were obtained.
From 1980 to 1989, the channel outside Shantou Port was in a state of accumulation, with a net deposition volume of 1.24 × 10⁷ m³ and a deposition area and an erosion area of 7.40 × 10⁷ m2 and 3.81 × 10⁷ m2, respectively; thus, the deposition area accounted for 66% of the total area. The average deposition thickness during this period was 0.11 m, and the average deposition rate was 1.23 cm/a. The erosion and deposition distribution is shown in Figure 2a. Ninety-nine percent of the study area had an erosion and deposition range within two meters, and there was no obvious deposition and erosion center. At 116°50′4″ E and 23°18′29″ N, the deposition amplitude was the largest, the deposition thickness at the center was 5.5 m, and the deposition rate was 61.4 cm/a. At 116°48′30″ E and 23°14′24″ N, the erosion amplitude was the largest, the erosion thickness at the center reached 6.3 m, and the deposition rate was −70.0 cm/a. From 1980 to 1989, the average annual sediment flux of the Hanjiang River into the sea was 8.431 million t, and the average annual sediment flux of the Rongjiang River into the sea was 515,000 t (Table 3, Figure 3).
From 1989 to 2012, the overall waterway outside Shantou Port was in a state of slight erosion, with a net erosion volume of 0.40 × 10⁷ m3, and the deposition area and erosion area were 5.83 × 10⁷ m2 and 5.38 × 10⁷ m2, respectively. The deposition area and erosion area were roughly equal. During this period, the average erosion thickness was 0.04 m, and the average deposition rate was −0.15 cm/a. The erosion and deposition situation is shown in Figure 2b. Ninety-four percent of this area had an erosion and deposition range within two meters, and there was no obvious deposition and erosion center. At 116°48′31″ E and 23°14′24″ N, the deposition amplitude was the largest, the deposition thickness at the center was 9.1 m, and the average deposition rate was 39.7 cm/a. At 116°48′14″ E and 23°20′11″ N, the erosion amplitude was the largest, the erosion thickness at the center was 7.9 m, and the average deposition rate was −34.2 cm/a. From 1989 to 2012, the average annual sediment flux into the sea from the Hanjiang River was 3.844 million t, a 54.4% decrease compared with that in 1980–1989. The average annual sediment flux into the sea from the Rongjiang River was 363,000 t, a 29.5% decrease compared with that in 1980–1989 (Table 3). During this period, the significant reduction in the sediment fluxes from the Hanjiang and Rongjiang Rivers into the sea was the main reason for the transition of the outer channel of Shantou Port from deposition (1980–1989) to a balance between erosion and deposition (1989–2012).
From 2012 to 2016, the Shantou Port Outer Channel was in the erosion period, with a net erosion volume of 4.14 × 10⁷ m3 and deposition and erosion areas of 2.04 × 10⁷ m2 and 9.15 × 10⁷ m2, respectively. The erosion area accounted for 82% of the total area. During this period, the average erosion in this area was 0.37 m, and the average deposition rate was −9.24 cm/a. The erosion and deposition situation in this area is shown in Figure 2c. The deposition amplitude was the largest at 116°48′31″ E and 23°14′24″ N; the deposition thickness at the center was 6.3 m; and the average deposition rate was 156.9 cm/a. The erosion area was mainly distributed on the north side of the study area. The erosion amplitude was the largest at 116°45′37″ E and 23°19′15″ N; the erosion thickness at the center was 8.0 m; and the average deposition rate was −201.0 cm/a. From 2012 to 2016, the average sediment flux into the sea from the Hanjiang River was 2.257 million t, a 41.3% decrease compared with that from 1989 to 2012. The average annual sediment flux into the sea from the Rongjiang River was 269,000 t, a 25.9% decrease compared with that from 1989–2012 (Table 3). During this period, the continuous reduction in the sediment fluxes from the Hanjiang and Rongjiang Rivers into the sea was the main reason for the change in the external waterway of Shantou Port from erosion and deposition balance (1989–2012) to erosion (2012–2016).
The waterway area outside Shantou Port in the Hanjiang underwater delta was in a slight erosional state from 1980 to 2016 (Figure 2d, Table 2), with an annual average deposition rate of −0.71 cm/a. The average deposition rates of the three periods from 1980 to 1989, 1989 to 2012, and 2012 to 2016 were 1.23 cm/a, −0.15 cm/a, and −9.24 cm/a, respectively, which were indicative of the study area during the study period. Overall, the area was characterized by a pattern of deposition first and then erosion, which is positively correlated with the significant reduction in the sediment fluxes from the Hanjiang and Rongjiang Rivers entering the sea during the same periods (Table 3, Figure 3).

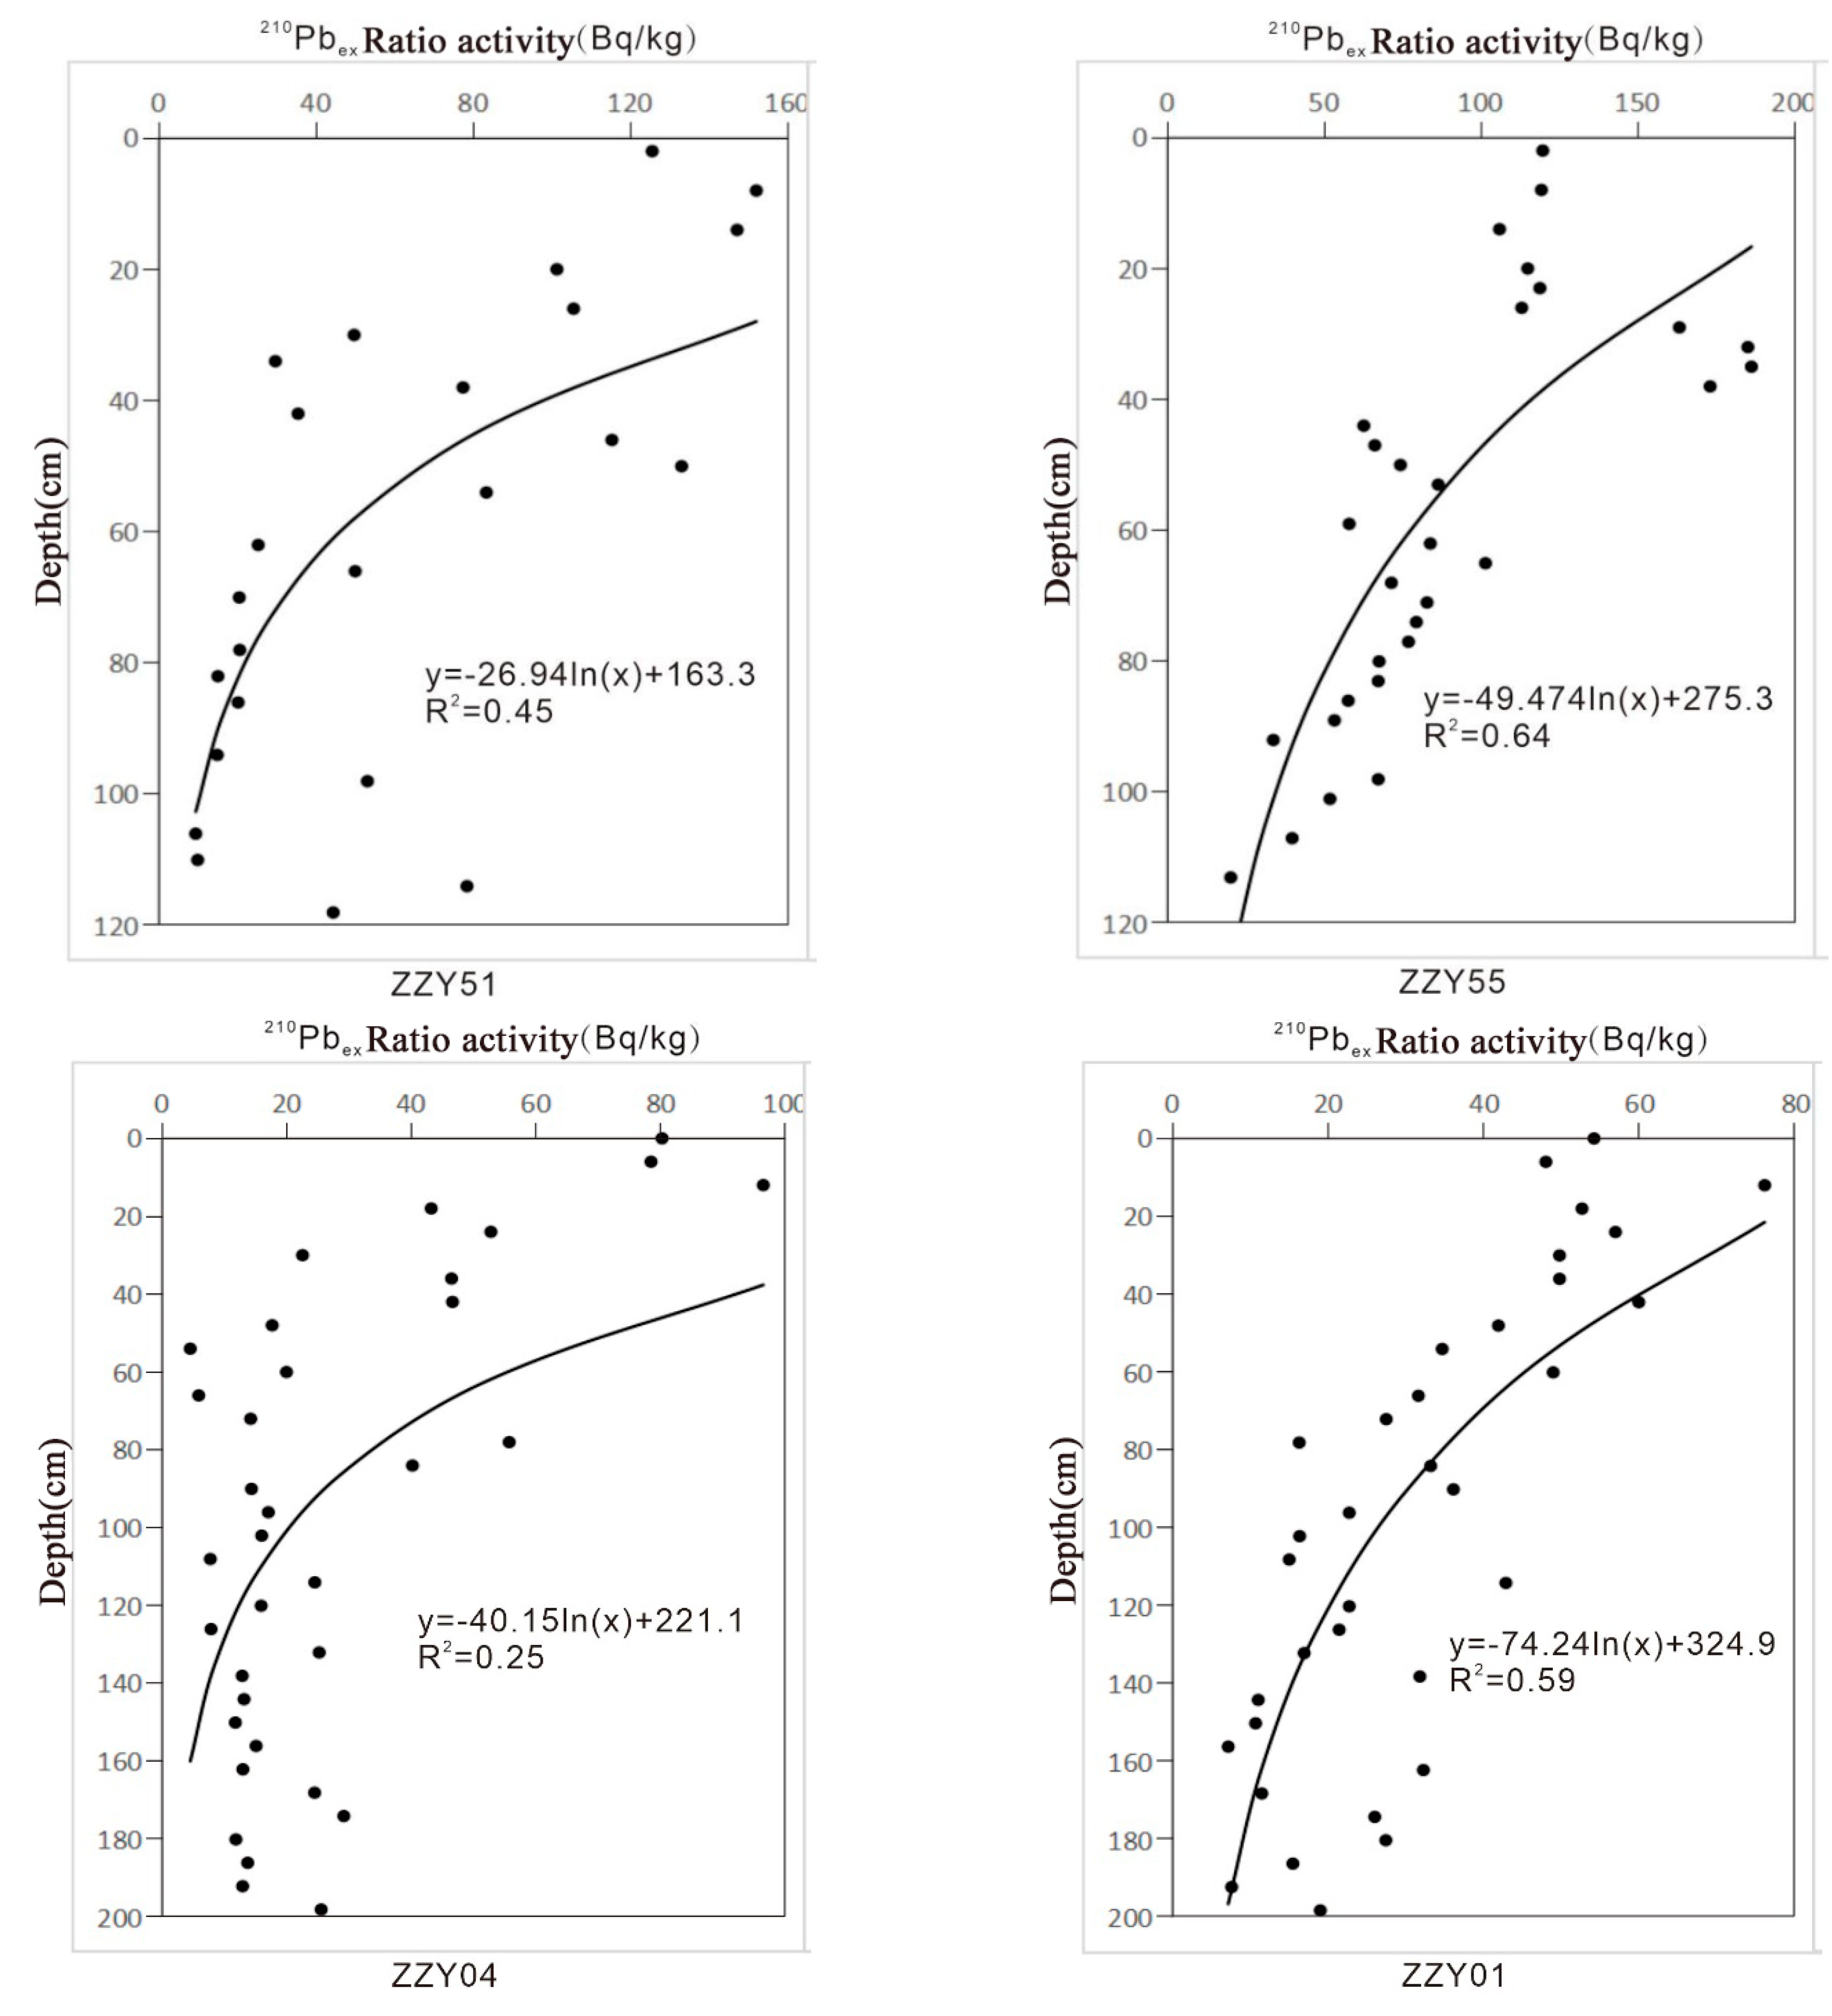
3.2. 210Pb Dating Results for Columnar Samples

To study the effect of changes in the sediment flux into the sea on the change in the deposition rate of the underwater delta, the 210Pbex specific activities of the four column samples of the underwater delta were calculated, and the average deposition rates of the column samples were obtained (Table 4).
A change in the particle size composition leads to a change in the average particle size of the sediment, and such a change indicates that the dynamic depositional environment of the sediment may have changed. Therefore, where the particle size changes significantly, the deposition rate may have changed [11]. Based on the change in particle size, the columnar samples were divided into upper and lower sections. The average deposition rate of the whole section, the average rate of the upper section, and the decrease in the deposition rate were calculated according to the CIC model (Table 4, Figure 4). The average whole-section deposition rates of the four columns are higher than those of the upper sections, and the deposition rates of ZZY04 and ZZY55 decrease the most obviously. According to the erosion and deposition data from the charts, the average deposition rate of the columnar sample ZZY07 station in different stages was calculated. According to the results, the erosion and deposition amplitude at this location was less than 0.2 m, indicating that the water depth change at this location could be ignored. Therefore, it was judged that the ZZY07 station was in a state of erosion and deposition equilibrium during this period (Table 4).

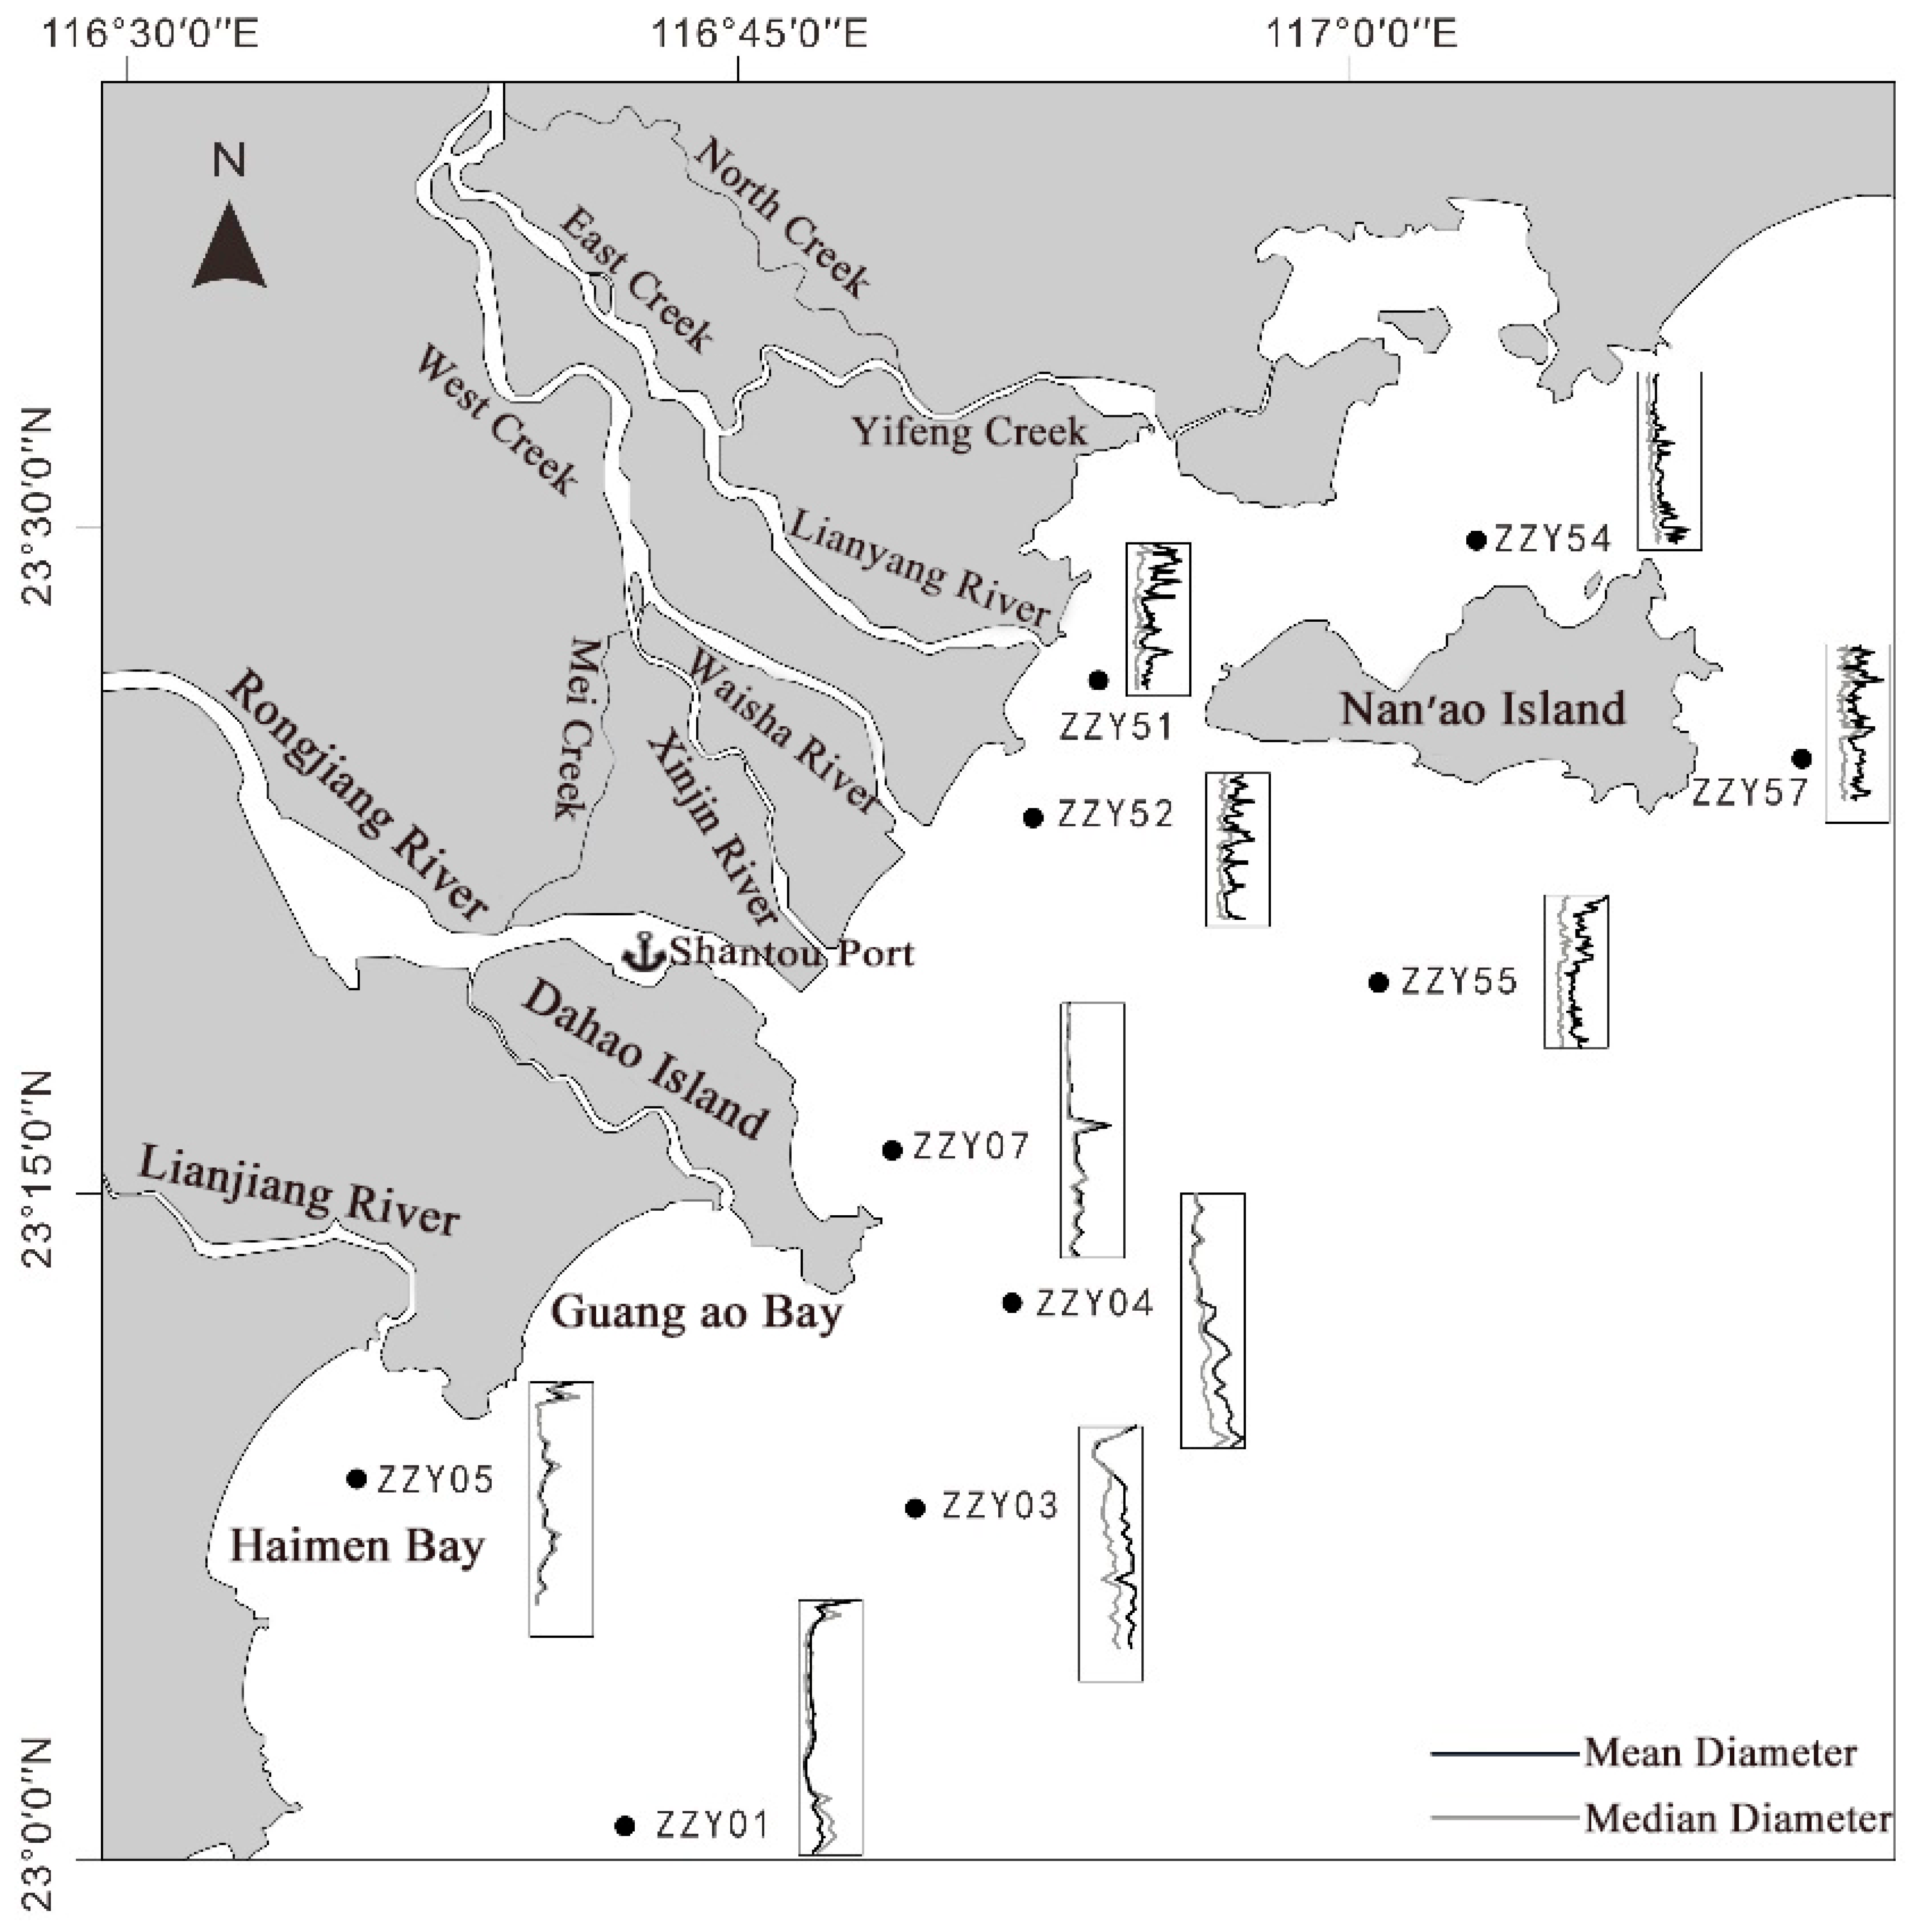
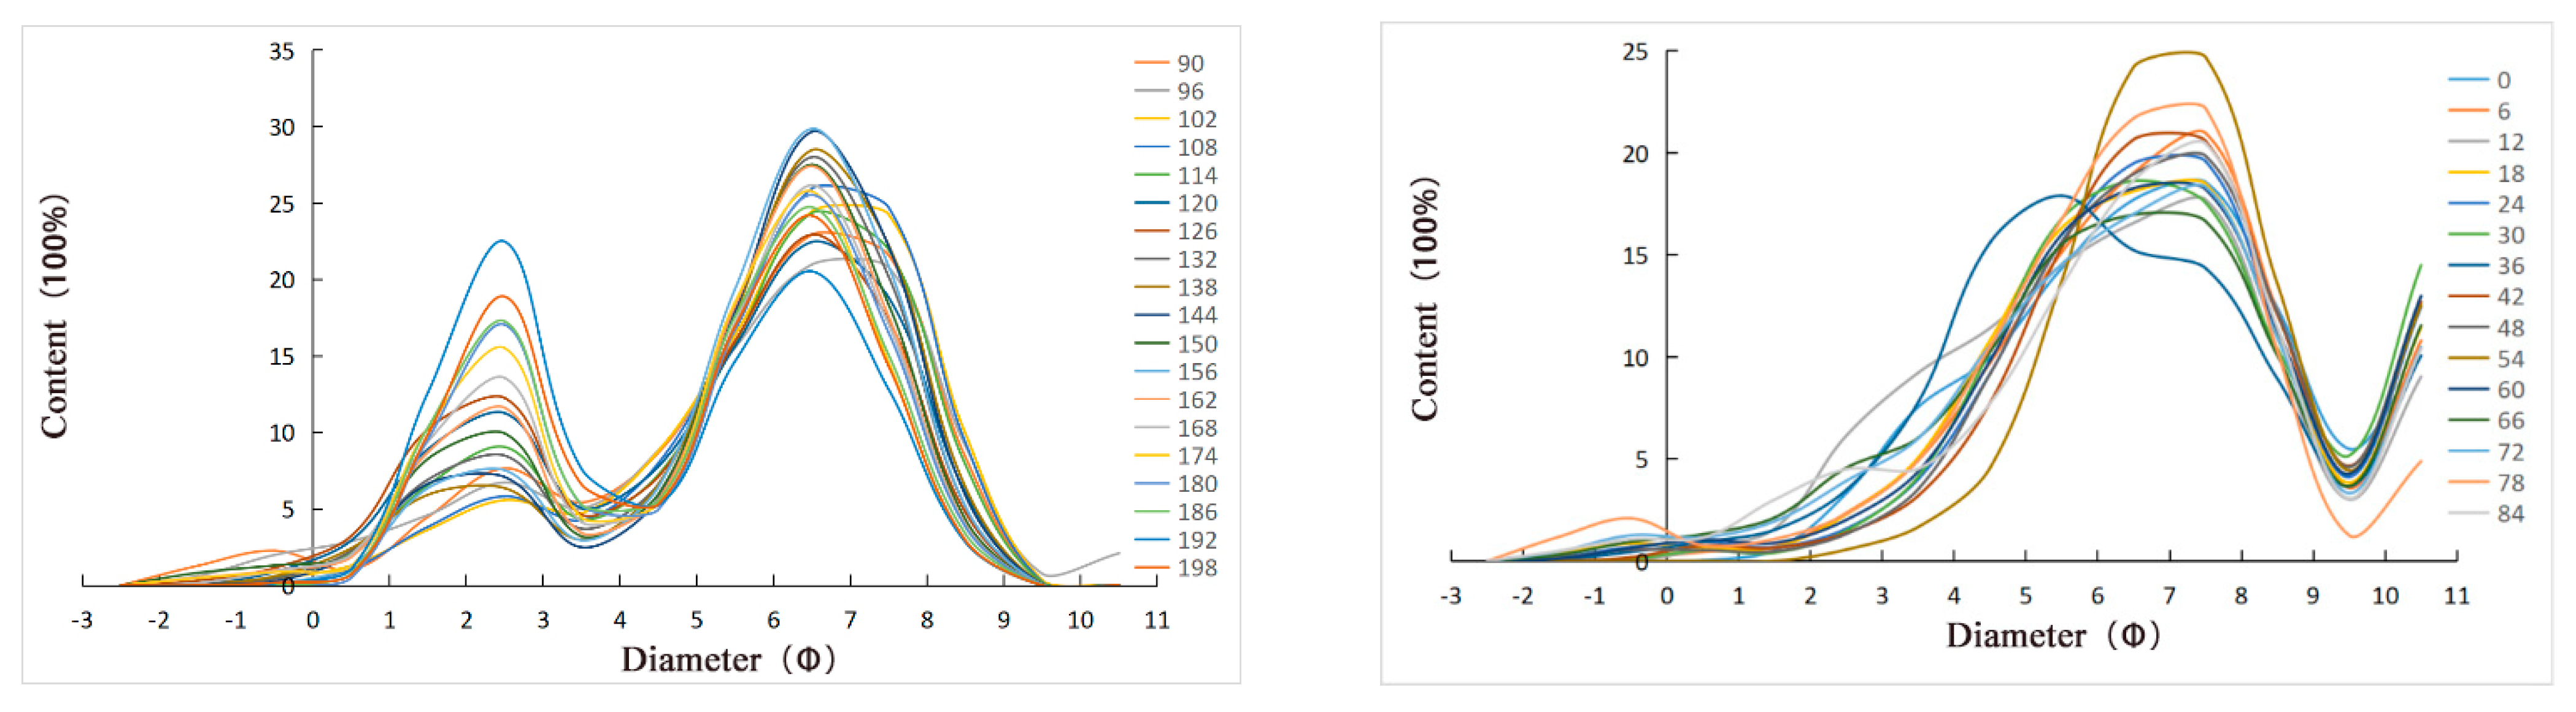
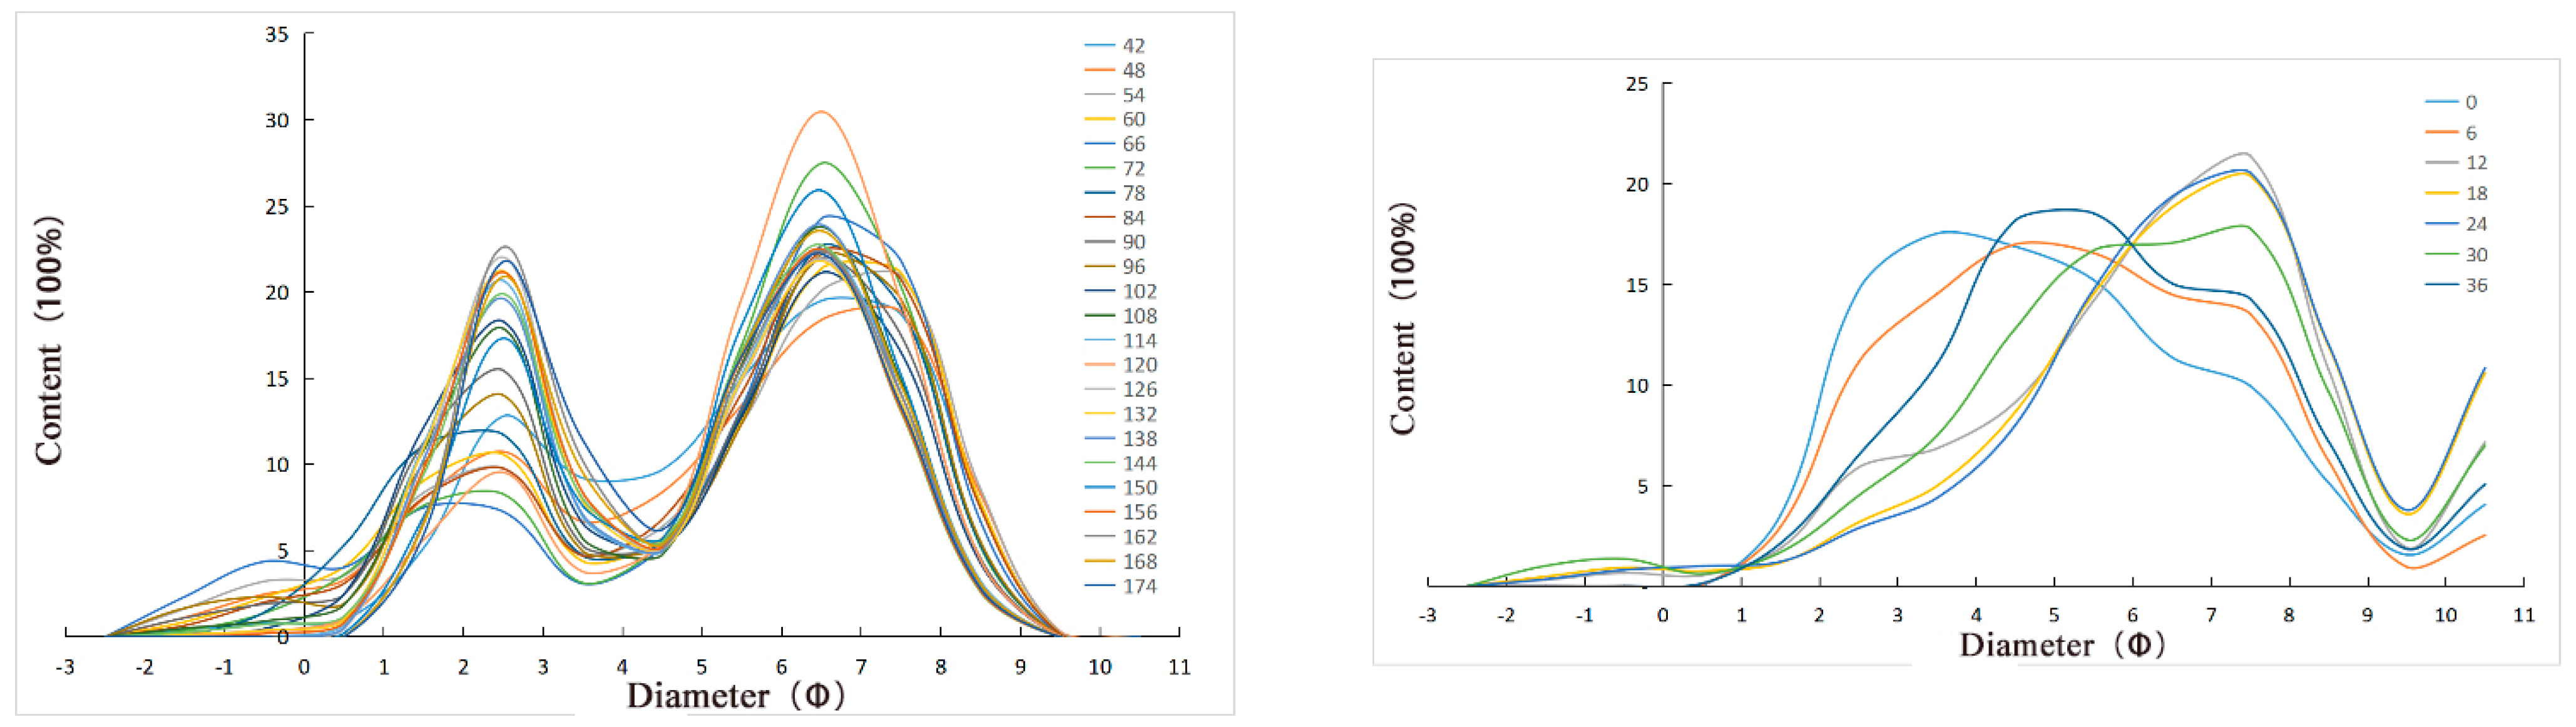
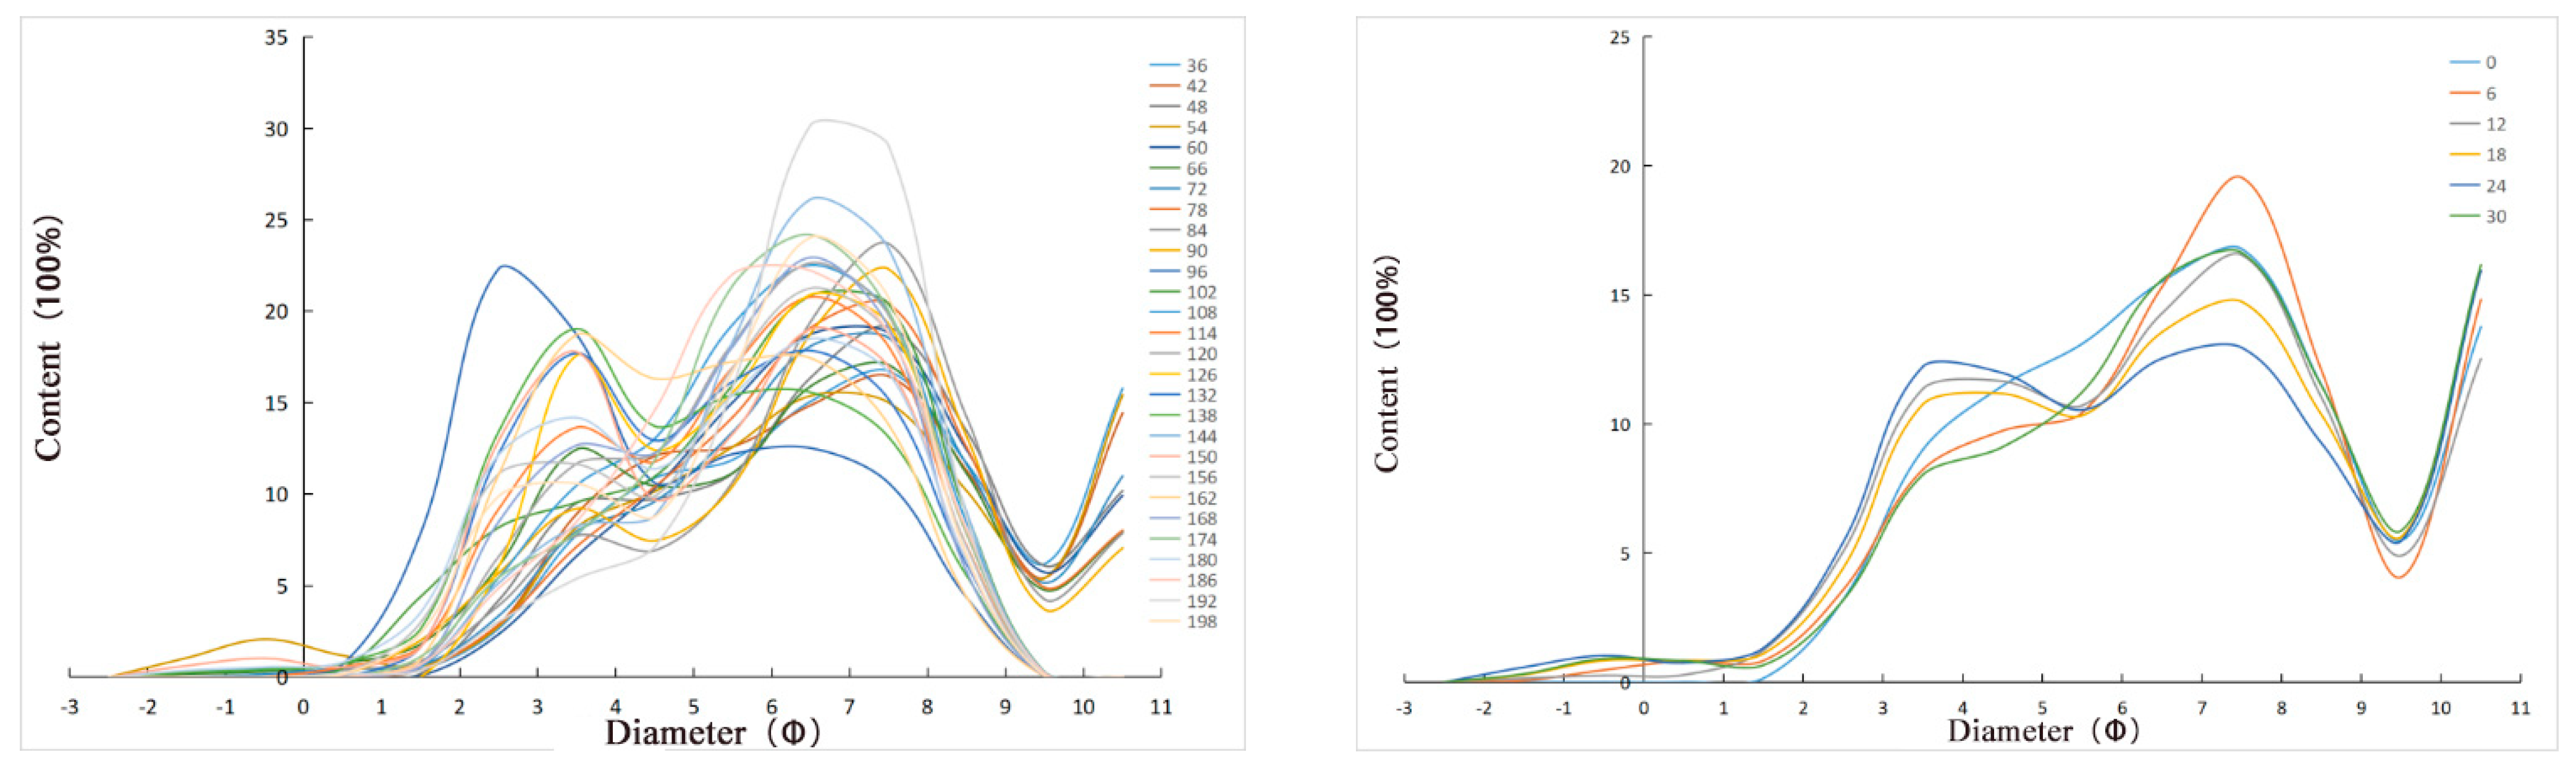
3.3. Particle Size Analysis

The results of the grain size analysis of the columnar samples showed that the sediment grain size composition of ZZY51 was relatively simple, mainly clayey silt, and there were several layers of sandy silty clay (14 cm and 86 cm) and sandy silt (6 cm). The vertical average particle size range is 12.8–51.9 μm, with an average of 25.0 μm. The vertical median particle size range is 6.4–23.1 μm, with an average of 10.9 μm. Columnar sample ZZY51 coarsens above a depth of 42 cm (Table 5 and Table 6). The average particle size and median particle size of ZZY52 (Table 5 and Table 6) and ZZY55 (Table 5 and Table 6) have similar vertical variation characteristics.
The sediment grain size composition of columnar sample ZZY03 is relatively simple, mainly sandy silt, with silt (12 cm, 30 cm, and 36 cm) and clayey silt (18 cm, 24 cm) in a few layers (Table 5). The particle size of the columnar sample ZZY03 has a decreasing upward trend at a depth of 42 cm (Table 6). The average particle size and median particle size of columnar samples ZZY07, ZZY54, and ZZY04 have vertical variation characteristics similar to those of ZZY03.
The results of the grain size analysis of the columnar samples show that the sediment grain size composition of ZZY01 is also relatively simple, being mainly sandy silt from 0–156 cm with a few layers of silty sand at 156–192 cm. The sorting coefficient decreases slightly from bottom to top, and the sorting degree increases slightly. Skewness and kurtosis also show similar changes in the vertical direction. There is no discernible vertical change in the particle size in columnar sample ZZY01.

4. Discussion

4.1. Effect of the Sediment Flux of the Hanjiang River on Erosion and Deposition in the Subaqueous Delta

The deposition thickness of columnar sample ZZY07 in 1980–1989 was 0.38 m, and the average deposition rate was 4.22 cm/a; from 1989 to 2012, the deposition thickness was 0.31 m, and the average sedimentation rate was 1.36 cm/a; and from 2012 to 2016, the erosion thickness was 0.11 m, and the average sedimentation rate was −2.75 cm/a, but the chart bathymetric measurement error was ±0.2 m, and the erosion and deposition amplitude at this location was less than 0.2 m, indicating that the water depth change at this location could be ignored. Therefore, ZZY07 was in an erosion and deposition equilibrium state during this period. ZZY07 was in a slightly depositional state from 1980 to 1989 and from 1989 to 2012, and was in a state of erosion and deposition balance from 2012 to 2016. From 1980 to 2016, a total of 0.69 m was deposited, and the average deposition rate was 1.92 cm/a. Although the channel outside Shantou Port showed a pattern of initial deposition followed by erosion during the period 1980–2016, at the local position of ZZY07, the pattern changed from depositional during 1980–2012 to an erosion–deposition balance state during 2012–2016 (Table 2).
The effect of river sediment fluxes into the sea on changes in erosion and deposition on underwater delta topography has similar manifestations in many regions. In the Mississippi River in the 1950s, for instance, the sediment flux into the sea decreased by approximately 50%, and the deposition volume of the underwater delta decreased from 317 ± 54 Mt/a during 1874–1940 to 145 ± 25 Mt/a during 1940–1979 and further decreased after 1979 to 87 ± 15 Mt/a in 2005 [17]. The sediment flux from the Yangtze River into the sea decreased from 470 million t/a during 1958–1977 to 390 million t/a during 1977–2000 and continued to drop to 210 million t/a during 2000–2007. The average erosion and deposition rate changed from 6.8 cm/a during 1958–1977 to 3.2 cm/a during 1977–2000 to −2.3 cm/a during 2000–2007 [18]. The sediment flux of the Yellow River into the sea has decreased. The erosion and deposition evolution of the current estuary can be divided into four stages: 1996–2002 medium-speed deposition stage, 2002–2007 rapid deposition stage, 2007–2015 slow deposition stage, and 2015–2016 rapid erosion stage [19]. In the 1980s, the sediment flux from the Pearl River into the sea was 2754.5 kg/s and decreased to 2386.8 kg/s in the 1990s and to 1143.8 kg/s from 2000 to 2010. From 1974 to 1985, the deposition volume of West Beach in the Lingdingyang Estuary Delta was 3.63 × 10⁶ m3; from 1985 to 1999, the erosion volume of West Beach was 425.9 × 10⁶ m3; and from 1999 to 2011, the erosion volume of West Beach was 122.11 × 10⁶ m3 (Table 7) [20]. The researchers above believe that the significant reduction in sediment flux into the sea has an important impact on the evolution of underwater delta topography, such as the transition from the deposition state to the erosion-deposition equilibrium state or the reduction in the deposition rate of the underwater delta, which is consistent with the results of this paper. The research results of the sediment flux into the sea from the Hanjiang River and the evolution of the erosion and deposition of the Hanjiang underwater delta are consistent.

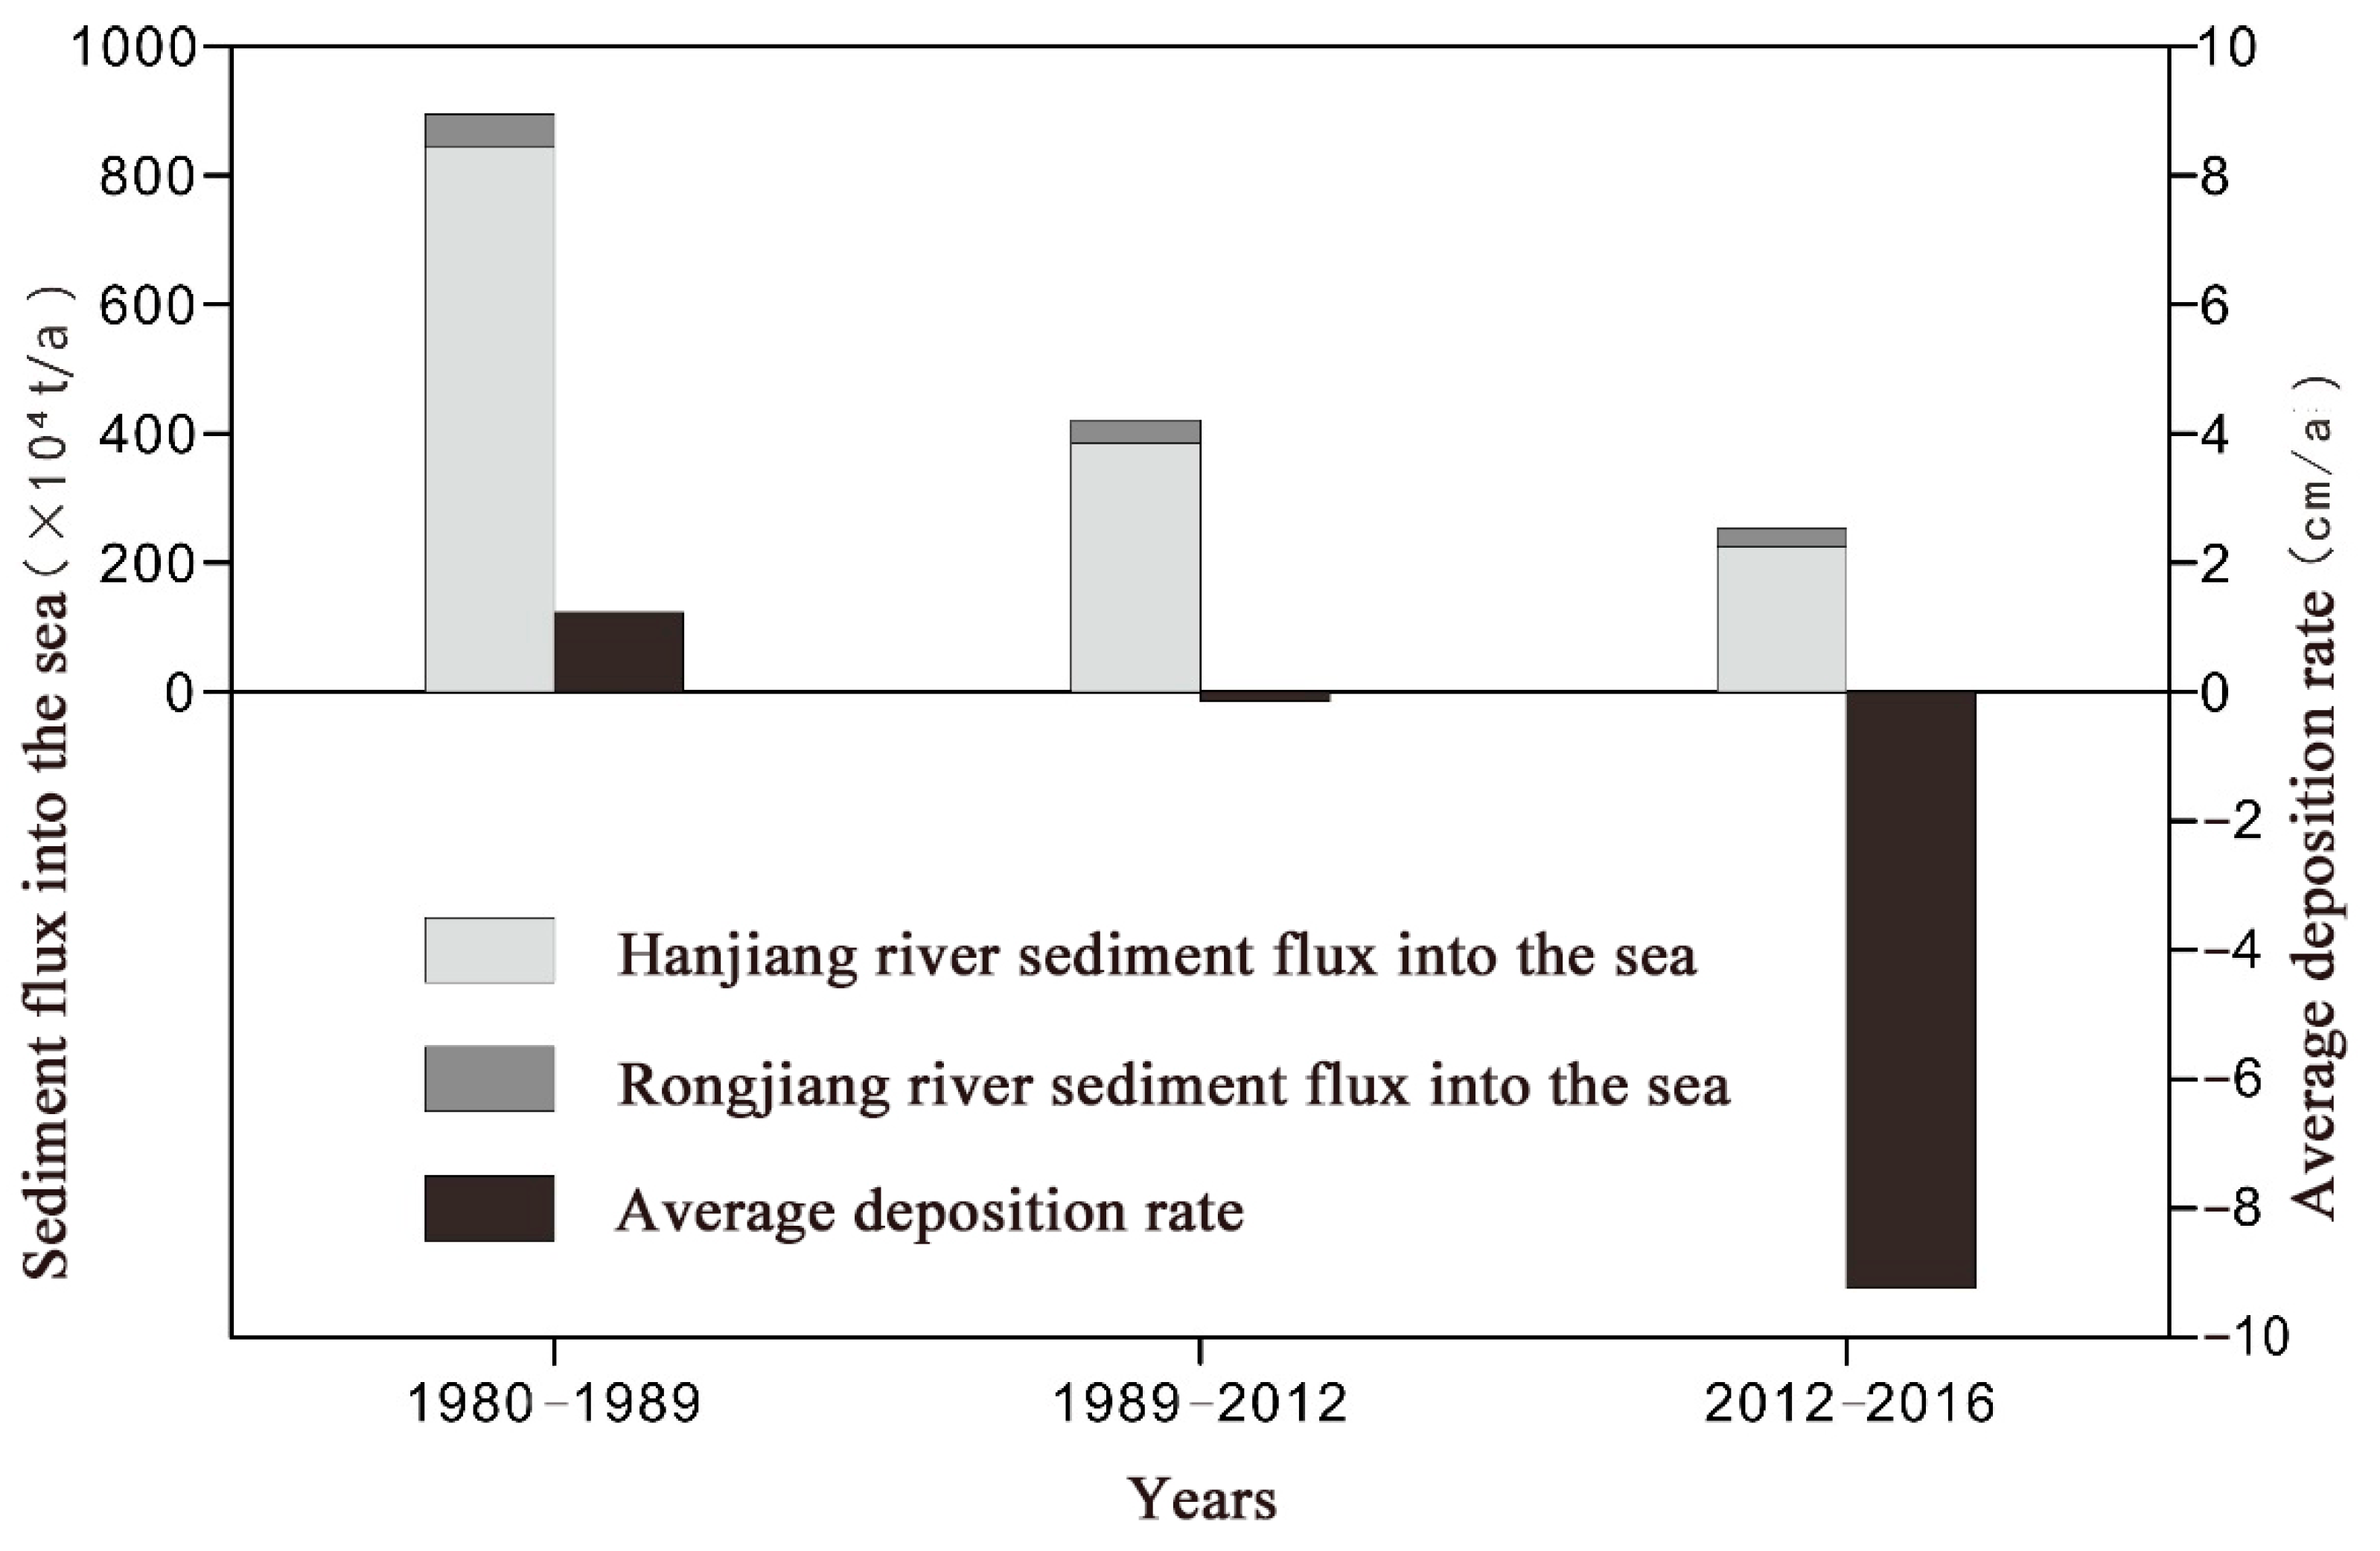
4.2. The Effect of the Sharp Decrease in the Sediment Flux from the Hanjiang River into the Sea on the Deposition Rate

The significant reduction in the sediment flux into the sea had a significant impact on the deposition rates at the ZZY51, ZZY55, and ZZY04 sites but had a lesser effect on the deposition rates at the ZZY01 site (Table 4). The significant reduction in the sediment flux into the sea from the Hanjiang and Rongjiang Rivers generally reduced the deposition rate of the underwater delta. In the area close to the estuary, the changes in the deposition rates of the columnar samples ZZY51, ZZY55, and ZZY04 were more pronounced than those farther from the estuary (ZZY01) (Figure 5).
In other areas, previous studies have performed similar analyses and found that the change in sediment flux into the sea has a certain influence on the deposition rate in the lower delta. The average deposition rate of the columnar samples collected in the Yangtze underwater delta during 2014–2015 ranged from 0.38 to 1.34 cm/a, which was significantly lower than the average deposition rate of the columnar samples collected in 2003 in this area (3–5 cm/a). This means that the Yangtze underwater delta has experienced a transition from rapid deposition to erosion. Compared with the sedimentation rate of the columnar samples collected in the area before 2003, the sedimentation rate of the columnar samples collected in the Zhejiang-Fujian coastal muddy area from 2014 to 2015 was only slightly lower, indicating that after 2003, the deposition rate in the area decreased slightly and the depositional environment remained stable. The material comprising the underwater delta of the Yangtze River mainly comes from the river itself. The low sand supply caused by the interception of sediment by the Three Gorges Dam has changed the erosion and deposition state of the underwater delta of the Yangtze River. The sediment eroded from the underwater delta of the Yangtze River partially makes up for the low sediment supply in the muddy areas along the coasts of Zhejiang and Fujian, so the delta still exhibits a relatively stable depositional environment. With further sediment reduction in the underwater delta of the Yangtze River, the deposition rate of the muddy areas along the coasts of Zhejiang and Fujian will gradually decrease and eventually suffer from erosion [11]. During the 1960s–1980s, the sediment flux into the sea from the Minjiang River Basin increased significantly, and the average deposition rate of the Minjiang underwater predelta increased from 0.67 cm/a during 1954–1963 to 1.04 cm/a during 1963–1986. Afterward, the sediment flux into the sea from the Minjiang River Basin dropped sharply. Since 2001, the sediment flux into the sea from the Minjiang River has been only 34% of that before the 1980s, resulting in an average deposition rate of 0.46 cm/a in this area, which was only 44% during 1963–1986. The sedimentation rates of underwater deltas are positively correlated with the change in sediment flux into the sea, and the sedimentation pattern of underwater deltas responds promptly to the change in sediment flux into the sea [21]. Previous studies have also found that there are spatial differences in the impact of sharp reductions in the sediment flux into the sea on the deposition rate of underwater deltas [11,21].

4.3. The Effect of the Sharp Decrease in the Sediment Flux from the Hanjiang River into the Sea on the Sediment Particle Size

According to the particle size analysis results from the columnar samples, the upper part of the columnar samples ZZY51, ZZY52, and ZZY55 near the estuary of the Hanjiang River became coarser (Table 6), the upper part of the columnar samples ZZY03, ZZY07, ZZY54, and ZZY04 far from the Hanjiang estuary became finer (Table 6), and the particle sizes of the columnar samples ZZY01, ZZY05, and ZZY57 at the far estuary end exhibited no significant change in the vertical direction (Figure 6).
In other areas, previous studies have investigated the causes of sediment coarsening. The average median particle size of sediment surface samples from the Yangtze underwater delta coarsened from 8.0 µm in 1982 to 15.4 µm in 2012. The main reason was that dam construction led to a sharp decrease in the sediment flux into the sea, and the underwater delta shifted from deposition to erosion [22]. Sediment coarsening of active delta lobes in the Yellow River Delta began in the 1990s and became more pronounced (from 17.7 μm to 22.9 μm) in the early 2000s. Reservoir construction and water and soil conservation measures in the watershed increased the proportion of mud delivered by the Yellow River to the sea [23]. In the 1990s, the sediment flux into the sea from the Hanjiang River began to decrease sharply, and the area near the estuary changed from deposition to erosion, resulting in the coarsening of the upper part of the columnar samples (ZZY51, ZZY52, and ZZY55) near the estuary.
The frequency curve for the particle size from columnar sample ZZY04 (below 84 cm) shows a bimodal distribution. Although the peaks of the finer components are dominant, the peaks representing the coarser components are also more significant (Figure 7). However, since the 1950s (above 84 cm), the frequency curve has generally shifted toward a unimodal distribution, with peaks representing finer components (Figure 7). The frequency curve of the ZZY03 particle size below 42 cm has a similar bimodal shape to that of ZZY04 (below 84 cm) (Figure 8). The frequency curve above 42 cm generally features a unimodal distribution, and the peaks represent finer components (Figure 8). The frequency curve of the particle size of ZZY07 below 12 cm shows a bimodal distribution (Figure 9), and the frequency curve above 12 cm generally features a unimodal distribution (Figure 9, Table 3). In 2003, the depositional location was 12 cm, and 2003 was also the time at which this location changed from deposition to an erosion-deposition balance.
At the end of the last century, numerous hydropower stations and reservoirs were constructed in the upper reaches of the Hanjiang River, and these structures began to intercept a large amount of sediment that otherwise would have entered the sea. Notably, a large amount of coarse-grained sediment has been retained in the reservoirs, and the sediment that is discharged into the ocean from the reservoirs is mainly fine-grained suspended sediment. Therefore, the sources of coarse-grained sediment in the underwater delta of the Hanjiang River have been reduced, resulting in the sources being at a relatively large distance from the estuary. The far columnar samples exhibit a pattern of fining upward (ZZY03, ZZY07, ZZY54, and ZZY04). Wang et al. (2020) believed that a large amount of coarse-grained sediment remained in a reservoir after a dam was built, and the sediment that was discharged into the ocean after the reservoir was impounded was mainly fine-grained sediments, which has led to the presence of fine-grained sediments since the mid-1980s [21].
In addition, although the significant reduction in sediment flux from the Hanjiang and Rongjiang Rivers into the sea resulted in an insufficient sediment supply and erosion in the underwater delta area near the estuary, the sediments produced by erosion became a new source, compensating for the sediment flux reduction to a certain extent. The insufficient sediment supply at the far estuary end makes the vertical variation in particle size less obvious than at the near estuary end [11,24]. Thus, the particle size pattern of the columnar samples from the estuary has no significant change in the vertical direction.
The spatial response pattern of the Hanjiang underwater delta to the sharp reduction in sediment flux into the sea is not quite the same as that of the Yangtze underwater delta and the Yellow River underwater delta. The sediments flowing into the sea from the Yangtze River are mainly deposited in the underwater delta of the Yangtze River and the muddy areas along the Zhejiang and Fujian coasts [25]. The sediment from the Yangtze River entering the sea is the main source of sediment for the Yangtze underwater delta. The lack of sand caused by the interception of sediment by the Three Gorges Dam has caused a change in the erosion and deposition state of the Yangtze underwater delta. The threshold of sediment flux into the sea from the Yangtze River is 270 Mt/a. When the sediment flux into the sea drops below 270 Mt/a, the underwater delta of the Yangtze River changes from a depositional state to an erosional state [18]. The sediment eroded from the underwater delta of the Yangtze River partially makes up for the low sediment supply in the muddy areas along the coasts of Zhejiang and Fujian, so a relatively stable depositional environment is maintained. However, with the further reduction in sediment in the underwater delta of the Yangtze River, the deposition rate of the muddy zone along the Zhejiang-Fujian coast will gradually decrease and eventually suffer from erosion [11]. This shows that the sharp reduction in the sediment flux from the Yangtze River into the sea affects the deposition of the Yangtze underwater delta in the short term, causing the erosion and deposition state transition of the Yangtze underwater delta. However, the impact on the muddy areas along the coasts of Zhejiang and Fujian has hysteresis. Due to the frequency of diversions from the Yellow River [26] and the sharp reduction in sediment flux into the sea, the deposition of the current estuary underwater delta has slowed [27], and the underwater delta of the abandoned estuary has undergone erosion [28]. The sediment flux (0.84 Gt/a) from the Yellow River into the sea from 1976 to 1981 was more than twice the sediment flux threshold (~0.35 Gt/a) needed to maintain the balance of erosion and deposition, which was conducive to the rapid deposition of the Yellow River underwater delta. From 1981 to 1996, engineering-induced increases in river runoff and median suspended sediment particle size resulted in a decrease in the sediment flux threshold to 0.29 Gt/a. Since the sediment flux of the Yellow River into the sea is 0.55 Gt/a, the underwater delta is still receiving sediments at a rate of 11.9 km2/a. From 1996 to 2002, the sediment flux threshold dropped further to 0.15 Gt/a, and the delta suffered from net erosion due to the insufficient sediment supply (0.11 Gt/a). From 2002 to 2013, the adjustment of the dam led to intense erosion of the downstream channel, which resulted in the delivery of coarser sediment to the sea, effectively reducing the sediment flux threshold to 0.06 Gt/a, which was much lower than the sediment flux into the sea (~0.16 Gt/a). The underwater delta of the Yellow River entered a slight deposition stage [27]. This result shows that both the current estuary underwater delta and the abandoned estuary underwater delta of the Yellow River exhibited a timely response to the sharp decrease in sediment flux into the sea.
Compared with the underwater delta of the Yangtze River and the underwater delta of the Yellow River, the area near the estuary of the underwater delta of the Hanjiang River, such as the area where the columnar samples ZZY51, ZZY52, and ZZY55 were collected, changed from a deposition state to an erosion state due to the sharp reduction in the sediment flux into the sea. In the areas farther from the estuary, the coarse particles of the columnar sediments were reduced due to the interception of coarse-grained sediment by the reservoir, which may have resulted in a change from a deposition state to an erosion-deposition equilibrium state, such as for ZZY07. Erosion occurs in the underwater delta area near the estuary, and the sediment produced by the erosion becomes a new sediment source, which makes up for the low sediment supply in the far estuary to a certain extent, causing the sediments of the underwater delta far from the estuary (ZZY01, ZZY05, and ZZY57) to be very important. The response to the sharp decrease in sediment flux into the sea is not clear. However, compared with large underwater deltas, this study could collect only limited information from charts and columnar samples and could only preliminarily delineate the spatial range where the sharp decrease in sediment flux into and out of the sea had different effects on underwater deltas.

5. Conclusions

This paper uses a combination of chart-based analysis of erosion and sedimentation evolution and sediment sample analysis to study the effect of the Hanjiang and Rongjiang Rivers on the sedimentation pattern of the Hanjiang underwater delta. The following conclusions are drawn:
(1)
The significant reduction in sediment fluxes from the Hanjiang and Rongjiang Rivers into the sea led to the transformation of the underwater delta area in the outer channel of Shantou Port from a depositional state in 1980–1989 to an erosional state in 1989–2016, which was positively correlated with the significant reduction in the sediment fluxes from the Hanjiang and Rongjiang Rivers into the sea.
(2)
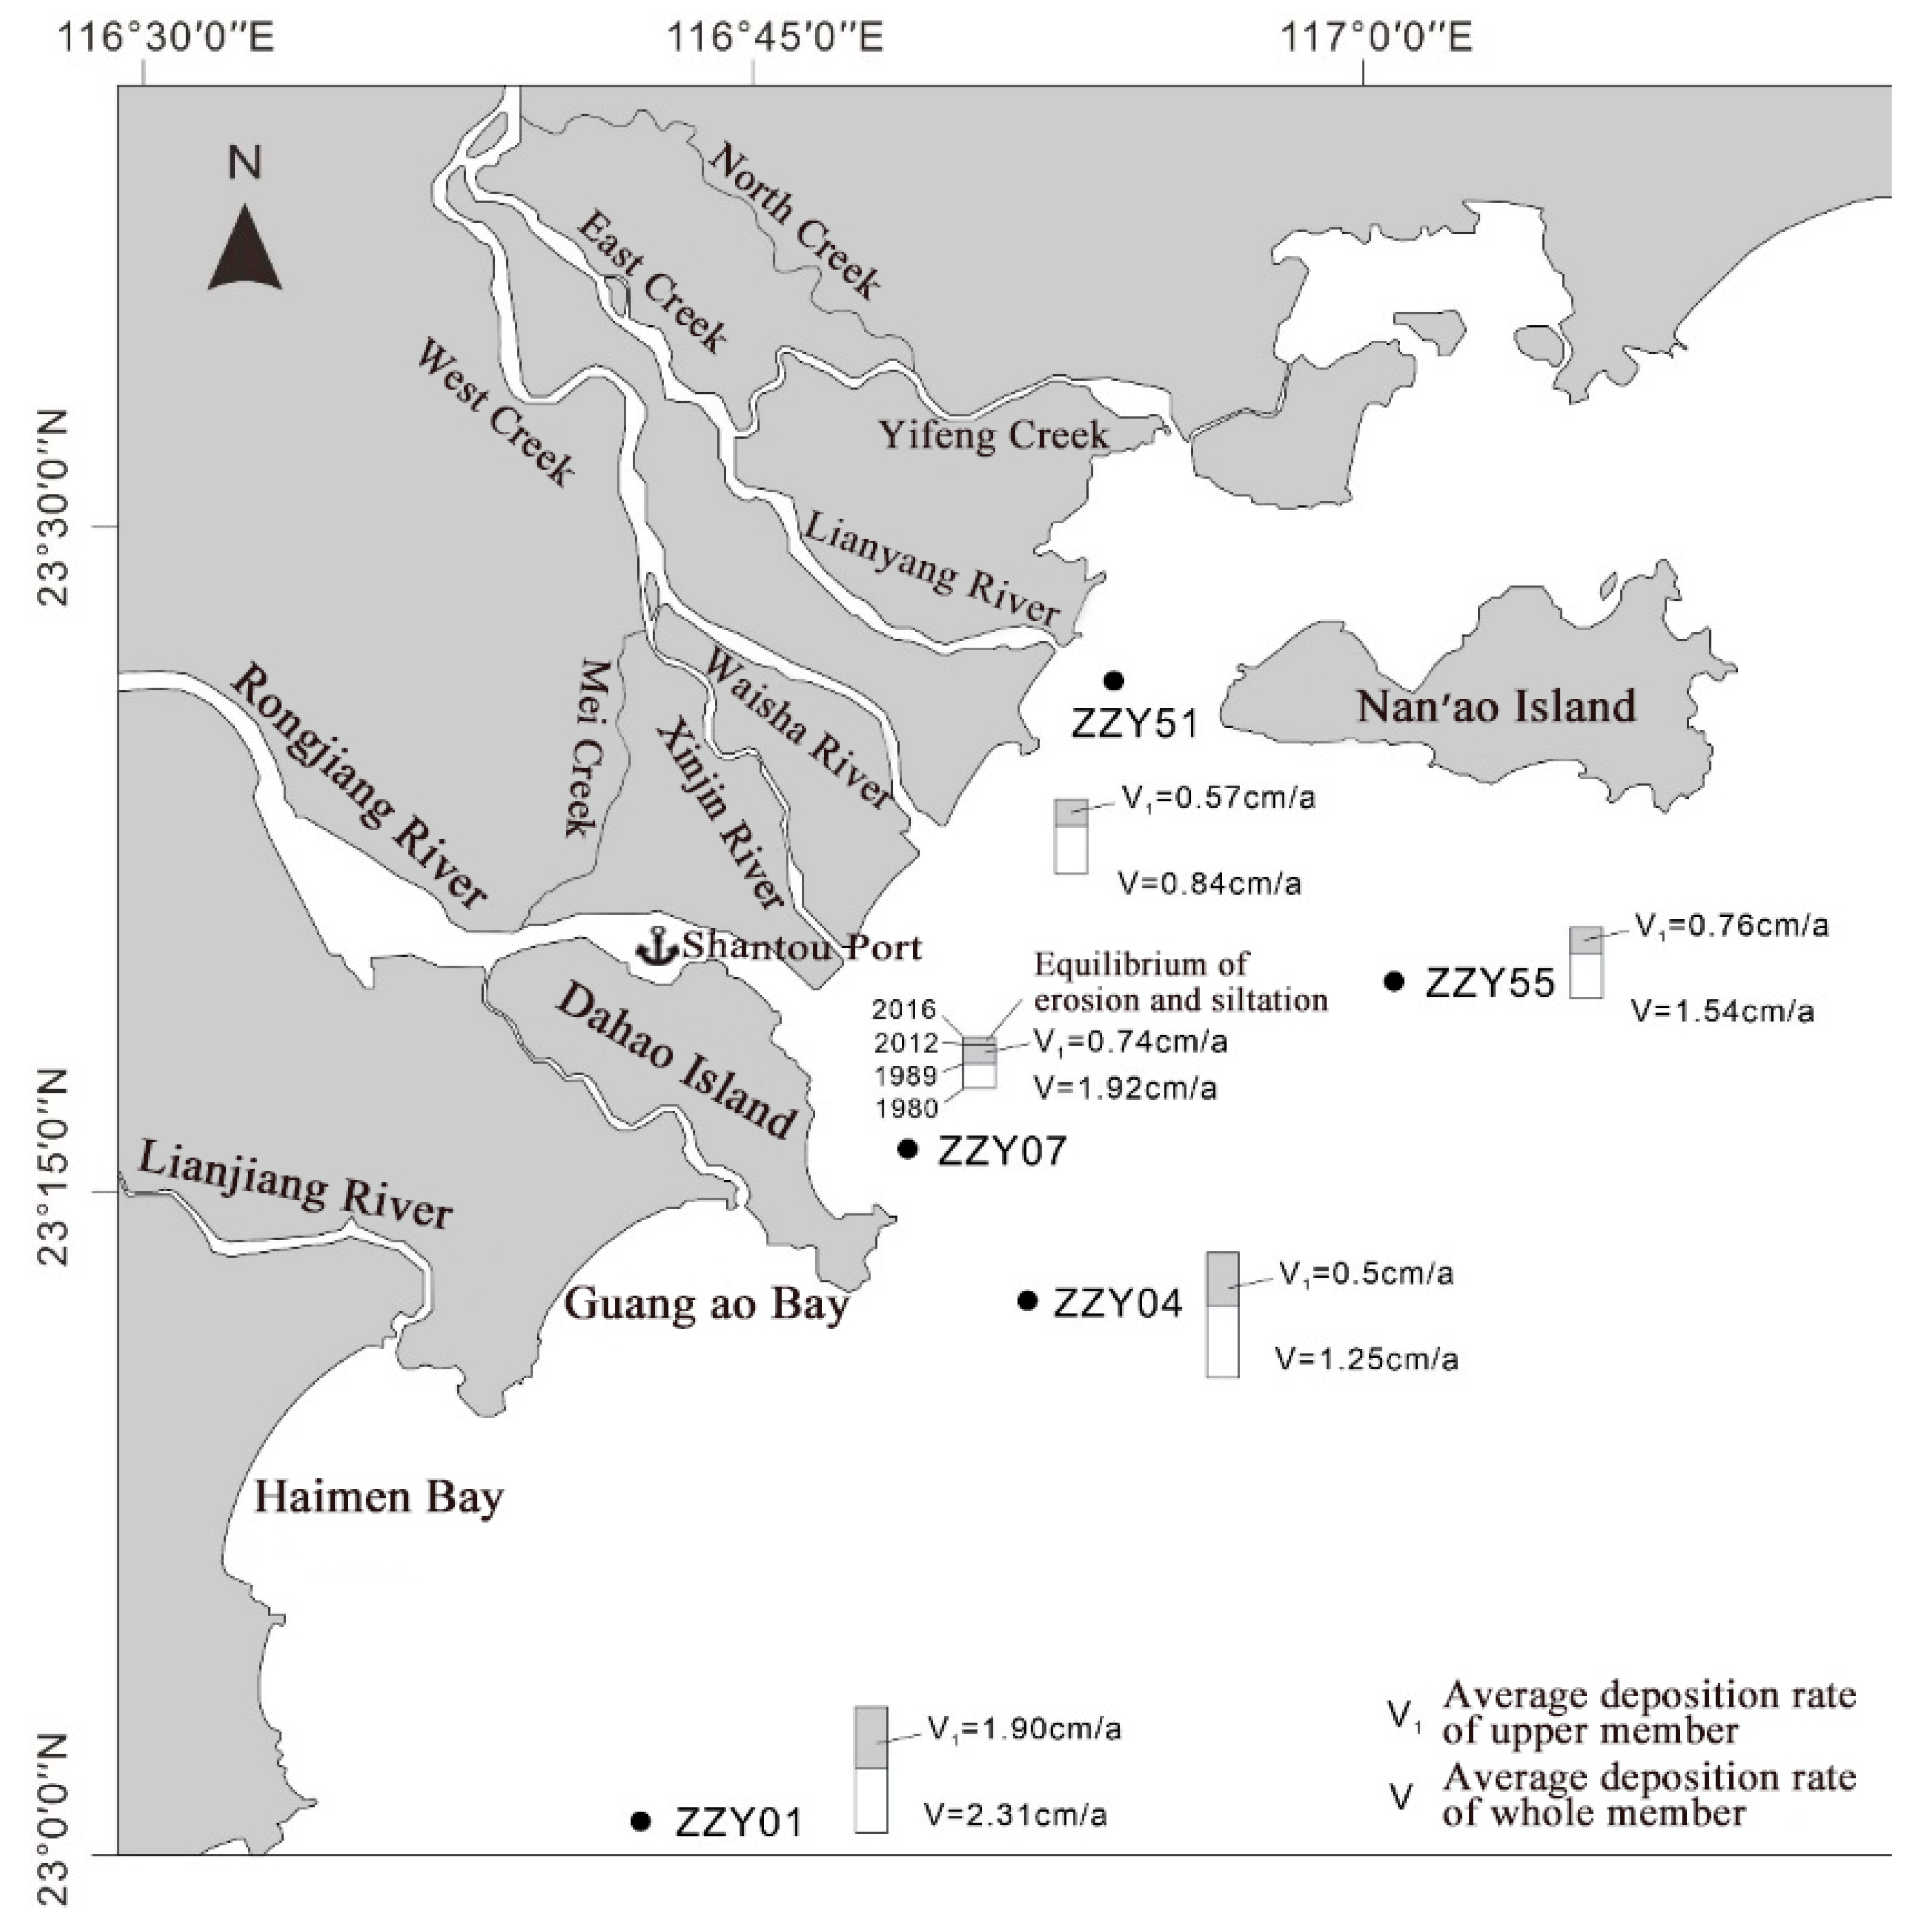
The significant reduction in the sediment flux into the sea from the Hanjiang River generally reduced the deposition rate of the underwater delta. In the area close to the estuary, the change in the deposition rate of the columnar samples (ZZY51, ZZY55, and ZZY04) is more distinct than that far from the estuary (ZZY01).
(3)
The significant reduction in the sediment flux into the sea from the Hanjiang River led to a transformation from deposition to erosion of the underwater delta area near the estuary.

Author Contributions

Conceptualization, Y.W. (Yang Wang), C.H., X.L. and J.Y.; Methodology, Y.W. (Yang Wang), Y.W. (Yufei Wang), X.W., R.W., J.Y. and Y.Z.; Software, Y.W. (Yang Wang), Y.W. (Yufei Wang), X.W., C.H., R.W., X.L. and Y.Z.; Validation, Y.W. (Yang Wang); Formal analysis, Y.W. (Yang Wang), Y.W. (Yufei Wang), X.W., C.H., R.W., X.L. and J.Y.; Investigation, Y.W. (Yang Wang) and R.W.; Resources, Y.W. (Yang Wang) and J.Y.; Data curation, Y.W. (Yang Wang), Y.W. (Yufei Wang), X.L. and Y.Z.; Writing—original draft, Y.W. (Yang Wang), Y.W. (Yufei Wang), R.W., X.L., J.Y. and Y.Z.; Writing—review & editing, Y.W. (Yang Wang), X.W., C.H., R.W., X.L. and Y.Z.; Visualization, Y.W. (Yang Wang) and J.Y.; Supervision, X.W., C.H. and R.W.; Project administration, X.W., C.H. and R.W.; Funding acquisition, C.H. All authors have read and agreed to the published version of the manuscript.

Funding

Comprehensive Geological Survey of Chaoshan Coastal Zone, grant number DD20208013; Comprehensive Survey of Natural Resources in Huizhou-Shanwei Coastal Zone, grant number DD20230415.

Acknowledgments

Chaoshan Coastal Zone, grant number DD20208013; Huizhou-Shanwei Coastal Zone, grant number DD20230415.

Conflicts of Interest

The authors declare no conflict of interest. The funders had no role in the design of the study, in the collection, analysis, or interpretation of data, in the writing of the manuscript, or in the decision to publish the results.

References

  1. Vörösmarty, C.J.; Meybeck, M.; Fekete, B.; Sharma, K.; Green, P.; Syvitski, J.P. Anthropogenic sediment retention: Major global impact from registered river impoundments. Glob. Planet. Chang. 2003, 39, 169–190. [Google Scholar] [CrossRef]
  2. Syvitski, J.P.M.; Vörösmarty, C.J.; Kettner, A.J.; Green, P. Impact of humans on the flux of terrestrial sediment to the global coastal ocean. Science 2005, 308, 376–380. [Google Scholar] [CrossRef]
  3. Walling, D.E. Human impact on land-ocean sediment transfer by the world’s rivers. Geomorphology 2006, 79, 192–216. [Google Scholar] [CrossRef]
  4. Liu, F.; Chen, S.; Dong, P.; Peng, J. Spatial and temporal variability of water discharge in the Yellow River Basin over the past 60 years. J. Geogr. Sci. 2012, 22, 1013–1033. [Google Scholar] [CrossRef]
  5. Welch, A.C.; Nicholls, R.J.; Lázár, A.N. Evolving deltas: Coevolution with engineered interventions. Elem. Sci. Anthr. 2017, 5, 49. [Google Scholar] [CrossRef] [Green Version]
  6. Jiang, C.; Chen, S.; Pan, S.; Fan, Y.; Ji, H. Geomorphic evolution of the Yellow River Delta: Quantifications of basin-scale natural and anthropogenic impacts. Catena 2018, 163, 361–377. [Google Scholar] [CrossRef]
  7. Kondolf, G.M.; Schmitt, R.J.P.; Carling, P.; Darby, S.; Arias, M.E.; Bizzi, S.; Castelletti, A.; Cochrane, T.A.; Gibson, S.; Kummu, M.; et al. Changing sediment budget of the Mekong: Cumulative threats and management strategies for a large river basin. Sci. Total Environ. 2018, 625, 114–134. [Google Scholar] [CrossRef] [Green Version]
  8. Dunn, F.E.; Darby, S.E.; Nicholls, R.J.; Cohen, S.; Zarfl, C.; Fekete, B.M. Projections of declining fluvial sediment delivery to major deltas worldwide in response to climate change and anthropogenic stress. Environ. Res. Lett. 2019, 14, 084034. [Google Scholar] [CrossRef]
  9. Nienhuis, J.H.; Ashton, A.D.; Edmonds, D.A.; Hoitink, A.J.F.; Kettner, A.J.; Rowland, J.C.; Törnqvist, T.E. Global-scale human impact on delta morphology has led to net land area gain. Nature 2020, 577, 514–518. [Google Scholar] [CrossRef]
  10. Ericson, J.P.; Vörösmarty, C.J.; Dingman, S.L.; Ward, L.G.; Meybeck, M. Effective sea-level rise and deltas: Causes of change and human dimension implications. Glob. Planet. Chang. 2006, 50, 63–82. [Google Scholar] [CrossRef]
  11. Gao, J.H.; Shi, Y.; Sheng, H.; Kettner, A.J.; Yang, Y.; Jia, J.J.; Wang, Y.P.; Li, J.; Chen, Y.; Zou, X.; et al. Rapid response of the Changjiang (Yangtze) River and East China Sea source-to-sink conveying system to human induced catchment perturbations. Mar. Geol. 2019, 414, 1–17. [Google Scholar] [CrossRef]
  12. Yang, C.X.; Zhang, Z.D.; Zhang, Q.; Dong, C.; Wan, L. Characteristics of Multi—Scale Variability of Water Discharge and Sediment Load in the Hanjiang River During 1955–2012. J. South China Norm. Univ. (Nat. Sci. Ed.) 2017, 49, 68–75. [Google Scholar]
  13. Zhao, L. Characteristic Analysis of Runoff and Sediment at Chao’an Hydrometric Station in Hanjiang River Basin. Guangdong Water Resour. Hydropower 2019, 4, 22–25. [Google Scholar]
  14. Zhang, Y.P. Analysis of sediment variation in Chao’an Station of Hanjiang River. Sci. Technol. Innov. 2016, 15, 78–80. [Google Scholar]
  15. Wang, Y.F.; Liu, X.J.; Wang, Y.; Wang, W.; Wang, H.; Yi, J. Changes in Sediment Flux from Hanjiang River into the Sea and Its Influence on Adjacent Sea Areas over the Last 60 Years. Pearl River 2022, 43, 7. [Google Scholar]
  16. Zhang, J.H.; He, Q.; Han, X. Analysis of seabed evolution in southeast Guangdong sea area. China Water Transp. 2020, 20, 146–148. [Google Scholar]
  17. Maloney, J.M.; Bentley, S.J.; Xu, K.; Obelcz, J.; Georgiou, I.Y.; Miner, M.D. Mississippi River subaqueous delta is entering a stage of retrogradation. Mar. Geol. 2018, 400, 12–23. [Google Scholar] [CrossRef]
  18. Yang, S.L.; Milliman, J.D.; Li, P.; Xu, K. 50000 dams later: Erosion of the Yangtze River and its delta. Glob. Planet. Chang. 2011, 75, 14–20. [Google Scholar] [CrossRef]
  19. Ji, H.Y. Morphological Variability of the Yellow River Delta and Its Dynamic Mechanism under the New Regime of River Delivery; East China Normal University: Shanghai, China, 2021. [Google Scholar]
  20. Yang, L.Z.; Liu, F.; Gong, W.P.; Cai, H.; Yu, F.; Pan, H. Morphological response of Lingding Bay in the Pearl River Estuary to human intervention in recent decades. Ocean. Coast. Manag. 2019, 176, 1–10. [Google Scholar] [CrossRef]
  21. Wang, A.J.; Ye, X.; Lin, Z.K.; Wang, L.; Lin, J. Response of sedimentation processes in the Minjiang River subaqueous delta to anthropogenic activities in the river basin. Estuar. Coast. Shelf Sci. 2020, 232, 106484. [Google Scholar]
  22. Yang, H.F.; Yang, S.L.; Meng, Y.; Xu, K.; Luo, X.; Wu, C.; Shi, B. Recent coarsening of sediments on the southern Yangtze subaqueous delta front: A response to river damming. Cont. Shelf Res. 2018, 155, 45–51. [Google Scholar] [CrossRef]
  23. Liu, L.; Wang, H.J.; Yang, Z.S.; Fan, Y.; Wu, X.; Hu, L.; Bi, N. Coarsening of sediments from the Huanghe (Yellow River) delta-coast and its environmental implications. Geomorphology 2022, 401, 108105. [Google Scholar] [CrossRef]
  24. Zhan, Q.; Li, M.T.; Liu, X.Q.; Chen, J.; Chen, Z. Sedimentary transition of the Yangtze subaqueous delta during the past century: Inspiration for delta response to future decline of sediment supply. Mar. Geol. 2020, 428, 106279. [Google Scholar] [CrossRef]
  25. Liu, J.P.; Xu, K.H.; Li, A.C.; Milliman, J.; Velozzi, D.; Xiao, S.; Yang, Z. Flux and fate of Yangtze River sediment delivered to the East China Sea. Geomorphology 2007, 85, 208–224. [Google Scholar] [CrossRef]
  26. Zheng, S.; Han, S.S.; Tan, G.M.; Xia, J.; Wu, B.; Wang, K.; Edmonds, D.A. Morphological adjustment of the Qingshuigou channel on the Yellow River Delta and factors controlling its avulsion. Catena 2018, 166, 44–55. [Google Scholar] [CrossRef]
  27. Wu, X.; Bi, N.S.; Xu, J.P.; Nittrouer, J.A.; Yang, Z.; Saito, Y.; Wang, H. Stepwise morphological evolution of the active Yellow River (Huanghe) delta lobe (1976–2013): Dominant roles of riverine discharge and sediment grain size. Geomorphology 2017, 292, 115–127. [Google Scholar] [CrossRef]
  28. Li, G.X.; Zhuang, K.L.; Wei, H.L. Sedimentation in the Yellow River delta. Part III. Seabed erosion and diapirism in the abandoned subaqueous delta lobe. Mar. Geol. 2000, 168, 129–144. [Google Scholar] [CrossRef]
Figure 1. Map of columnar sample sites and chart areas in the study area.
Applsci 13 08039 g001
Figure 2. Erosion and deposition situations of the Shantou port outer waterway in different periods. (Thickness of erosion and siltation (m)).
Applsci 13 08039 g002
Figure 3. Variation in sediment fluxes into the sea from the Hanjiang and Rongjiang Rivers and the average deposition rate of the channel outside Shantou Port.
Applsci 13 08039 g003
Figure 4. Variation curves of the specific activity of 210Pbex with depth in ZZY51, ZZY55, ZZY04, and ZZY01.
Applsci 13 08039 g004
Figure 5. Distribution map of sedimentation rate variation in Hanjiang underwater delta columnar samples.
Applsci 13 08039 g005
Figure 6. Vertical characteristics of the particle sizes of columnar samples from the Hanjiang underwater delta.
Applsci 13 08039 g006
Figure 7. Particle size frequency curve of the ZZY04 columnar sample (left: 84–198 cm; right: 0–78 cm).
Applsci 13 08039 g007
Figure 8. Particle size frequency curve of the ZZY03 columnar sample (left: 42–174 cm; right: 0–36 cm).
Applsci 13 08039 g008
Figure 9. Particle size frequency curve of the ZZY07 columnar sample (left: 36–198 cm; right: 0–30 cm).
Applsci 13 08039 g009
Table 1. Chart information.
Serial NumberSheet NumberYear of PublicationYear of MeasurementName of ChartScaleNumber of Water Depth PointsMeasuring Unit
115,11219841979 and 1980 1971 and 1966Shantou Port1:15,0001583Chinese People‘s Liberation Army Naval Command Navigation Guarantee Department
215,11219931989 and 1966Shantou Port1:15,0001784
315,11320132012 and 2013Shantou Port Outer Channel1:15,0001692
415,11320182016 and 2017Shantou Port Outer Channel1:15,0002349Chinese People‘s Liberation Army Naval Command Navigation Guarantee Department
Table 2. Calculated results of erosion and deposition in the Shantou Port Outer Channel in different periods.
1980–20161980–19891989–20122012–2016
Period length (a)369234
Total area (107 m2)11.1411.2211.2211.19
Sedimentation area (107 m2)5.107.405.832.04
Sedimentation volume (107 m3)3.442.183.240.79
Sedimentation thickness (m)0.680.290.550.39
Erosion area (107 m2)6.043.815.389.15
Erosion volume (107 m3)6.290.943.634.93
Erosion thickness (m)1.040.250.670.54
Net erosion volume (107 m3)−2.841.24−0.40−4.14
Net deposition thickness (m)−0.260.11−0.04−0.37
Average net erosion and deposition volume of the period (107 m3/a)−0.080.14−0.02−1.03
Average deposition rate over time (cm/a)−0.711.23−0.15−9.24
Table 3. Sediment fluxes from Hanjiang and Rongjiang into the sea and sedimentation rate in the channel outside Shantou Port during the same period.
Period1980–19891989–20122012–2016
Average annual sediment flux into the sea (10,000 t)Han Jiang843.1384.4225.7
Rongjiang51.5 (1980–1987)36.3 (2006–2012)26.9
Shantou Port Outer ChannelSilt thickness (m)0.11−0.04−0.37
Average deposition rate (cm/a)1.23−0.15−9.24
ZZY07Silt thickness (m)0.380.31−0.11
Average deposition rate (cm/a)4.221.36−2.75
Table 4. Columnar deposition rates.
ZZY51ZZY55ZZY04ZZY01ZZY07 (The Deposition Rate Comes from the Chart)
Average deposition rate of the whole section (cm/a)0.841.541.252.311.92
Average deposition rate of the upper section (cm/a)0.570.760.501.90−2.75 (2012–2016)
1.36 (1989–2012)
4.22 (2012–2016)
Depth range (cm)0–420–620–840–960–31 (2016–1989)
31–69 (1980–1989)
Deposition rate reduction (%)32.150.660.017.767.8
(1989–2012 compared to 1980–1989)
Table 5. Component content and particle size parameters of sediments in the columnar samples.
Column NumberSand Content (%)Silt Content (%)Clay Content (%)Average Particle Size Average (μm)Median Particle Size Mean (μm)Sorting FactorSkewnessKurtosis
ZZY512.8–22.655.5–72.816.8–36.825.010.92.0–3.91.7–4.32.4–23.3
ZZY520.0–1.957.5–73.025.2–42.413.07.61.9–2.41.5–3.71.6–17.3
ZZY552.9–19.060.7–72.719.0–30.222.310.91.9–2.91.7–5.12.7–33.7
ZZY0310.3–41.453.4–75.12.6–26.727.919.52.0–2.7−0.5–0.10.6–1.3
ZZY079.0–49.645.9–82.24.4–33.716.915.01.4–2.9−0.3–0.40.7–1.2
ZZY541.3–14.361.1–76.518.1–24.614.68.51.8–2.70.5–3.7−1.4–18.9
ZZY042.2–43.953.3–76.62.8–30.518.713.61.8–2.5−0.5–0.20.6–1.4
ZZY0120.3–65.230.2–73.03.0–21.237.3362.1–2.7−0.4–0.50.6–1.2
ZZY054.4–50.143.9–82.75.3–26.719.519.91.2–2.3−0.3–0.50.7–1.4
ZZY570.1–14.465.3–76.214.8–34.621.112.02.0–2.71.5–2.81.7–8.9
Table 6. Segmented particle size parameters of the columnar samples.
Column NumberGrain Size Change Boundary Position Depth (cm)Below the Boundary DepthAbove the Boundary Depth
Average Particle Size (μm)Mean Value of Median Particle Size (μm)Average Particle Size (μm)Mean Value of Median Particle Size (μm)
ZZY510–4220.710.033.212.5
ZZY520–5811.36.714.78.5
ZZY550–5419.19.926.412.3
ZZY030–4230.820.218.217.2
ZZY070–9623.520.29.59.1
ZZY540–12424.712.213.48.0
Table 7. Erosion and deposition in multiple underwater deltas at different times.
Erosion and Deposition Situation in Different StagesMississippi River
Underwater Delta
Yangtze River
Underwater Delta
Yellow River
Underwater Delta
Pearl River Lingdingyang Estuary
West Beach
Rapid deposition stage317 ± 54 Mt/a (1874–1940)6.8 cm/a
(1958–1977)
0.93 × 10⁸ m3/a
(2002–2007)
3.63 × 10⁶ m3
(1978–1985)
Decreased deposition rate145 ± 25 Mt/a (1940–1979);
87 ± 15 Mt/a (1979–2005)
3.2 cm/a (1977–2020)0.57 × 10⁸ m3/a
(2007–2015)
425.9 × 10⁶ m3 (1985–1999)
Erosion stage-−2.3 cm/a (2000–2007)−0.53 × 10⁸ m3/a
(2015–2016)
−122.11 × 10⁶ m3
(1999–2011)
Disclaimer/Publisher’s Note: The statements, opinions and data contained in all publications are solely those of the individual author(s) and contributor(s) and not of MDPI and/or the editor(s). MDPI and/or the editor(s) disclaim responsibility for any injury to people or property resulting from any ideas, methods, instructions or products referred to in the content.

