Article

Research on Prediction and Regulation of Thermal Dissatisfaction Rate Based on Personalized Differences

College of Information and Control Engineering, Xi’an University of Architecture and Technology, Xi’an 710055, China
*
Author to whom correspondence should be addressed.
Appl. Sci. 2023, 13(13), 7978; https://doi.org/10.3390/app13137978
Submission received: 26 April 2023 / Revised: 20 June 2023 / Accepted: 28 June 2023 / Published: 7 July 2023

Abstract

:
Thermal discomfort body language has been shown to be a psychological representation of personnel’s particular thermal comfort. Individual thermal comfort differences are ignored in public building settings with random personnel flow. To solve this issue, we suggested a Bayesian group thermal dissatisfaction rate prediction model based on thermal discomfort body language expression and subsequently implemented intelligent indoor temperature and humidity control. The PMV-PPD model was utilized to represent the group’s overall thermal comfort and to create a prior distribution of thermal dissatisfaction rate. To acquire the dynamic distribution of temperature discomfort body language, data on thermal discomfort body language expression were collected in a real-world office setting experiment. Based on Bayesian theory, we used personalized thermal discomfort body language expressions to modify the group’s universal thermal comfort and realized the assessment of the thermal dissatisfaction rate by combining commonality and personalization. Finally, a deep reinforcement learning system was employed to achieve intelligent indoor temperature and humidity control. The results show that when commonality and personalized thermal comfort differences are combined, real-time prediction of thermal dissatisfaction rate has high prediction accuracy and good model performance, and the prediction model provides a reference basis for reasonable indoor temperature and humidity settings.

1. Introduction

People now have higher expectations for the level of comfort in their living spaces due to the rapid economic development and improvement in material living standards [1]. Due to the numerous individual variances present, determining the group’s thermal comfort in public building areas with random human movement can be difficult [2,3,4]. The thermal dissatisfaction rate has emerged as a research hotspot for comfort and energy conservation as a key indicator to assess the group’s thermal comfort. The requirements for human comfort and building energy conservation can be efficiently satisfied by using the thermal dissatisfaction rate in the intelligent setting of an inside thermal environment [5].
In accordance with ASHRAE [6], an indoor environment that provides thermal comfort to its occupants makes at least 80% of its occupants feel comfortable. The PMV-PPD model developed by Professor P.O. Fanger [7] is currently widely used internationally to assess human thermal comfort. It was based on the heat balance theory and calculated the predicted mean vote (PMV) and predicted percentage of dissatisfaction (PPD) by taking six factors into account including indoor air temperature, mean radiation temperature, air flowrate, relative humidity, metabolic rate, and thermal resistance of clothing. The PMV measures the average thermal sensation of the population to the thermal environment, and the PPD reflects the percentage of people who feel too cold or too hot. On the other hand, the PMV-PPD model cannot satisfy individualized needs as it simply represents the population’s average level of thermal comfort.
Some researchers have developed thermal comfort prediction models utilizing machine learning techniques in order to increase the precision of thermal discomfort prediction by taking into account individualized thermal comfort variances. Using Markov chain Monte Carlo methods for parameter estimation and model validation, Liu Yongxin [8] developed a prediction model of the thermal environment dissatisfaction rate based on the Bayesian theory, taking into account individual variances in a human thermal sense. The results showed that the model could better reflect the actual thermal comfort of occupants but failed to fully consider the inter and intra-individual thermal sensation. In order to predict individualized thermal comfort while taking into account inter- and intra-individual thermal sensation, J. Guenther et al. [9] used the Gaussian process regression (GPR) algorithm. To reduce the risk of overfitting and increase the efficiency and accuracy of prediction, they chose constrained LASSO regression as a feature selection method. However, because the impact of weather forecast data was not taken into account, the system may not provide timely and effective temperature management and comfort enhancement methods. In order to effectively deal with complex nonlinear relationships, M. Sulzer et al. [10] combined weather forecast data with indoor sensor data and used artificial neural networks to adaptively learn and adjust the model. The research only used artificial neural networks as a machine learning algorithm and did not compare it to other algorithms. Four machine learning algorithms—artificial neural network, random forest, support vector machine, and linear discriminant analysis—were compared by Pantavou Katerina et al. [11] and found to have high accuracy and reliability in predicting thermal comfort while taking into account all meteorological data and environmental factors. However, all of those mentioned machine learning techniques use offline collections of subject parameters to develop thermal comfort prediction models for certain situations, which are then used for the prediction of a given person’s thermal comfort in a particular environment [12].
Real-time online human physiological data collection minimizes the restrictions of particular areas and populations and provides a new way to predict thermal comfort [13]. B. Salehi [14] achieved thermal comfort prediction by collecting human skin temperature, which was substantially more accurate compared to the traditional PMV model. Wu et al. [15] established a prediction model using a classification tree to realize the prediction of individual thermal comfort, further analyzed the influence of physiological parameters and thermal history on individual thermal comfort and verified the accuracy and reliability of the model through experiments. J. Ngarambe et al. [16] used environmental monitoring devices to obtain indoor environmental parameters and wearable devices such as wristbands to measure skin temperature, heart rate, and other physiological parameters to predict the user’s thermal comfort. F. Salamone et al. [17] measured human skin temperature and heart rate with a wristband device and combined them with environmental parameters for thermal comfort prediction.
With the development of computer vision technology, the non-contact physiological parameter detection method has been widely used. An innovative infrared imaging method has been put forward by A. Ghahramani et al. [18] to measure skin temperature and consequently analyze an individual’s level of thermal comfort. D. Li et al. [19] proposed a novel non-invasive infrared thermography framework to collect skin temperatures from different parts of the body as a way to estimate the occupant’s thermal comfort level. S. H. Oh et al. [20] used non-contact sensors to detect heart rate to predict people’s thermal comfort. N.S.M. Azizi et al. [21] combined sensors and thermal image recognition techniques to obtain human physiological parameters to predict human thermal comfort. However, thermal comfort is a subjective feeling of the human body and the method of physiological parameter detection ignores the influence of human psychological factors on thermal comfort generation.
As a psychological representation of individual thermal comfort, thermal discomfort body language offers new research directions and opportunities for individualized thermal comfort measurement and modulation [22,23]. Body language expressions related to thermal comfort were carefully observed by J. Kim et al. [24], who found that thermal discomfort body language had a high degree of consistency in assessing individual thermal feelings. By using a Kinect camera to record postures associated with thermal discomfort, A. Meier et al. [25] developed a “thermal discomfort posture library” that could be used to measure different thermal discomfort levels. Yang Bin et al. [26] confirmed the feasibility of using human posture to assess thermal comfort and proposed an algorithm for the identification of 12 postures related to thermal comfort to achieve real-time contactless thermal comfort assessment. Thermal comfort for occupants should ideally be maintained adaptively by adjusting the temperature in response to occupant actions. Many studies have demonstrated that PMV can detect and maintain thermal comfort levels. Another advantage is that it can deliver better energy savings than traditional control systems [27,28].
Although body language can express psychological differences in thermal comfort, given the uncertainty of body language, a separate analysis of the group’s thermal comfort level will make it difficult to effectively take into account the commonality of thermal comfort characteristics. Therefore, it would be more effective to combine generally accepted indicators of group thermal comfort with individualized measures of thermal discomfort body language.
To solve the above problems, this study proposed a prediction model of the thermal dissatisfaction rate based on the expression of thermal discomfort body language and further realized the online regulation of room temperature. Based on the PMV-PPD model to characterize universal thermal comfort, combined with individual body language expression, real-time correction of group universality improves the compatibility of prediction results with the actual thermal environment and effectively assesses the rate of human thermal dissatisfaction to achieve intelligent setting of indoor temperature and humidity. This study calculated the prior distribution of thermal dissatisfaction rate by collecting indoor environmental parameters and human body parameters using the PMV-PPD model. We collected personalized thermal discomfort body language expressions online to calculate the posterior distribution of the thermal dissatisfaction rate. Furthermore, the Bayesian theory was used to derive the predicted value of the thermal dissatisfaction rate. In addition, this study also combined the advantages of online learning by reinforcement learning to achieve intelligent settings of indoor temperature and humidity. Finally, the feasibility of the proposed method was demonstrated by analyzing the effectiveness of the proposed method in the thermal comfort prediction and room temperature setting.

2. Methods

Based on the thermal discomfort body language expression, the implementation process of the Bayesian group thermal dissatisfaction rate prediction and room temperature online regulation model was shown in Figure 1.

2.1. Thermal Dissatisfaction Rate Prediction

2.1.1. Bayesian Theory

The Bayesian theory was a statistical framework for updating probabilities based on new data or evidence. It involved using prior knowledge represented as a prior distribution and likelihood functions to calculate posterior distributions, which were updated probabilities based on observed data. Bayesian methods were widely used in various fields, including machine learning, artificial intelligence, and data analysis. They provided a flexible and intuitive approach that could incorporate uncertainty and complexity into statistical modeling and decision-making. Moreover, Bayesian models could be updated iteratively as new information becomes available, enabling continuous learning and improvement. In this paper, θ denotes a possible event and 𝜋(θ) means the probability of event θ occurring. If an observation experiment was conducted for the potential event θ, the sample information reflected the magnitude of the likelihood of outcome x. It used the density function f(x|θ) to represent its probability magnitude, combining the prior and sample information; h(θ|x) represents the probability of the event θ under the occurrence of outcome x probability of occurrence, characterizing the quantitative assessment of the likelihood of event θ occurrence in combination with the sample data. The Bayesian formulation established a method for making a new evaluation of the prior distribution based on actual research data, as shown in Equation (1).
h ( θ ) = f ( x | θ ) π ( θ ) θ f ( x | θ ) π ( θ ) f ( x ) d θ

2.1.2. Prediction Model

In analyzing the real-time dissatisfaction rate of thermal environment groups, the prior distribution indicated the distribution of dissatisfaction rate corresponding to a particular PMV value. Although the PMV-PPD model could hardly reflect the influence of individual variability on human thermal comfort, the model could characterize the average indoor multi-user thermal comfort and thermal dissatisfaction rate. Therefore, the PMV-PPD model was used to describe the prior information on thermal comfort and calculated the average group thermal comfort and thermal. The objective quantity of dissatisfaction rate was calculated. Based on the central limit theorem of probability theory, a Gaussian distribution was used to characterize the prior information on the thermal dissatisfaction rate, as shown in Equation (2).
π ( θ ) = 1 2 π σ e ( θ P P D ) 2 2 σ 2 ,
where θ denotes the thermal dissatisfaction rate, θ ∈ [0, 1]; σ denotes the variance of the prior distribution of the thermal dissatisfaction rate. According to the PMV thermal comfort index, the PPD is the group average thermal dissatisfaction rate calculated, as shown in Equation (3).
PPD = 1 − 0.95 × exp(−0.03353 × PMV4 − 0.2179 × PMV2)
Multi-user thermal discomfort body language expressions were independent of each other. The binomial distribution could characterize the probability of thermal discomfort body language occurrence in n independent Bernoulli experiments. Therefore, the binomial distribution was selected to describe the distribution of thermal discomfort body language in the group in this paper. At a particular moment, assuming that the number of people in the room is n and the number of people expressing thermal discomfort body language is x, the distribution of the number of people with thermal discomfort body language in the field research is shown in Equation (4).
f ( x | θ ) = C n x θ x ( 1 θ ) n x
Based on information on thermal discomfort body language, the posterior distribution of the thermal dissatisfaction rate was obtained by synthesizing prior knowledge to express the prediction results with individualized differences. Based on the Bayesian prediction theory, the posterior distribution of the thermal dissatisfaction rate is shown in Equation (5).
h ( θ | x ) = π ( θ ) f ( x | θ ) 0 1 π ( θ ) f ( x | θ ) d θ ,
where h(θ|x) denotes the posterior distribution of the thermal dissatisfaction rate, combining group thermal comfort characteristics and individualized thermal comfort differences.
The above formula combines the collected environmental parameters and human physiological parameters to determine the objective amount of thermal dissatisfaction rate. It monitors people’s subjective thermal comfort feelings towards the environment using on-site research on thermal discomfort body language, etc. According to the posterior distribution of the thermal dissatisfaction rate, the predicted value of the thermal dissatisfaction rate was calculated by the Bayesian theoretical point estimation method. The expected value of the posterior distribution was used as the predicted result considering the actual thermal environment so that the group universal thermal dissatisfaction rate can be corrected in real-time to achieve the timely update of personnel thermal dissatisfaction status, as shown in Equation (6).
B P D = 0 1 θ h ( θ | x ) d θ .

2.2. Setting of Indoor Temperature and Humidity

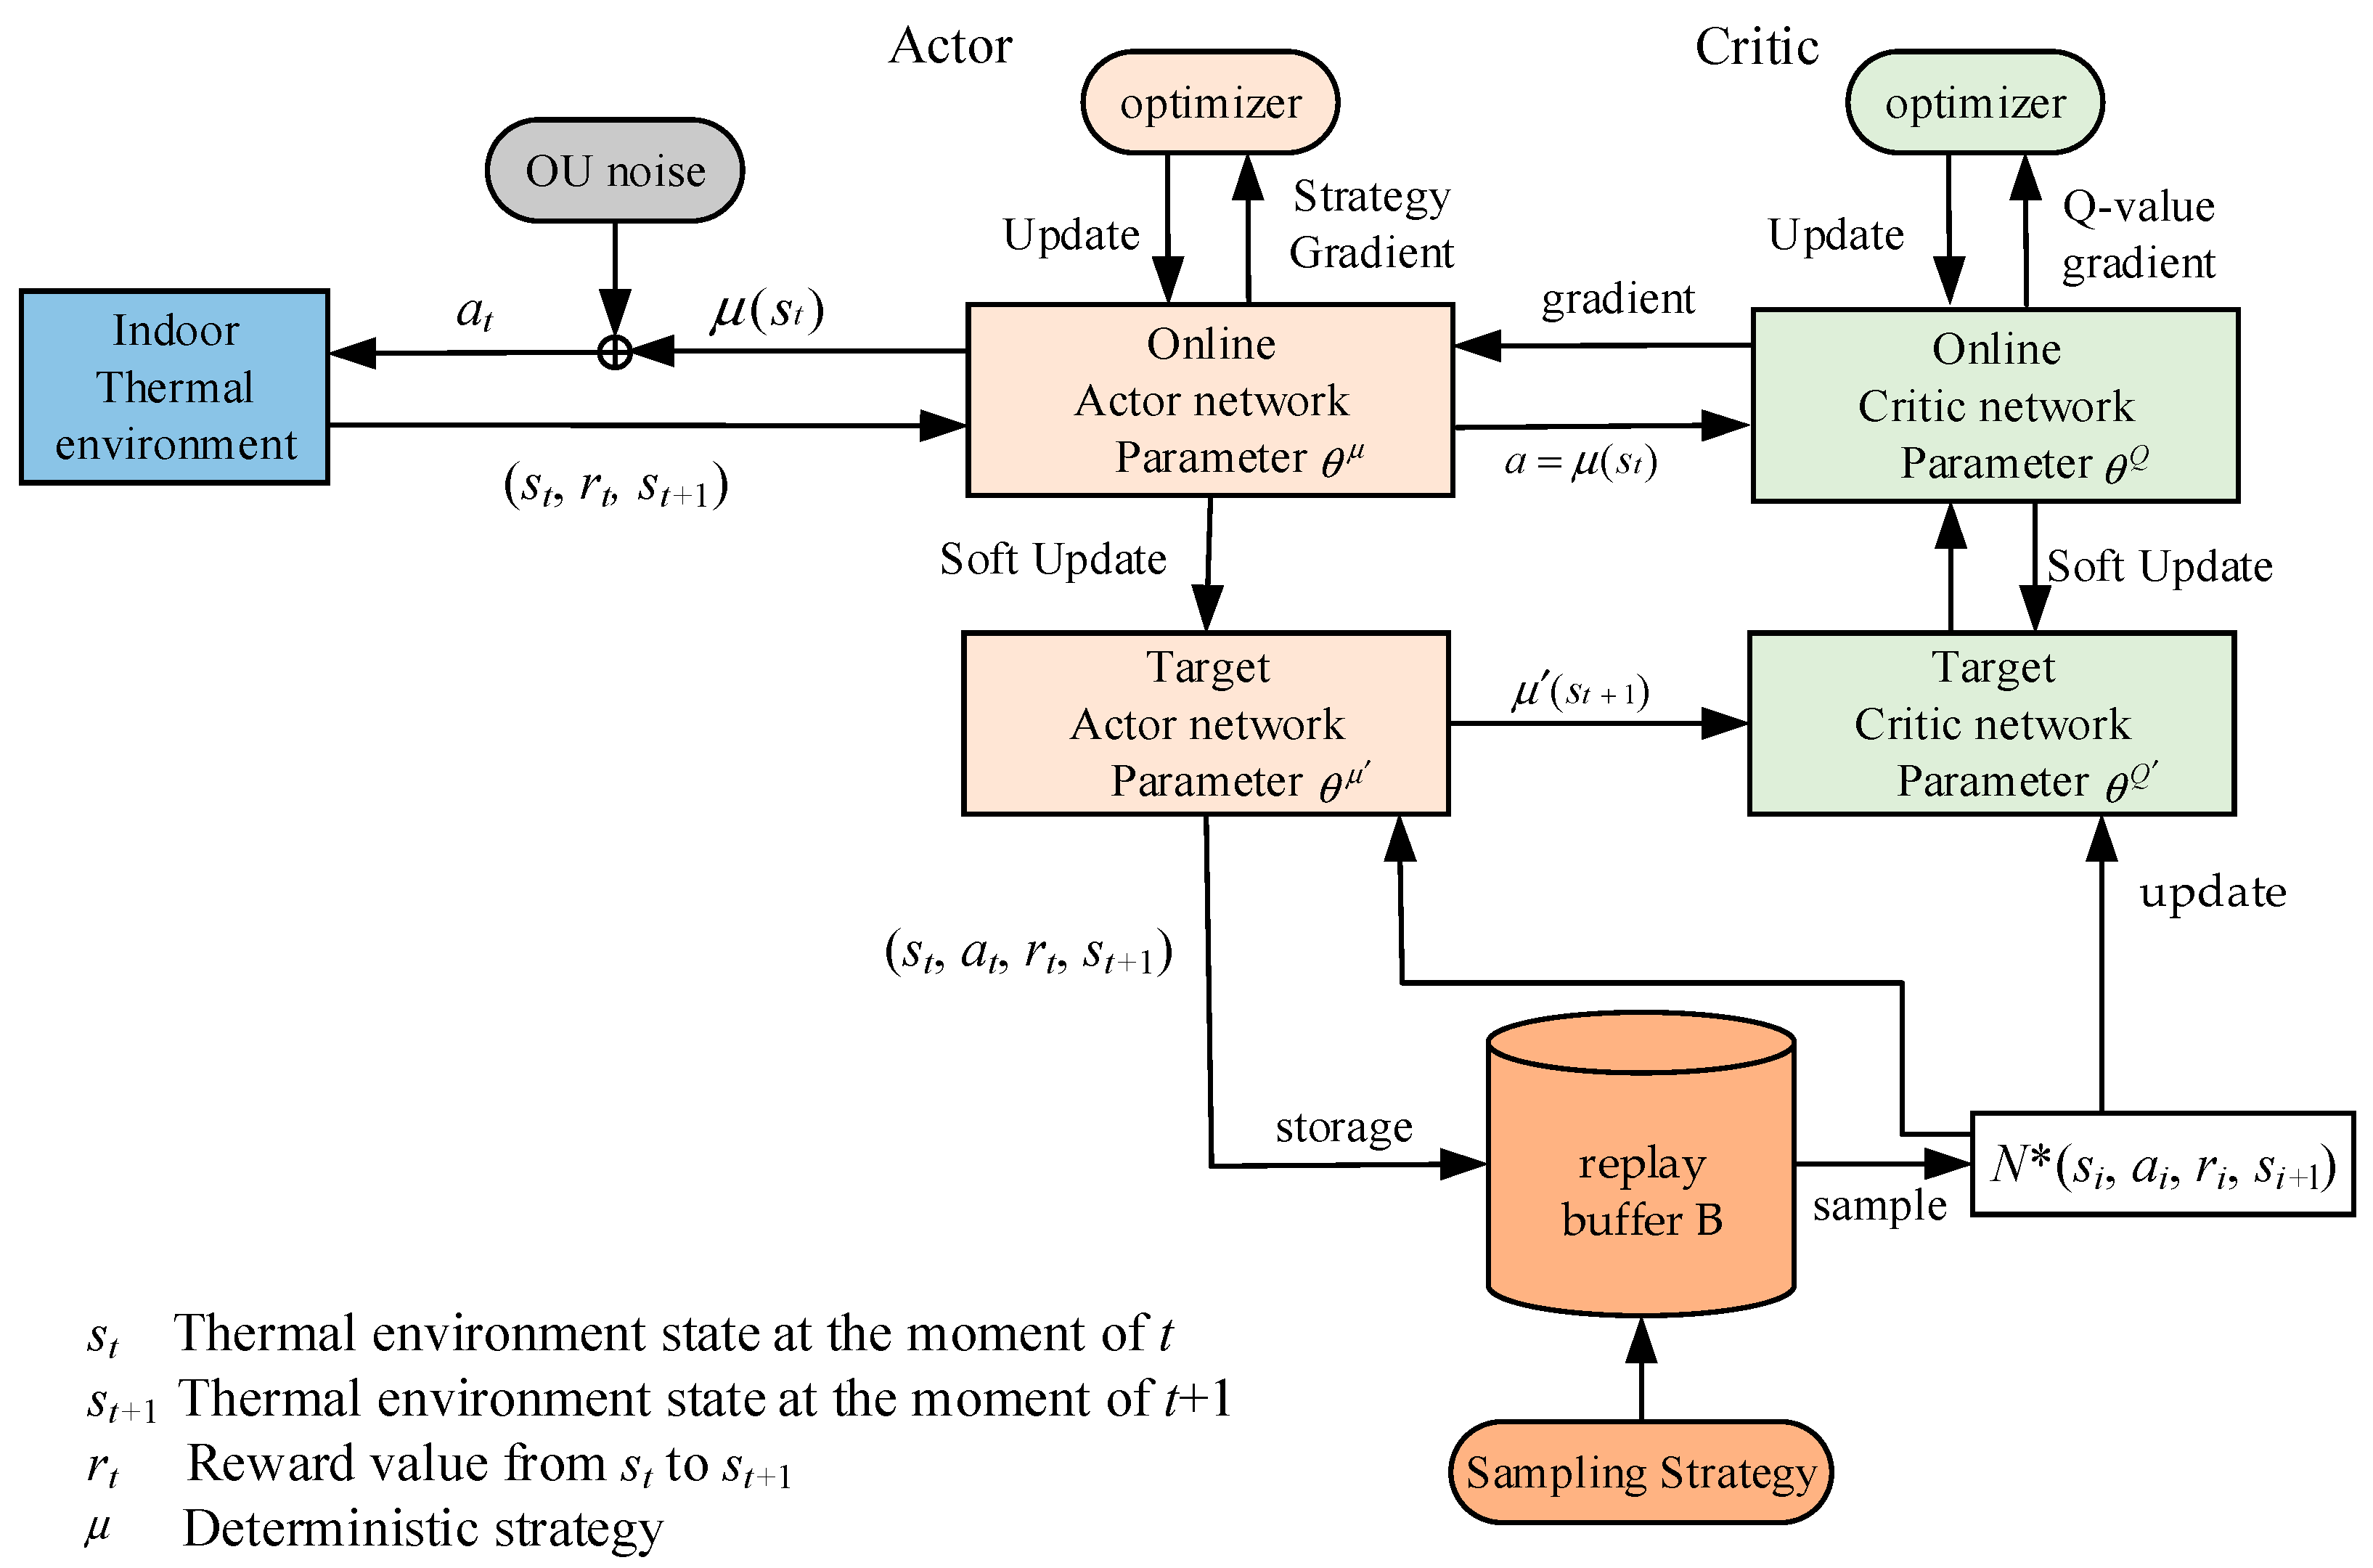
The real-time predicted thermal dissatisfaction rate values were applied to the online learning of room temperature and humidity to obtain reasonable setting values for indoor environmental parameters. The DDPG algorithm was a deep reinforcement learning algorithm based on the Actor-Critic structure, using a convolutional neural network approximation to represent the policy function and the value Q function, corresponding to the Actor-network and the Critic-network, respectively [29]. In the intelligent setting model based on the DDPG algorithm [30], the controller adopted a deterministic strategy to meet the comfort and energy-saving requirements of the room occupants based on the current environmental state information, and the temperature and humidity setting value for the next moment was related to the current occupant thermal dissatisfaction rate and the adopted temperature and humidity setting value. The predicted thermal dissatisfaction rate value and the environmental state were used as inputs to the DDPG controller to output the indoor set values and achieve online regulation of indoor temperature and humidity. The controller learned to obtain the optimal indoor temperature and humidity settings to change the thermal environment state, which is shown in Figure 2.
Based on the DDPG algorithm, an online learning model for indoor temperature and humidity was developed and the system state, action, and reward functions are as follows:
(1)
State: A reasonable indoor temperature and humidity setting value can reduce system energy consumption while ensuring human thermal comfort. The system state was the relevant parameters affecting thermal comfort and energy-saving including indoor temperature, relative humidity, airflow rate, clothing thermal resistance, and human metabolic rate. Individual variability made some physical quantities more difficult to measure such as human metabolic rate and clothing thermal resistance, which could only be obtained by approximate values. Due to the small range of airflow rate variation in the thermal environment of the closed building and other reasons, the more difficult-to-measure parameters were fixed as the average value in the current thermal environment, and the state space at moment t is defined as shown in Equation (7).
S t = [ T t , R H t , T m r t , B P D t ] ,
where Tt, RHt, and Tmrt correspond to the indoor temperature, relative humidity, and mean radiant temperature of time series t, respectively, and BPDt is the predicted value of thermal dissatisfaction rate, and t is the time series, t = 1, 2, ….
(2)
Action: The thermal environment state was changed by adjusting the room temperature and humidity settings. When the environment state is st, the room temperature and humidity settings are used as action parameters, and when the environment state is st+1, the action at+1 is executed. All actions are selected in the action space, and the action space at time t is shown in Equation (8).
A t = [ T s e t _ t , H s e t _ t ] ,
where At is the action of the Markov decision process at moment t, Tset_t, and Hset_t are the set values of indoor air temperature and relative humidity after the controller action, and the control action is determined by the control strategy μ, as shown in Equation (9).
A t = μ ( S t ) .
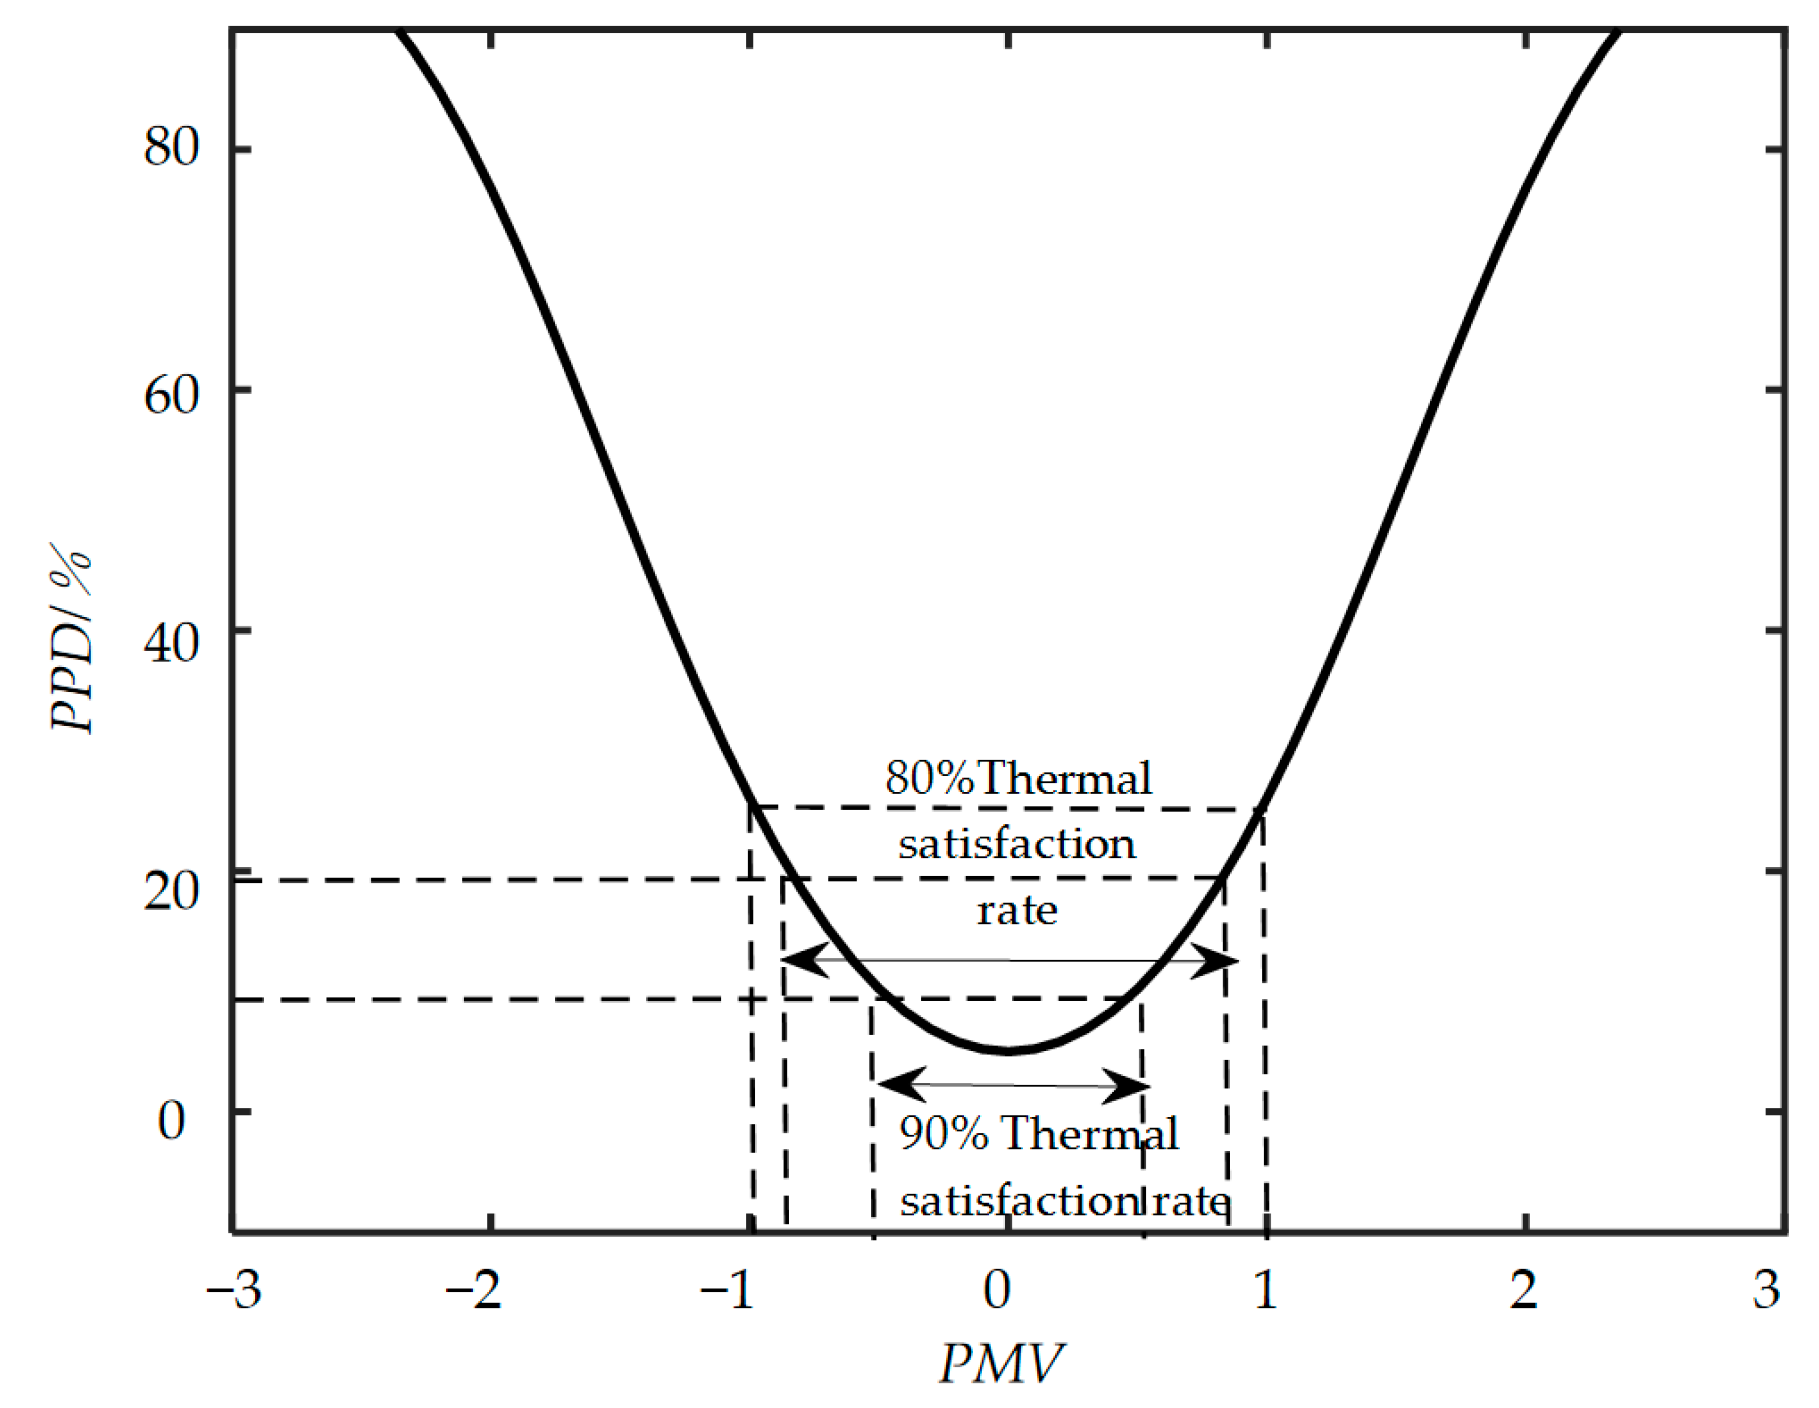
Reward: In practical scenarios, thermal comfort and energy savings conflict with each other. Setting a reward function to balance the conflict between them was the core of online regulation of air conditioning systems. Designing a suitable reward function is beneficial to achieve the control effect of comfort and energy-saving; therefore, the integrated reward is set as the sum of energy consumption and thermal comfort reward, the comforting reward was set by combining PMV-BPD and PMV-PPD models, and the PMV-PPD relationship is shown in Figure 3.
The ASHRAE Standard 55-2020 [6] sets the human comfort range to −0.5 < PMV < 0.5, but there is still a 20% thermal dissatisfaction rate due to the difficulty of achieving a 90% thermal satisfaction rate in actual studies so that the thermal comfort value for the user is between [−1, +1] as much as possible. Design thermal comfort reward for the group thermal dissatisfaction rate brings the reward value, for the comforting reward, as far as possible to make the indoor group thermal dissatisfaction rate value close to the thermal comfort for [−1, +1] corresponding to the thermal dissatisfaction rate value of 26%, and the closer the group thermal dissatisfaction rate is to 26%, the greater the reward value, otherwise the system will get the penalty value and thermal comfort reward as shown in Equation (10).
R c o m f o r t = B P D t , B P D t > 26 % 26 % B P D t , B P D t < 26 % ,
where Rcomfort is the reward value of the environmental state for St at moment t. In the indoor thermal environment regulation model of comfort and energy-saving, the default comfort and energy-saving are equally important.
The energy-saving effect reward referred to the reward brought by the room temperature setting value. To make the output value of the deep deterministic strategy gradient learning system more reasonable and reliable and reduce the number of controller learning, the rule of room temperature setting value change was added, when BPDt > 26%, it indicated that the user feels colder or hotter in the current indoor thermal environment, and the indoor temperature and humidity should be adjusted reasonably at this time. In summer conditions, the higher the room temperature setting value and the smaller the cooling load within the indoor comfort zone, the lower the energy consumption of the air conditioning system, and in winter conditions, the lower the room temperature setting value and the smaller the heating load within the indoor comfort zone, the lower the energy consumption of the air conditioning system. Therefore, to make the adjusted room temperature setting value as close as possible to the current moment room temperature, the greater the bonus value obtained by the system, the energy saving bonus as shown in Equation (11).
R energy   = { 1 | T set   T r | , | T set   T r | 1 | T set   T r | , | T set   T r | > 1 .
Based on the above analysis, it is determined that the total reward of the DDPG-based indoor thermal environment regulation method is the sum of the comfort reward and the energy saving reward, and the design comfort and energy saving are equally important in this study, and the calculation formula is shown in Equation (12).
R s u m = R c o m f o r t + R e n e r g y .
(3)
Cost minimization: The goal of indoor thermal environment regulation is to balance the relationship between thermal comfort and energy consumption, get the maximum reward value in return, and obtain the optimal setting value of indoor temperature and humidity. The expression is shown in Equation (13).
m a x μ t = 0 γ t R t + t ( S t + t , A t + t ) .

3. Experiments and Analysis of Results

3.1. Experiment Conditions and Procedure

The overall size of the laboratory was 10 m × 9 m, and the indoor office could accommodate 39 people simultaneously. The personnel activity space was divided into two cabinet air conditioning units with model KFR-72LW/DY-PA400(D2)A, a cooling capacity of 7290 W, and rated power of 2190 W installed. The experimental environment is shown in Figure 4.
To better meet the specific requirements of thermal comfort, we took a series of measures in the experimental design to avoid unnecessary influencing factors. Among them, we paid special attention to the individual differences of the subjects including age, height, body size, gender, and living habits. Considering those factors may produce errors in the prediction results, we selected 16 graduate students from Xi’an University of Architecture and Technology as our experimental subjects, which can further enhance the representativeness of the experimental data. These postgraduates had lived in Xi’an for more than one year, their lifestyle patterns were similar, and their body mass indexes ranged from 17.2 to 26.3, within the normal range of the Chinese reference standard. The subjects’ basic information is shown in Table 1. Through these parameters, we can more accurately assess thermal comfort and improve the reliability and validity of the experimental data.
The experimental data were collected on 10 November 2022, and 11 November 2022. The subjects’ clothing was long-sleeved and long pants. The sensitivity of all experimental apparatus was checked and calibrated before the experiment to achieve accurate measurements of indoor environmental parameters. Measurement points were based on the requirements of the Evaluation Standard for Indoor Thermal and Humid Environment in Civil Building [31], and the temperature and humidity sensors were placed at 1 m from the ground to prevent large errors between the parameters of the subject’s environment and those obtained from the measurements. The details of the experimental devices are shown in Table 2.
Each experiment started at 9:00, ended at 16:30, and lasted six and a half hours. During the whole experiment, the subjects were kept in daily working and studying conditions in the room. The air conditioning temperature was adjusted at intervals of 1 °C, and the adjustment range was 16~30 °C. After each adjustment of the air conditioning temperature, the indoor current air temperature and humidity were recorded at a fixed position with a temperature and humidity recorder. The air conditioning temperature was adjusted once in a cycle of 25 min. Each process was divided into three phases: personnel adaptation, observation of personnel thermal discomfort body language expression, and the thermal comfort feedback collection. The experimental procedure is shown in Figure 5.
Personnel adaptation: the initial indoor air conditioning temperature was set at 16 °C, and the subjects first underwent 5 min of environmental adaptation.
Observation of thermal discomfort body language expression: Due to inter-individual differences, existing studies provide small datasets of thermal discomfort body language, which cannot predict thermal comfort and thermal dissatisfaction rate comprehensively and accurately. Before the experiment, participants were informed that they could express cold discomfort, such as stamping feet, narrowing shoulders, crossing arms, blowing into hands, putting on a coat, and rubbing hands, as well as a list of hot discomfort body language including shaking clothing, scratching head, fanning with an object, taking off a coat, wiping sweat, or rolling up sleeves. Participants were also given the option not to perform any of these actions. A general camera was used to automatically capture subjects’ thermal discomfort body language in office scenes. By collecting these data, we can better understand people’s thermal discomfort body language expression performance under different temperature conditions. This provided a reliable theoretical basis for thermal environment assessment and regulation.
Thermal comfort vote: During the experiment, the thermal comfort vote was collected from subjects at 25 min intervals, and the questionnaire included subjects’ personal information and thermal comfort vote, personal information including subjects’ name, gender, age, height, weight, body mass index, and clothing. The thermal comfort vote is shown in Table 3. It was characterized by seven levels of thermal sensation index, which was one of the most commonly used evaluation indicators, and the room temperature was kept constant when users voted. Each vote was not affected by the last temperature. In the experiment, the thermal comfort vote was used to calculate the actual prediction of dissatisfaction (APD).

3.1.1. Data Analysis

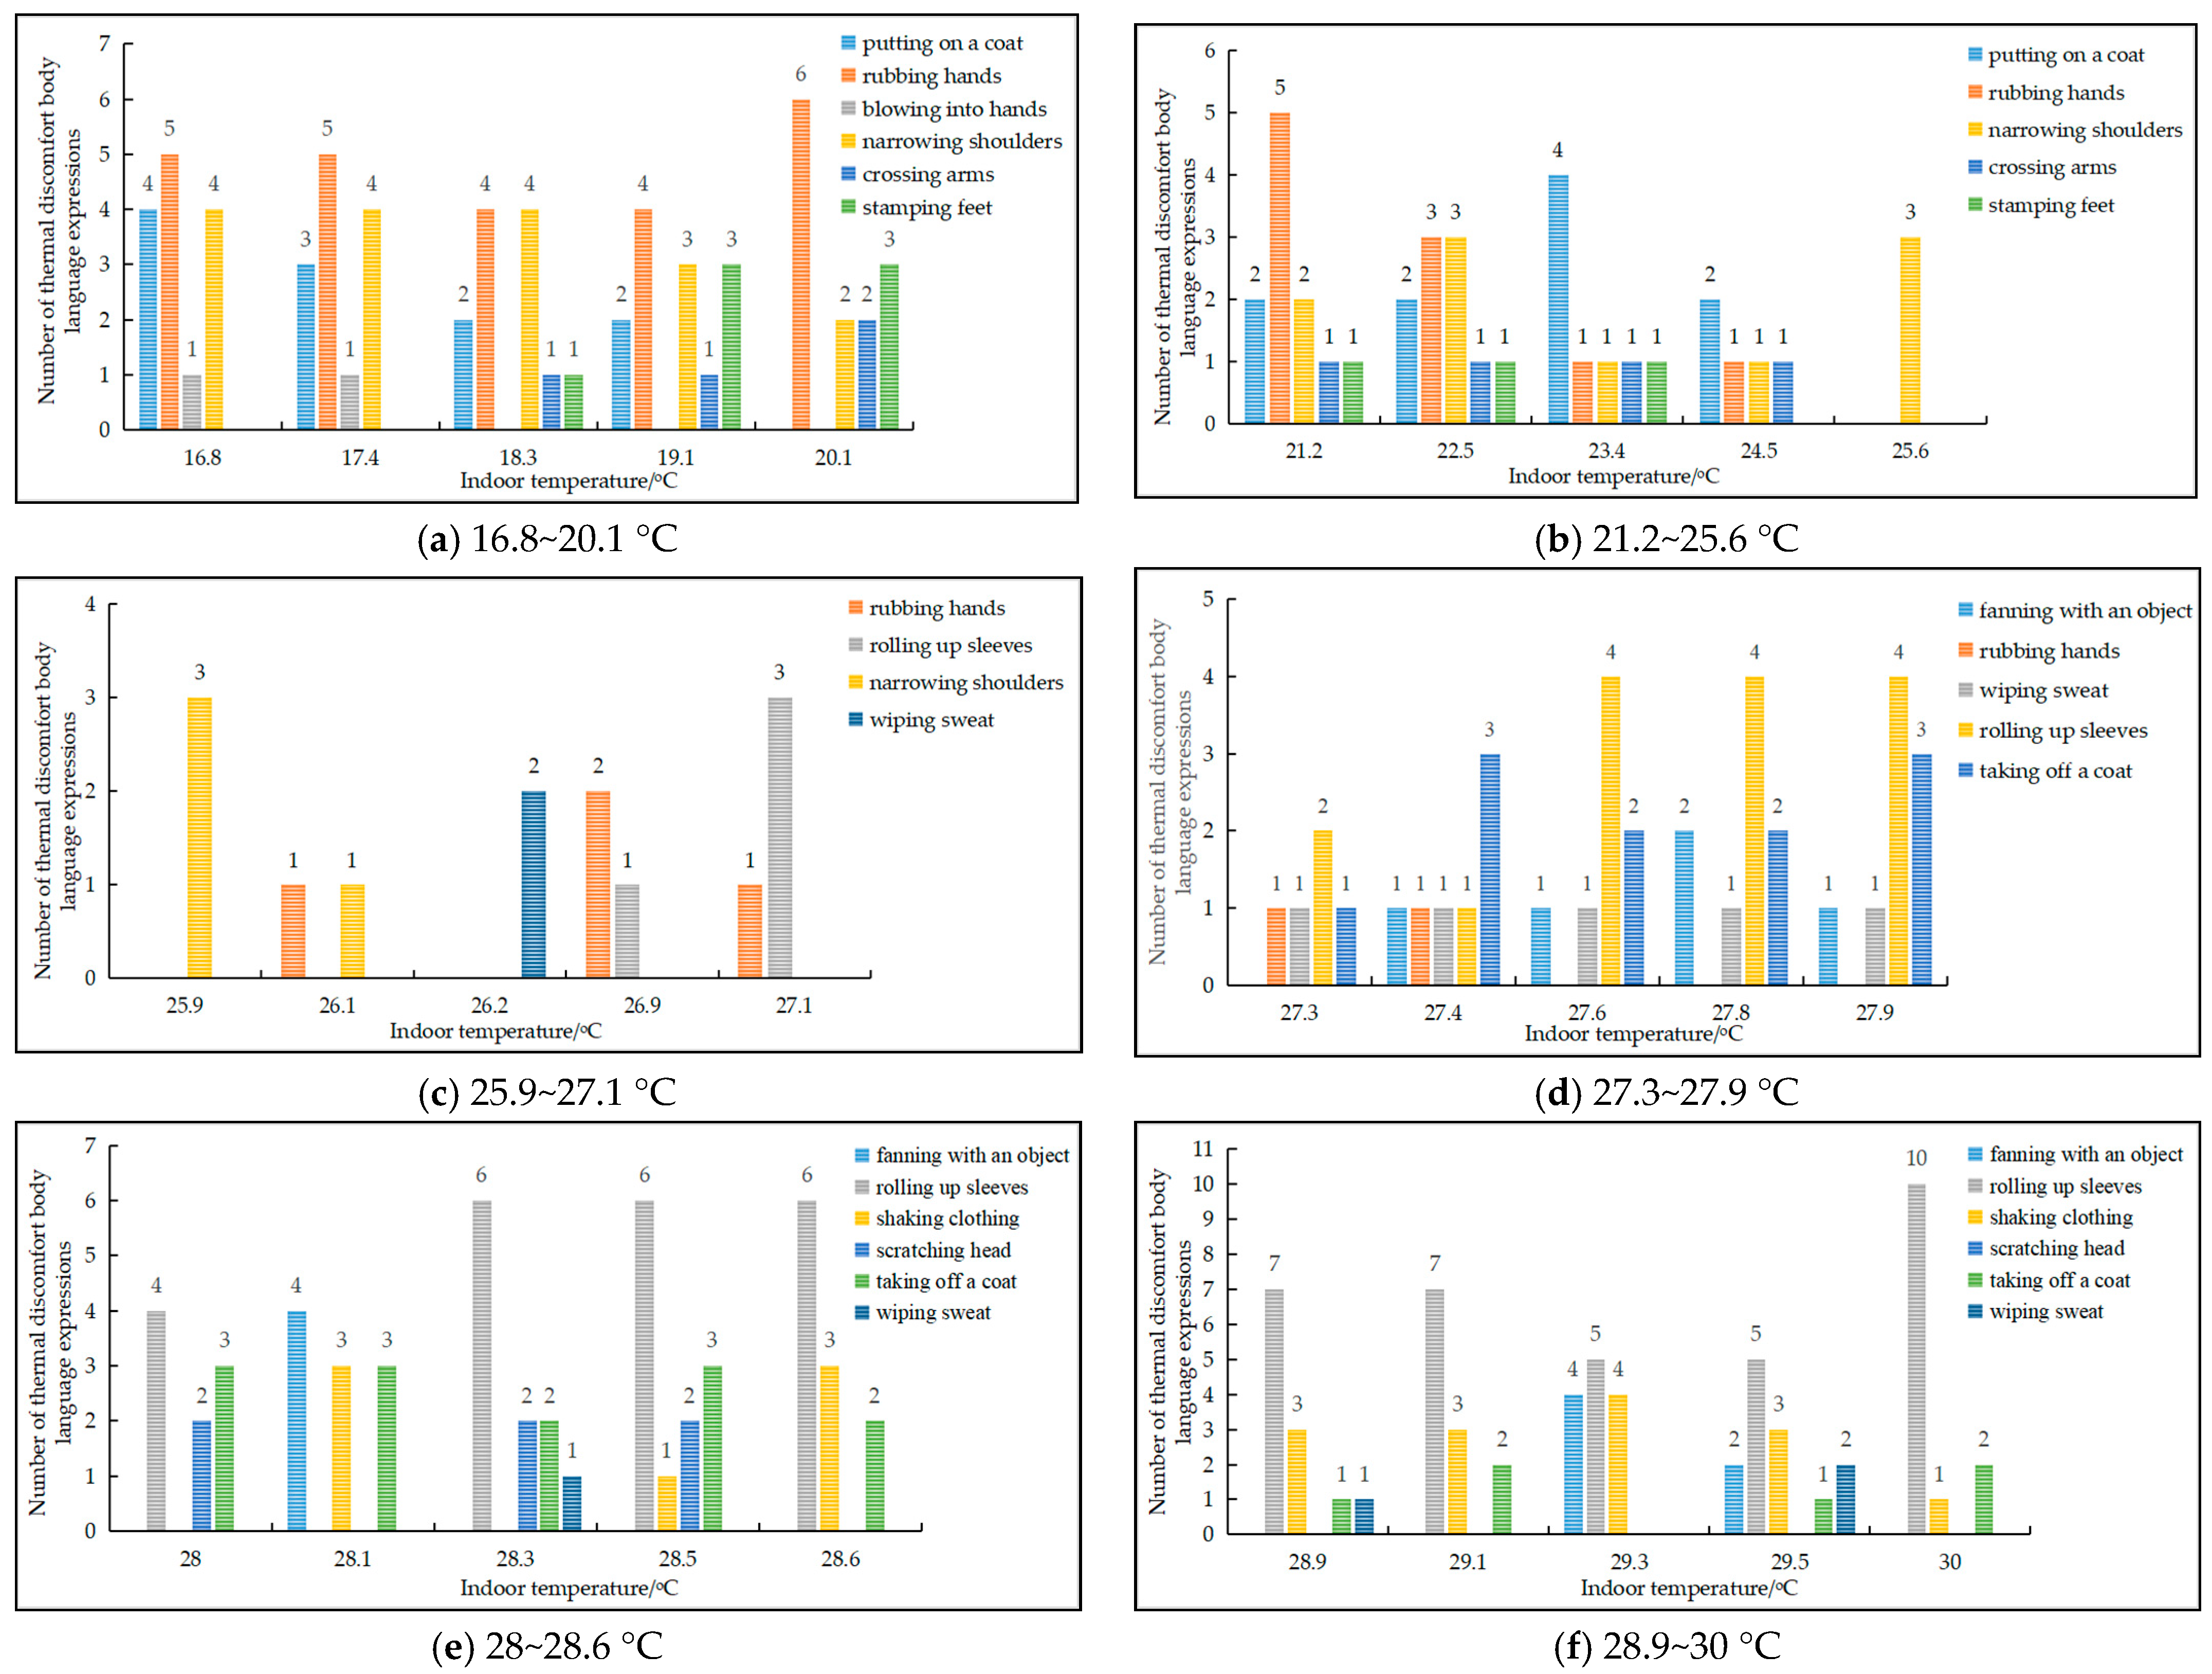
During the experiment, we set a series of different indoor air conditioning temperatures ranging from 16 °C to 30 °C to simulate different temperature conditions. Due to the limitations of the experimental environment, when the indoor air conditioning temperature was set to 16 °C, there was some deviation between the air conditioning display temperature and the actual indoor air temperature. The lowest room air temperature of 16.8 °C was recorded during the experiment, which may have affected the subjects’ thermal perception. The detailed results are shown in Figure 6. Figure 6a shows that when the indoor air temperature was changed to a lower temperature of 16.8~20.1 °C, the subjects will produce cold uncomfortable body language such as ‘rubbing hands’, ‘putting on a coat’, ‘stamp one’s feet’, etc. At different indoor temperatures, there were differences in the way multi-users express cold discomfort, that is, the type of body language expression was in dynamic change. Figure 6b shows that when the indoor temperature changes from 21.2 °C to 25.6 °C, the expression type of the subjects’ body language is the same as that of the indoor temperature from 16.8 °C to 20.1 °C, but the number of subjects decreases gradually. At 25.6 °C, only three subjects had thermal discomfort body language; Figure 6c shows that when the indoor temperature changes from 25.9 °C to 27.1 °C, the type of body language expression of the subjects’ changes, and the body language of ‘rolled up sleeves’ will be produced to express the feeling of thermal discomfort. With the increase in room temperature, the number of subjects with thermal discomfort body language expression increases. At 27.1 °C, four users produce thermal discomfort body language expression. Figure 6d shows that when the indoor temperature changes from 27.3 °C to 27.9 °C, the subjects gradually produce thermal discomfort body language such as ‘wipe sweat’, ‘fan with hand’, ‘take off the coat’, and other expressions of thermal discomfort. Figure 6e,f shows that when the indoor temperature is 28–30 °C, the number of subjects expressing thermal discomfort body language increases. When the indoor temperature is 30 °C, only two subjects do not do any thermal discomfort body movements. The results in the figure showed that multi-users in the same thermal environment will express discomfort through thermal discomfort body language, which proved that thermal discomfort body language can indeed represent personalized thermal comfort differences and proved the effectiveness of using it to predict thermal comfort.

3.1.2. Parameters Setting

Based on the DDPG algorithm, the training process of indoor thermal environment comfort and energy-saving is shown in Figure 7.
The DDPG controller achieved comfort and energy-saving regulation by interacting with the building’s thermal environment. At the initial moment, the indoor thermal environment state is St. The state is input to the strategy network, which outputs the control action At. The value network evaluated the goodness of the action by calculating the output action value of the strategy network. The pseudo-code of the training process based on the DDPG algorithm is shown in Algorithm 1.
Algorithm 1. Intelligent setting based on DDPG algorithm [33].
[1] Initialize the Critic-network Q ( S t , A t | θ Q ) and Actor-network μ ( S t , A t | θ μ ) with weights θ Q and θ μ
[2] Initialize Target-network Q ( S t , A t | θ Q ) and μ ( S t | θ μ ) with θ Q θ Q and θ μ θ μ
[3] Initialize replay buffer B
[4]for episode = 0, 1, … M do
[5]        Obtain the initial thermal state S0
[6]        for t = 0, 1, … T do
[7]                Obtain control action At according to Equation (14)
[8]                Update the set point for the next moment according to control action At
[9]                Obtain new thermal state St+1 and calculate reward Rt according to Equation (12) at the end of time slot t
[10]                Store (st, at, rt, st+1) into replay buffer B
[11]                Randomly select N transitions from replay buffer B
[12]                Calculate the estimated reward for each selected transition using Equation (15)
[13]                Update the Critic network by minimizing the MSE over the sampled minibatch and update the Actor-network using the sampled policy gradient
[14]                Update Target network Q and μ using Equation (16)
[15]        end for
[16]end for
During the experimental training, the controller explored the state space. The Ornstein–Uhlenbeck procedure was used to avoid getting stuck in a local optimum solution. Each exploration centered on the mean value to improve the thermal comfort control, with the expression shown in Equation (14).
A t = μ ( S t | θ μ ) + N ( t ) ,
where N(t) denotes the exploration noise, At describes the control action with added noise, and μ represents a deterministic strategy.
For each learned thermal environmental state (st, at, rt, st+1) ∈ N, the reward value expression is shown in Equation (15).
R i = R i + γ Q ( S i + 1 , μ ( S i + 1 | θ μ ) | + θ Q ) .
On the sampled small batch data, the value network was updated by minimizing the estimated reward, i.e., Equation (15), and the average absolute error of the value network prediction. The Target network was updated with the expression shown in Equation (16).
θ Q τ θ Q + ( 1 τ ) θ Q θ μ τ θ μ + ( 1 τ ) θ μ ,
where τ is the discount factor of the model. After training, only the policy network is applied to control the actions.
The DDPG controller was used for the intelligent setting of indoor environmental parameters. The value function was estimated approximately using a neural network. The input features to the network were the building environment state. The Actor–Critic network had two hidden layers with 128 neurons per layer. The tanh activation function was used as a batch normalization, gradient-based optimization using Adam, a learning rate of 0.001, a discount factor of 0.001 for model updates, a batch size of 128, a duration of 30 min for each period, and iterative training every 48 s. Parameters in the DDPG algorithm are set as shown in Table 4.

3.2. Analysis of Prediction Results

3.2.1. Quantitative Analysis of Prediction Results

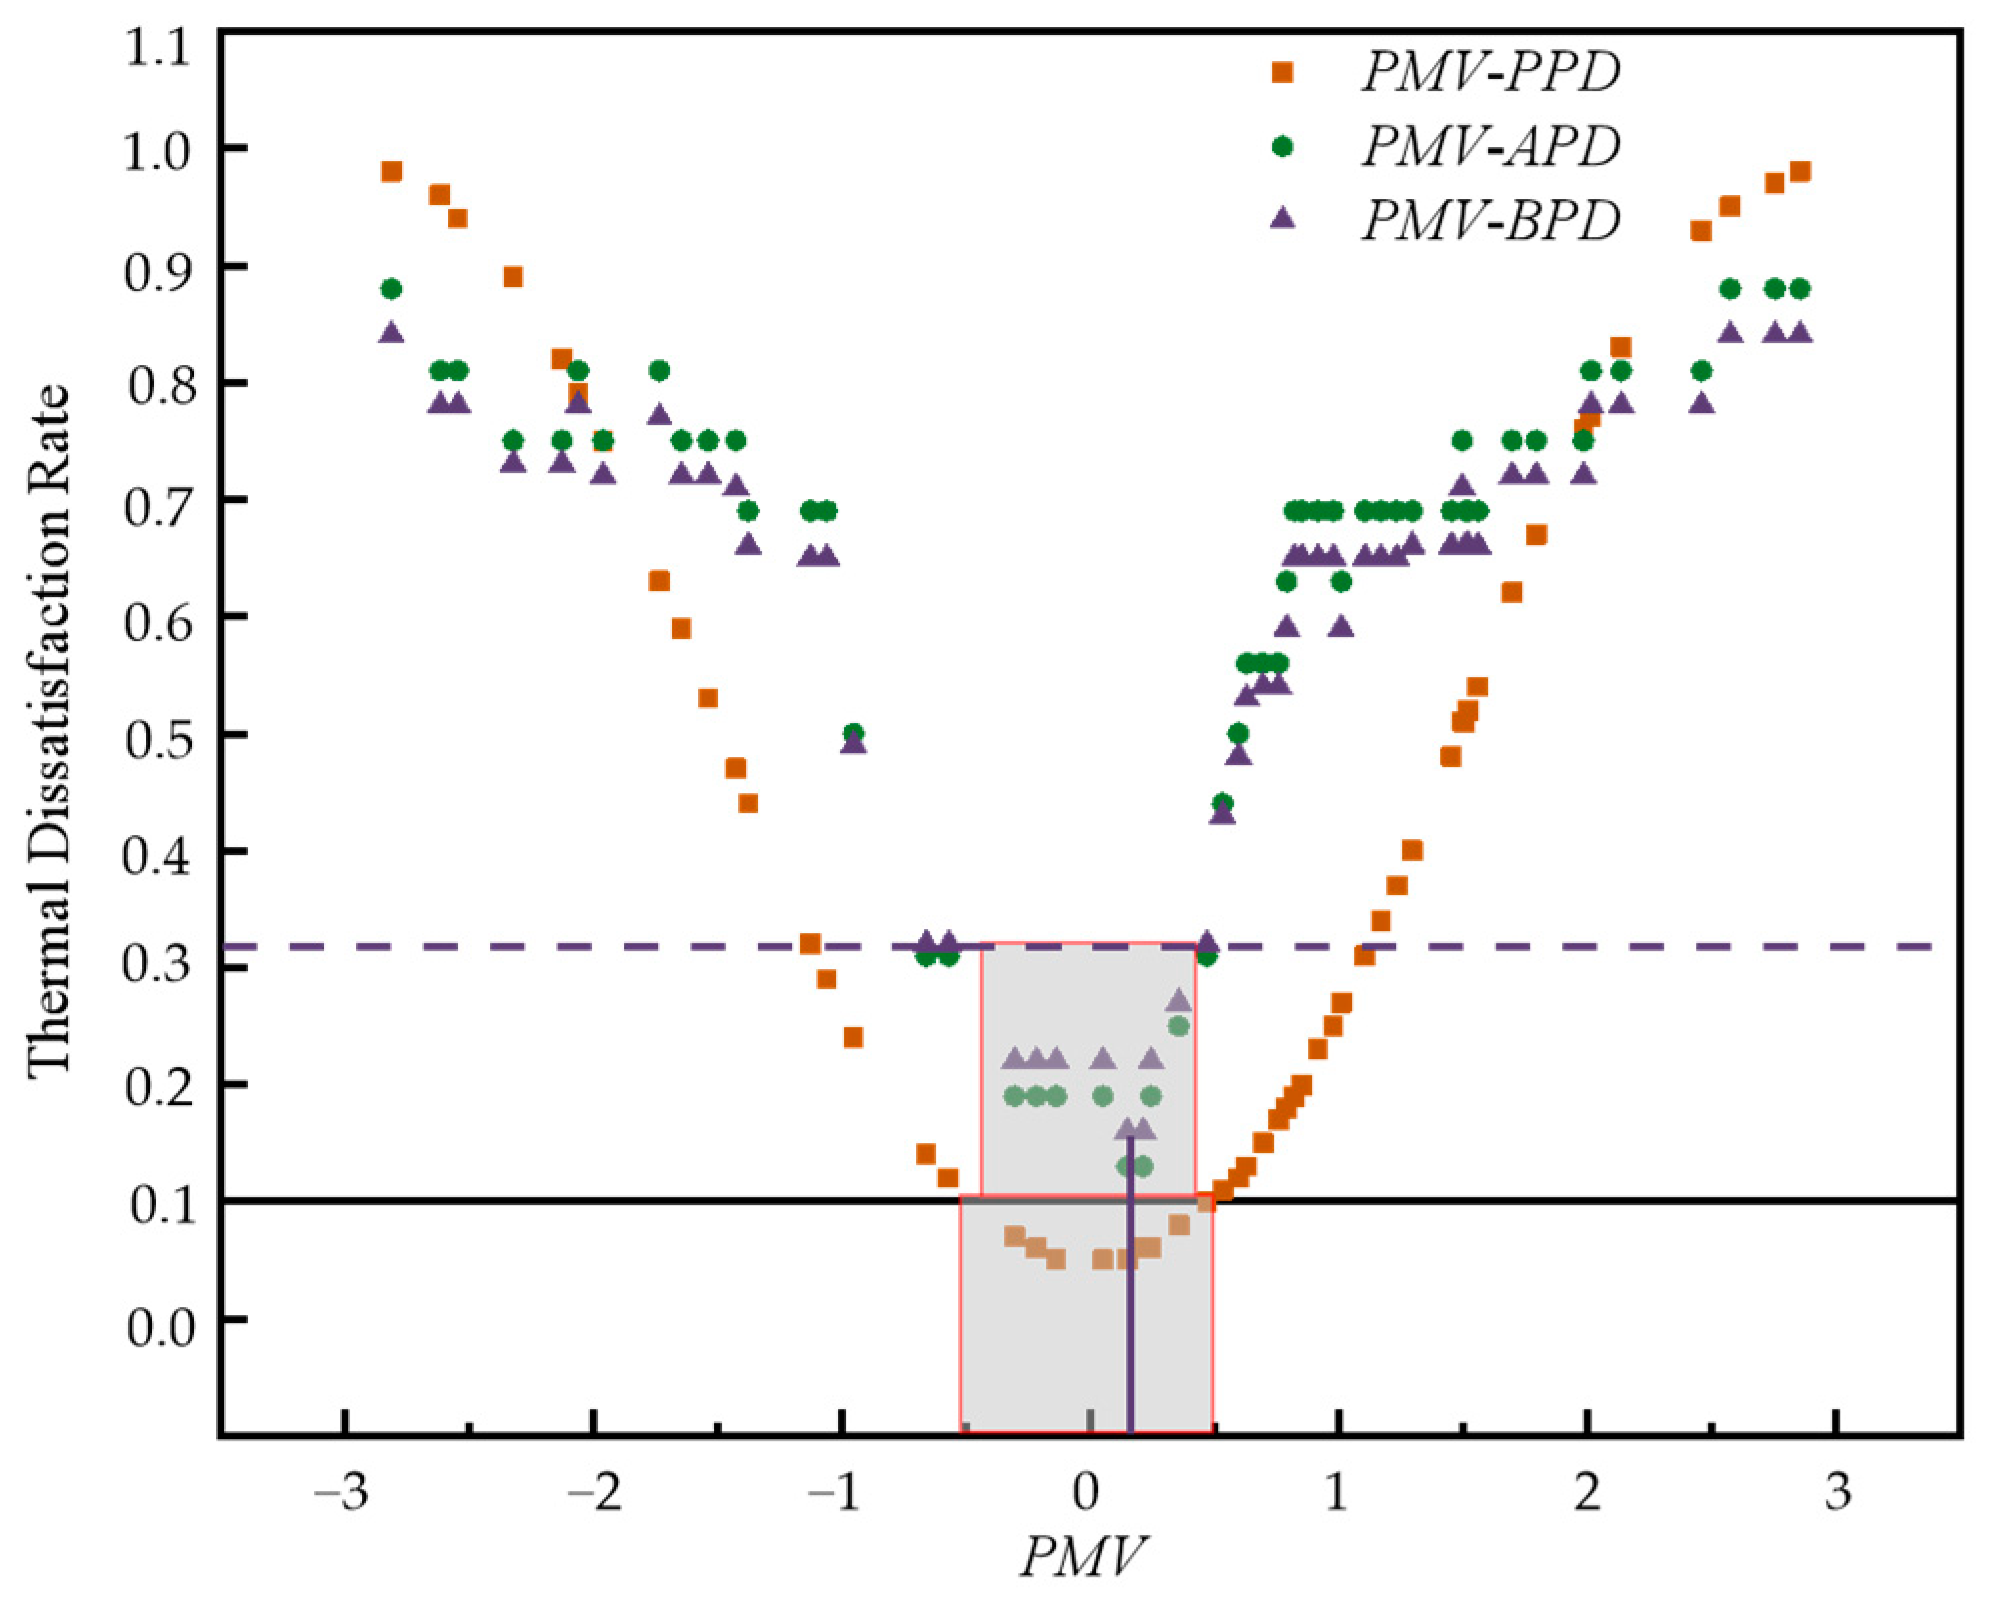
The prediction results at different indoor temperatures are shown in Figure 8. The predicted value of the thermal dissatisfaction rate expressed by thermal discomfort body language was noted as BPD and the actual thermal dissatisfaction rate was noted as APD. The Bayesian thermal dissatisfaction rate predicted values show a changing trend of low in the middle and high on both sides, which was consistent with the changing trend of PMV-PPD model predicted values and actual thermal dissatisfaction rate, and the lowest Bayesian thermal dissatisfaction rate predicted value is 16.28% near the suitable temperature. When the indoor temperature was low, the thermal dissatisfaction rate was higher, and as the indoor temperature rises to the appropriate temperature, the thermal dissatisfaction rate gradually decreases; at this time, when the indoor temperature is raised again, the thermal dissatisfaction rate gradually increases.
Comparing the model strengths and weaknesses, Mean Absolute Error (MAE) and Root Mean Square Error (RMSE) were used for quantitative analysis of the prediction results of the multi-algorithm thermal dissatisfaction rate. MAE and RMSE reflect the degree of difference between the predicted and actual value, and their definitions are detailed in Equations (17) and (18).
M A E = 1 m i = 1 m θ ^ i θ ~ i ,
R M S E = i = 1 m ( θ ^ i θ ~ i ) 2 m ,
where, θi is the Bayesian-based predictive value of the thermal dissatisfaction rate of the ith set of experimental data, θi is the Actual thermal dissatisfaction rate of the ith set of experimental data, i = 1, 2, …, m.
The method proposed in this paper exhibits higher accuracy and better prediction performance than the PMV-PPD model in actual building thermal environments, as evidenced by a reduction of 0.208 in MAE and 0.232 in RMSE. Table 5 presents the evaluation results of the thermal dissatisfaction rate prediction model.

3.2.2. Comparative Analysis of Prediction Results

In addition, we used machine learning methods such as Support Vector Machine (SVM), Random Forest (RF), Decision Tree (DT), Artificial Neural Networks (ANN), and K-Nearest Neighbors (KNN) to compare model prediction effects, and the model comparison results are shown in Table 6 and Table 7. Experimental results show that the error between the true and predicted values of our proposed method was smaller compared to the prediction method of thermal dissatisfaction rate without the inclusion of thermal discomfort body language expression.

3.2.3. Regression Analysis of Prediction Results

The relationship between PMV and the thermal dissatisfaction rate prediction result is shown in Figure 9. The PMV-PPD thermal comfort prediction model predicted the lowest value of thermal dissatisfaction rate to be 5% and the comfort interval to be (−0.5,0.5) at a thermal dissatisfaction rate of 10%. The lowest value of the thermal dissatisfaction rate predicted based on Bayesian theory is 16.28%, corresponding to a PMV value of 0.25.

3.3. Intelligent Setting of Indoor Temperature and Humidity

3.3.1. Reward Value

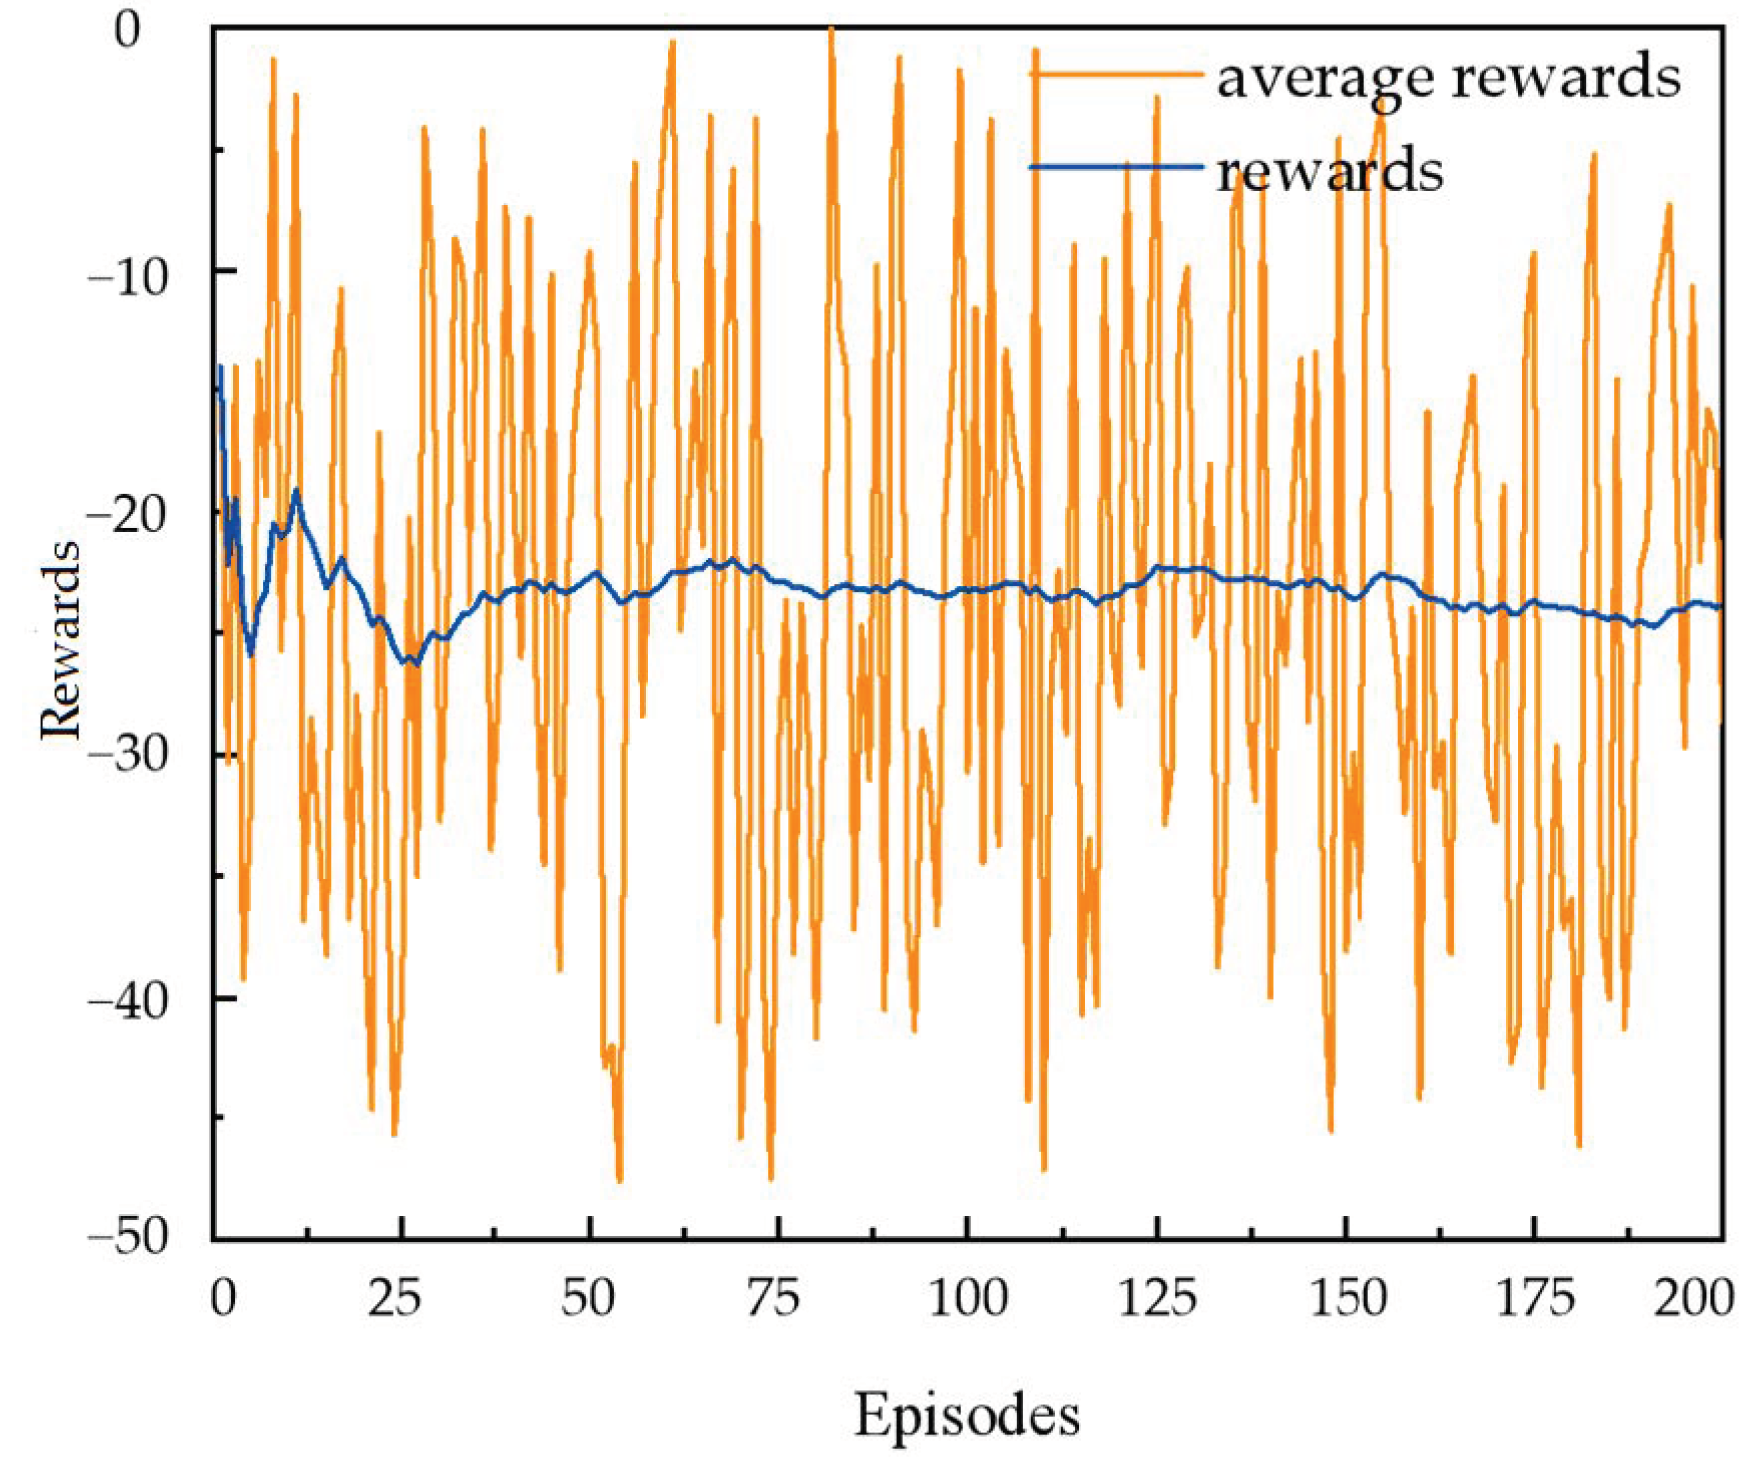
The experiment sets the relevant initial parameters, learning and training based on the DDPG algorithm, deriving the change of reward values during the training process, and observing its convergence. According to most users’ demand for indoor thermal comfort, the average reward value reflects the overall trend of the reward value. The trend of reward value change during the training process is shown in Figure 10 and the algorithm converges in a certain exploration process. The results show that the reward values in the online room temperature regulation model based on the DDPG algorithm fluctuate in the initial condition and finally stabilize. Initially, the controller learns and takes a trial-and-error approach to explore the appropriate temperature and humidity, resulting in fluctuating reward values. The DDPG algorithm updates the strategy during training, and the effect improves with each training iteration, eventually converging. During training, the reward values fluctuate due to noise and changes in the thermal environment during each iteration that affect energy consumption and thermal comfort. After about 75 rounds of training and learning, the reward value converges to a stable level.

3.3.2. Multi-Method Performance Comparison

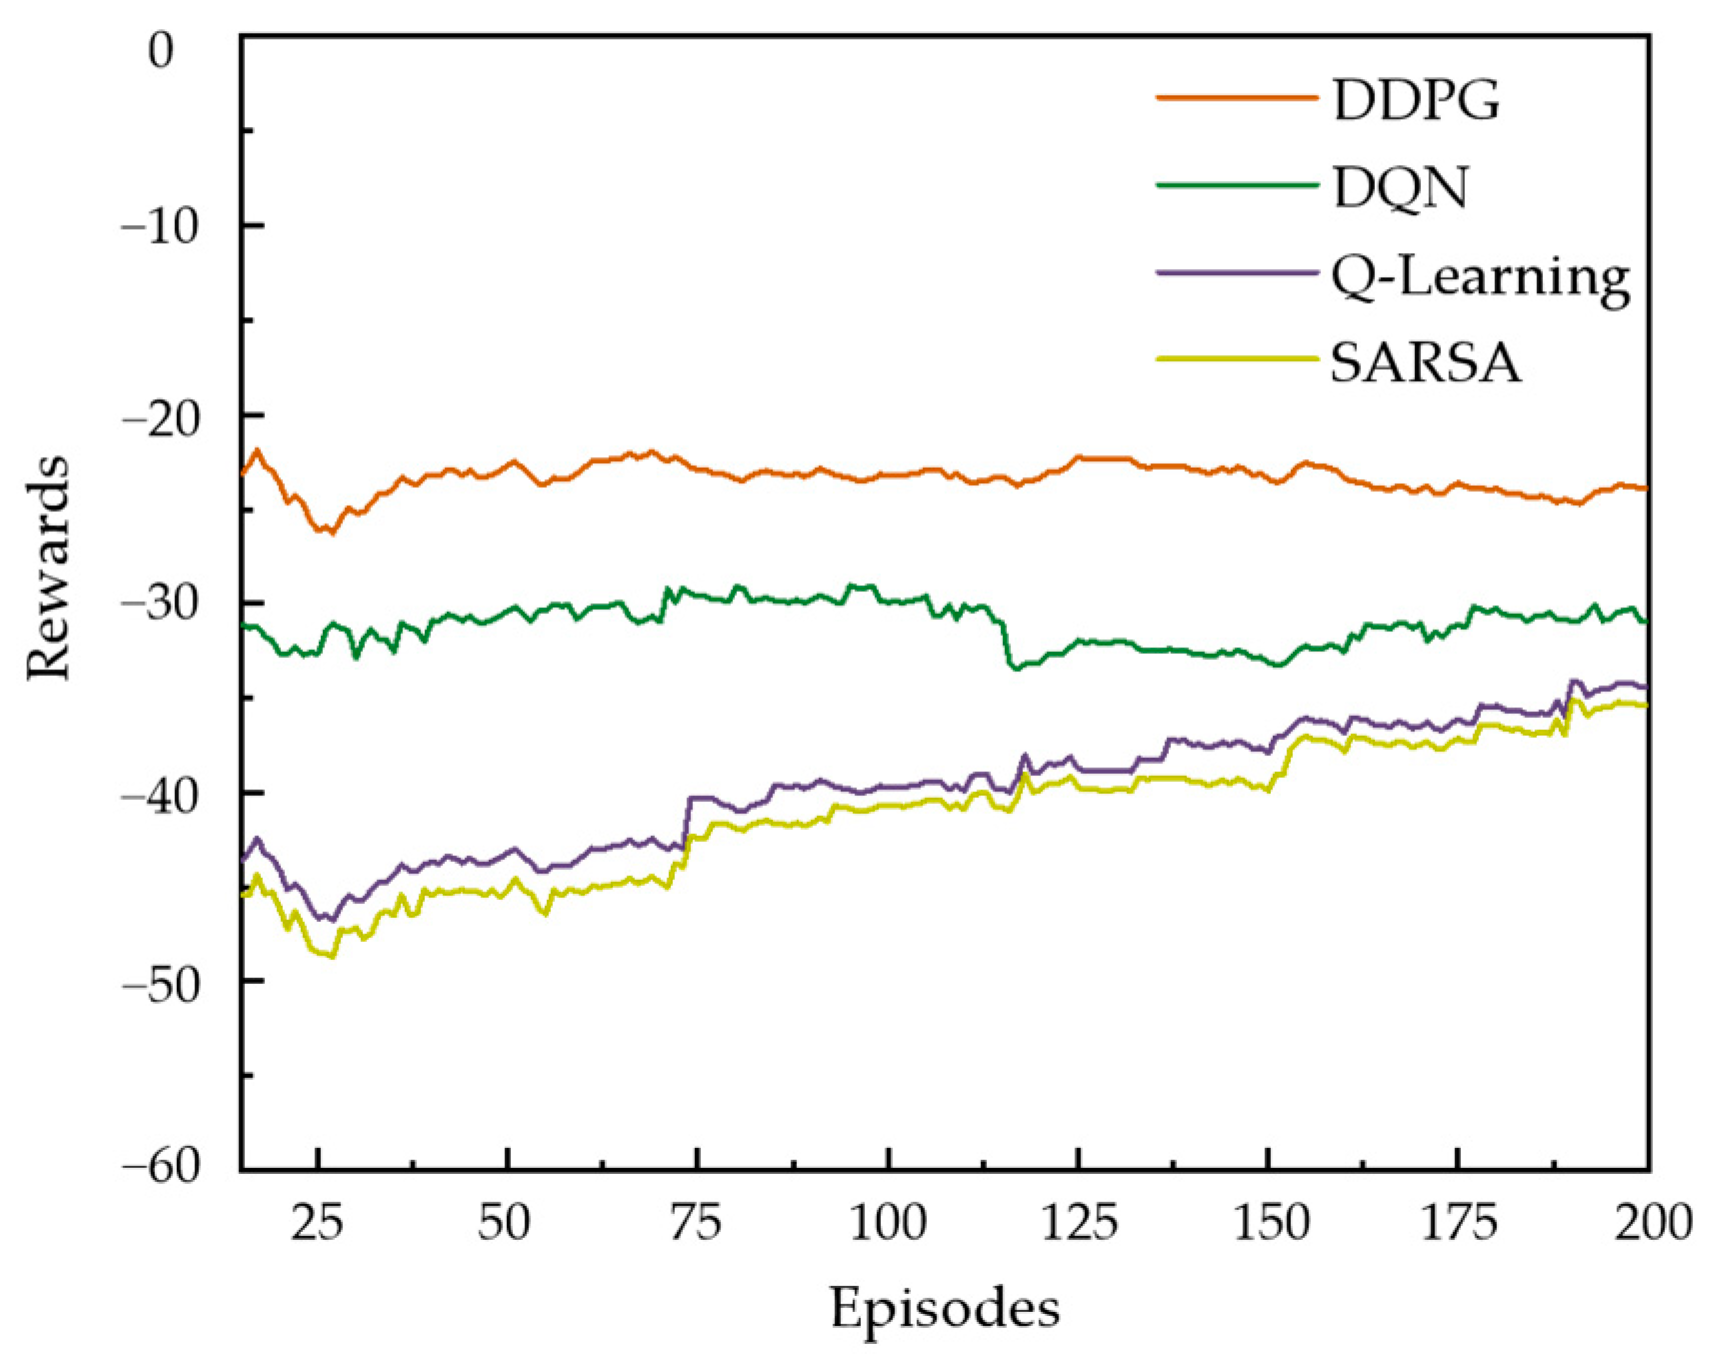
The reward values based on the DDPG algorithm, SARSA, Q-Learning, and DQN methods are shown in Figure 11. The results show that the DDPG controller can achieve faster convergence compared with other methods because DDPG does not require action space discretization and has a smaller number of network outputs to learn the air conditioning system temperature and humidity settings more effectively and obtain higher reward values. Q-Learning and SARSA use Q-table to store and update discrete state-action values, which is more effective when the state and action space is discrete and low-dimensional, but if the state and action space is high-dimensional continuous, there will be an exponential growth of computation as the number of dimensions increases. DQN uses an experience replay mechanism, which requires discrete action space and slower convergence speed. Compared with SARSA, Q-Learning, and DQN methods, DDPG can obtain the highest reward value and has more effective thermal control performance.

3.3.3. Setting Values Based on the PMV-PPD Model

At 26.5°, the occupants felt hotter. The results of the indoor temperature and humidity settings based on the PMV-PPD model are shown in Table 8. When the occupants were hotter, there was a decrease in the indoor temperature and humidity settings learned using the reinforcement learning algorithm, an increase in occupant comfort, and a decrease in the thermal dissatisfaction rate. Using different reinforcement learning algorithms, there were differences in the learned indoor temperature and humidity, and the final thermal comfort state of the group, where the deep deterministic strategy based on the gradient of the algorithm learned the lower indoor temperature, the lowest group thermal dissatisfaction rate and the highest overall comfort.

3.3.4. Setting Values Based on the PMV-BPD Model

The results of the indoor temperature and humidity settings based on the PMV-BPD model are shown in Table 9. The lowest value of the thermal dissatisfaction rate predicted by the PMV-BPD model was 16.28%, and the value of the thermal dissatisfaction rate predicted based on the PMV-BPD model was added to the intelligent settings for different reinforcement learning, and the learned room temperature settings differed. The room temperature setting value of 25.5 °C and the relative humidity setting the value of 45.6% were learned according to the DDPG algorithm, and the final learned thermal dissatisfaction rate was 16.58%, which was 0.3% different from the lowest Bayesian thermal dissatisfaction rate value expressed in thermal discomfort body language. The learned indoor temperature setting value is closer to the indoor temperature corresponding to the lowest thermal dissatisfaction rate than the learning result without the inclusion of body language expression.
The room temperature setting value learned according to the DQN algorithm is 25.8 °C and the relative humidity setting value is 45.3%, and the final learned thermal dissatisfaction rate is 16.9%, which is 0.62% different from the lowest Bayesian thermal dissatisfaction rate expressed by thermal discomfort body language. Compared with the learning results without the inclusion of body language expression, the room temperature setting value is closer to the room temperature corresponding to the lowest thermal dissatisfaction rate, the learned room temperature is lower and the human comfort level is higher. Comparing the indoor temperature and humidity setting values obtained based on Q-Learning and SARSA algorithms, the same conclusion can be obtained.

4. Discussion

The results of our study were conducted in public building spaces with random movement of people. Based on the group universal thermal comfort, the PMV-PPD model was modified in real-time by using personalized discomfort body language expression to obtain predicted values that are closer to the real thermal comfort, and the means of combining commonality and personalized thermal comfort characterization provides new research ideas and possibilities for the prediction of thermal dissatisfaction rate, which further provides a basis for the reasonable setting of indoor temperature and humidity.
In addition, this paper can reduce the disruption to the normal office of people in public building spaces. In this study, the camera captures human thermal discomfort body language to demonstrate its feasibility in expressing thermal discomfort. For example, when users feel hotter, they produce fanning, wiping sweat, etc., and when users feel colder, they produce breathing into their hands and stamping their feet. There were significant differences in the number of people expressing thermal discomfort body language when the room temperature changed, and the type of body language expression was not fixed.
Consistent with the conclusions reached in the study [31], the proposed method for predicting the thermal dissatisfaction rate for a given condition considering the randomness caused by inter- or intra-individual thermal sensory variability to obtain a comprehensive understanding of the comfortable thermal environment and the human thermal comfort response has shown good performance for predicting the occupant thermal dissatisfaction rate. Compared with the PMV-PPD model, which considers indoor environmental parameters and individual parameters to predict thermal dissatisfaction rate, this study adds human thermal discomfort body language expressions based on this model and integrates environmental parameters, human body parameters and thermal discomfort body language expressions to predict thermal dissatisfaction rate, realizing real-time correction of the PMV-PPD model, and the prediction effect is greatly improved. The improved PMV-PPD model can evaluate the influence of individual differences on human thermal comfort more conveniently and more closely to the real situation, and the evaluation effect is better.
Compared with other thermal dissatisfaction rate prediction methods, such as the adaptive dissatisfaction rate prediction model based on residential air conditioning turn-on behavior in China [34], which considers residents’ adaptive behavior, extracts the data of air conditioning turn-on from the original data through the air conditioning turn-on judgment algorithm, adopts the Monte Carlo sampling method for transformation, obtains the data set of the percentage of residents’ air conditioning turn-on behavior in a specific indoor and outdoor environment, and establishes a nonlinear regression model, the final R2 of this model is 0.833, while the R2 of the model proposed in this paper is 0.864. In contrast to the literature [35], which considered the thermal dissatisfaction rate caused by local thermal sensation, 16 subjects were selected for an experimental study in a climate chamber to assess the effect of thermal sensation of whole-body thermal conditions on the thermal dissatisfaction rate, and the predicted thermal environment dissatisfaction rate with vertical air temperature difference had a predicted model MAE of 0.2739, while the MAE of the model proposed in this paper was 0.033, which was reduced by 0.2409.
In line with the main idea of the literature [36], a human thermal comfort prediction model was established and applied to the rational setting of indoor temperature and humidity to maintain the occupants’ thermal comfort at a reasonable level. The difference is that the literature used indoor air temperature as the main index for studying thermal comfort in demand response (DR) and evaluated human thermal comfort using the PMV-PPD model, where PMV was used to determine the minimum and maximum acceptable indoor air temperature, and then evaluated the changing set point temperature using different control strategies, focusing on the rational setting of indoor temperature and humidity. And our study focused on combining group universal thermal comfort characteristics and individualized differences to modify the PMV-PPD model in real time to obtain thermal comfort values closer to the actual ones and further designed strategies for setting values of indoor environmental parameters to verify the effectiveness of the prediction model, focusing on the prediction of human thermal comfort. In the future, this study refers to the advantages of literature to further compare the reasonableness of indoor temperature setting values under different control strategies and also to further improve the advantages of this paper. Furthermore, in this study, the predicted thermal discomfort rate is applied to the intelligent setting of indoor temperature and humidity, and combined with reinforcement learning methods, the real-time predicted thermal discomfort rate is utilized for online learning of indoor temperature and humidity. The findings indicate that when indoor occupants feel hot, compared to the PPD model, the indoor temperature setting learned by the BPD model is lower, resulting in higher human comfort and a thermal discomfort rate closer to the BPD prediction. Among the different reinforcement learning methods [37,38], such as Q-learning, SARSA, and the DDPG algorithm performs better, achieving a reasonable indoor temperature and humidity setting while satisfying both human comfort and energy efficiency.
There are two limitations to this study. First, the sample size is limited by the number of subjects. Future studies can expand the sample size by collecting environmental data from sensor monitoring, questionnaires, and video-recorded body language expressions of thermal discomfort. Second, this study is an experimental study based on a real office scenario. Future studies can investigate the number and distribution of buildings and collect data from different building types to enhance the persuasiveness of the data and the validity of the model. In summary, the common and personalized thermal comfort characterization can be used to accurately predict the thermal dissatisfaction rate, which fits better with the actual human thermal comfort and can provide a reliable reference basis for indoor temperature and humidity setting values.

5. Conclusions

This study explored the potential of using thermal discomfort body language to predict thermal dissatisfaction rate by considering thermal comfort differences among individuals in groups, environmental factors, and human factors in public building spaces with random movement of people.
The results show that thermal discomfort body language can effectively describe personalized thermal comfort differences, and in some cases, body language such as rubbing hands and wiping sweat can characterize the discomfort feelings. By analyzing personalized thermal discomfort body expressions in groups, applying Bayesian theory with the PMV-PPD model as a benchmark, estimating probability density functions of model parameters, and validating the model using data collected from real office scenarios, the proposed model can explain the effects of randomness and uncertainty of heat discomfort somatic expressions on human thermal dissatisfaction rates under the same thermal conditions and provide a means to predict the thermal dissatisfaction rate.
The proposed thermal dissatisfaction rate prediction model is applied to indoor temperature and humidity settings for human comfort and building energy efficiency. Compared with the thermal dissatisfaction rate prediction model PMV-PPD, which does not incorporate body language expression, the learned indoor temperature and humidity settings are all closer to the indoor temperature and humidity at the lowest group thermal dissatisfaction rate with different reinforcement learning algorithms, and the group thermal comfort is higher.

Author Contributions

Conceptualization, G.L. and X.W.; methodology, X.W.; software, X.W.; validation, X.W., Y.M. and Y.Z.; formal analysis, Y.Z.; investigation, Y.Z.; resources, X.W.; data curation, T.C.; writing—original draft preparation, X.W.; writing—review and editing, Y.M.; visualization, X.W.; supervision, G.L.; project administration, Y.M.; funding acquisition, Y.M. All authors have read and agreed to the published version of the manuscript.

Funding

This research was funded by the National Natural Science Foundation of China (No. 52278125).

Institutional Review Board Statement

Not applicable.

Informed Consent Statement

Not applicable.

Data Availability Statement

Not applicable.

Conflicts of Interest

The authors declare no conflict of interest.

References

  1. Höppe, P.; Martinac, I. Indoor climate and air quality. Int. J. Biometeorol. 1998, 42, 1–7. [Google Scholar] [CrossRef] [PubMed]
  2. Mayer, H.; Höppe, P. Thermal comfort of man in different urban environments. Theor. Appl. Climatol. 1987, 38, 43–49. [Google Scholar] [CrossRef]
  3. Topak, F.; Pavlak, G.S.; Pekericli, M.K.; Wang, J.L.; Jazizadeh, F. Collective comfort optimization in multi-occupancy environments by leveraging personal comfort models and thermal distribution patterns. Build. Environ. 2023, 239, 110401. [Google Scholar] [CrossRef]
  4. Arakawa Martins, L.; Soebarto, V.; Williamson, T. A systematic review of personal thermal comfort models. Build. Environ. 2022, 207, 108502. [Google Scholar] [CrossRef]
  5. Tanabe, S.I.; Haneda, M.; Nishihara, N. Workplace productivity and individual thermal satisfaction. Build. Environ. 2015, 91, 42–50. [Google Scholar] [CrossRef]
  6. ASHRAE. Standard 55: Thermal Environmental Conditions for Human Occupancy; American Society of Heating, Refrigerating and Air-Conditioning Engineers (ASHRAE): Peachtree Corners, GA, USA, 2020. [Google Scholar]
  7. Fanger, P. Calculation of Thermal Comfort: Introduction of a basic comfort equation. ASHRAE Trans. 1967, 73, III4.20. [Google Scholar]
  8. Liu, Y.; Jin, H.; Luo, P. Prediction model of thermal environment dissatisfaction rate based on Bayesian theory. Air Cond. Heat. Vent. 2019, 49, 132–137. [Google Scholar]
  9. Guenther, J.; Sawodny, O. Feature selection and Gaussian Process regression for personalized thermal comfort prediction. Build. Environ. 2019, 148, 448–458. [Google Scholar] [CrossRef]
  10. Sulzer, M.; Christen, A.; Matzarakis, A. Predicting indoor air temperature and thermal comfort in occupational settings using weather forecasts, indoor sensors, and artificial neural networks. Build. Environ. 2023, 234, 110077. [Google Scholar] [CrossRef]
  11. Katerina, P.; Konstantinos, K.D.; Georgios, K.N. Machine learning and features for the prediction of thermal sensation and comfort using data from field surveys in Cyprus. Int. J. Biometeorol. 2022, 66, 1973–1984. [Google Scholar]
  12. Ghahramani, A.; Galicia, P.; Lehrer, D.; Varghese, Z.; Wang, Z.; Pandit, Y. Artificial intelligence for efficient thermal comfort systems: Requirements, current applications and future directions. Front. Built. Environ. 2020, 6, 49. [Google Scholar] [CrossRef]
  13. Höppe, P. The physiological equivalent temperature—A universal index for the biometeorological assessment of the thermal environment. Int. J. Biometeorol. 1999, 43, 71–75. [Google Scholar] [CrossRef] [PubMed]
  14. Salehi, B.; Ghanbaran, A.H.; Maerefat, M. Intelligent models to predict the indoor thermal sensation and thermal demand in steady state based on occupants’ skin temperature. Build. Environ. 2020, 169, 106579. [Google Scholar] [CrossRef]
  15. Wu, Y.; Liu, H.; Li, B.; Kosonen, R.; Wei, S.; Jokisalo, J.; Cheng, Y. Individual thermal comfort prediction using classification tree model based on physiological parameters and thermal history in winter. Build. Simul. 2021, 14, 1651–1665. [Google Scholar] [CrossRef]
  16. Ngarambe, J.; Yun, G.Y.; Santamouris, M. The use of artificial intelligence (AI) methods in the prediction of thermal comfort in buildings: Energy implications of AI-based thermal comfort controls. Energy Build. 2020, 211, 109807. [Google Scholar] [CrossRef]
  17. Salamone, F.; Belussi, L.; Curro, C.; Danza, L.; Ghellere, M.; Guazzi, G.; Lenzi, B.; Megale, V.; Meroni, I. Integrated Method for Personal Thermal Comfort Assessment and Optimization through Users’ Feedback, IoT and Machine Learning: A Case Study (dagger). Sensors 2018, 18, 1602. [Google Scholar] [CrossRef] [Green Version]
  18. Ghahramani, A.; Castro, G.; Becerik-Gerber, B.; Yu, X. Infrared thermography of human face for monitoring thermoregulation performance and estimating personal thermal comfort. Built. Environ. 2016, 109, 1–11. [Google Scholar] [CrossRef] [Green Version]
  19. Li, D.; Menassa, C.C.; Kamat, V.R. Robust non-intrusive interpretation of occupant thermal comfort in built environments with low-cost networked thermal cameras. Appl. Energy 2019, 251, 113336. [Google Scholar] [CrossRef]
  20. Oh, S.H.; Lee, S.; Kim, S.M.; Jeong, J.H. Development of a heart rate detection algorithm using a non-contact doppler radar via signal elimination. Biomed. Signal Process. 2021, 64, 102314. [Google Scholar] [CrossRef]
  21. Azizi, N.S.M.; Wilkinson, S.; Fassman, E. An analysis of occupants response to thermal discomfort in green and conventional buildings in New Zealand. Energy Build. 2015, 104, 191–198. [Google Scholar] [CrossRef]
  22. Al-Faris, M.; Chiverton, J.; Ndzi, D.; Ahmed, A.I. Vision Based Dynamic Thermal Comfort Control Using Fuzzy Logic and Deep Learning. Appl. Sci. 2021, 11, 4626. [Google Scholar] [CrossRef]
  23. Shaikh, P.H.; Nor, N.B.M.; Nallagownden, P.; Elamvazuthi, I.; Ibrahim, T. A review on optimized control systems for building energy and comfort management of smart sustainable buildings. Renew. Sustain. Energy Rev. 2014, 34, 409–429. [Google Scholar] [CrossRef]
  24. Kim, J.; Zhou, Y.; Schiavon, S.; Raftery, P.; Brager, G. Personal comfort models: Predicting individuals’ thermal preference using occupant heating and cooling behavior and machine learning. Built. Environ. 2018, 129, 96–106. [Google Scholar] [CrossRef] [Green Version]
  25. Meier, A.; Dyer, W.; Graham, C. Using human gestures to control a building’s heating and cooling system. In Proceedings of the 9th International Conference on Energy Efficiency in Domestic Appliances and Lighting (EEDAL), Irvine, CA, USA, 13–15 September 2017. [Google Scholar]
  26. Yang, B.; Cheng, X.; Dai, D.; Olofsson, T.; Li, H.; Meier, A. Real-time and contactless measurements of thermal discomfort based on human poses for energy efficient control of buildings. Built. Environ. 2019, 162, 106284. [Google Scholar] [CrossRef]
  27. Pan, C.S.; Chiang, H.C.; Yen, M.C.; Wang, C.C. Thermal comfort and energy saving of a personalized PFCU air-conditioning system. Energy Build. 2005, 37, 443–449. [Google Scholar] [CrossRef]
  28. Yonezawa, K. Comfort air-conditioning control for building energy-saving. In Proceedings of the IEEE International Conference on Industrial Electronics, Control and Instrumentation. 21st Century Technologies, Nagoya, Japan, 22–28 October 2000; Volume 3, pp. 1737–1742. [Google Scholar]
  29. Chen, Y.; Norford, L.K.; Samuelson, H.W.; Malkawi, A. Optimal control of HVAC and window systems for natural ventilation through reinforcement learning. Energy Build. 2018, 169, 195–205. [Google Scholar] [CrossRef]
  30. Continuous Control with Deep Reinforcement Learning. Available online: https://arxiv.org/abs/1509.02971 (accessed on 9 September 2015).
  31. Lim, J.; Choi, W.; Akashi, Y.; Yoshimoto, N.; Ooka, R. Bayesian prediction model of thermally satisfied occupants considering stochasticity due to inter- and intra-individual thermal sensation variations. J. Build. Eng. 2022, 52, 104414. [Google Scholar] [CrossRef]
  32. Engineers A C. ANSI/ASHRAE Standard 55-2004: Thermal Environmental Conditions for Human Occupancy; American Society of Heating, Refrigerating and Air-Conditioning Engineers (ASHRAE): Tullie Circle, NE, GA, USA, 2004. [Google Scholar]
  33. Gao, G.; Li, J.; Wen, Y. DeepComfort: Energy-Efficient Thermal Comfort Control in Buildings Via Reinforcement Learning. IEEE Internet Things 2020, 7, 8472–8484. [Google Scholar] [CrossRef]
  34. Yan, S.; Liu, N.; Wang, W.; Han, S.; Zhang, J. An adaptive predicted percentage dissatisfied model based on the air-conditioner turning-on behaviors in the residential buildings of China. Built. Environ. 2021, 191, 107571. [Google Scholar] [CrossRef]
  35. Wu, Y.; Zhang, S.; Liu, H.; Cheng, Y. Thermal sensation and percentage of dissatisfied in thermal environments with positive and negative vertical air temperature differences. Energy Build. 2023, 4, 629–638. [Google Scholar] [CrossRef]
  36. Alimohammadisagvand, B.; Alam, S.; Ali, M.; Degefa, M.; Jokisalo, J.; Sirén, K. Influence of energy demand response actions on thermal comfort and energy cost in electrically heated residential houses. Indoor Built. Environ. 2016, 26, 298–316. [Google Scholar] [CrossRef]
  37. Zenger, A.; Schmidt, J.; Krödel, M. Towards the Intelligent Home: Using Reinforcement-Learning for Optimal Heating Control. In KI 2013: Advances in Artificial Intelligence; Timm, I.J., Thimm, M., Eds.; KI 2013: Lecture Notes in Computer Science; Springer: Berlin/Heidelberg, Germany, 2013; Volume 8077. [Google Scholar]
  38. Fazenda, P.; Veeramachaneni, K.; Lima, P.; O’Reilly, U.-M. Using reinforcement learning to optimize occupant comfort and energy usage in HVAC systems. Air Cond. Heat. Vent. 2014, 6, 675–690. [Google Scholar] [CrossRef]
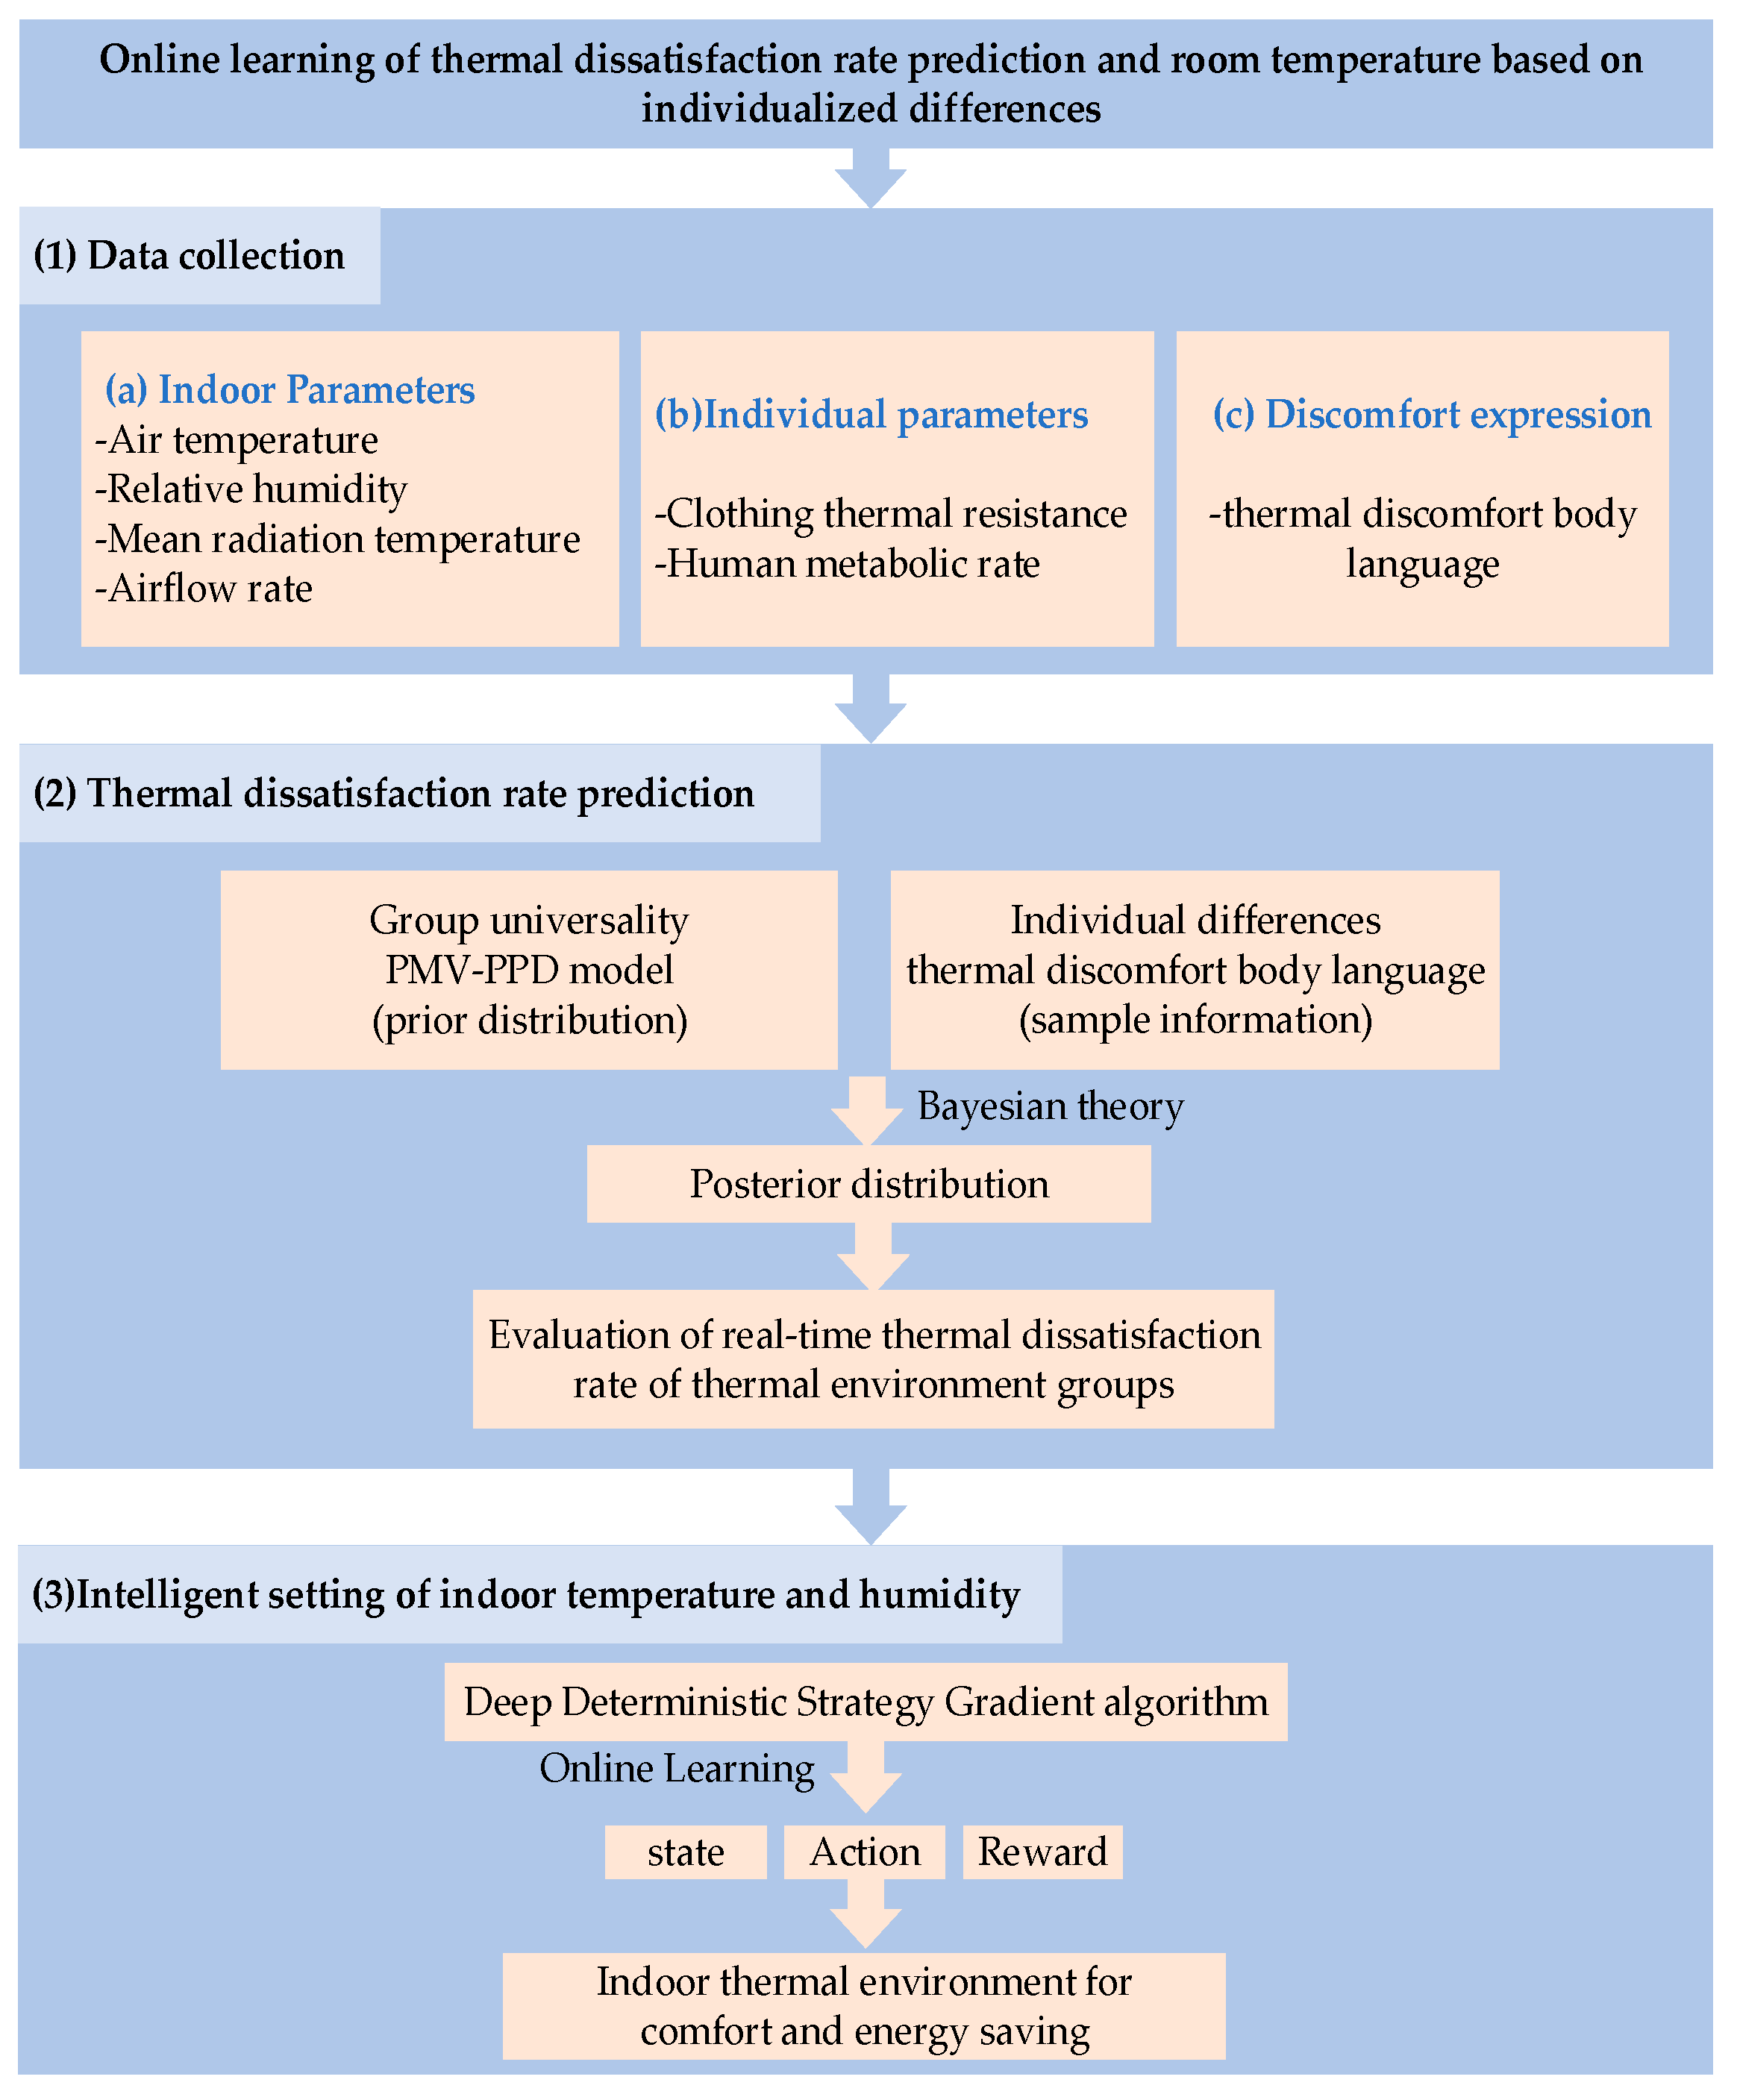
Figure 1. Flow chart of this study.
Applsci 13 07978 g001
Figure 2. Intelligent setting of indoor parameters based on DDPG.
Applsci 13 07978 g002
Figure 3. PMV-PPD relationship curve.
Applsci 13 07978 g003
Figure 4. Experimental environment.
Applsci 13 07978 g004
Figure 5. Experimental procedure.
Applsci 13 07978 g005
Figure 6. Distribution of subjects’ thermal discomfort body language expression.
Applsci 13 07978 g006
Figure 7. Training process based on the DDPG algorithm. (Note: The blue color in the picture indicates the Indoor Thermal environment. Gray indicates OU-noise. Light orange indicates Actor Network. Green indicates Critic Network. Orange indicates Replay buffer B. N* is used to store state parameters).
Applsci 13 07978 g007
Figure 8. Comparison of multi-method prediction results.
Applsci 13 07978 g008
Figure 9. Regression analysis of prediction results.
Applsci 13 07978 g009
Figure 10. Convergence of the DDPG algorithm.
Applsci 13 07978 g010
Figure 11. Multi-algorithmic reinforcement learning rewards values.
Applsci 13 07978 g011
Table 1. Subjects’ basic information table.
GenderQuantityAgeHeight/mWeight/kgBMI/kg·m2
Male825.0 ± 1.01.75 ± 0.168.5 ± 11.522.5 ± 3.8
Female824.9 ± 2.21.60 ± 0.149.9 ± 14.019.3 ± 2.1
Table 2. Detailed information on experimental devices.
Measurement
Parameters
Test InstrumentsMeasurement RangeAccuracyTest Method
Indoor
temperature
HABOTEST HT
HT618 Temperature and
humidity data logger
−20~60 °C±0.5 °C1.1 m above the ground
Relative
humidity
HABOTEST HT
HT618 Temperature and
humidity data logger
0–99.9%±3%1.1 m above the ground
Airflow rateHABOTEST HT625A
Handheld anemometer
0.4~30.00 m/s±0.5 m/s1.1 m above the ground
Thermal
discomfort body language
General camera
1920×1080p
In front of
subjects
Table 3. ASHRAE thermal comfort scale [32].
Thermal ComfortScale
Hot+3
Warm+2
Slightly warm+1
Netural0
Slightly cool−1
Cool−2
Cold−3
Table 4. Parameter settings in the DDPG algorithm.
ParameterValueParameterValue
Actor-network
learning rate
1 × 10⁻⁴Soft update parameters
of target network
1 × 10⁻²
Critic-network
learning rate
1 × 10⁻³Maximize reply
buffer capacity
50,000
discount factor τ0.99activation functiontanh
batch_size128
Table 5. Evaluation results of thermal dissatisfaction rate prediction model.
Model Evaluation MetricsPMV-PPDModel of This Paper
MAE0.2410.033
RMSE0.2690.037
Table 6. Mean Absolute Error of the model.
InputAlgorithms
Indoor ParametersIndividual ParametersDiscomfort ExpressionKNNSVMRFDTANNOurs
×0.09860.20000.09710.06190.1501-
-----0.033
Table 7. Root Mean Square Error of the model.
InputAlgorithms
Indoor ParametersIndividual ParametersDiscomfort ExpressionKNNSVMRFDTANNOurs
×0.12170.21210.07600.10630.1730-
-----0.037
Table 8. The final setting value is based on PMV-PPD Model.
Reinforcement Learning AlgorithmsIndoor Temperature Setting/°CRelative Humidity Setting/%PMVThermal
Dissatisfaction Rate
DDPG25.849.5%0.236.09%
DQN25.948.7%0.256.29%
Q-Learning26.149.1%0.337.26%
SARSA26.348.5%0.48.33%
Table 9. The final setting value is based on PMV-BPD Model.
Reinforcement Learning AlgorithmsIndoor Temperature Setting/°CRelative Humidity Setting/%PMVThermal
Dissatisfaction Rate
DDPG25.545.6%0.0916.58%
DQN25.845.3%0.216.9%
Q-Learning25.945.2%0.2317.8%
SARSA26.044.8%0.2618.4%
Disclaimer/Publisher’s Note: The statements, opinions and data contained in all publications are solely those of the individual author(s) and contributor(s) and not of MDPI and/or the editor(s). MDPI and/or the editor(s) disclaim responsibility for any injury to people or property resulting from any ideas, methods, instructions or products referred to in the content.