
Quantitative Classification Model of Composite Product Image Based on Event-Related Potential

College of Mechatronic and Automation, Huaqiao University, Xiamen 361021, China
*
Author to whom correspondence should be addressed.
Appl. Sci. 2023, 13(13), 7972; https://doi.org/10.3390/app13137972
Submission received: 5 June 2023
/
Revised: 20 June 2023
/
Accepted: 26 June 2023
/
Published: 7 July 2023
Abstract
:As an important research tool in neuroscience, event-related potential (ERP) technology enables in-depth analysis of the consumer’s product image cognition process and complements and verifies the product image cognition model at the ERP level. It provides an important theoretical basis for systematically capturing product image and improvement of the product image cognitive model. In this work, the correlation between ERP data, product image word pairs and the degree of semantic match with the product is investigated, and a support vector machine algorithm is selected to build a classification model with physiological data (behavioral data + ERP data) as the independent variable and the degree of semantic match with the product image as the dependent variable. By adjusting the model parameters, the final classification accuracy reaches 95.667%, which shows that the model has some reliability and is a viable research method for ERP-based product image researchers in the future.
1. Preface
With the rapid development of scientific technology and industrial production capacity, the functions of many industrial products are becoming increasingly better, and consumers’ basic needs for industrial products have been basically met. In this context, consumers are gradually shifting their needs from the material level to the emotional and personal level. An increasing number of companies are improving the appearance of related products based on the change in consumer demand and hope to develop products that meet consumers’ psychological needs.
Product appearance design can be expressed through product image. Product image refers to the consumer’s intuitive reflection through subjective associations after sensory perception when evaluating products [1] and may reflect and cater to consumers’ psychological needs to some extent. On the one hand, product image depends on the image and meaning conveyed by the product through its shape, color, material, texture and structure [2] and, on the other hand, it is related to consumers’ own life experiences and cultural background. Designers express their design ideas through product images. At the same time, consumers can understand the design language that designers want to express by experiencing and feeling the image of the products. Thus, the product image is an important link between consumers and designers. However, because of the implicit and abstract nature of product images, the cognitive process of product images is more complex [3], and there are relatively few studies with objective consumer data based on product images. Many researchers believe that an in-depth study of the cognitive process of product image is helpful in understanding consumers’ emotional needs and product preferences. The cognitive model of product image is a regular summary of the cognitive process of product image, so the study of the cognitive model of product image is an important area of product image research. Based on the cognitive image space of designers, consumers and engineers, combined with the cognitive differences of the three, SU Jianning [4] created a composite cognitive image space to meet the emotional needs of the three and developed an evaluation model for the product modeling image. The prototype matching theory was developed by Rosch [5] et al. after a large number of cognitive psychology experiments. According to this theory, people have abstract prototypes of different things in their memory. When people recognize stimuli, they compare them with the prototypes in their brains and then judge the stimulus according to the difference between the stimulus and the prototype. If there is an approximate match between the stimulus and the prototype, then such stimuli can be successfully recognized. The prototype is not a particular object but a collection of objects representing all levels; that is, each prototype is considered to be the ideal representative of a particular kind of object or a collection of things with common properties [6].
The study of the cognitive model of product image can provide a deep understanding of the main factors of consumers in purchasing products. Therefore, the question of how to accurately and objectively construct the cognitive model of product image is the focus of current research. To build a cognitive model of product image, it is necessary to understand consumers’ cognitive process of buying products and quantify this abstract cognitive process of product image. Most researchers use affective measures to quantify consumers’ emotional needs for products. Affective measurement [7] is an important measurement method for the level of user experience. The objective measurement method uses eye movements, EEG, EMG, heart rate and other physiological indicators to quantify the user experience [8]. Although it is difficult to operate and expensive, it can provide more objective data.
Electroencephalogram (EEG) technology records the electrical activity generated by the brain’s neurons on a person’s scalp in real time and provides a method of real-time measurement of cognitive processes because of its high temporal resolution, namely, the so-called “implicit measurement of cognitive processes” [9]. Therefore, this method is of great importance in understanding the consumer cognitive process and the formation of emotional preferences. Currently, many researchers have used EEG technology to study consumers’ cognitive processes related to product images. Jesús García-Madariaga et al. [10] used EEG technology to study in depth the neurophysiological responses of consumers when using different products in different e-commerce environments to determine their purchase intentions and preferences for different products. Michael W. O’Boyle et al. [11] used functional magnetic resonance imaging (FMRI) to investigate whether scaling and rotating consumers’ images while shopping for clothing online stimulated the brain’s reward mechanism and pleasure. Liu et al. [12] used various websites as stimulus material. Using ERP experiments, they found that the presence of N1 and P2 components showed that subjects had a good emotional experience with the website, while the LPP (late positive potential) showed that they had a poor emotional experience. The research showed that the emotional effect of different website designs on users could be explored more deeply from the perspective of electrophysiology. Wan [13] et al. used ERP technology to conduct an experimental analysis of wood with different colors, textures and glosses. The results showed that consumers perceived the color and gloss of wood more clearly than texture when viewing wood products, and consumers appreciated dark wood products more in terms of color. Chen et al. [14] studied people’s esthetic preferences for ceramic tiles and recorded participants’ ERP. They found that the tiles people preferred elicited higher N100 amplitudes, while those they disliked elicited P200 and LPP amplitudes. Wang et al. [15] investigated the effects of the types of images perceived by consumers on their purchase intention and ERP data when buying different types of water products and found that dynamic images of water products stimulated shoppers’ positive feelings. The amplitude of N2 decreased, the latency shortened, and the amplitude of LPP increased. Deng et al. [16] investigated the brain waves triggered by cultural and creative products with different degrees of enjoyment, extracted consumers’ interest in images of cultural and creative products, and developed an interactive evolutionary design system based on an interactive genetic algorithm (IGA) and a neural network (BPNN). The effectiveness of this method was tested using the design practice of condiment bottles.
In this study, the examination of EEG characteristics by consumers is assumed under various conditions of image matching for a specific stimulus displaying the product image during the purchasing process. The objective is to quantify users’ subjective image perception and establish a correspondence between EEG signals and the product image space during consumers’ image perception. Building upon this correspondence, a model is established to relate brain data points to image matching. The product image serves as a significant factor influencing user experience, and ERP (event-related potential) technology emerges as an effective approach to explore user experience. Therefore, this research employs ERP technology to capture and quantify consumers’ psychological perception through neural activity in the process of perceiving product images. The correlation model between ERP data and the semantic value of product images is established using SVM (support vector machine).
2. Experimental Design
2.1. Screening of Experimental Materials
As one of the representative products of industrial modernization, automobiles have rich styling and design. Moreover, functional magnetic resonance imaging (FMRI) results show that the images of cars can evoke the activation of the ventral striatum, orbitofrontal cortex, anterior cingulate gyrus and occipital region of the subjects [17]. Cars are selected as experimental material, and composite image spaces based on cars are created by appropriate Kansei engineering methods to determine the distribution of experimental material in the image space and to provide material for the selection of stimulating material in ERP experiments. In addition, the screening of representative pairs of perceptual images is a necessary link to create a composite image space. According to the actual situation, the similarity matrix method is used to screen the automobile stimuli material [18], and the factor analysis method is used to filter out representative word pairs.
2.1.1. Car Image Filtering
Through relevant research on car styling [19,20] and online car buying platforms and other ways, 78 car images with different image styles were selected. The images were standardized using Adobe Photoshop 2020, and the car logo information was covered to avoid influencing the subjects by car brand. Since this study was not based on the control variables of car design characteristics. Therefore, it was not necessary to exclude the influence of color on the product image. The image resolution ratio was unified, the image background was set to white, and the spatial tilt angle (arc angle with the vertical plane) was set to 45 degrees so that the subjects could clearly see the entire image of the car. Some stimulus materials after processing are shown in Figure 1.
Fifteen industrial designers were invited to prescreen 78 images of automobiles based on their automobile characteristics. A panel of 15 experts meticulously classified the remaining 47 photos based on features including lighting effects, hood designs and contour lines, among others. Images with similar features were placed in a category. The number of images in each category was unlimited and could differ from each other. The number of categories did not exceed 10. Based on the classification results, the similarity between car images was calculated, i.e., how often two groups of car images appear in the same category. The more frequent, the higher the similarity among car images. Finally, a 47 × 47 similarity matrix was created based on the similarity. SPSS 25 was used to cluster and analyze the car images [21]. Based on the similarity matrix, the system finally classified the car images into six categories, and then K-means clustering was performed for the similarity matrix using SPSS 25, as shown in Figure 2.
2.1.2. Selection of Image Words
By consulting the relevant literature on the vocabulary of car images [20,21] with reference to information from shopping platforms and advertising texts, 79 pairs of words related to car images were collected, and 57 pairs of words were finally identified by excluding words with the same or similar meanings. Thirty-eight college students of the Industrial Design Department were recruited. A questionnaire was issued to select the word pairs that could accurately describe the car image from 57 pairs of image words, and the average time to complete the questionnaire was 18 min. After the invalid questionnaires were removed (two of them took less than five minutes to complete, and one took more than two hours to complete), the remaining 35 valid questionnaires were screened and 28 pairs of words were identified. Twenty-two college students from the Department of Industrial Design were recruited and also received a questionnaire based on the semantic differential method. The subjects used 28 word pairs to evaluate six automobile stimulus materials. The questionnaire took the form of a 7-point scale, with scores ranging from −3 to +3. The closer the score to −3, the closer the product image to the picture vocabulary on the left, and the closer the score to +3, the closer the product image to the picture–word pair on the right. Taking the figurative word pair “tough–round” as an example, −3 means “very tough”, −2 means “tough”, −1 means “a little tough”, 0 means “average”, 1 means “a little round”, 2 means “round” and 3 means “very round”. After viewing the corresponding stimulus material, subjects rated according to their subjective feelings, and 22 valid questionnaires were received. The cluster analysis method was used to classify and analyze the intentional vocabulary pairs. Finally, three groups of intentional vocabulary pairs, namely, “classical–modern”, “tough–round” and “speed–stable”, were determined to create an intentional space.
2.1.3. Scoring of Stimulus Materials Based on Product Conformity Intention Space
Based on three pairs of picture words: “classic–modern”, “tough–round”, and “speed–stability”, 78 automotive stimulus materials were evaluated. Similarly, semantic differences were used to create a questionnaire, and the evaluation model of the questionnaire was created in the form of a 7-point scale. The scale value ranged from −3 to +3. The closer the value was to −3, the closer the product image was to the image word on the left, and the closer the value was to +3, the closer the product image was to the image word pair on the right. Forty-eight students from Industrial Design College were recruited to complete the questionnaire. Based on the dimensions of three image word pairs, the stimulus materials were quantified and evaluated. Finally, the remaining 44 questionnaires were available to calculate the average semantic value of each stimulus material. So far, the creation of the composite image space has been completed.
From 78 car pictures, 10 images with three kinds of image semantic matching degree were selected as the stimulus materials for the EEG experiment. For example, for “classical–modern” word pairs, 10 car pictures with the highest semantic value score, the middle semantic value score (the score is closest to 0), and the lowest semantic value score are selected. They represent three kinds of semantic matching degrees in “classical–modern” word pairs: image consistent (highest semantic value score), image neutral (middle semantic value score) and image inconsistent (lowest semantic value score). For the other two pairs of image word pairs (“tough–round“ and ”speed–steady”), the experimental stimulus materials were selected using the same method, and a total of 90 stimulus materials were obtained. The stimulus materials of the different picture–word pairs may be reused.
2.2. Recruitment of Experimental Subjects
A total of 27 college students were recruited for the study, including 16 males and 11 females, aged 21–28 years. All subjects were right-handed, undergraduate or postgraduate, with no history of mental illness or mental disease, normal or corrected-to-normal vision, no professional knowledge of the automobile industry, and no apparent preference for automobile brands (to avoid an unconscious preference for a particular type of automobile based on professional knowledge). After the experiment, subjects were paid CNY 50 as a reward.
2.3. Experimental Equipment Information
The ERP experimental units were equipped with the SynAmps 8050 ERP data acquisition and analysis system from Neuroscan, and the ERP signals were acquired with 64-channel ERP electrodes.
2.4. Experimental Process
The “start–target” paradigm is a fundamental paradigm in ERP experiments. Usually, an experiment is divided into two phases, the start phase and the target phase. In research, the “start–target” paradigm is used to conduct experiments [22]. In the start phase, the experimental stimulus material consisted of car pictures, while in the target phase, picture words were presented. In the full experimental trial, as shown in Figure 3, the guidance language was first presented to ask subjects to judge a picture–word based on the picture, then a black cross was displayed at the central position of the screen, which lasted randomly for 800–1000 ms. After, a car was shown at the central position of the screen in the start phase, which lasted for 2000 ms (i.e., start phase), and then a blank screen appeared for 800–1000 ms. The purpose of the blank screen is to remove visual residue. Finally, a visual vocabulary of 2000 ms appeared in the middle of the screen (i.e., target phase). Subjects had to judge using their subjective perception whether the car stimulus materials appearing in the starting phase were consistent with the visual vocabulary appearing in the target phase. If the image was consistent, they clicked the “F” key on the keyboard. If the image was inconsistent, they clicked the “J” key. If the image was neutral, they pressed the “B” key. E-prime3.0 software was used to program the experimental paradigm and collect the behavioral data.
The experiment adopted a mixed experimental design of 3 (three pairs of image words: “classical–modern”, “tough–round” and “sense of speed—sense of smoothness”) × 3 (image matching, image neutral and image not matching) × 2 (two poles of a pair of image words, such as “classical” and “modern”). The stimulus materials were divided into six groups (corresponding to the six image words) and presented immediately. Each group had 30 stimulus materials, which were also presented immediately. A total of 180 trial were conducted. Considering the fatigue of the subjects in the ERP experiment, the subjects took a minute break and relaxed after every 60 trials, so the whole experiment took approximately 25 min.
3. Analysis of Experimental Data
3.1. Experimental Data Recording
Behavioral data were collected during the experiment mainly using the E-prime software. Data included the time (reaction time) required for subjects to respond to the target stimulus and the correct rate (correct rate) of subject selection.
3.1.1. Reaction Time Analysis
Response time data are automatically collected according to the time keys needed for subjects to make appropriate responses after the target stimulus appears. In this experiment, this refers to the time required for the subjects to judge the semantic matching degree of the image words (image consistent, image neutral and image inconsistent) after the appearance of the image words in the target phase.
For the reaction time, a repeated-measures analysis of variance (MANOVA) was used to analyze intention word pairs and semantic matching reaction time. Image word pairs were used as intergroup factors and semantic matching as intragroup factors. The results show that image words had a significant main effect, F (2, 18) = 168.126, p < 0.001. Semantic matching also had a significant main effect, F (2, 18) = 184.873, p < 0.001. The interaction effect between the lexical pairs and the degree of agreement was not significant, F (4, 16) = 2.845, p = 0.059. From the analysis of the semantic matching analysis, the subjects’ reaction time was the longest when the semantic value of the image was neutral. When the semantic value of the image was ambiguous, subjects consumed more cognitive resources to make a judgement, which required more thinking time.
3.1.2. Accuracy Analysis
In the experiment, if the result of the subject’s assessment of the degree of semantic matching of the stimulus material agreed with the result of the semantic value classification, the answer was considered correct. Otherwise, it was considered incorrect. According to the statistics of the accuracy rate, the accuracy rate of the image consistent was slightly higher than that of the image inconsistent, while the accuracy rate of the image neutral was the lowest.
The accuracy rate was analyzed using the analysis of variance with repeated measures of image word pairs and semantic matching accuracy rate. Image word pairs were used as intergroup variables and semantic matching as intragroup variables. The results showed that image word pairs had significant main effects, F (2, 18) = 23.941, p < 0.001; semantic matching also had a significant main effect, F (2, 38) = 19.924, p < 0.001. There was some interaction effect between image word pairs and semantic matching, F (4, 76) = 3.326, p = 0.014. From the results, subjects had a higher matching rate when they judged the stimulus materials with image consistent, and the matching rate was lowest when they judged the stimulus materials with image neutral. However, for the image neutral stimulus materials, the accuracy rate was still 77.8%.
3.2. ERP Experimental Data Analysis
The ERP data analysis followed the “start–target” paradigm, which was mainly divided into the start phase and the target phase. These two phases included the analysis of the brain region activation sites and the analysis of ERP components, respectively.
The start phase refers to the time period during which the vehicle stimulus was presented on the screen. During this period, subjects recognize the stimulus material and simultaneously compare it with the visual vocabulary in the experimental instructions. Consequently, participants engage in cognitive processing, allocate attentional resources, undergo semantic processing and partake in various other cognitive processes.
The target phase refers to the period of the presentation of the image vocabulary in which subjects must judge whether the stimuli presented in the start phase match the image vocabulary in the target phase and quickly press the keyboard to respond. This period mainly involves the subjects’ cognitive activities, such as semantic processing and working memory updating.
3.2.1. ERP Data Pre-Processing
Curry 8.0 software was used for data processing in the experiment. The M1 and M2 electrodes at the mastoid were set as reference electrodes, 30 Hz low-pass filtering was selected, and four eye electrodes at VEOU, VEOL, HEOL and HEOR were set to remove artifacts. During the entire experiment, the experimenters had to ensure that the electrodes were fixed in good condition, and the resistance value of all electrodes had to be lower than 15 kΩ before the experiment started to obtain high-quality EEG data. The sampling rate was set to 1000 Hz, and 30 Hz low-pass filtering was used to remove high-frequency noise. In the start phase, 200 ms before stimulus presentation was selected and 1000 ms after stimulus presentation as the standard for segmentation; 200 ms was selected before stimulus presentation as the baseline correction: and the ERP data of six experimental trials into two (“classical” and “modern”, “tough” and “round”; “speed” and “steady”) in order to complete the preprocessing of ERP data. After preprocessing the data, the available data from the remaining 20 subjects were reviewed.
3.2.2. Startup Phase P300
The ERP data from 200 ms before stimulus presentation to 1000 ms after stimulus presentation were selected for analysis in the initial phase. The topographic map of the brain area is shown in Figure 4. From the figure, it can be seen that there was obvious positive activation in the occipital area and left prefrontal lobe during the period of 200–400 ms, while there was obvious negative activation in the right prefrontal lobe during the period of 300–500 ms. As shown in Figure 5, there was an apparent P300 component during the period 200–500 ms and an obvious N400 component during the period 300–600 ms, and then there was a late positive component at 600–700 ms. According to the topographic map of the brain and the overall waveform, the energy of the left frontal area gradually increased in the period of 200–300 ms, indicating the presence of P300 components. The energy of the left frontal area increased significantly in the period of 300–500 ms, and the P300 component peaked. In addition, the energy of the right frontal area decreased significantly during the 300–500 ms period, resulting in N400 components. Late components occurred after 600 s.
For the P300 components, we selected the average amplitude of ERP during the 300–400 ms period of the start phase for RMANOVA and took the distribution positions of brain electrodes (frontal electrodes (AF3 and AF4), superior electrodes (FC5 and FC6), occipital electrodes (O1 and O2)) as the intergroup variables and three groups of image words pairs and three types of semantic matchings as intragroup variables. The results showed that the degree of semantic matching and the position of the electrodes in the brain region had a large effect on the P300 components, and the degree of semantic matching had a significant main effect, F (2, 18) = 52.962, p < 0.001. The electrode position in the brain region had a significant main effect, F (5, 92) = 21.092, p < 0.001. There was a significant interaction effect between image word pairs and semantic matching, F (10, 10) = 5.828, p = 0.005. There was an interaction effect between semantic matching degree and brain area distribution, F (10, 10) = 4.841, p = 0.01. A paired t-test was performed for the distribution position of electrodes in the brain area. It can be seen that the average amplitude was highest at electrode AF3, which is consistent with the topographic map of the ERP, as shown in Figure 6. Therefore, electrode AF3 was selected for further analysis of the P300 components.
For each type of image–word pair in AF3, stimulus materials with different levels of degrees of semantic matching induced P300 components with different amplitudes. The average amplitude of the P300 components induced using “tough-round” and “speed-steady” was the image inconsistent > image neutral > image consistent, while the P300 components induced using “classic-modern” were slightly different. The result is that image consistent > image inconsistent > image neutral. Based on the paired t-test of three groups of image words with different levels of degrees of semantic matching, it can be concluded that for the average P300 amplitude induced using “classical-modern” word pairs, there was no significant difference between image consistent and image inconsistent, t = 1.056, p = 0.252. The average amplitude of image neutral P300 was significantly lower than that of the image consistent and image inconsistent. The conclusion for the word pair “tough-round” and “speed-steady” was similar, i.e., image inconsistent > image neutral > image consistent. A small difference was that for the word pair “tough-round”, there was also a significant difference between image neutral and image inconsistent, t = 2.254, p = 0.036.
3.2.3. Startup Phase N400
For the N400 component, the average amplitude of the ERP in the period of 350–500 ms during the start phase was selected for RMANOVA, and the distribution position of the brain electrodes (frontal electrodes (AF3, AF4, F7 and F8), occipital electrodes (O1 and O2)) were taken as intergroup variables, three groups of image words pairs (classical–modern, tough–round and speed–steady) and three types of semantic matching (image consistent, image neutral and image inconsistent) were used as variables within the group. The results showed that image word pairs, semantic matching and electrode distribution in brain regions all had some influence on the average amplitude of N400 components. Image words pairs had a main effect, F (1.757, 33.374) = 5.989, p = 0.005; semantic matching had a significant main effect, F (1.656, 31.464) =17.811, p < 0.001; and there was a significant main effect on the location of electrodes in the brain area, F (5, 15) = 31.513, p < 0.001. There was a significant interaction between image word pairs and semantic matching, F (7, 16) = 4.596, p = 0.001. There was an interaction effect between brain region distribution and semantic matching, F (10, 10) = 5.528, p = 0.006. The paired t-test of the brain region electrode distribution position showed that electrode F8 had a higher N400 amplitude than other electrodes, and the difference was significant, as shown in Figure 7. Therefore, electrode F8 was selected as the target electrode for the N400 component in the initial phase of the research.
For each type of image word pair in the F8 electrode, stimulus materials with different degrees of semantic matching induced N400 components with different amplitudes. Among them, the N400 amplitude induced using an image neutral was the highest, followed by an inconsistent image, and the N400 amplitude induced using an image consistent was the lowest. Paired t-tests with different levels of semantic matching were performed based on three groups of image words. For the three types of image–word pairs, the N400 waveform showed a relatively consistent trend, i.e., N400 with the highest amplitude induced using image neutral, followed by image inconsistent and N400 with the lowest amplitude induced using image consistent. For the “classical–modern” word pair, the difference between image consistent and image neutral was significant, t = 5.06, p < 0.001, the difference between image consistent and image inconsistent was significant, t = 4.904, p < 0.001, and the difference between image neutral and image inconsistent was significant, t = −3.139, p = 0.005. For the “tough round” word pair, the difference between image consistent and image neutral was significant, t = 6.283, p < 0.001, the difference between image consistent and image inconsistent was significant, t = 4.928, p = 0.000, and the difference between image neutral and image inconsistent was significant, t = −3.28, p = 0.005. For the word pair of “speed–steady”, the difference between image consistent and image neutral was significant, t = 4.962, p < 0.001, the difference between image consistent and image inconsistent was significant, t = 3.395, p = 0.004, and the difference between image neutral and image inconsistent was significant, t = −4.575, p < 0.001.
3.2.4. Target Phase P300
In the target phase, ERP data from 200 ms before stimulus presentation to 1000 ms after stimulus presentation were selected for analysis. The topographic map of the brain area is shown in Figure 8. From the figure, it can be seen that there was significant positive activation in the occipital area within 100–300 ms and significant negative activation in the apical area within 300–500 ms. The amplitude of the electrode POZ is shown in Figure 9. According to the topographic map of the brain and the overall waveform, the energy in the occipital area increased gradually during the period 100–200 ms, indicating the presence of P300 components; during the period of 200–400 ms, the energy in the occipital area increased significantly, and the P300 component peaked; in addition, the energy in the superior area decreased significantly during the period of 300–500 ms, and the N400 component peaked. The P300 component is significantly related to working memory updating, while the N400 component is related to semantic processing and semantic conflicts. The P300 component is explained here. As subjects were asked to judge the stimulus materials presented in the initial phase based on the image vocabulary, they will recall the image style corresponding to the stimulus materials presented before making a judgment, so the P300 component appears.
For the P300 components, the average amplitude of the ERP in the target period of 200–300 ms was selected for RMANOVA, and the distribution positions of the brain electrodes (frontal electrodes (AF3 and AF4), top electrodes (FC5 and FC6), occipital electrodes (POZ and O1)) were taken as intergroup variables, three groups of image–word pairs (classical–modern, tough–round and speed–steady) and three types of semantic matchings (image consistent, image neutral and image inconsistent) were used as within-group variables. The results show that the degree of semantic matching and the position of the electrodes in the brain region had a larger effect on the P300 components, and the degree of semantic matching had a significant main effect, F (1.954, 31.123) = 8.626, p = 0.001; the distribution position of the electrodes in the brain area had a significant main effect, F (5, 15) = 14.717, p < 0.001. There was a significant interaction between image word pairs and semantic matching, F (7, 16) = 9.838, p = 0.001; there was an interaction effect between the degree of semantic matching and the position of the electrode distribution in the brain area, F (10, 10) = 8.066, p = 0.001. The paired t-test of the electrode distribution in the brain area shows that the average amplitude at electrode POZ was the highest, while that at electrode FC5 was the lowest, which is consistent with the topographic map of the ERP, as is shown Figure 10. So the electrode POZ was selected for further analysis of the P300 components.
The amplitude of P300 triggered by different types of image words in the electrode POZ differed to some extent. For the “classical–modern” word pairs, the amplitude of P300 triggered by image neutral was the highest, followed by the amplitude of image consistent and image inconsistent. For the “tough–round” word pair, the amplitude of P300 triggered by image inconsistent was highest, followed by image neutral, and the amplitude of image consistent was lowest. For the word pair “speed–steady”, the amplitude of induction from image consistent was highest, followed by image neutral, and the amplitude of induction from image inconsistent was lowest. Based on the paired t-test of three groups of image words under different degrees of semantic matching, it can be seen that the P300 waveform shows significant differences for the three groups of image word pairs. For the word pairs “classical–modern”, the difference between image consistent and image neutral was significant, t = −3.314, p = 0.003, and the difference between image neutral and image inconsistent was significant, t = 3.116, p = 0.005. For the word pair “tough–round”, the difference between image consistent and image inconsistent was significant, t = −3.55, p = 0.002, and the difference between image neutrality and image inconsistent was significant, t = −2.941, p = 0.009. For the word pair “speed–steady”, the difference between image consistent and image neutral was significant, t = 3.651, p = 0.002, the difference between image consistent and image inconsistent was significant, t = 5.168, p < 0.001, and the difference between image neutral and image inconsistent was significant, t = 3.273, p = 0.004.
3.2.5. Target Phase N400
For the N400 component, the average amplitude of the ERP in the 250–400 ms period during the start phase was selected for RMANOVA, and the distribution positions of the brain electrodes (frontal electrodes (AF3 and AF4), top electrodes (FC1 and FC2) and occipital electrodes (O1 and O2)) were taken as the intergroup variables; three groups of image word pairs (“classical–modern”, “tough–round” and “speed–steady”); and three types of semantic matchings (image consistent, image neutral and image inconsistent) were used as the within-group variables. The results showed that image word pairs, semantic matching and distribution of electrodes in brain regions all had some effect on the average amplitude of the N400 components. Image word pairs had a main effect, F (1.757, 33.374) = 5.986, p = 0.008; semantic matching had a significant main effect, F (1.954, 31.123) = 8.626, p = 0.001. There was a significant main effect on the location of electrodes in the brain region, F (5, 15) = 14.717, p < 0.001. There was a significant interaction between image word pairs and semantic matching, F (3.039, 57.750) = 4.757, p = 0.005. There was an interactive effect between the location of the electrodes in the brain area and semantic matching, F (10, 10) = 3.924, p = 0.021.
The paired t-test of the electrode distribution in the brain region shows that electrode FC2 has a higher N400 amplitude than other electrodes, and the difference was very significant, as shown Figure 11. Therefore, electrode FC2 was selected as the target electrode for the N400 components in the initial phase of the research.
For each group of image–word pairs in the FC2 electrode, the stimulus materials with different levels of degrees of semantic matching induced N400 components with different amplitudes, with the image-neutral induced N400 amplitude being the highest, followed by the image-inconsistent and the image-consistent induced N400 amplitude being the lowest. Based on the paired t-test of three image–word pairs with different degrees of semantic matching, it can be seen that the amplitude of the N400 waveform was slightly different among the three groups of image–word pairs. For the word pair “classical–modern”, the N400 amplitude of image neutral was the largest, and the N400 amplitude of image consistent was the smallest. There was a significant difference between image consistent and image neutral, t = 3.921, p = 0.001. There was a significant difference between image consistent and image inconsistent, t = 2.692, p = 0.014. There was a significant difference between image neutral and image inconsistent, t = −3.383, p = 0.003. For the “tough–round” word pair, the N400 amplitude of image neutral was the largest, and the N400 amplitude of image consistent was the smallest. The difference between image consistent and image neutral was significant, t = 3.335, p = 0.004. The difference between image consistent and image inconsistent was significant, t = 2.579, p = 0.019. The difference between image neutral and image inconsistent was significant, t = −2.741, p = 0.013. For the word pair of “speed–stable”, the difference between image neutral and image inconsistent was not significant, the N400 amplitude of image neutral was the lowest, the difference between image consistent and image inconsistent was significant, t = 2.192, p = 0.043, and the difference between image neutral and image consistent was significant, t = 2.336, p = 0.035.
3.3. Discussion
Analysis of the ERP data and topographic map revealed that the P300 component occurred significantly in the 300–400 ms period of the start phase. Compared to three groups of image–word pairs, the P300 amplitude induced using image neutral was lower than that of image inconsistent. For the word pairs “tough–round” and “speed–steady”, the trend of P300 amplitude was image inconsistent > image neutral > image inconsistent. For the word pair “classical–modern”, the image consistent had the highest P300 amplitude. From a behavioral point of view, it can also be observed that the response time of “classical–modern” word pairs was generally long, and the accuracy rate was generally low, which suggests, to some extent, that the task difficulty of “classical–modern” word pairs was greater than that of the other two types of word pairs. The N400 amplitude occurred in the 350–500 ms period because it was in the starting phase, i.e., subjects with N400 components triggered with non-semantic stimuli were told to make judgments based on an image vocabulary in the subsequent target phase, which meant that after subjects viewed the car pictures in the starting phase, the brain will compare the image words in advance, so N400 components appeared. The same rule applied to the average amplitude of N400 for the three groups of image word pairs that had the same rule, that is, image neutral > image inconsistent > image consistent.
In the target phase, the latency of the P300 and N400 components was relatively early. P1, N1, P2, and other components appeared in the 0–200 ms period after the presentation of the stimulus, and P300 components with much shorter latency appear in the 200–300 ms period. For the three groups of image–word pairs, the P300 amplitudes induced using different degrees of semantic matching have their own rules: for the word pairs “classical–modern”, image neutral > image consistent > image inconsistent. For the word pair “tough–round”, the image inconsistent > image neutral > image consistent. For the word pair “speed–steady”, the image consistent > image neutral > image inconsistent. In addition, there were obvious N400 components at 250–400 ms. N400 was usually triggered by words and phrases that did not match or violate semantic expectations. Here, N400 was triggered by image words presented in the target phase. For three groups of image words, the average amplitude of N400 also had a consistent rule: image neutral > image inconsistent > image consistent (i.e., mismatched stimulus materials induce higher N400 amplitude), and the study found that image-neutral stimulus materials can induce the highest N400 amplitude.
4. SVM-Based Classification Model of Semantic Matching between Physiological Data and Image
4.1. Data Normalization and Abnormal Value Processing
ERP data and behavioral data were used as input to the model, and the semantic match (image consistent, image neutral and image inconsistent) was used as output to build the model. The behavioral data were mainly related to response time, and the ERP data consisted of the start phase and target phase. In the start phase, three ERP components, P300, N400 and the late positive component (LPP), were selected; and in the target phase, two ERP components, P300 and N400, were selected. See Table 1 for the location of the electrodes and the interception periods. A total of 12 features were selected. To ensure sufficient model data, the example training data set consisted of ERP data from 35 subjects with 630 sample points. The StandardScaler.fit_transform() function in the sklearn package was used for normalization.
4.2. SVM Kernel Function Selection and Parameter Optimization
Linear kernel function, polynomial kernel function, Gaussian kernel function and sigmoid kernel function are selected for the preliminary test, 70% of the samples are used as a training set and 30% as a test set, the results are shown in Table 2.
It can be seen from the table that the Gaussian kernel function has a high accuracy rate. Therefore, the further parameter adjustment for the Gaussian kernel function is mainly to adjust the penalty coefficient C and the gamma value. For Gaussian kernel function, gamma is one of its own parameters, and its expression is: gamma = , the gamma value is inversely proportional to the value in the expression, which reflects the balance between the generalization ability of the model and the accuracy of the model. If the value is too small, the relationship between the features will become smaller, the learning process will be more complicated, and the generalization ability will correspondingly decrease. If the value is too large, various features will affect each other, and the accuracy of the model will decrease. The exhaustion method was used to estimate the gamma value parameters and draw the learning curve, as shown in Figure 12. As shown in Figure 12a, the range of gamma value is , the step length is 50, the accuracy rate is 93.3%, gamma = 0.752. In Figure 12b, the range of gamma value is extended to , and the step size is 50. The accuracy is 92.78% and gamma = 0.625, and the accuracy becomes stable after the gamma value exceeds 20, so it is unnecessary to extend the gamma value. In Figure 12c, the gamma value range is restored to with 100 steps, and the accuracy is 92.78%, gamma = 0.599. Therefore, it can be seen gamma that 0.752 is appropriate.
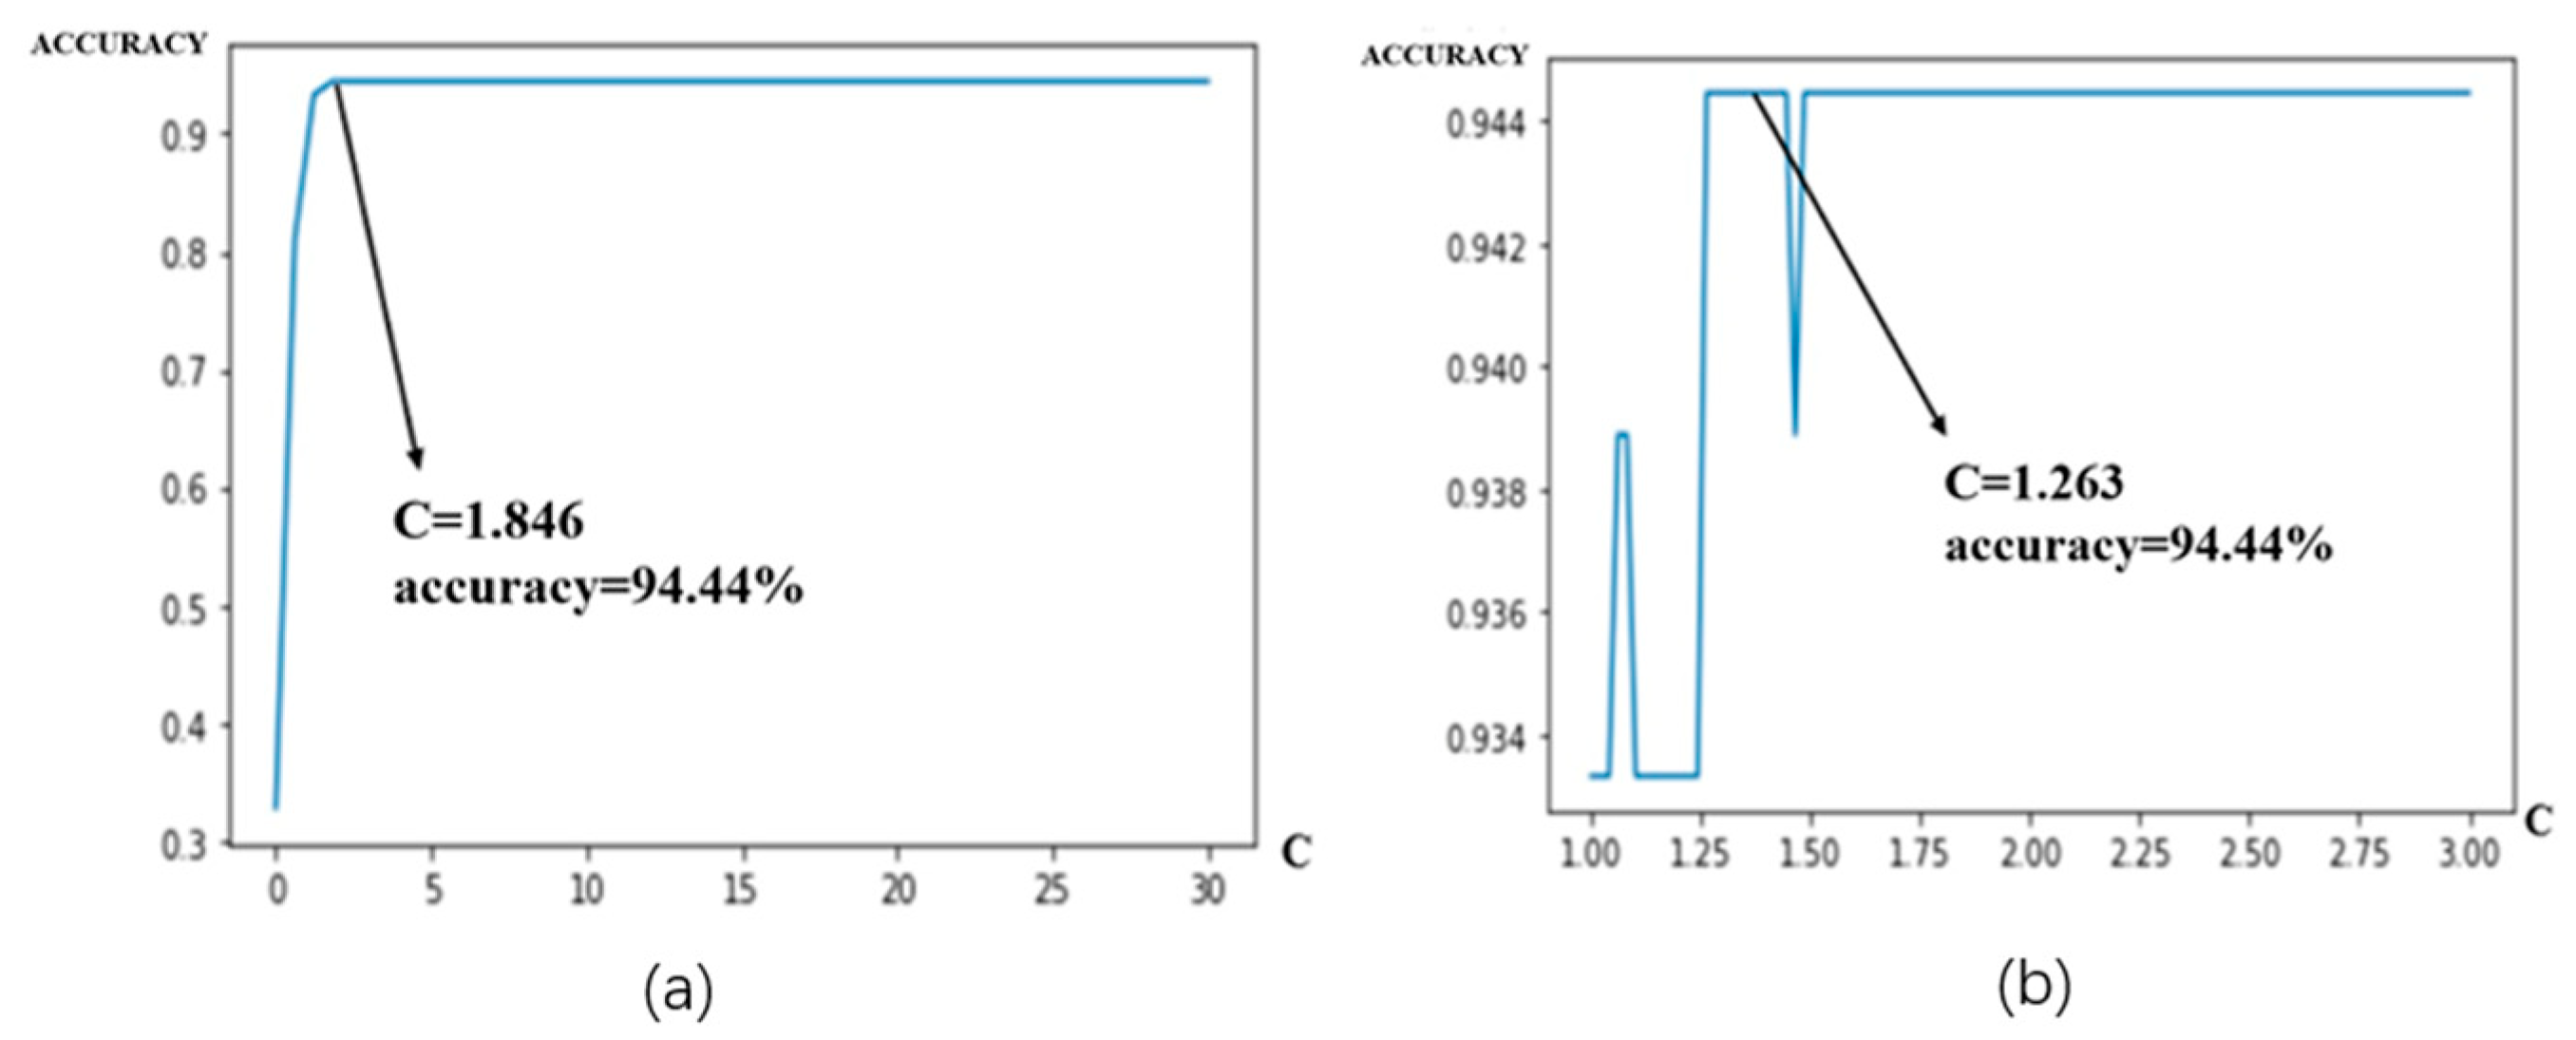
In the determination, the gamma after the value was 0.752, the C values were enumerated and a learning curve was drawn. As shown in Figure 13a, the C value range was , the step size was 50, the accuracy rate was 94.44%, and C = 1.846; as shown in Figure 13b for C, the value range was narrowed to , the step size was 100, the accuracy can be 94.44%, and C = 1.263.
In summary, we can know from the drawing of the learning curve gamma that the value is 0.752. If the C value is 1.263, the accuracy can reach 94.44%. Now the results are checked using the grid search method. The grid search method is also an algorithm to find the optimal combination of parameters using means of exhaustion. The specific ideas are as follows: First, the value range and step size of the target parameters are determined, and then all parameters are arranged and combined. Finally, all combinations are generated into a “grid”, and each combination is substituted into the model for learning and training. Then, the accuracy of the model is evaluated one by one, and the combination with the highest accuracy of the model is selected as the best parameter combination. It was found that when drawing the learning curve C value and gamma suitable value range, the C value range was [0.01, 5], the step length was 50, the gamma value range was , and the step size was 50. There were 2500 combinations in total. The sklearn model selection with the Grid Search CV function and the Stratified ShuffleSplit function in the selection package were used for grid search operations. A 10-fold cross-validation was performed, and 70% of the samples were selected as the training set and 30% as the test set. Finally, C = 1.2341 and gamma = 0.4498 was the best combination, and the accuracy was 95.667%.
5. Conclusions and Shortcomings
ERP technology and behavioral data were used to explore the relationship between the appearance of the product and consumers’ image words, analyze the whole product perception experiment in different time periods and ERP amplitudes, and provide objective physiological data for product perception. It provides an important theoretical basis for systematic acquisition of product image and improvement of product image cognitive model. At the same time, the SVM model was built with ERP data and behavioral data as input and the degree of image matching as output, and its reliability was verified, which confirmed that the average amplitude of ERP components could be used as an effective feature parameter for classifying the semantic matching degree and provide a reference for future researchers to explore ERP and product image in depth. At the same time, the experiment also has shortcomings: The P300 amplitude of the word pair “classical–modern” in the start phase can be studied in more detail, the word pair can be further refined and classified, and the mechanism of P300 induced using different degrees of semantic matching under the word pair can be studied in combination with the relevant theoretical research of P300 components. In addition, the relationship between the late positive component (LPP) and product image needs further investigation. The sample data in the model created in the experiment are small, and the number of subjects can be increased in further research to further improve the accuracy of the model.
Author Contributions
Y.L. designed the experiment; H.L. and W.S. used the EEG instruments to record the physiological data and e-prime software to record behavioral data; C.L. and Y.L. analyzed and processed the experimental data; H.L. edited the first draft of the paper; Y.L. and C.L. revised the paper. All authors have read and agreed to the published version of the manuscript.
Funding
Humanities and Social Science Research Project of Ministry of Education. (No. 20YJA760067); Cooperative Research Project between CRRC Zhuzhou Locomotive and Huaqiao University (2021-0015).
Institutional Review Board Statement
This project has been approved by the ethics review body of Huaqiao University School of Medicine.
Informed Consent Statement
Informed consent was obtained from all subjects involved in the study.
Data Availability Statement
The datasets supporting the results of this article are included within the article.
Acknowledgments
We would like to thank all participants of this study.
Conflicts of Interest
The authors declare no conflict of interest.
References
- Chen, K.; Owen, C.L. Form language and style description. Des. Stud. 1997, 18, 249–274. [Google Scholar]
- Shieh, M.D.; Hsu, F.C.; Huang, C.W. A study on the relationship between form features and images of concept bicycles using the theory of archetype. In Proceedings of the HCI International 2017–Posters’ Extended Abstracts: 19th International Conference, HCI International 2017, Vancouver, BC, Canada, 9–14 July 2017; Proceedings, Part II 19. Springer International Publishing: Cham, Switzerland, 2017; pp. 602–611. [Google Scholar]
- Lancaster, L. The Cognitive Neuroscience of Consciousness, Mysticism and Psi. Int. J. Transpers. Stud. 2011, 30, 11–22. [Google Scholar] [CrossRef]
- Su, J.N.; Zhang, X.X.; Jing, N.; Chen, X. Research on the entropy evaluation of product styling image under the cognitive difference. J. Mach. Des. 2016, 33, 105–108. [Google Scholar]
- Rosch, E. Principles of Categorization; Collins, A., Smith, E.E., Eds.; Readings in Cognitive Science; Morgan Kaufmann: Burlington, MA, USA, 1988; pp. 312–322. [Google Scholar]
- Maguire, M.J.; McClelland, M.M.; Donovan, C.M.; Tillman, G.D.; Krawczyk, D.C. Tracking cognitive phases in analogical reasoning with event-related potentials. J. Exp. Psychol. Learn Mem. Cogn. 2012, 38, 273–281. [Google Scholar] [CrossRef] [PubMed] [Green Version]
- Bahn, S.; Lee, C.; Nam, C.S.; Yun, M.H. Incorporating affective customer needs for luxuriousness into product design attributes. Hum. Factors Ergon. Manuf. Serv. Ind. 2009, 19, 105–127. [Google Scholar] [CrossRef]
- Zhou, Z.; Cheng, J.; Wei, W.; Lee, L. Validation of evaluation model and evaluation indicators comprised Kansei Engineering and eye movement with EEG: An example of medical nursing bed. Microsyst. Technol. 2021, 27, 1317–1333. [Google Scholar]
- Ghani, U.; Signal, N.; Niazi, I.K.; Taylor, D. ERP based measures of cognitive workload: A review. Neurosci. Biobehav. Rev. 2020, 118, 18–26. [Google Scholar] [PubMed]
- Moya, I.; García-Madariaga, J. Is a video worth more than a thousand images? A neurophysiological study on the impact of different types of product display on consumer behaviour in E-commerce. In Advances in Digital Marketing and eCommerce: Third International Conference 2022; Springer International Publishing: Cham, Switzerland, 2022; pp. 300–306. [Google Scholar]
- Jai, T.M.; O’Boyle, M.W.; Fang, D. Neural correlates of sensory-enabling presentation: An fMRI study of image zooming and rotation video effects on online apparel shopping. J. Consum. Behav. 2014, 13, 342–350. [Google Scholar] [CrossRef]
- Liu, W.; Liang, X.; Wang, X.; Guo, F. The evaluation of emotional experience on webpages: An event-related potential study. Cogn. Technol. Work. 2019, 21, 317–326. [Google Scholar] [CrossRef]
- Wan, Q.; Li, X.; Zhang, Y.; Song, S.; Ke, Q. Visual perception of different wood surfaces: An event-related potentials study. Ann. For. Sci. 2021, 78, 25. [Google Scholar] [CrossRef]
- Chen, J.; Cheng, Y. The relationship between aesthetic preferences of people for ceramic tile design and neural responses: An event-related potential study. Front. Hum. Neurosci. 2022, 16, 792. [Google Scholar] [CrossRef] [PubMed]
- Wang, J.; Wang, A.; Zhu, L.; Wang, H. The Effect of Product Image Dynamism on Purchase Intention for Online Aquatic Product Shopping: An EEG Study. Psychol. Res. Behav. Manag. 2021, 14, 759–768. [Google Scholar] [CrossRef] [PubMed]
- Deng, L.; Wang, G. Application of EEG and Interactive Evolutionary Design Method in Cultural and Creative Product Design. Comput. Intell. Neurosci. 2019, 2019, 1860921. [Google Scholar] [CrossRef] [Green Version]
- Erk, S.; Spitzer, M.; Wunderlich, A.P.; Galley, L.; Walter, H. Cultural objects modulate reward circuitry. Neuroreport 2002, 13, 2499–2503. [Google Scholar] [CrossRef]
- Shen, X.X.; Yang, Y.W.; Xiao, G.Q.; Xu, Y.M.; Chen, X.Z. Ant Colony Clustering Algorithm Based on Similarity. Comput. Digit. Eng. 2021, 49, 1052–1057. [Google Scholar]
- Lu, Z.; Li, S.; Xu, S.; Cheng, B. Automobile style evaluation based on eye tracking. J. Tsinghua Univ. (Sci. Technol.) 2015, 55, 775–781. [Google Scholar]
- Ma, L.; Lv, J.; Shan, J.; Pan, W. Design Method of Automobile Modeling Feature Line Based on Eye Movement Tracking. Packag. Eng. 2019, 40, 234–241. [Google Scholar]
- Chen, L.; Xu, X.; Chen, Y.X. An adaptive ant colony clustering algorithm. In Proceedings of the 2004 International Conference on Machine Learning and Cybernetics (IEEE Cat. No. 04EX826), Shanghai, China, 26–29 August 2004; IEEE: Piscataway, NJ, USA, 2004; Volume 3, pp. 1387–1392. [Google Scholar]
- Guo, F.; Li, M.; Hu, M.; Li, F.; Lin, B. Distinguishing and quantifying the visual aesthetics of a product: An integrated approach of eye-tracking and EEG. Int. J. Ind. Ergon. 2019, 71, 47–56. [Google Scholar] [CrossRef]
Figure 1.
Automotive stimulating materials.
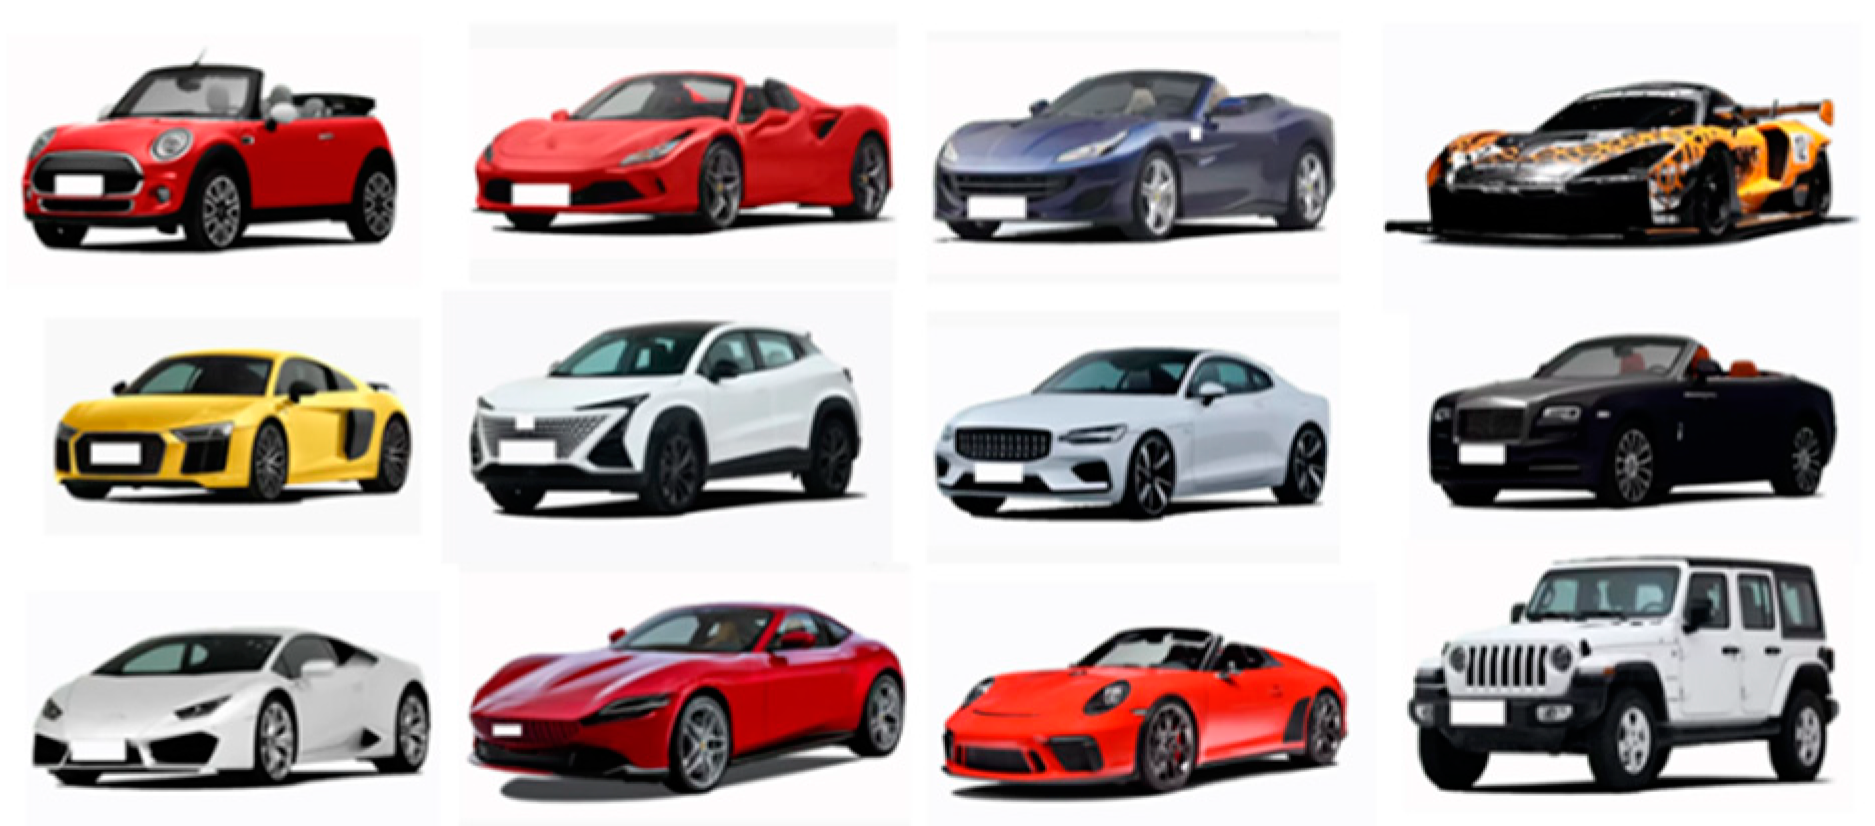
Figure 2.
Typical car pictures.
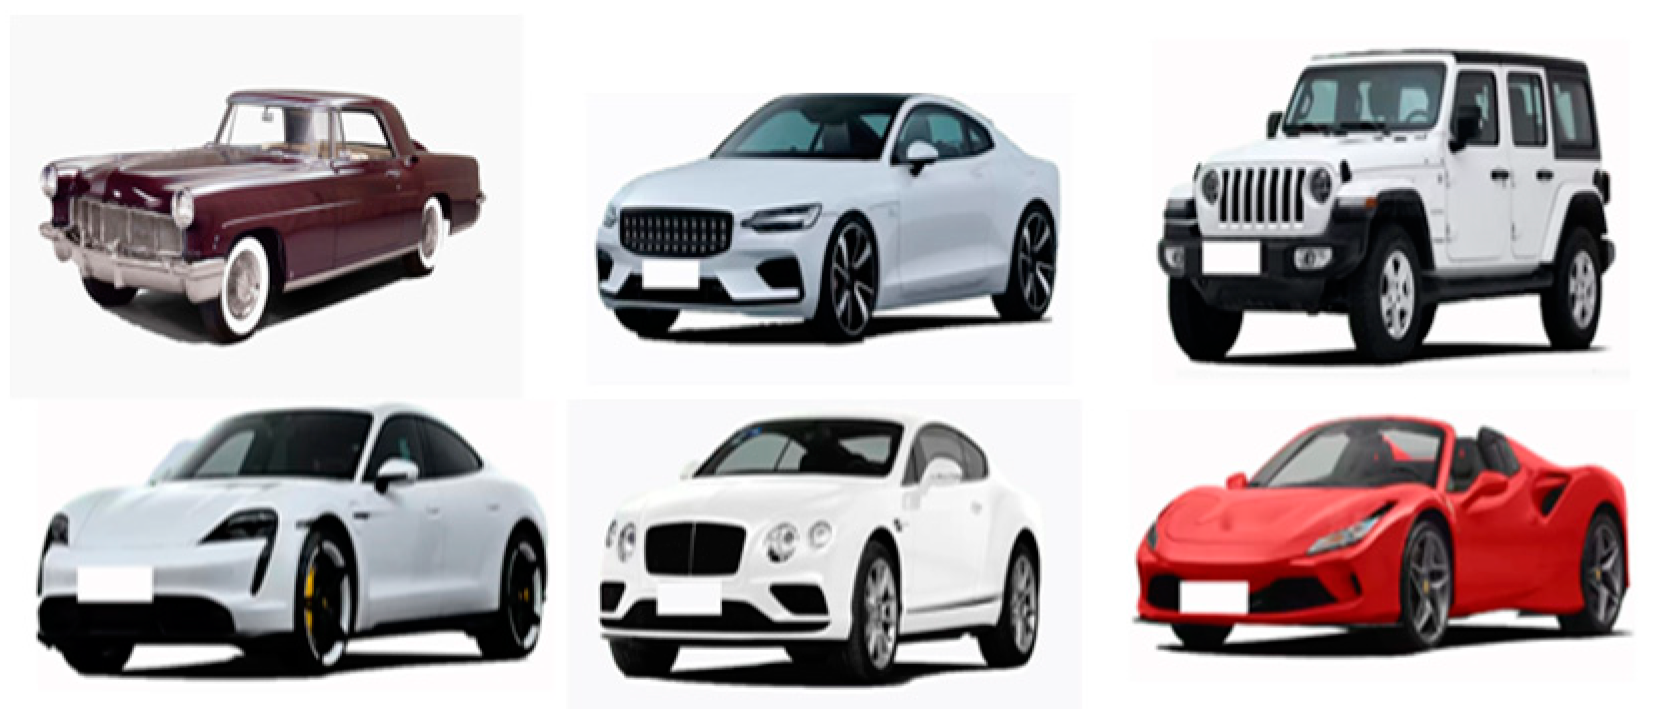
Figure 3.
Experimental process.
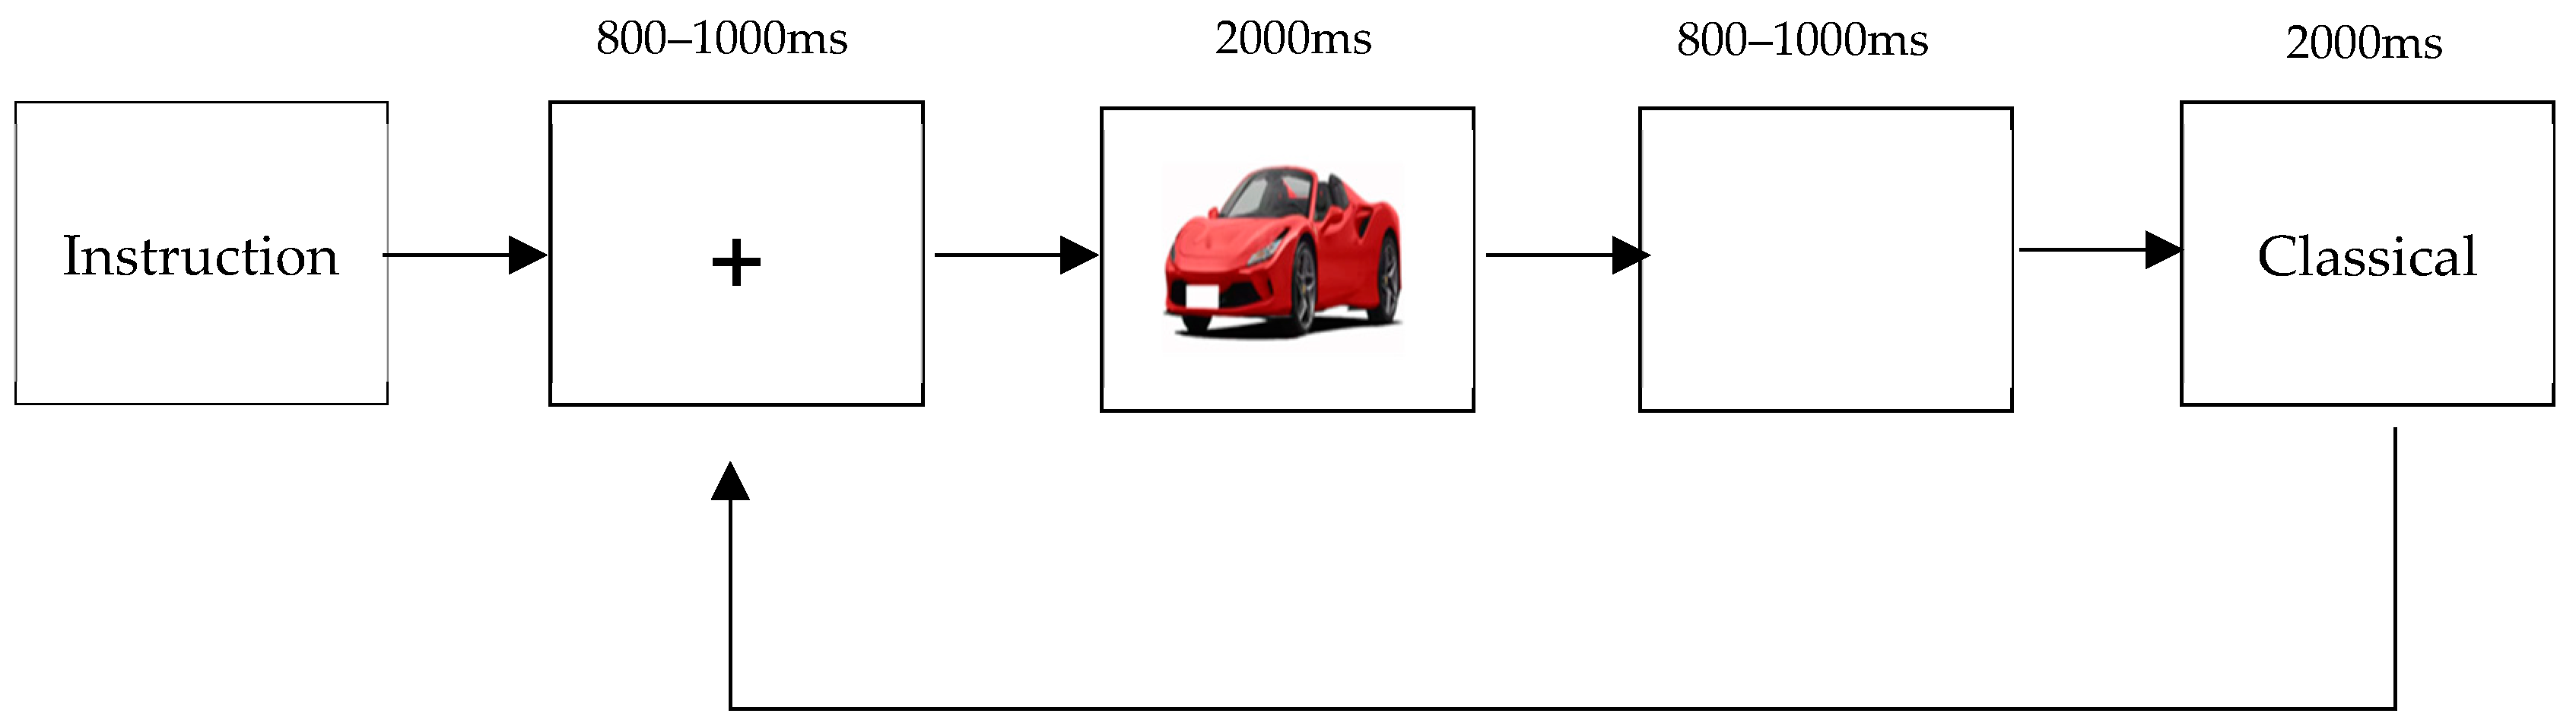
Figure 4.
Topographic map of a brain area in the start-up phase.
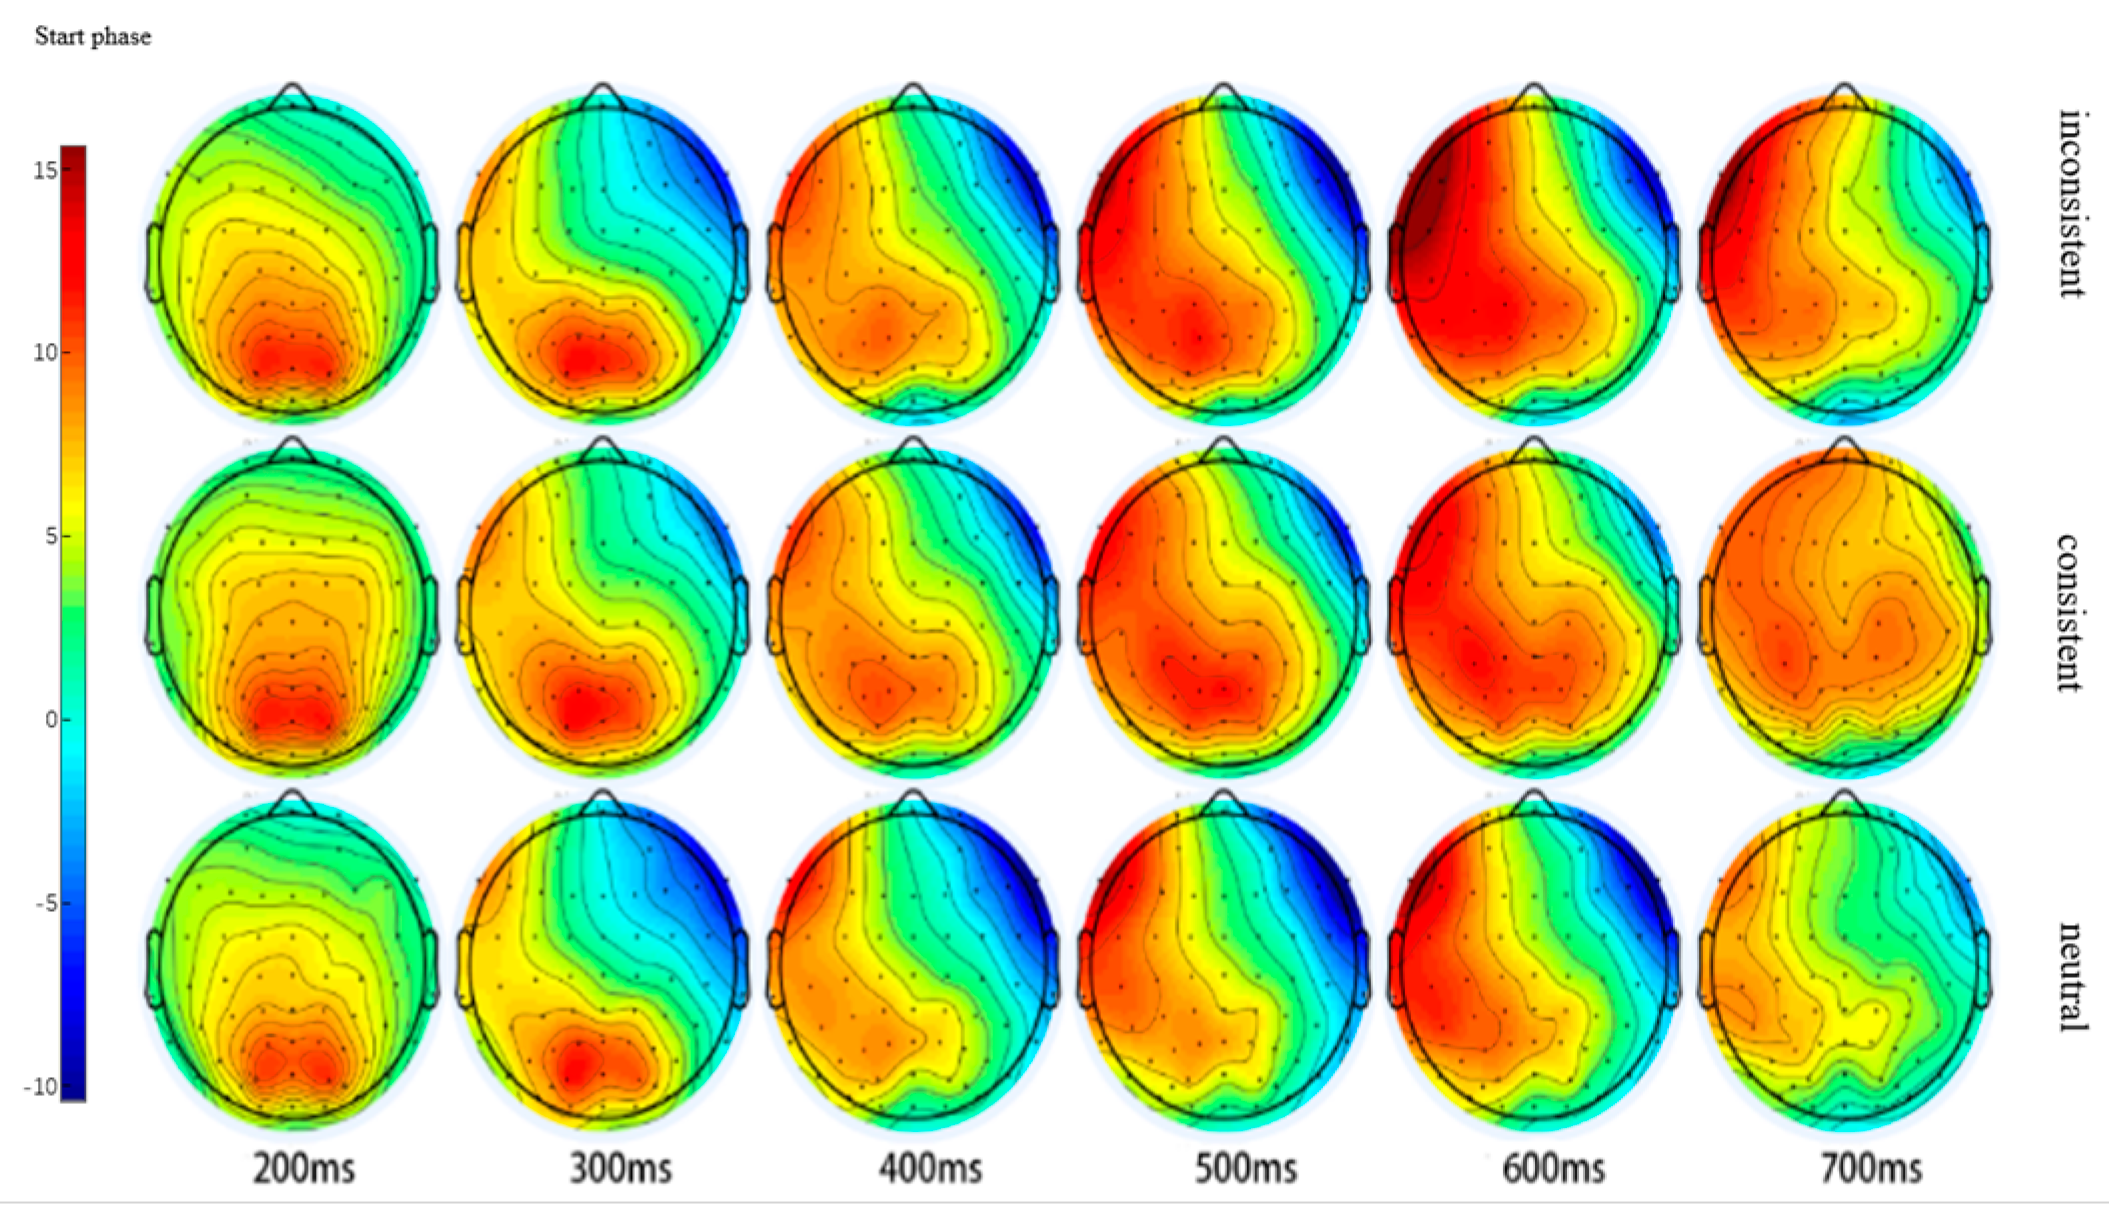
Figure 5.
Total waveform of electrode AF3.
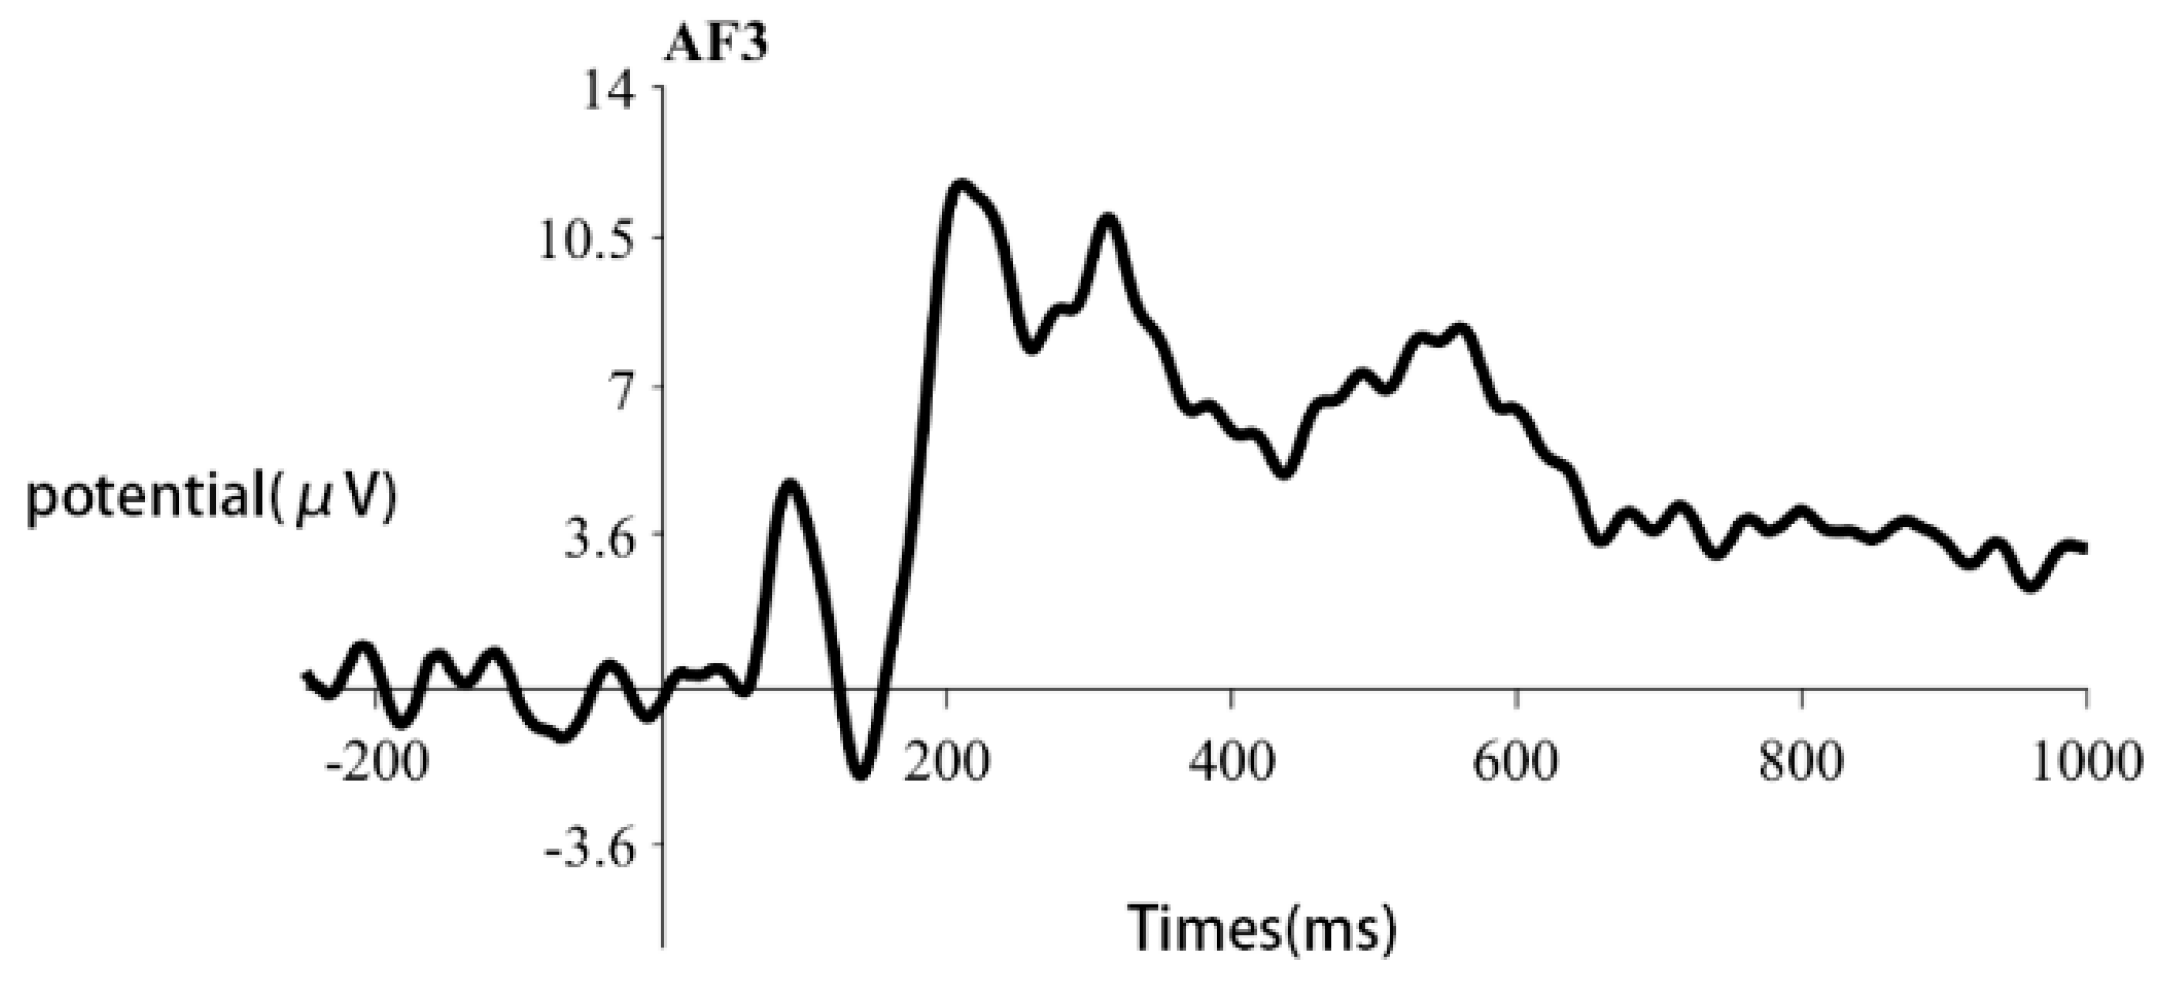
Figure 6.
P300 component waveform of three pairs of image words at electrode AF3. Green dashed rectangles the 300–400-ms time window.
Figure 6.
P300 component waveform of three pairs of image words at electrode AF3. Green dashed rectangles the 300–400-ms time window.
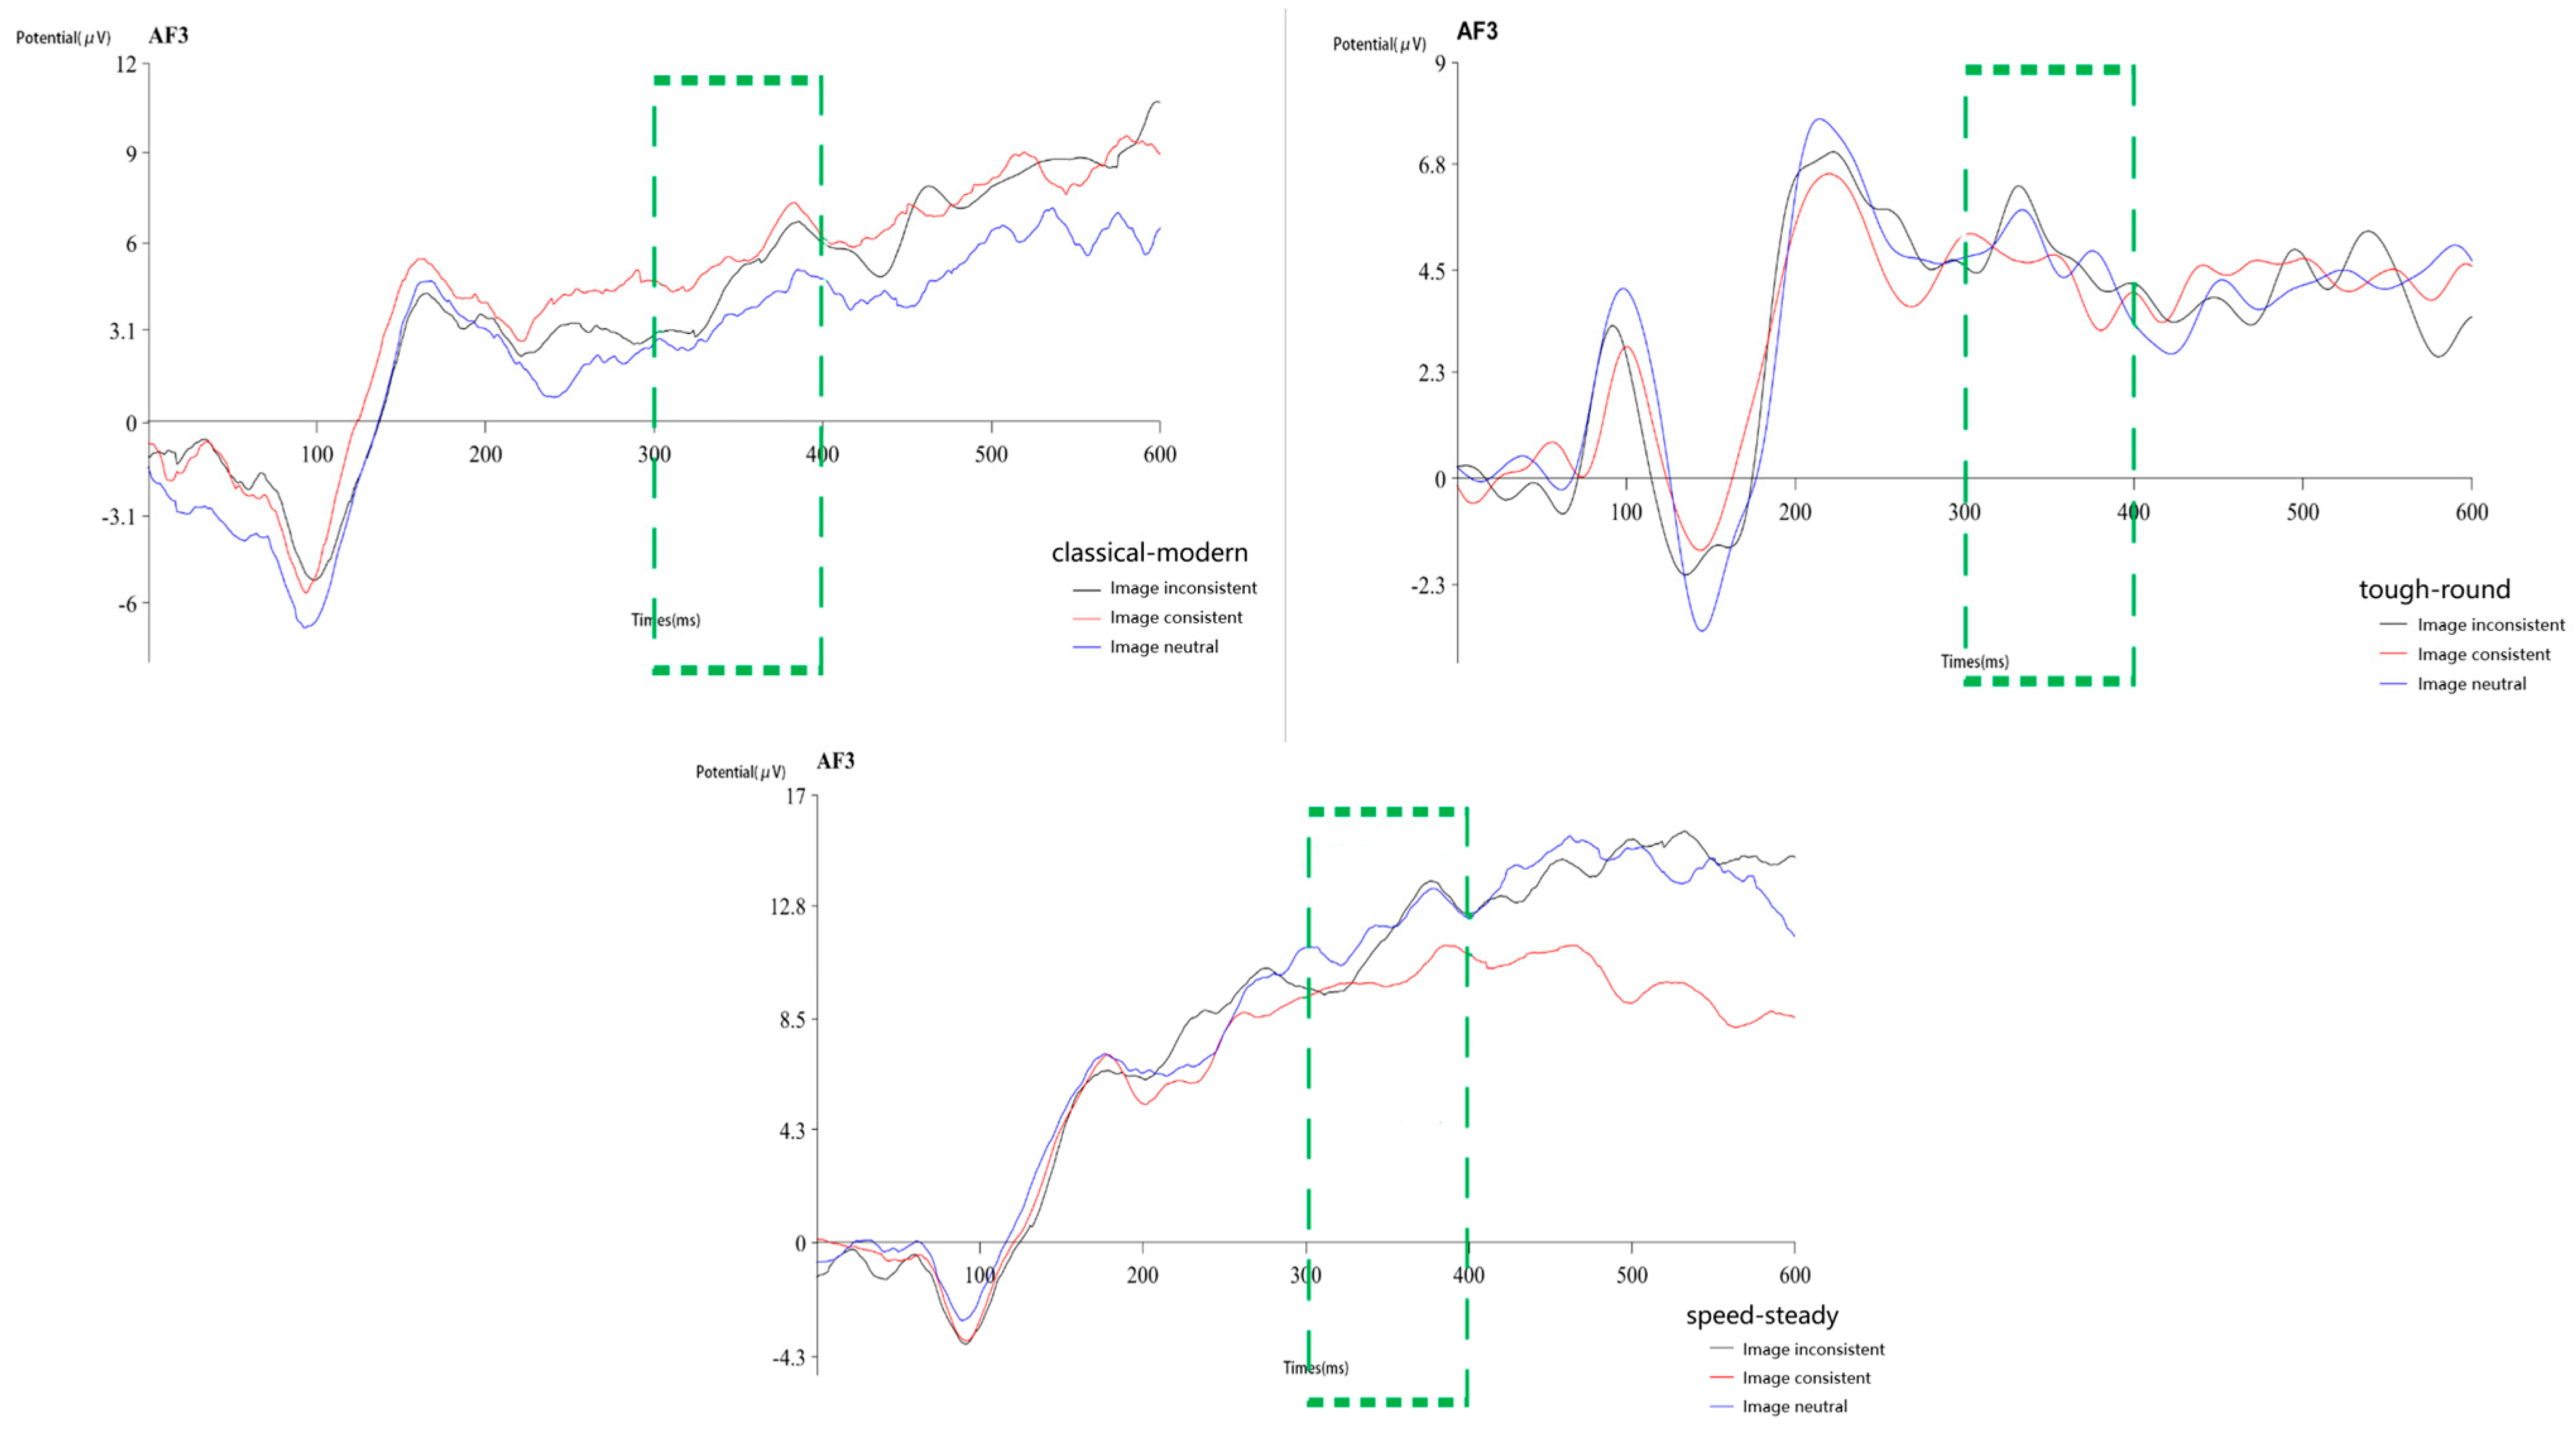
Figure 7.
N400 component waveforms of three pairs of image words at electrode F8. Green dashed rectangles mark the 350–500-ms time window.
Figure 7.
N400 component waveforms of three pairs of image words at electrode F8. Green dashed rectangles mark the 350–500-ms time window.

Figure 8.
Brain area topographic map at the target stage.
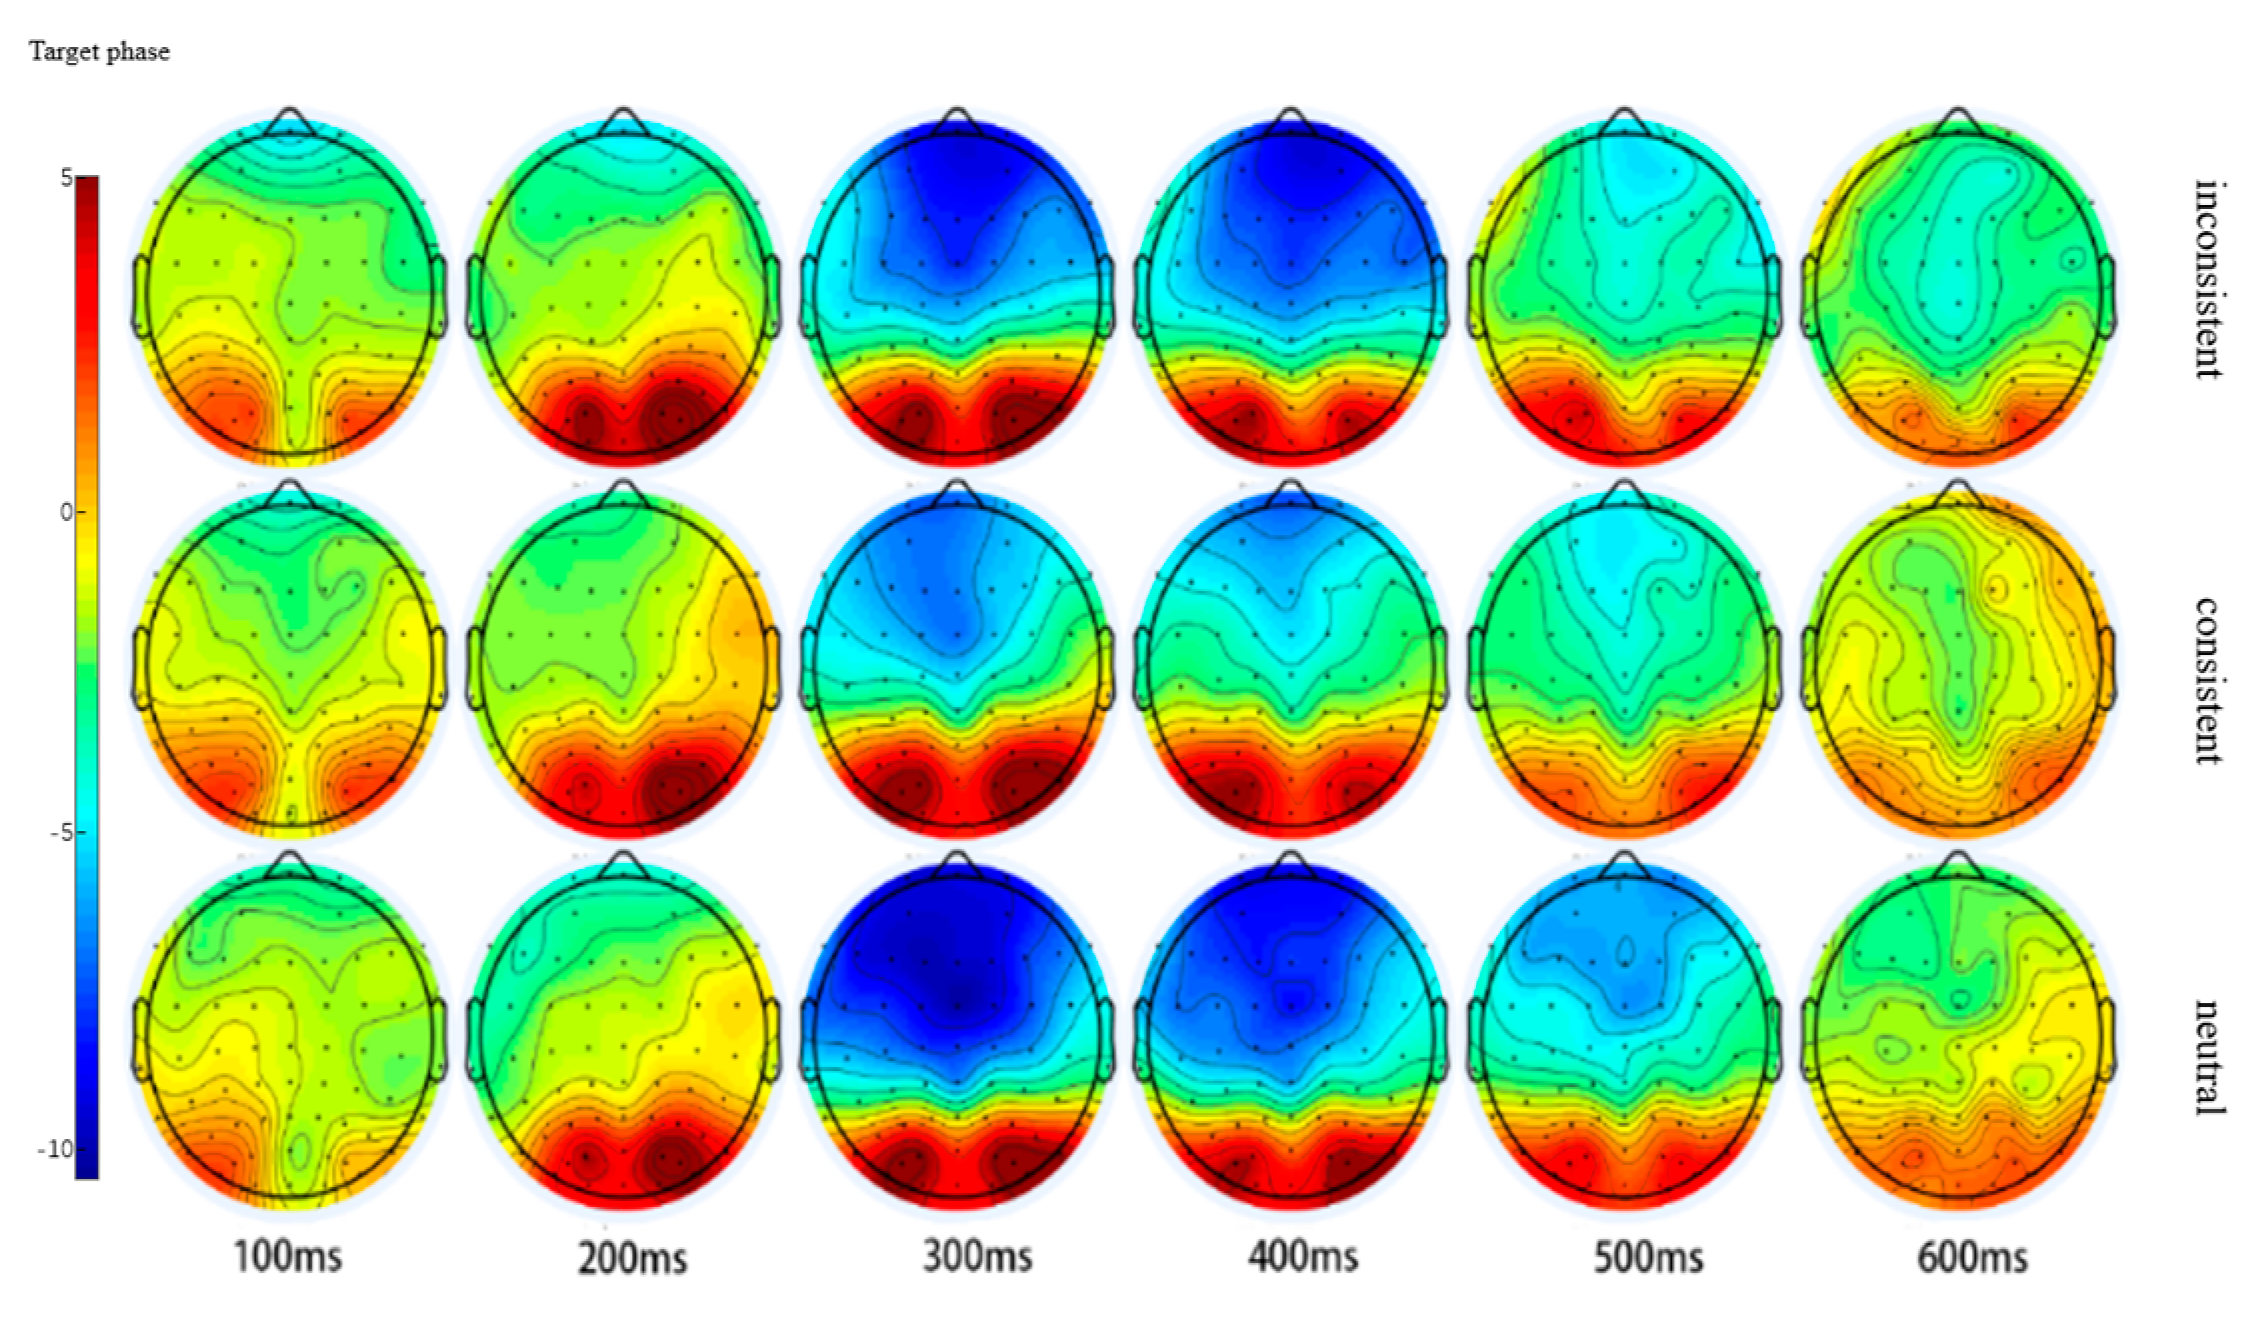
Figure 9.
Total waveform of electrode POZ.
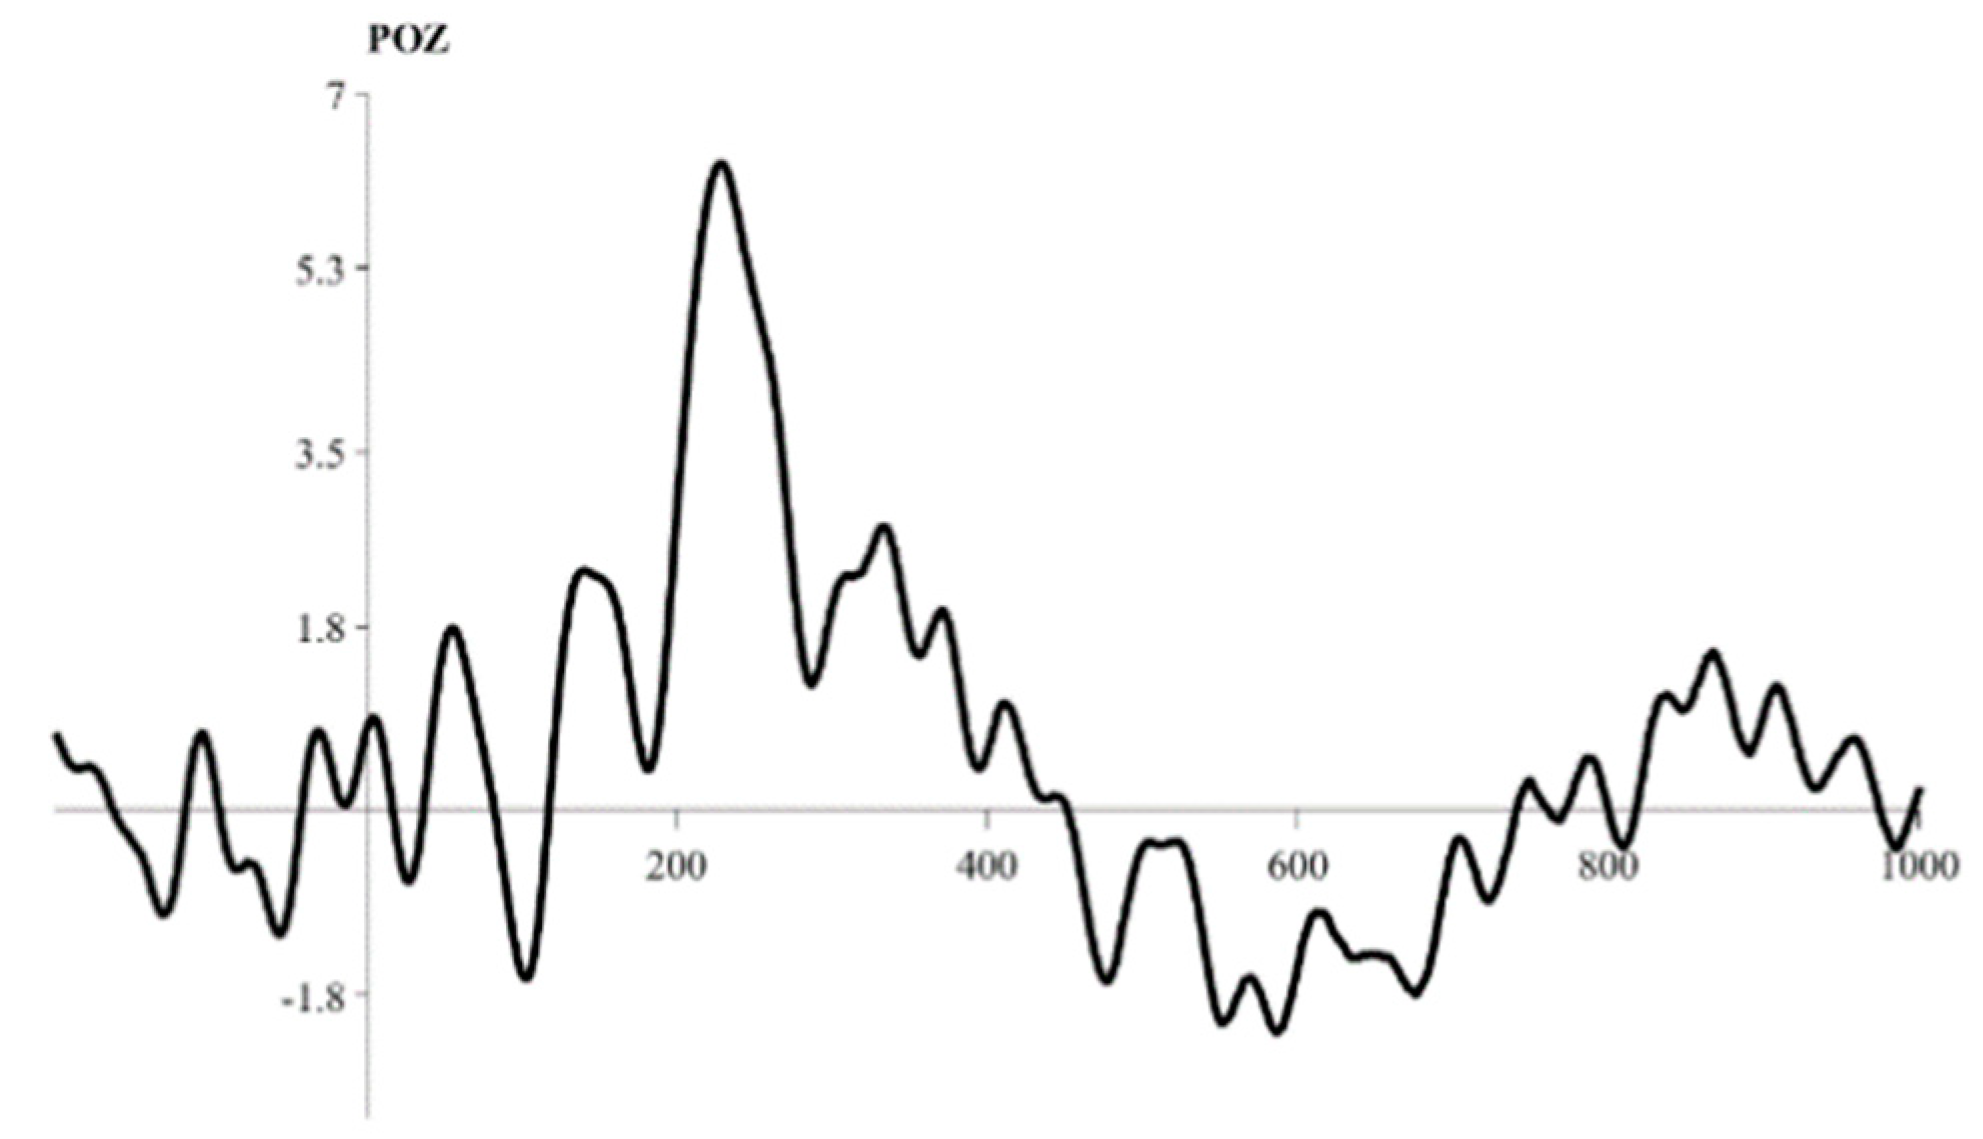
Figure 10.
P300 component waveform of three pairs of image words at electrode POZ. Green dashed rectangles mark the 200–300-ms time window.
Figure 10.
P300 component waveform of three pairs of image words at electrode POZ. Green dashed rectangles mark the 200–300-ms time window.
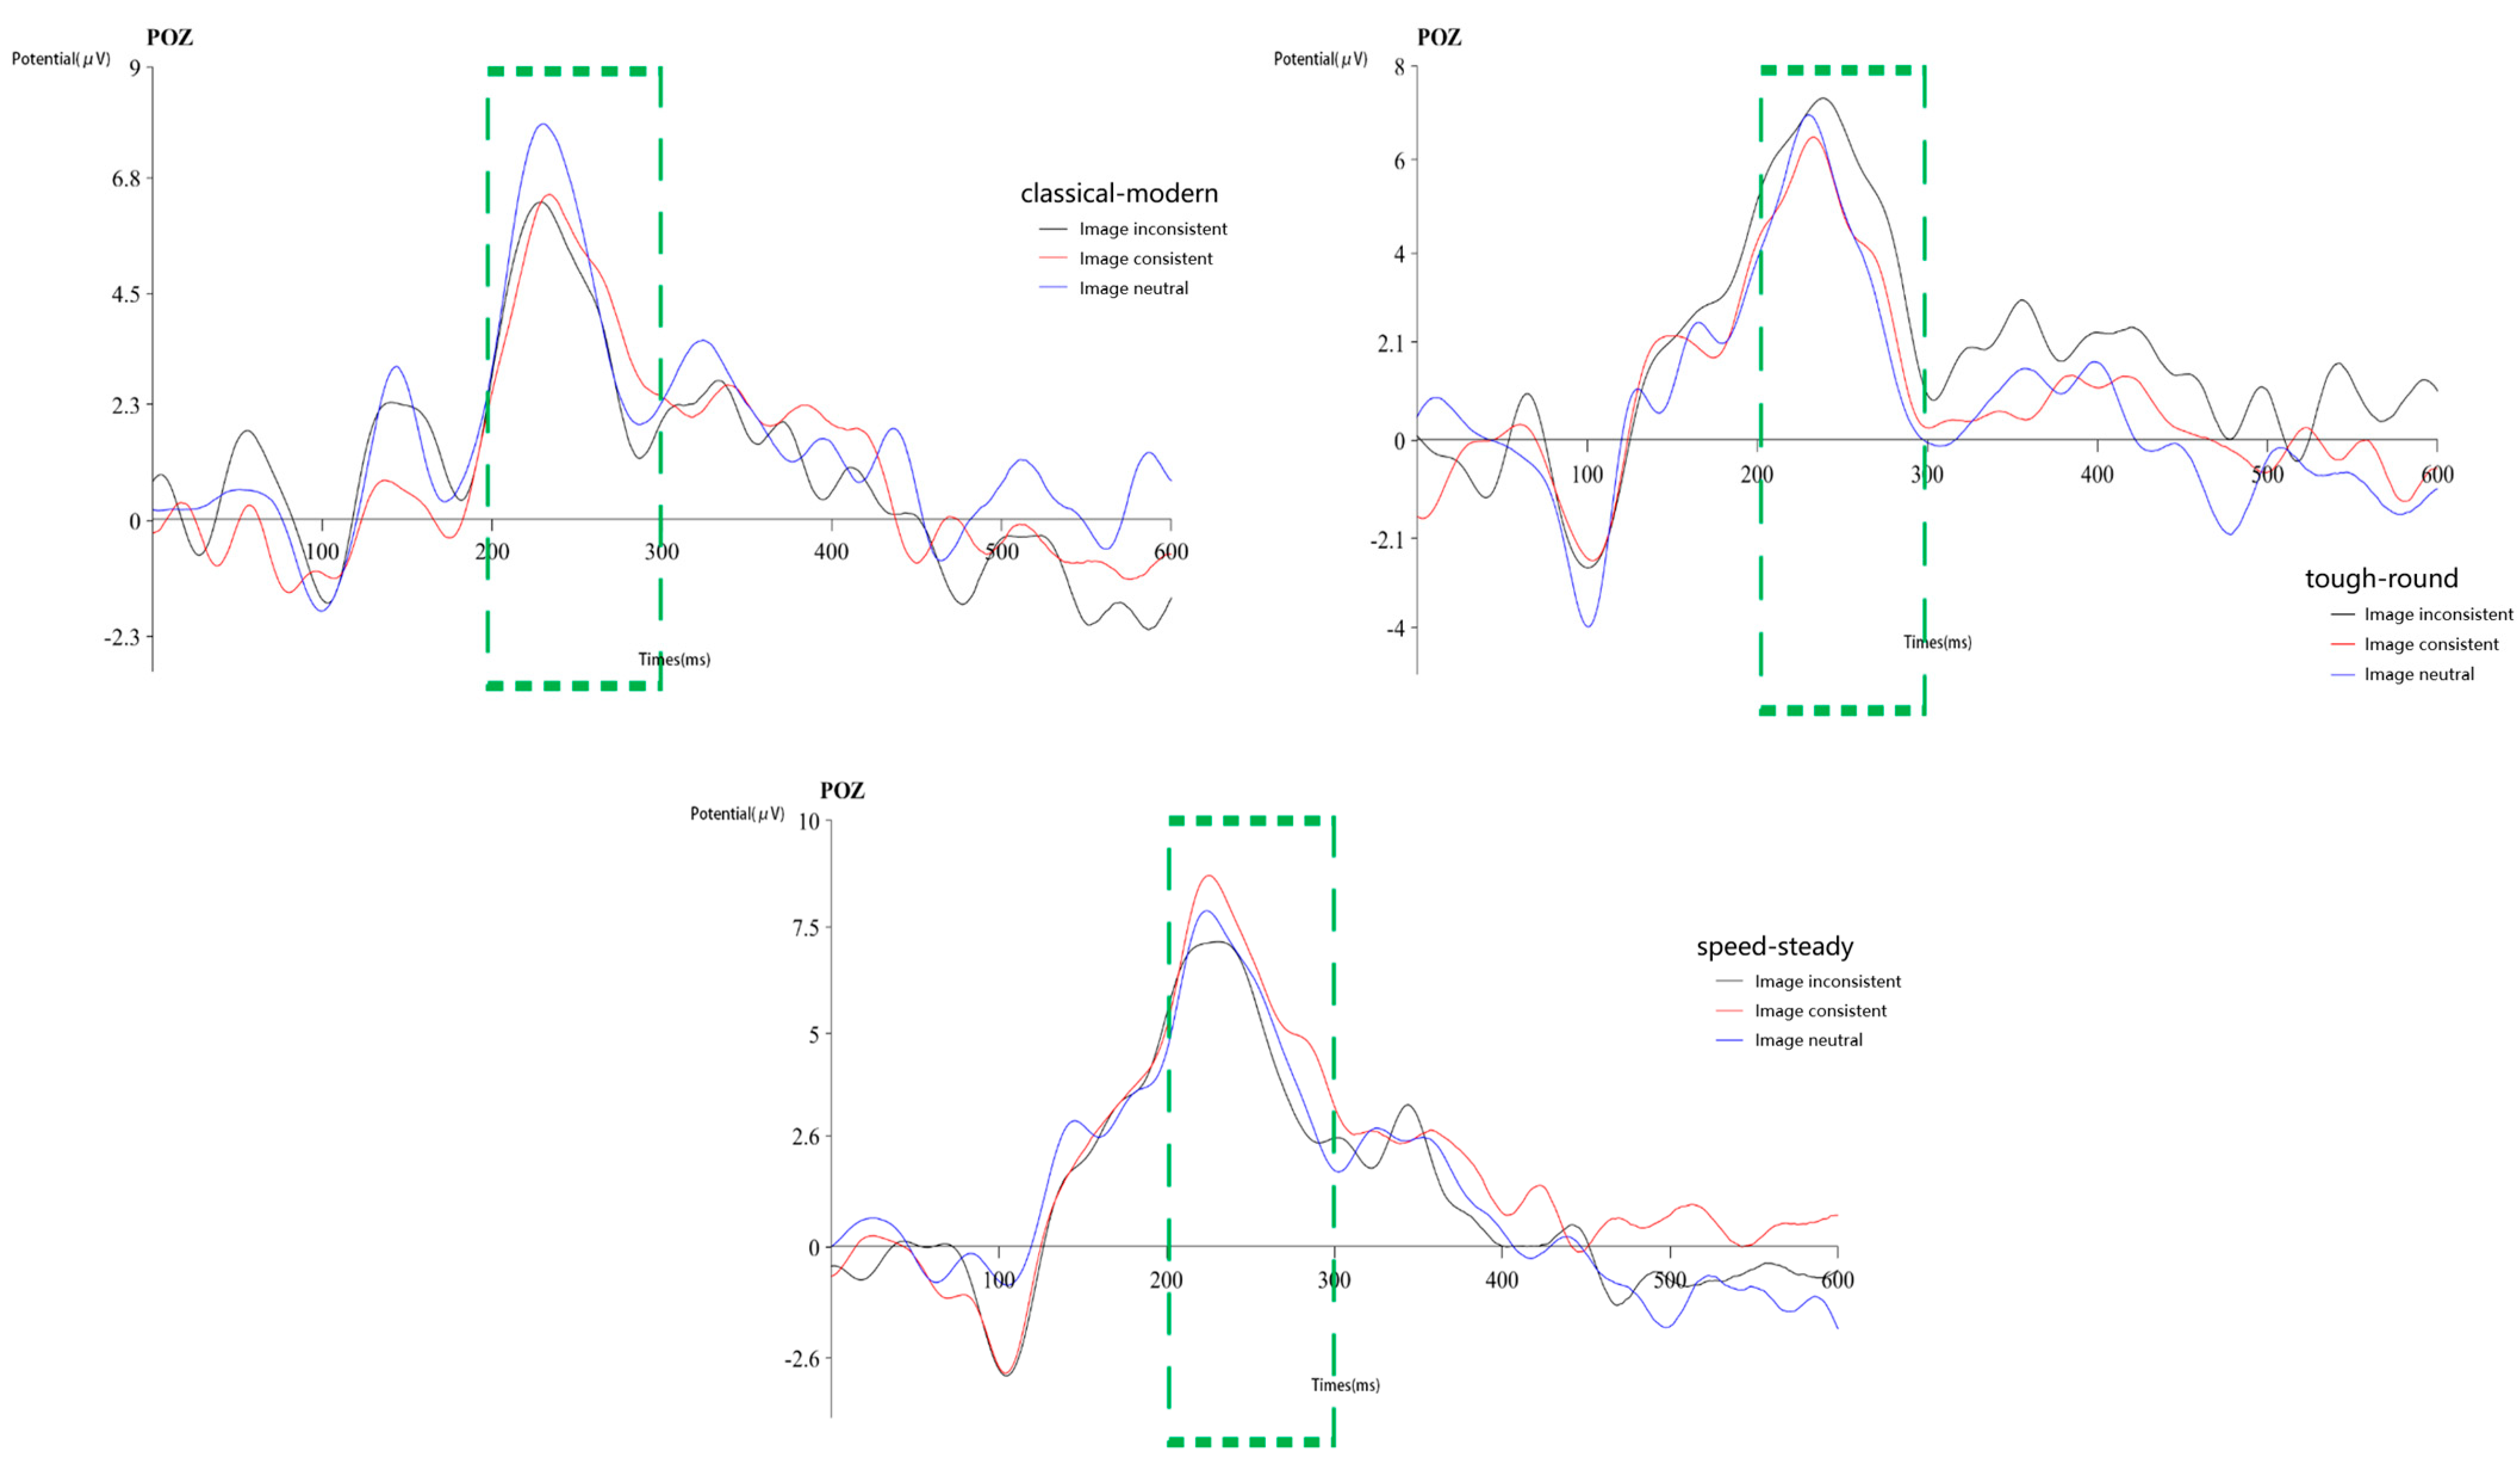
Figure 11.
N400 component waveforms of three pairs of image words at electrode FC2. Green dashed rectangles mark the 250–400-ms time window.
Figure 11.
N400 component waveforms of three pairs of image words at electrode FC2. Green dashed rectangles mark the 250–400-ms time window.
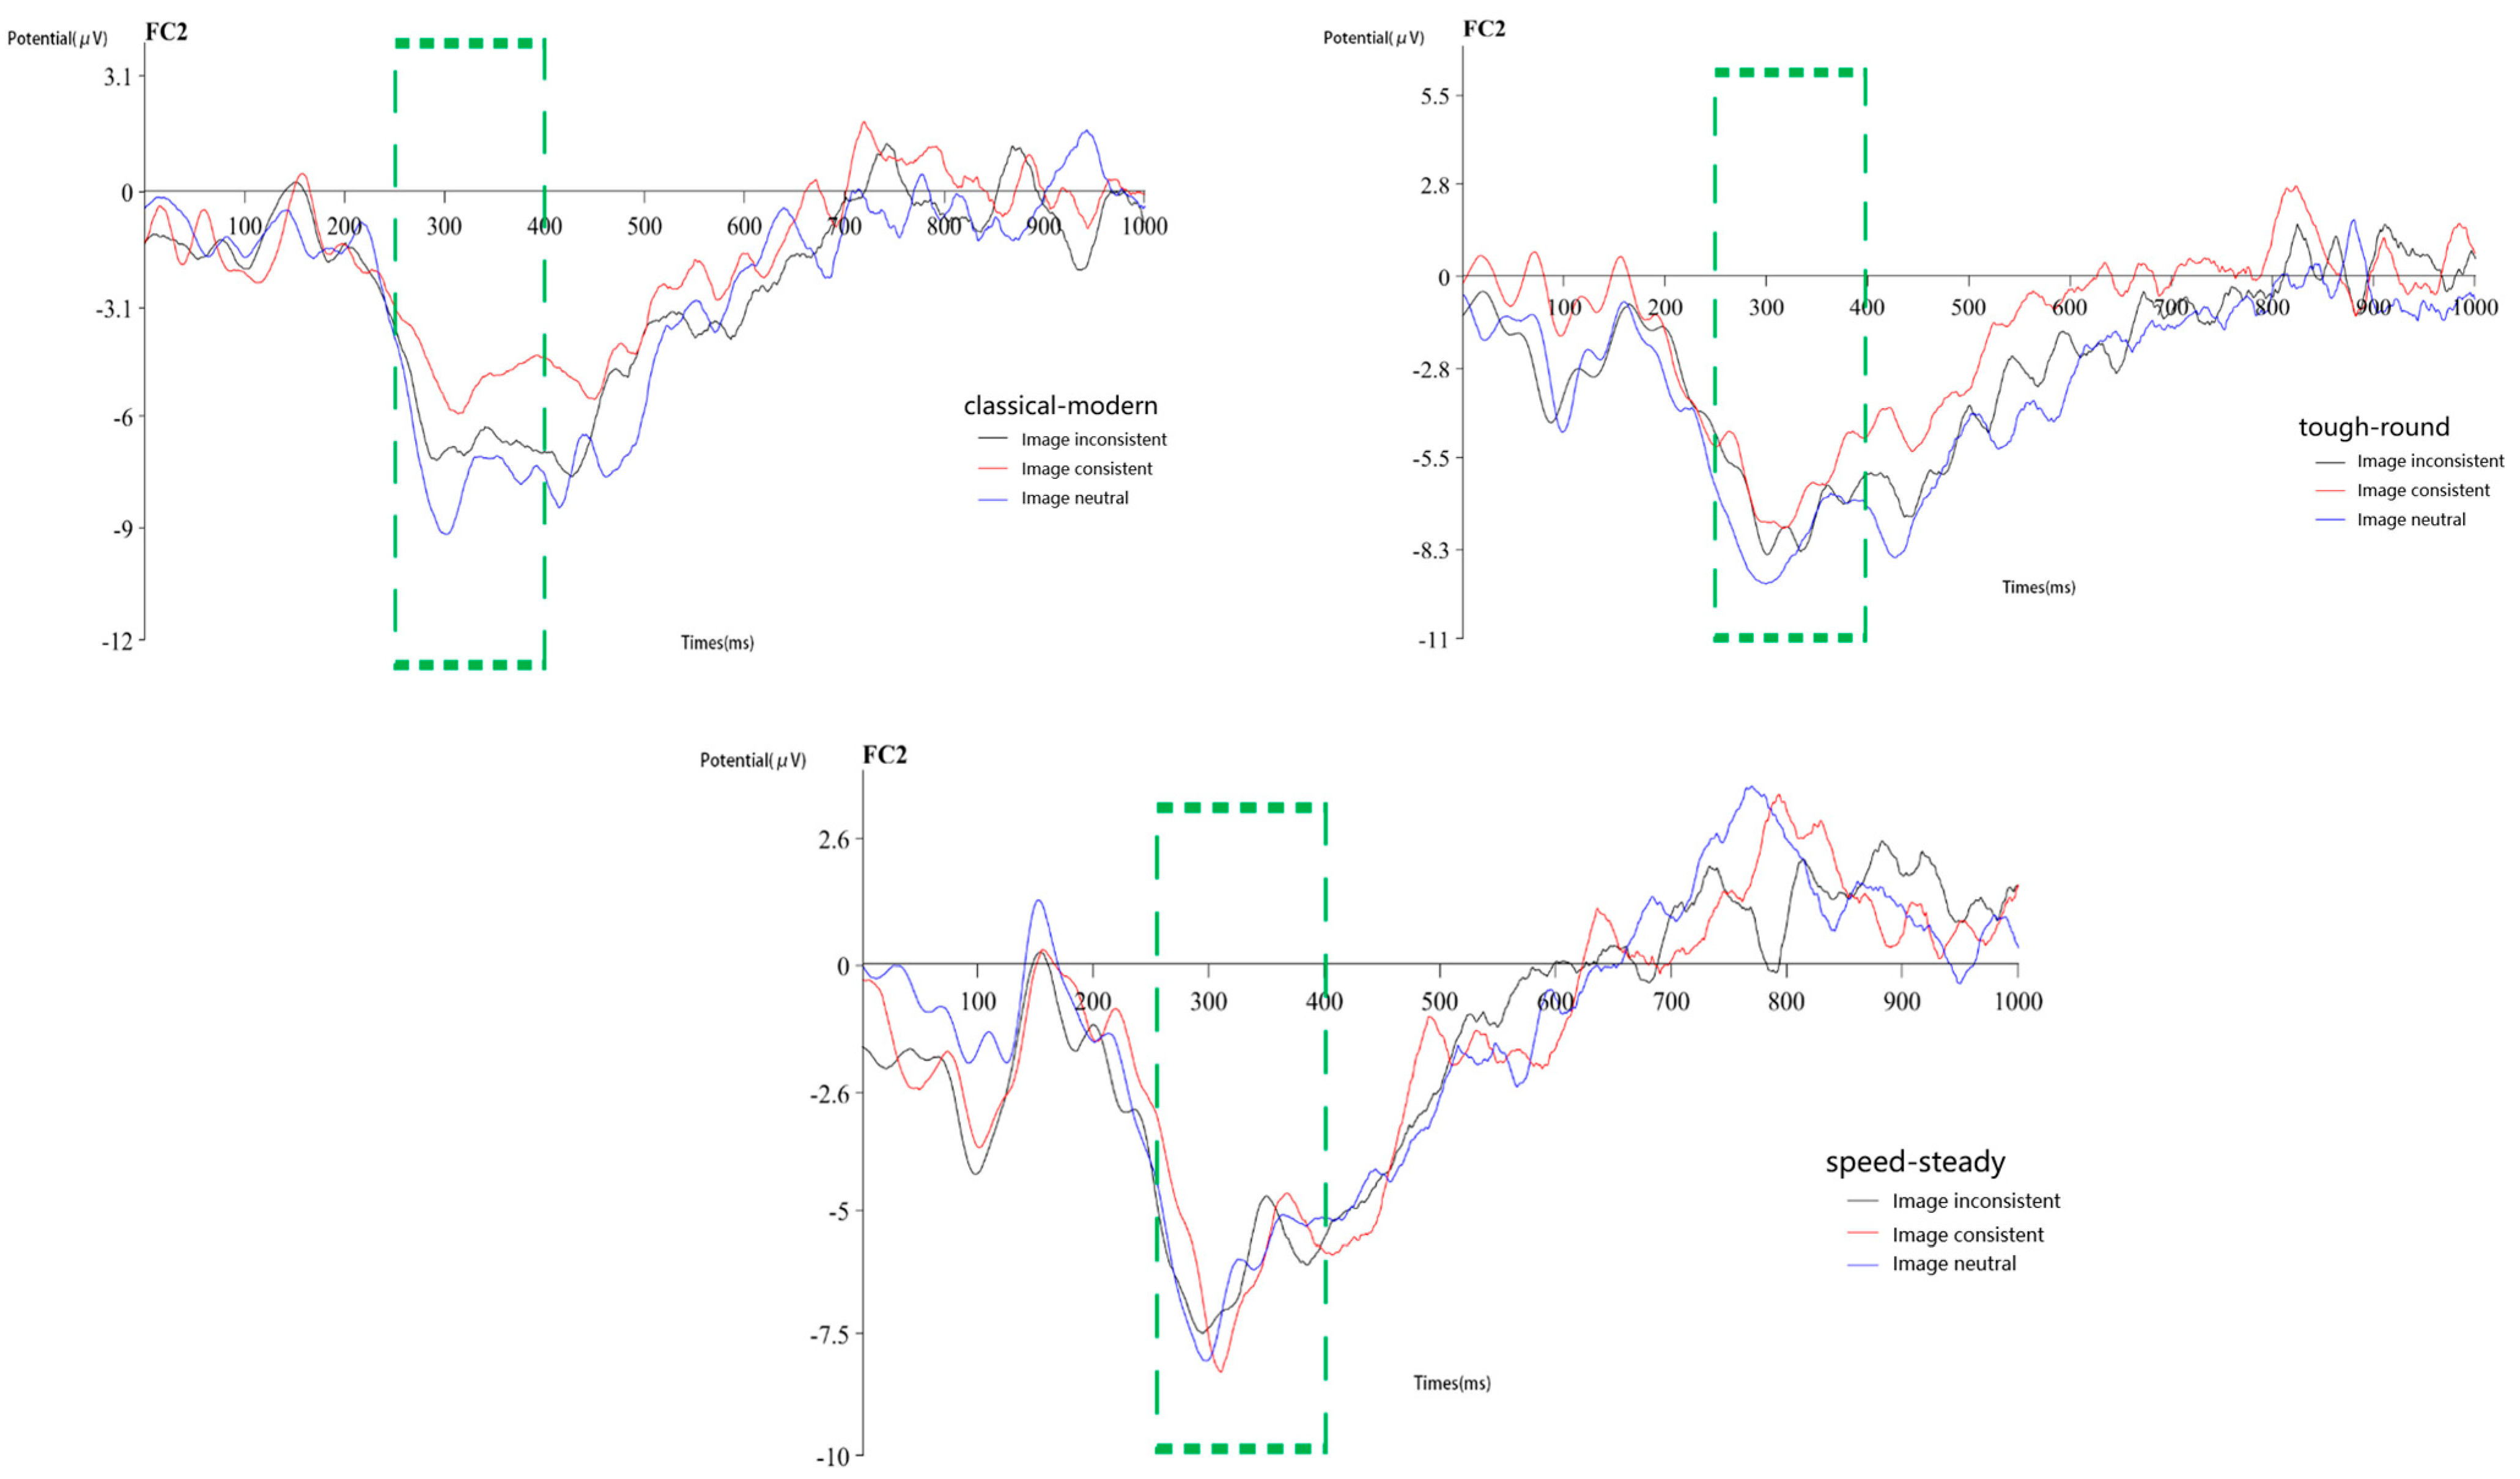
Figure 12.
Gamma learning curve of the value. (a): The range of gamma is , the step size is 50 and the accuracy is 93.33%. (b): The range of gamma is , the step size is 50 and the accuracy is 92.78%. (c): The range of gamma is , the step size is 100 and the accuracy is 92.78%.
Figure 12.
Gamma learning curve of the value. (a): The range of gamma is , the step size is 50 and the accuracy is 93.33%. (b): The range of gamma is , the step size is 50 and the accuracy is 92.78%. (c): The range of gamma is , the step size is 100 and the accuracy is 92.78%.

Figure 13.
Learning curve of penalty coefficient C. (a): The range of C value is [0.01, 30], the step size is 50 and the accuracy is 94.44%. (b): The range of C value is [0.01, 3], the step size is 100 and the accuracy is 94.44%.
Figure 13.
Learning curve of penalty coefficient C. (a): The range of C value is [0.01, 30], the step size is 50 and the accuracy is 94.44%. (b): The range of C value is [0.01, 3], the step size is 100 and the accuracy is 94.44%.

Table 1.
Model characteristic variables.
| Characteristic No. | Stage | Electrode Position | Intercept Period | Component |
|---|---|---|---|---|
| 1 | Start-up phase | Average value of AF3 and F7 | 200–400 ms | P300 |
| 2 | Start-up phase | Mean value of O1 and P3 | 200–400 ms | P300 |
| 3 | Start-up phase | Average value of AF3 and F7 | 500–700 ms | LPP |
| 4 | Start-up phase | Mean value of T7 and P5 | 500–700 ms | LPP |
| 5 | Start-up phase | Average value of AF4 and F8 | 300–500 ms | N400 |
| 6 | Target phase | Mean value of O1 and P3 | 200–400 ms | P300 |
| 7 | Target phase | Mean value of O2 and P4 | 200–400 ms | P300 |
| 8 | Target phase | Average value of AF3 and F7 | 300–500 ms | N400 |
| 9 | Target phase | Average value of AF4 and F8 | 300–500 ms | N400 |
| 10 | Target phase | Mean value of F1 and FC5 | 300–500 ms | N400 |
| 11 | Target phase | Mean value of F2 and FC6 | 300–500 ms | N400 |
| 12 | Target phase reaction time |
Table 2.
Classification accuracy of four types of kernel functions (gamma = “auto”, linear kernel degree = 1, C = 1).
Table 2.
Classification accuracy of four types of kernel functions (gamma = “auto”, linear kernel degree = 1, C = 1).
| Kernel Function Name | Accuracy |
|---|---|
| Linear kernel | 76.11% |
| Polynomial kernel | 70.55% |
| Gaussian kernel | 86.67% |
| Sigmoid core function | 65% |
Disclaimer/Publisher’s Note: The statements, opinions and data contained in all publications are solely those of the individual author(s) and contributor(s) and not of MDPI and/or the editor(s). MDPI and/or the editor(s) disclaim responsibility for any injury to people or property resulting from any ideas, methods, instructions or products referred to in the content. |
© 2023 by the authors. Licensee MDPI, Basel, Switzerland. This article is an open access article distributed under the terms and conditions of the Creative Commons Attribution (CC BY) license (https://creativecommons.org/licenses/by/4.0/).
Share and Cite
MDPI and ACS Style
Li, Y.; Li, H.; Song, W.; Le, C. Quantitative Classification Model of Composite Product Image Based on Event-Related Potential. Appl. Sci. 2023, 13, 7972. https://doi.org/10.3390/app13137972
AMA Style
Li Y, Li H, Song W, Le C. Quantitative Classification Model of Composite Product Image Based on Event-Related Potential. Applied Sciences. 2023; 13(13):7972. https://doi.org/10.3390/app13137972
Chicago/Turabian StyleLi, Yan, Huan Li, Wu Song, and Chen Le. 2023. "Quantitative Classification Model of Composite Product Image Based on Event-Related Potential" Applied Sciences 13, no. 13: 7972. https://doi.org/10.3390/app13137972
Note that from the first issue of 2016, this journal uses article numbers instead of page numbers. See further details here.