Article

Impact on Protective Device Sequence of Operation in Case Distributed Generation Integrated to Distribution System

School of Engineering, King Mongkut’s Institute of Technology Ladkrabang, Bangkok 10520, Thailand
*
Author to whom correspondence should be addressed.
Appl. Sci. 2023, 13(13), 7970; https://doi.org/10.3390/app13137970
Submission received: 5 June 2023 / Revised: 28 June 2023 / Accepted: 3 July 2023 / Published: 7 July 2023

Abstract

:
This study aims to evaluate the impact of the distributed generator (DG) connection to the grid. The simulated results present the parameters of the system required to install DG on the end of the main distribution feeder. Various parameters, such as voltage, current, and protective relay coordination are modelled after the actual provincial electricity authority (PEA) distribution system. Various case studies compared the coordination without and with DG connections to the grid by finding the difference of protective devices. The results indicate that the malfunction can be fixed in order of priority protective devices, which operate according to the parameter setting. Additionally, the coordinate functions between the recloser and fuse devices in both phase and ground configurations in the operating zone prevented the drop-out fuse melting or burning out. Based on the result, this problem is fixed by providing a directional recloser device and increasing the fuse-link rated with 40k installation for replacing the conventional sizing, which can improve the performance in case of fault occurrence to investigate the reliability and stability of the distribution system.

1. Introduction

Power generation from fossil fuels is one of the contributions factors to the global warming issue. Thus, various countries have launched power development policies to reduce fossil fuel utilisation. Renewable energy is important to rapidly increase the power system. Most private sectors develop the distributed generator (DG) to combine with the grid individually. Renewable sources of DG are connected to the grid, such as PV power, wind power, and biomass power, which are populated to complied on grid connections. The advantages of DG sizing placement [1] involve the characteristics of the voltage level, short circuit current magnitude, and power flow direction changing. Renewable DG placement can be supported in terms of the economic and lower effect on the environment [2]. However, each DG has been provided with the protection system which depends on the network configuration. Several DG technologies are connected to the grid, which differently impact the existing protection system. Thus, the provincial electricity authority (PEA) provides the grid connection code regulation notice that is used for applying all DG connections.
However, DGs must be connected from the system in case of abnormal conditions such as short circuit occurrences as calling in “islanding mode”. Therefore, these events cannot be controlled in case of fault in the distribution system. Nonetheless, when the fault situation occurs, the system energises the power back immediately, which cannot be interrupted for all power systems. In addition, the fault characteristics are of two types, i.e., permanent and temporary failures [3]. Various solutions are presented to the system by improving the protection scheme to prevent the malfunction of protective devices. The protective devices are installed on the system, which is used for monitoring and detecting the fault location or defected point. When a fault occurs in the system, the protective devices can be operated on time due to a wrong relay coordination. Hence, the coordination between the protective devices must be performed by zone protection to increase the reliability of the distribution system. Therefore, protective coordination is divided into three main feature correlations such as current, timing, and both of current and timing.
DG installation is impacted by and related to the impedance bus value [4,5], when connected to the grid. Thus, the magnitude current value also increases, causing malfunction of protective devices as well. Simple protective devices are proposed and utilised on the radial distribution system, such as the overcurrent [6,7,8], reclosers [9,10], and fuses [11,12]. Losses of coordinated protective devices are concerned with the processes observed, such as loss of tripping, loss of action, and loss of trip command to another device [13,14]. However, the protection characteristics are applied to the distribution system, in which the operation has to be correctly performed and perfectly functional as per the conceptual providing. For instance, the reliability, dependability, security, selectivity, and speedy functions of protective devices are used for reinforcement of the stability of a distribution system. Additionally, various protective coordination is proposed under different conditions to prevent the high-risk impact to the grid [15,16]. The optimal coordinate of protective devices is proposed in cases between positive, negative, and zero sequences [17,18] to comply and consider with overcurrent and voltage aspects in case DG connection to the grid. For this reason, the point of failure will be separated from the system correctly and accurately for saving and reducing the time to protect the device breakdown.
The major impacts after DG connection to the grid are summarised on three critical points. For instance, the sensitivity problem concerns the power, selectivity, recloser, and islanding problems. The current differential is performed for monitoring and classification part of units between load and DG, which are energised during fault occurrences [19,20]. There are issued methods for protection with DG connection which have the type of bi-directional and islanding detection [21,22]. In addition, anti-islanding detection is to make the step-voltage regulator device, which causes by under and over voltage by utilising at synchronous DG. This method is provided for making clearly fast fault of proper relay-fuse coordination of each DG on IEEE 33-bus [23,24]. Two aspects of the coordination protection scheme [25,26,27], such as the behaviour DG sizing placement [28,29] and the operation process, are concerned with either connection or disconnection devices to the radial distribution network. For reinforcement of the optimal protection scheme, the configuration setting will be improved by the existing system [30]. In [31], fault management is performed to reduce the DG impact on the grid connection. Despite the reconfiguration being purposed, many factors on the system, such as protection coordination, network operation, DG sizing, and soft opening points (SOPs), are approached the constraint of formula on the system [32,33]. To propose the optimal protective coordination (OPC) in the single-phase without DG connection, there has to be considered the time operation period. Afterward, the Coordinate Protection Index (PCI) by considering the power flows and downtime for operation [34].
The protection coordination schemes are proposed, including many techniques and solutions, for increasing the performance in fault situations on the distribution system. The self-adaptive protection is proposed for maintaining the time dial at the recloser and fuse equipment in the operation mechanism. Studies are utilised to protect both phase and ground sides at real-time, which show better operating and interval timings on the IEEE 34-bus system [35,36]. Besides, the enhancement of protection with recloser-fuse coordination that provides by using Integer linear programming (IP) that is to be found the fault transmitter (FT) on the distribution system. The fuse-saving and costing of benefits can be reduced total fault interrupting duration [37,38]. In [39], the economic impact of protecting system scheme development is considered. The fault controller by the fault ride-through (FRT) constraints [40], which can operate in over various fault levels and locations of the system. The author of [41,42] proposed the adaptive optimal coordination for reaching the over current relays (OCRs) at the power distribution system. It can increase the reliability of the protection system. Based on the results, this proposed study can reduce the operation of OCRs to lower conventional than 54.2% as a comparison in various conditions. In addition, a CPU processor for controlling the smart over current relays, which can be prohibited by any unwanted tripping and incorrect miscoordination of protective devices on the distribution feeder [43]. Furthermore, in both studies [44,45,46,47], the proper restoration technique for protecting coordination prior the fuse melting and burning out, which is to classify and relies upon peer-to-peer communications that only reduces the numeral of relay aspects layer only.
Nevertheless, previous studies proposed a number of methods to improve the protection scheme based on individual devices. Thus, the configurations for protection devices are not presented and coordinated with all devices and DG connection. Therefore, the solutions are proposed to address the malfunction of priority protective devices operating. The contributions of this study are as follows:
  • To improve the protection system by minimising the serious effect of fuse-link failures during high fault conditions and managing the protection coordinate scheme between recloser setting and fuse-link sizing verifications;
  • To develop the conventional protection system to increase the stability and reliability on the distribution system both with and without DG;
  • To determine and apply the correct sizing of fuse-link devices at the right positions to protect the interrupting power supply to the load connections along the primary line.
The remaining paper is presented as follows: Section 1 is the introduction section and discusses the background and previous works related to the study. Section 2 presents the distribution system in the case study and provides the load sizing, voltage, and power loss characteristics. The result of fault occurrences in case of without DG connection to the grid is presented in Section 3. The fault occurrence in case DG connection is described in Section 4. The discussion and summary of simulation results are explained by the existing protection coordination scheme both of without DG and with DG.

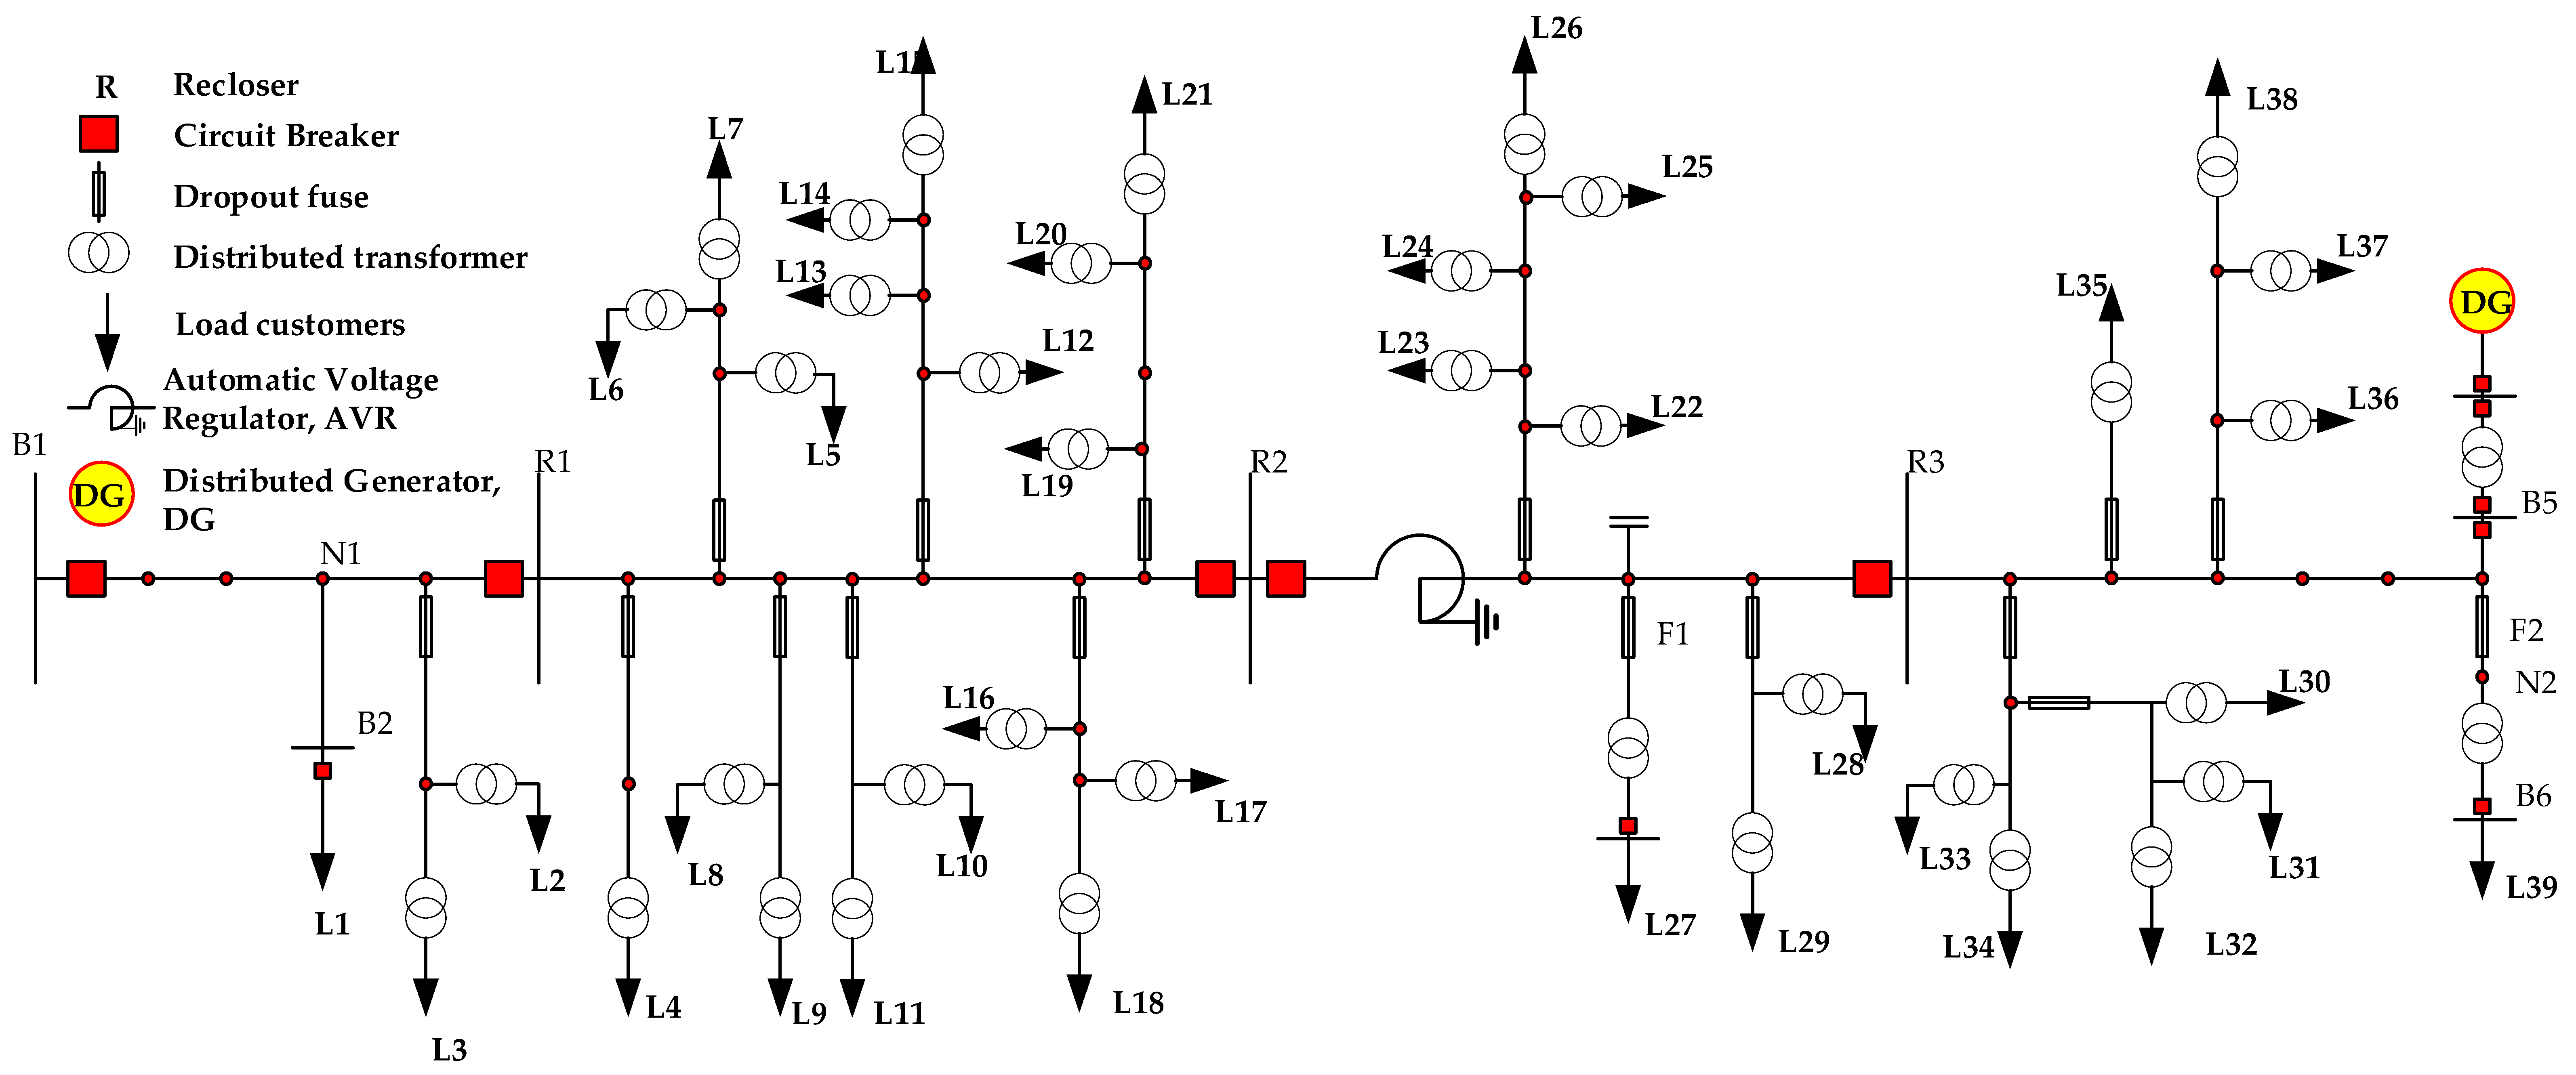
2. Distribution System Simulation

The simulation system replicates the actual load characteristic of the PEA 22 kV radial distribution system. The load characteristics are based on PEA’s load profiles at Khok Samrong district, Lopburi province, Thailand, as shown in Table 1. By considering data in Table 1, the load demand of this system is 4890 kVA capacity consist of the medium-scale industry in total of load demand 3700 kVA, small-scale industry has only one location in 500 kVA and the remaining residential loads in total 690 kVA, respectively. From the single-line diagram, the system energizes the power from bus B1 to all loads, which flows the current pass through the primary line to load location in total 39 load positions. Belonging to the load characteristics that could be separated by 3 industrial loads and 36 residential loads which is based on sizing of distribution transformers as shown in Figure 1. In addition, the DG is placed at the opposite of bus-B6, which is the end of primary feeder.
Under this system study is a single primary feeder, that consists of four major devices installed at this system, which consist of recloser, dropout fuses, distribution transformers, and Automatic Voltage Regulation (AVR). The recloser devices are placed at three locations along a feeder, such as the recloser-R1 is placed nearby the bus-B1 and bus-B2. The recloser-R2 is closely placed middle line and located the AVR. The recloser-R3 is placed for separating the end of the primary line, which has been utilised for disconnecting loads from L30 until L39. Dropout fuses are placed at every lateral along the distribution line.
The power cables are studied in the main three cable types, which are proposed in the system for simulation, the spaced aerial cables (SAC), partial insulated cable (PIC), and aluminium conductor steel reinforced (ACSR), respectively. The cross-sections of these cables will be held by both 50 and 185 mm2 in these studies. The SAC of 50 mm2 shows the DC resistance of the cable is highest as compared to others. Additionally, the characteristics of other cables are shown in Table 2. The parameters of each cable are shown in terms of positive, negative, and zero sequences, which are based on the PEA cable parameters (Table 3).
The case study will focus on the coordination between fuse-link and recloser devices. There are studies of cases that consist of both phase fault and grounding fault situations with both single and three-phases faults. The comparison is presented by vary sizing of fuse-link and reclosers, which are determined sizing via protection coordinates curves both without DG and with DG placement.
In case without DG, the case study consists of (1) The recloser R1 and Fuse-link 15k, (2) The recloser R1 and Fuse-link 25k, (3) The recloser R1 and R2, (4) The recloser R2 and R3, and (5) The recloser R3 and Fuse-link 25k.
For the case with DG, the case study consists of (1) Voltage and power loss improvement aspects which are compared both without and without DG, (2) Belonging to various fault locations in terms maximum and minimum currents by fixing the three points measuring such as at fault location, at substation, and at DG locations, (3) The recloser R1 and Fuse-link 25k at grounding side, (4) The recloser R1 and R3 with Fuse-link 25k, (5) The recloser R2 and R3 at phase side, and (6)The recloser R3 and Fuse-link at position 13.

2.1. Effect on Voltage Level in Case of Distribution System with DG Placements

This simulation started from the various DG placement and measured the voltage value on that position on time. The simulation results will be followed by Table 4. The voltage results in case of no DG installation do not impact the lower voltage standard by 100% injection to the loads. AVRs are installed on the distribution system, which can improve the existing voltage value. The distribution system is applied to the DG at various positions. Thus, the voltage is not impacted by any load locations, which is based on the voltage standard of the grid. Considering the distancing from substation, the voltage behaviours steadily increased as compared to those without DG, which is dependent on the distancing from the substation. For instance, the voltage level at 2 km is higher than the voltage level at 26 km by 7.30%. The voltage level at 26 km is more than that at the voltage level at 26 km from substation without DG by 8.87%. However, both voltage levels at 12 and 14 km have increased value due to the AVR placement near those positions. The simulation result is shown in Table 4.

2.2. Effect on Power Loss in Case of Distribution System with DG Placements

The 8 MW DG sizing is installed in various locations to support the load consumption total 9 MW. The power loss depends on the changing location of DG integrating to the system. The simulation evaluation is compared on both situations with DG and without DG connections. The loads demand will be applied between 100% and 80% of power consumption. The details of simulation result are shown in Table 5.
From the table, it can be seen that the DG can reduce power loss in the system when compared to the case without DG. The amount of power loss reduction depended on the distance from the substation; as the DG placement was further away from the substation, the power loss in the system is decreased. The DG placement at 12 km from the substation or the middle point of the distribution line achieved the lowest power loss. The reason is power generated from DG can be provided to load instead of received from the substation, thus reduce power loss in the distribution line. The benefit of DG placement at the middle line is getting the lowest power loss. However, the further away from the substation the DG placement is, the effectiveness in reducing power loss is decreased, but the power loss is still lower than the case without DG.

3. Protective Device Functional Operation in Case without DG

Two case studies of case fault occurrence are provided here, such as the three-phase fault (3P) that gets a highest current magnitude of this case study. The single-line to ground fault (SLG) has an impedance of 40 ohms, which is getting a lowest current magnitude. However, this simulation program will be done by DigSILENT Power Factory, which divided the case studies in every connection point of the distribution line. The priority of protection coordination will be arranged on this system.
The investigation of the fault occurs at three-phase and single-phase simulations, and the maximum current at location 1 was more than 8.6 times from the single-phase. The highest fault current is location 1, and the trending is decreased from this location until location 16, which is the lowest fault current. The fault current behaviour is dependent on the distance away from the fault location. Therefore, the fault impedance causes directly impact the fault current that injects into the grid. Thus, the results both with DG and without DG connections are shown in Table 6.

3.1. Protective Relay Operation Sequential at Both Recloser R1 Location and Drop-Out Fuse Device at the Position 25k Such as F2, F3, F4, and F5, Respectively

In Figure 2a,b, recloser R1 energises the power to AVR by the large transformer, which can increase the line voltage along this circuit. Thus, the inrush current of the circuit has been limited to cause by the AVR via operating time zone. Considering this, this recloser position is set up only on a slow curve mode. In addition, the configuration setting is shown in Table 7.
However, the drop out fuse at the F1 position has provided the fuse link device at 15k rating, which cuts out positions F2, F3, F4, and F5, respectively. Thus, those devices are providing the fuse link at 25k.
In Figure 2a,b, when the short circuit occurs at lateral in F2, F3, F4, and F5, respectively, which the fuse-link have been melted of the connecting couple point before the recloser activated. Every fault occurrence, the period in the lateral of the distribution system is more than 0.3 s. This means that the fuse-link devices of F2, F3, F4, and F5 positions have been broken down due to all loads after those fuse-links are getting loss the power.

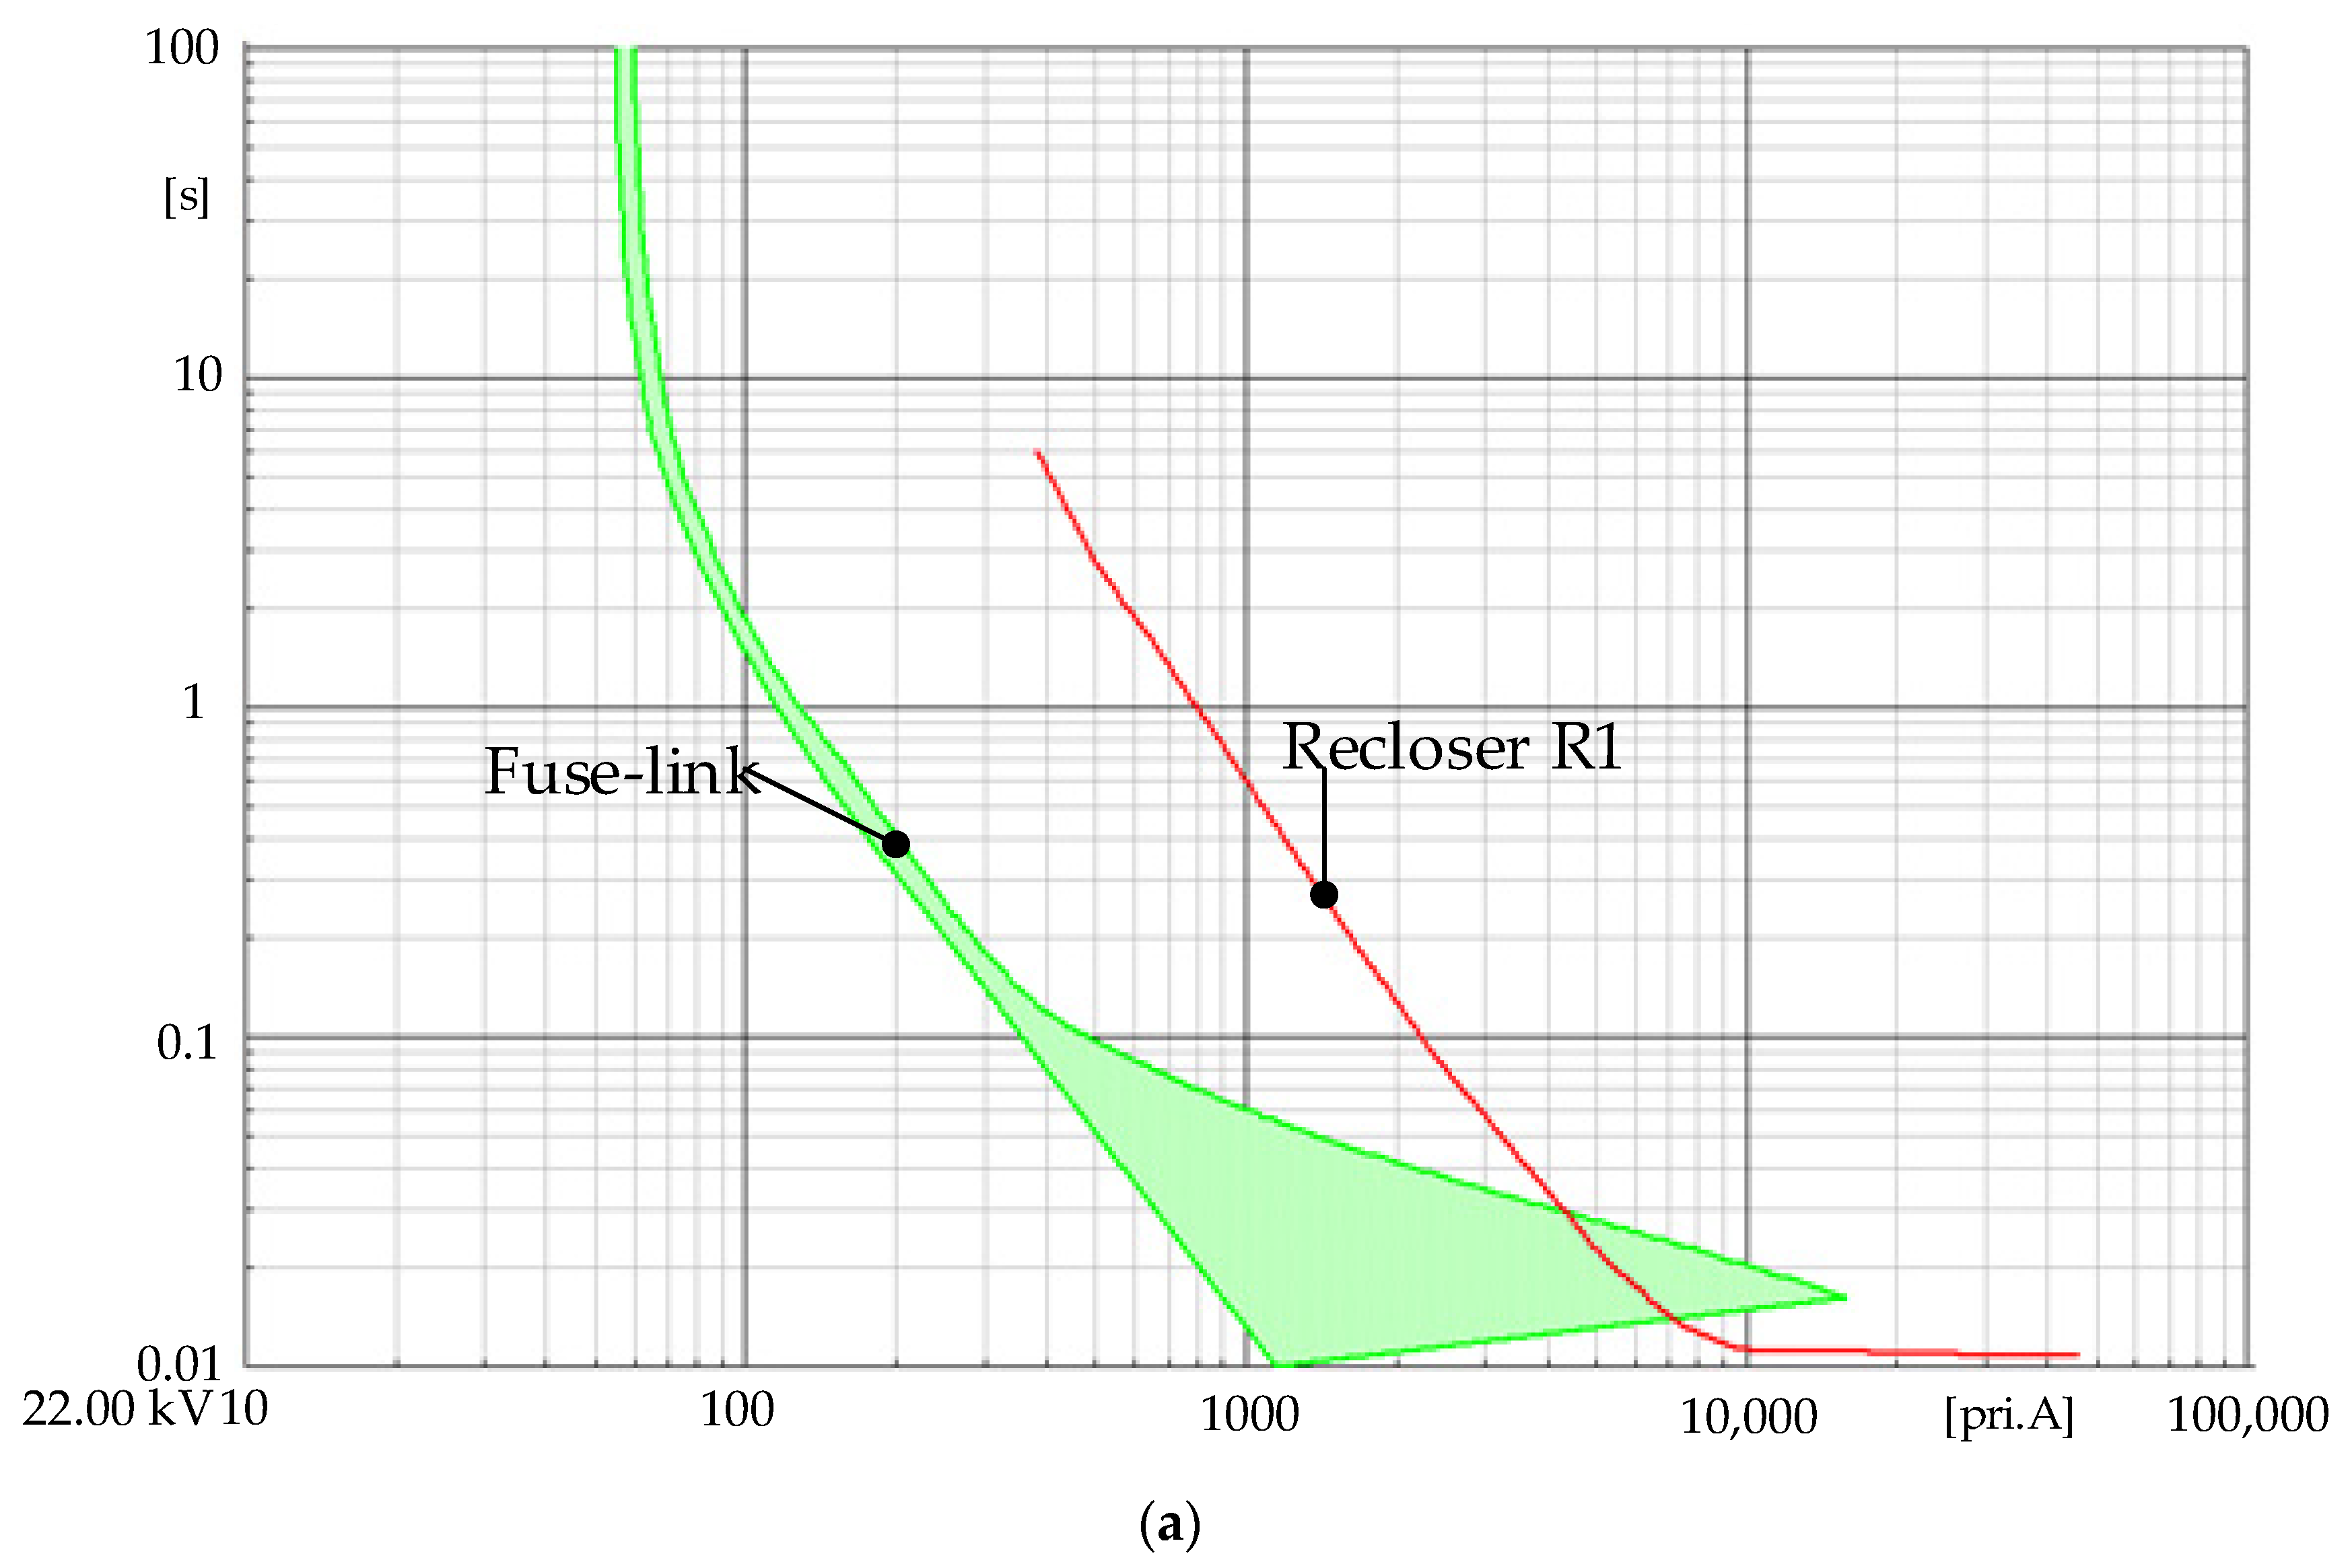
3.2. Sequential of Protective Relay Coordination between the Recloser R1 and Drop-Out Fuse Rated 15k at F1 Position

While the recloser R1 is determined, the setting value is according to Section 3.1 in the graph plotting interval R1 recloser and fuse-link 15k, which is shown in Figure 3a,b of both phase and ground sides.
The failure occurs at the lateral F1 position, as shown in both figures. The fuse-link devices are melted, as well as behaviour in the previous case. Considering this, the loads are connected at the F1 location, causing the loss of power at load L27.

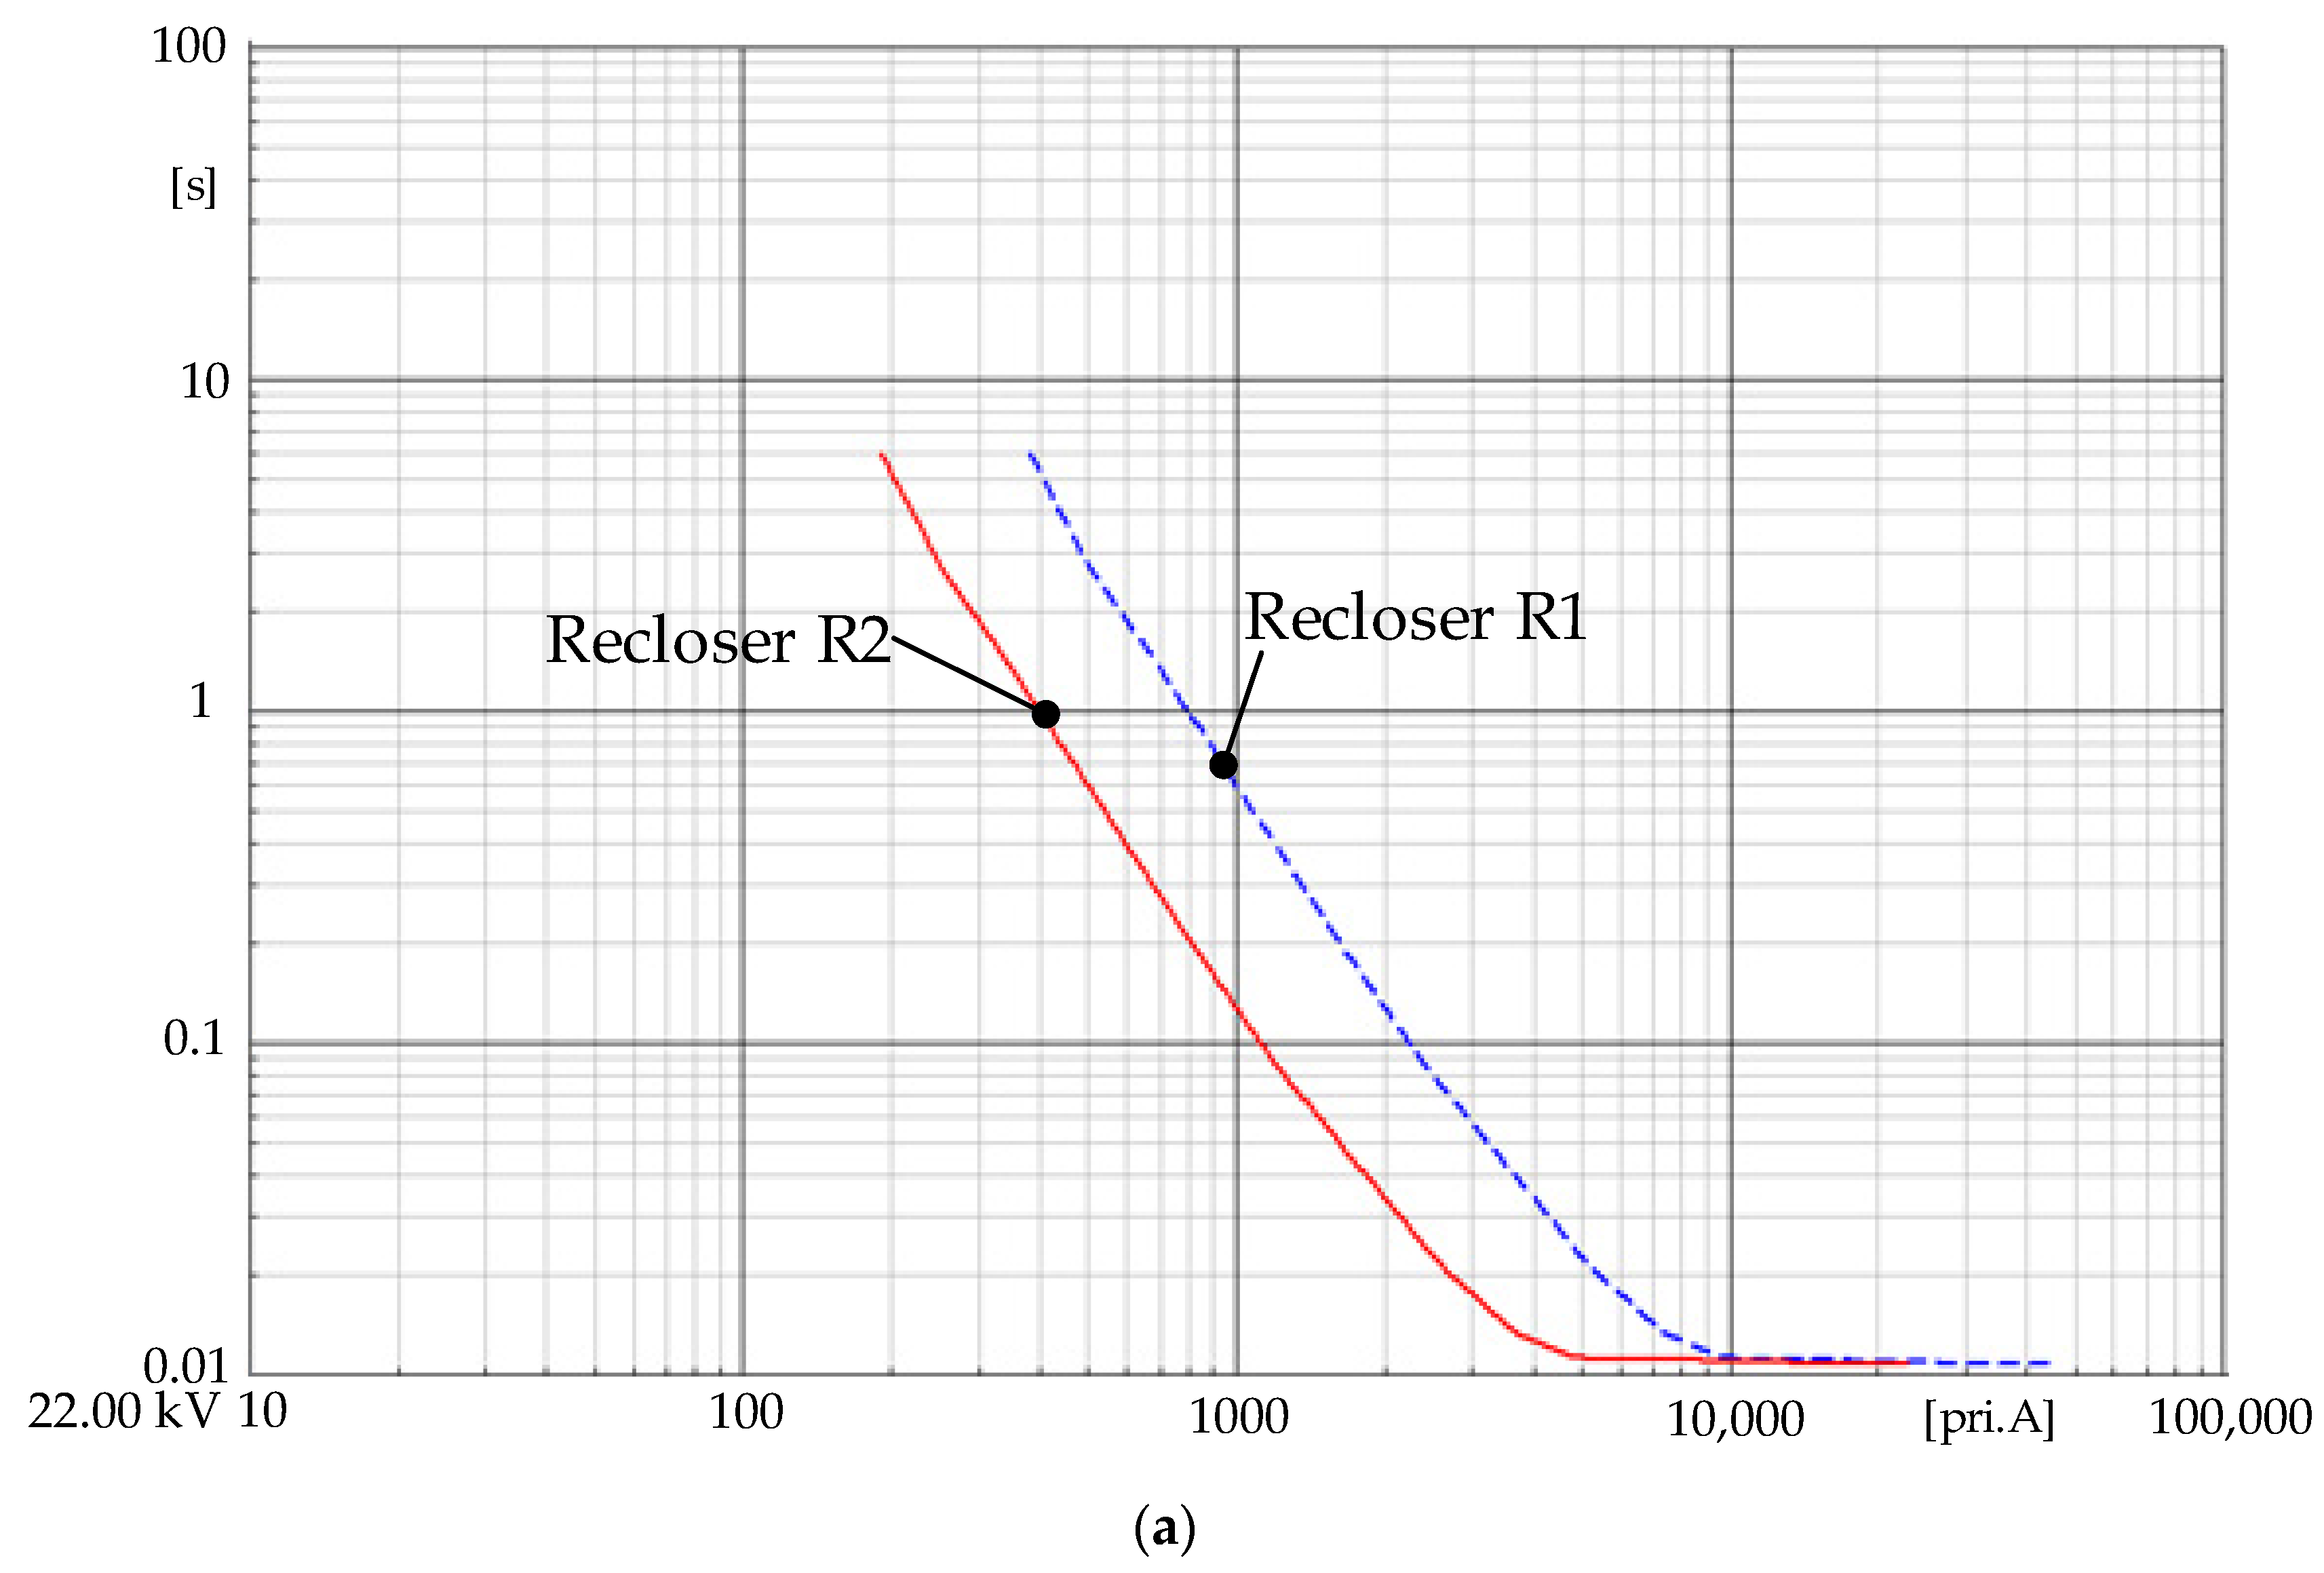
3.3. Protective Coordination between Recloser R1 and R2 Devices

In Figure 1, the recloser R2 will be operated for preventing the AVR device acting only in the slow curve period. Moreover, the functional at recloser R1 is previously operated. Considering this, the load capacity and the fault current magnitude on the distribution system are set at recloser R2, as shown in Table 8.
Regarding the correlation between reclosers R1 and R2, the operating time of the phase side is picked up time at the recloser R2 before recloser R1 due to recloser R1 is connected from the substation sides. This means that the recloser R2 result is always disconnected before recloser R1 if the fault occurs at both sides. By contrast, both reclosers are simultaneously operated at the fault current approximately 10 kA at phase side and 4 kA at ground side. Thus, the phase side will be operated timing faster than the ground side. However, the coordinated functions of recloser can be combined with both the phase and grounding operations, as shown in Figure 4a,b.

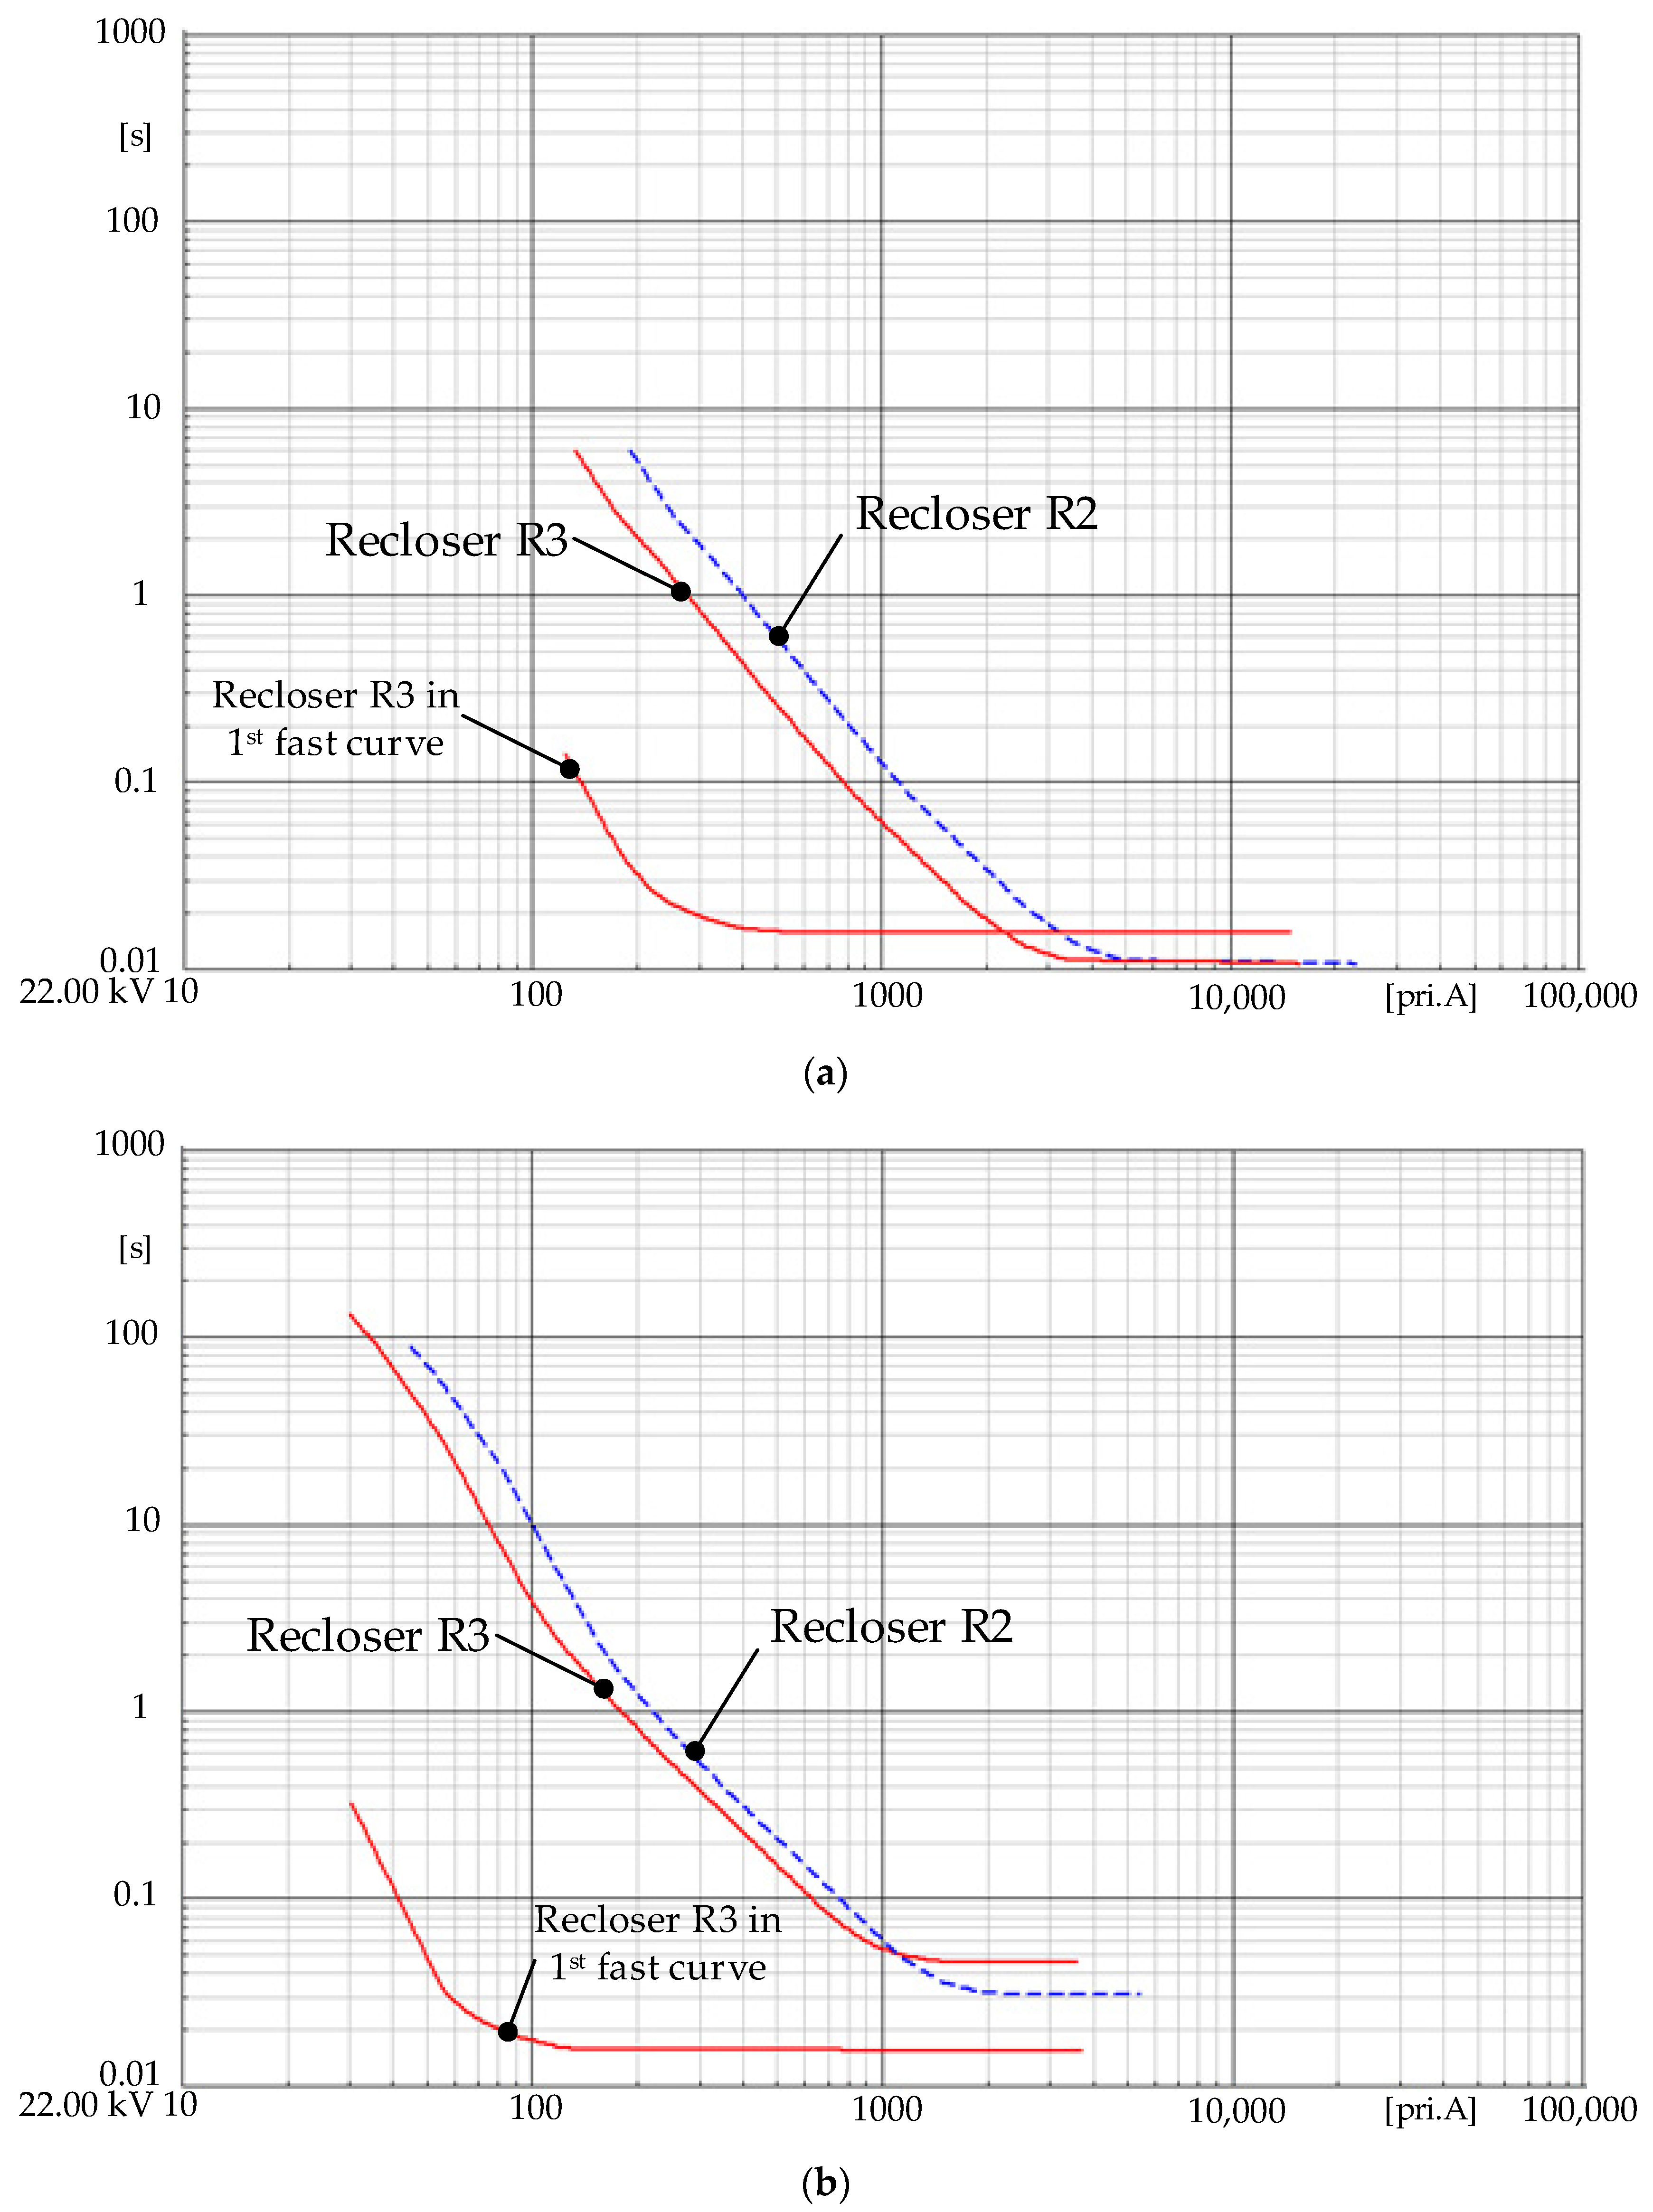
3.4. Coordination with Recloser R2 and R3

The load capacity on the distribution system and the fault current magnitude at the recloser R3 are compared, as shown in Table 9.
The correlates between recloser R2 and R3 are shown in Figure 5a,b, respectively, as shown in Table 8. The result of functional can support in both the phase and ground operations. Since the fault occurrence, the recloser R3 is first operated. Then, recloser R2 will be activated based on the configuration settle.
The protective cooperation is shown in Figure 6a,b. When fault occurs at the phase side near recloser R3, it will be operated at the priority, such as reclosers R3, R2, and R1, respectively. All reclosers will be acted on time, which is dependent on the fault location occurrence at the feeder line. Although the ground side behaviour also similarly happened at the phase side, recloser R3 will be used for the first time depending on a sequential of protection cooperation schemes.

3.5. Correlation between Recloser R3 and 25k Rated of Fuse-Link Device

The functional of recloser R3 is followed in Table 9, that identified the rated of fuse-link sizing. The placement of recloser R3 is operated in the fast curve zone in first time before the fuse-link break down. By considering in this case study, fuse-link-rated are limited by size 25k. Thus, it cannot be determined the protective device that is co-related on both phase and ground sides. For this reason, this simulation specifies the main protective function at the ground side only due to mostly fault occurrences. The protective coordinated curves of recloser R3 and fuse-link device are shown in Figure 6a,b.

4. Protective Device Functional Operation in Case with DG

This simulation presents the three-phase faults to the grounding situation, which is due to the occurrence of a high magnitude. However, the phase to the grounding situation has the lowest magnitude. The short current impedance is 40 Ω. The DigSILENT Power Factory program is used for the simulation in various fault locations on the distribution system.
Most problems of a distribution system include the three-phase and single-phase to ground fault. The current magnitude in various fault locations 1 until 16 positions along the distribution primary feeder. The behaviours of the current are similar to the fault current in case without DG connection. Since the highest current is shown at fault location 1 in case with DG connection due to the increase of the fault current injection by the DG side. All fault locations have been shown current magnitudes that are greater than the previous fault current compared with the result presented in Table 6. Therefore, the fault current is increasing due to the current from DG integration to the grid, in which the simulation results are shown in Table 10.
The fault current from the grounding side has the same magnitude as the result shown in Table 10. The fault current has the highest magnitude at fault location 1. Trending of this fault current will be reduced from location 1 to 16, respectively, which is based on the cable distancing from the fault location. Particularly, the DG aspect steadily increased the fault current since the distancing is considerably close to the DG location. In addition, the fault current of ground sides is getting more than the results at the same side in Table 6 as compared at point by point. The characteristics of the current are shown in Table 11.

4.1. Effect of Coordinates Are Compared with the Recloser R1 and Drop-Out Fuse of 25k Type in F2, F3, F4, and F5 Positions with DG Integrating

According to Figure 7a,b, the fault current situation is connected with DG. The three-phase fault occurs on the distribution system. The fault current will not impact recloser R1 and fuse-link devices. However, the DG injects the fault current through the fault location. Recloser R3 is operated on the fast curve from the grounding side before the drop-out fuse operates and melts. In addition, the recloser R3 cannot be detected on this fault location. However, this situation will be impacted by the long period it takes for the system to recover.

4.2. Effect of Protective Devices in Operating between Reclosers R2 and R3 with the Fault Location Occurs after the Recloser R2

The DG connection at distribution system when the three-fault appears at this system. The recloser R3 is activated in the fast curve function of the grounding side which detects the signal before recloser R2. Considering this, recloser R3 is complexed to find out the fault location and obtain the long time for improvement of the system. Thus, the behaviour of the protection setting is shown in Figure 8a–c, respectively.
In summary, as per the previously cases without DG, the recloser is installed at the selection point that proposes in a non-directional type. The DG injects through the fault current to the grid. The DG and recloser are installed together due to the incorrect position of the active recloser. However, the directional type of recloser can address this problem.

4.3. Protective Devices Improvement When the DG Connection to the Distribution System

4.3.1. Improvement of Malfunctions between the Recloser and Fuse-Link Devices

The DG placement is near the termination line to incorrect function between recloser and fuse-link devices. The fault current of DG is introduced to the system with a fuse-link device with a high current magnitude compared with the recloser side. Thus, the fuse-link device is operated and melted before the recloser active by the fast curve function. Considering this, the loads are closely placed causing the loss of electricity. To address this problem, the fuse-link sizing must be increased, which could extend the timing, and the configuration must be set up for protection of the fuse-link device before melting occurs. The result after adjustment is shown in Figure 9. However, the corrected sizing is 40k, which is complied with the recloser R3.
However, the automatic voltage regulator (AVR) is installed behind the recloser R1, which could not be operated in the fast curve zone. They impact electrical users when the short circuit occurs on this system. Therefore, to be changed, the AVR to place at the recloser R1 position. The case study simulated the voltage level trend to provide energy for the load customer by 100%.

4.3.2. Simulation in Case of AVR Relocation

The relocation of AVR impacted the voltage supply of 100% of the load customers. The voltage trend is dependent on the distance far away from the substation that is slightly reduced in case of without DG. By considering the maximum voltage is 22.62 kV at 2 km distancing and the minimum voltage is 21.9 kV at 26 km distancing, which is slightly reduced from distancing at 2 km. In contrast, the 26 km distance of AVR placement directly impacts the voltage level due to the location being far away. By the way, in case DG placement on the system is quite supportive of the voltage profile, which maintains the voltage level smoothly changing. Despite the distance having changed, the voltage value is still quite a bit more changed as comparing without DG. The results are presented in Table 12.

5. Conclusions

This simulation studied the fault location on distribution systems. We compared the electricity outage with DG and without DG connected to the grid. This study aimed to investigate the effects of DG connection to the grid to address the problems on the distribution system. The simulated results present the parameters of the system that are due to install DG on that place. The parameters include voltage, current, and protective relay coordination, which are modelled after the actual PEA distribution system. The DG placement, which is close to the load or the middle line, has great advantages, such as the power loss and voltage improvement. With this, the middle line is complexed to select for DG placement at the present. Thus, the case studies compared the coordinated function without and with DG connections to the grid in various protective devices. Solutions were proposed to fix the malfunction of priority protective devices between recloser and fuse-link devices operating in the directional recloser device. The malfunctions between the recloser and fuse-link devices are provided. For this reason, the fuse link increases, which will provide more capacity for melting protection before the recloser operates at the fast curve zone. Thus, the electric loads lost power at this occurrence. This methodology is based on the adjustment of protection device coordination in case the distribution system has changing characteristic with different coordination related issues between various protective devices taken into consideration. Thus, the proposed coordination method can be applied to the various distribution system topologies that consist of similar protective devices.

Author Contributions

Conceptualization, A.K.; Methodology, S.Y.; Software, W.K.; Validation, S.Y.; Formal Analysis, W.K.; Investigation, W.K.; Resources, I.N.; Data Curation, I.N.; Writing—Original Draft Preparation, W.K.; Writing—Review & Editing, A.K. and S.Y.; Visualization, S.Y.; Supervision, I.N.; Project Administration, A.K.; Funding Acquisition, I.N. All authors have read and agreed to the published version of the manuscript.

Funding

This research was funded by the National Research Council of Thailand.

Institutional Review Board Statement

Not applicable.

Informed Consent Statement

Not applicable.

Data Availability Statement

Not applicable.

Acknowledgments

The authors wish to gratefully acknowledge financial support for this research from the National Research Council of Thailand.

Conflicts of Interest

The authors declare no conflict of interest.

References

  1. Razavi, S.E.; Rahimi, E.; Javadi, M.S.; Nezhad, A.E.; Lotfi, M.; Shafie-khah, M.; Catalão, J.P. Impact of Distributed Generation of Protection and Voltage Regulation of Distribution systems: A review. Renew. Sustain. Energy Rev. 2019, 105, 157–167. [Google Scholar] [CrossRef]
  2. Sunday, A.S.; Gafari, A.A.; Isaiah, G.A.; Oludamilare, B.A. Comparative assessment of techno-economic and environmental benefits in optimal allocation of distributed generators in distribution networks. Sci. Afr. 2023, 19, e01546. [Google Scholar]
  3. Muhammad, Y.; Amin, J.; Kashem, M.M.; Danny, S. An Adaptive Overcurrent Protection Scheme for Dual-Setting Directional Recloser and Fuse Coordination in Unbalanced Distribution Networks with Distributed Generation. IEEE Trans. Ind. Appl. 2022, 58, 1831–1842. [Google Scholar]
  4. Meskin, M.; Domijan, A.; Grinberg, I. Impact of distributed generation on the protection system of distributed networks analysis and remedies—Review paper. IET Gener. Transm. Distrib. 2020, 14, 5944–5960. [Google Scholar] [CrossRef]
  5. Issarachai, N.; Wikorn, K.; Suntiti, Y.; Atthapol, N. Characteristic Evaluation of Wind Power Distributed Generation Sizing in Distribution System. Sustainability 2023, 15, 5581. [Google Scholar]
  6. Chiradeja, P.; Yoomak, S.; Ngaopitakkul, A. Optimal Allocation of Multi-DG on Distribution System Reliability and Power Losses Using Differential Evolution Algorithm. Energy Procedia 2017, 141, 512–516. [Google Scholar] [CrossRef]
  7. Aly, M.M.; Mahrous, H.; Mahmoud, M.M. Recloser-fuse Coordination of Radial Distribution Systems with Different Technologies of Distributed ITCE. In Proceedings of the International Conference on Innovative Trends in Computer Engineering (ITCE), Aswan, Egypt, 2–4 February 2019; pp. 420–426. [Google Scholar]
  8. Yogesh, M.M.; Bhavesh, R.B.; Ramakrishna, G. Improvement in Recloser–Fuse Coordination Technique Based on Modification Factor. IEEE Syst. J. 2020, 14, 2770–2779. [Google Scholar]
  9. Ekramul, H.; Asfaqur, R.; Sabbir, A.; Md, R.B.; Fardin, H.; Kazi, M.M. An Adaptive Over Current Protection Scheme and Impact of Distributed Gerneration On IEEE 34 Radial Test Feeder. In Proceedings of the International Conference on Automation, Control and Mechatronics for Industry 4.0 (ACMI), Rajshahi, Bangladesh, 8–9 July 2021; pp. 1–6. [Google Scholar]
  10. Valbuena, G.J.; Pavas, A. Assessment of DG Effect on a Protection Scheme considering High Impedance Faults. In Proceedings of the IEEE Workshop on Power Electronics and Power Quality Applications (PEPQA), Manizales, Colombia, 30–31 May 2019; pp. 1–6. [Google Scholar]
  11. Asma, M.; Nesrine, S.; Hajer, J.; Souad, C. Impact of Distributed Generation on the Protection System in Tunisian Distribution Network. In Proceedings of the 15th International Multi-Conference on Systems, Signals & Devices (SSD), Yasmine Hammamet, Tunisia, 19–22 March 2018; pp. 514–520. [Google Scholar]
  12. Valbuena, J.; Pavas, A. Loss of Coordination in a Protection Scheme due to DG assessed by means of Reliability Analysis. In Proceedings of the IEEE Milan PowerTech, Milan, Italy, 23–27 June 2019; pp. 1–6. [Google Scholar]
  13. Jamal, W.; Saad, M.S.; Naser, E.N.; Khalil, E.; Faisal, A.M. Applicability Analysis of Proactive Recloser-Fuse Scheme for Wind Distributed Generation into Modern Distribution Network. In Proceedings of the 9th International Renewable Energy Congress (IREC), Hammamet, Tunisia, 20–22 March 2018; pp. 1–6. [Google Scholar]
  14. Chiradeja, P.; Ngaopitakkul, A. The impact of capacity and location of multidistributed generator integrated in the distribution system on electrical line losses, reliability, and interruption cost. Environ. Prog. Sustain. Energy 2015, 34, 1763–1773. [Google Scholar] [CrossRef]
  15. Eid, A.G.; Adel, A.; Akram, E. Sustained Coordination of Devices in a Two-Layer Protection Scheme for DGs-Integrated Distribution Network Considering System Dynamics. IEEE Access 2021, 9, 111865–111878. [Google Scholar]
  16. Panida, T.; Peerapol, J. Implementation of Optimal Protection Coordination for Microgrids with Distributed Generations Using Quaternary Protection Scheme. J. Electr. Comput. Eng. 2020, 2020, 2568652. [Google Scholar]
  17. Zilin, L.; Jiefeng, H.; Ka, W.C. A New Current Limiting and Overload Protection Scheme for Distributed Inverters in Microgrids Under Grid Faults. IEEE Trans. Ind. Appl. 2021, 57, 6362–6374. [Google Scholar]
  18. Nikolaidis, V.C.; Desiniotis, D.; Papaspiliotopoulos, V.A.; Tsimtsios, A.M.; Korres, G.N. Optimal Recloser-Fuse and Distribution Network Protection Coordination including Distributed Generation Relays. In Proceedings of the International Conference on Smart Energy Systems and Technologies (SEST), Eindhoven, The Netherlands, 5–7 September 2022; pp. 1–6. [Google Scholar]
  19. Penido DR, R.; de Araujo, L.R.; Rodrigues, V.T.; do Nascimento, K.B. An Analytical Zero Sequence Method to Locate Fault in Distribution Systems Rich in DG. IEEE Trans. Smart Grid 2022, 13, 1849–1859. [Google Scholar] [CrossRef]
  20. Hitesh, A.; Rai, J.N. Protection Coordination of Distributed system with Distributed Generation. In Proceedings of the International Conference on Intelligent Controller and Computing for Smart Power (ICICCSP), Hyderabad, India, 21–23 July 2022; pp. 1–6. [Google Scholar]
  21. Sahebkar, J.F.; Zareein, M.; Soroushmehr, H.; Mortazavi, H. Coordination of Directional Overcurrent Protection Relay for Distribution Network with Embedded DG. In Proceedings of the 5th Conference on Knowledge Based Engineering and Innovation (KBEI), Tehran, Iran, 28 February–1 March 2019; pp. 1–6. [Google Scholar]
  22. Mahdi, G.; Reza, M.C.; Hatem, H.Z.; Seyed, M.H.M. Design of Setting Group-Based Overcurrent Protection Scheme for Active Distribution Networks Using MILP. IEEE Trans. Smart Grid 2021, 12, 1185–1193. [Google Scholar]
  23. Alaa, H.E.; Ahmed, A.M.E.; Ashraf, I.M. Improved Adaptive Protection Scheme Based Combined Centralized/Decentralized Communications for Power Systems Equipped with Distributed Generation. IEEE Access 2022, 10, 97061–97074. [Google Scholar]
  24. Ehsan, A.; Bahador, F.; Iman, S.; Hassan, H.A. Multi-Agent System-Based Hierarchical Protection Scheme for Distribution Networks with High Penetration of Electronically-Coupled DGs. IEEE Access 2021, 9, 102998–103018. [Google Scholar]
  25. Mahamad, N.A. Adaptive Protection Coordination Scheme Using Numerical Directional Overcurrent Relays. IEEE Trans. Ind. Inform. 2019, 15, 64–73. [Google Scholar]
  26. Sadeghi, S.M.; Daryalal, M.; Abasi, M. Two-stage planning of synchronous distributed generations in distribution network considering protection coordination index and optimal operation situation. IET Renew. Power Gener. 2022, 16, 2338–2356. [Google Scholar] [CrossRef]
  27. Lim, S.-H.; Park, M.-K. Analysis on Protection Coordination of OCRs Using Voltage Components for the Application of SFCL in a Power Distribution System with DG. IEEE Trans. Appl. Supercond. 2021, 31, 5602106. [Google Scholar] [CrossRef]
  28. Muhammad, U.; Mahmoud, M.; Hazlie, M.; Nurulafiqah, N.M.; Haroon, F.; Alireza, P. Optimal Protection Coordination Scheme for Radial Distribution Network Considering ON/OFF-Grid. IEEE Access 2021, 9, 34921–34937. [Google Scholar]
  29. Biller, M.; Jaeger, J. Protection Algorithms for Closed-Ring Grids with Distributed Generation. IEEE Trans. Power Deliv. 2022, 37, 4042–4052. [Google Scholar] [CrossRef]
  30. Aghdam, T.S.; Karegar, H.K.; Zeineldin, H.H. Optimal Coordination of Double-Inverse Overcurrent Relays for Stable Operation of DGs. IEEE Trans. Ind. Inform. 2019, 15, 183–192. [Google Scholar] [CrossRef]
  31. Fayazi, H.; Fani, B.; Moazzami, M.; Shahgholian, G. An offline three-level protection coordination scheme for distribution systems considering transient stability of synchronous distributed generation. Int. J. Electr. Power Energy Syst. 2021, 131, 107069. [Google Scholar] [CrossRef]
  32. Sadegh, J.; Hossein, B. Protection Method for Radial Distribution Systems with DG Using Local Voltage Measurements. IEEE Trans. Power Deliv. 2019, 34, 651–660. [Google Scholar]
  33. Muhammad, Y.; Kashem, M.M.; Danny, S. An Investigative Analysis of the Protection Performance of Unbalanced Distribution Networks with Higher Concentration of Distributed Energy Resources. IEEE Trans. Ind. Appl. 2022, 58, 1771–1782. [Google Scholar]
  34. Ali, A.; Behrooz, V.; Amin, F.N. Reconfiguration of Active Distribution Networks Equipped with Soft Open Points Considering Protection Constraints. J. Mod. Power Syst. Clean Energy 2023, 11, 212–222. [Google Scholar]
  35. Tohid, S.A.; Hossein, K.K.; Hatem, H.Z. Variable Tripping Time Differential Protection for Microgrids Considering DG Stability. IEEE Trans. Smart Grid 2019, 10, 2407–2415. [Google Scholar]
  36. Debadatta, A.G. Protection algorithms of microgrids with inverter interfaced distributed generation units—A review. Electr. Power Syst. Res. 2021, 192, 106986. [Google Scholar]
  37. Strezoski, L.; Stefani, I.; Bekut, D. Novel method for adaptive relay protection in distribution systems with electronically-coupled DERs. Int. J. Electr. Power Energy Syst. 2020, 116, 105551. [Google Scholar] [CrossRef]
  38. Momesso, A.E.C.; Kume, G.Y.; Faria, W.R.; Pereira, B.R.; Asada, E.N. Automatic Recloser Adjustment for Power Distribution Systems. IEEE Trans. Power Deliv. 2022, 37, 3958–3967. [Google Scholar] [CrossRef]
  39. Dos Santos, C.; Bartmeyer, P.M.; Trindade, F.C.; Lyra, C. Optimized Allocation of Fault Transmitters for Improving the Recloser-Fuse Coordination. IEEE Trans. Power Syst. 2022, 2022, 3225270. [Google Scholar] [CrossRef]
  40. Amin, Y.; Hossein, E. A new protection algorithm for tackling the impact of fault-resistance and cloud energy storage on coordination of recloser-fuse protection. IET Gener. Transm. Distrib. 2023, 17, 1827–1835. [Google Scholar]
  41. Wandry, R.F.; Ciniro, A.L.N.; Benvindo, R.P.J. Cost-Effectiveness Enhancement in Distribution Networks Protection System Planning. IEEE Trans. Power Deliv. 2022, 37, 1180–1192. [Google Scholar]
  42. Elmitwally, A.; Kotb, M.F.; Gouda, E.; Elgamal, M. A Coordination Scheme for a Combined Protection System Considering Dynamic Behavior and Wind DGs Fault Ride-Through Constraints. Electr. Power Syst. Res. 2022, 213, 108720. [Google Scholar] [CrossRef]
  43. Feras, A.; Abdelaziz, S.S.; Naser, E.; Othman, A.; Mohamed, K.; Ibrahim, G. Assessment of the impact of a 10-MW grid-tied solar system on the Libyan grid in terms of the power protection system stability. Clean Energy 2023, 7, 389–407. [Google Scholar]
  44. Eyad, Z.; Feras, A.; Othman, A.; Naser, E. A new adaptive protection approach for overcurrent relays using novel nonstandard current-voltage characteristics. Electr. Power Syst. Res. 2023, 216, 109083. [Google Scholar]
  45. Bamshad, A.; Ghaffarzadeh, N. A novel smart overcurrent protection scheme for renewables-dominated distribution feeders based on quadratic-level multi-agent system. Electr. Eng. 2023, 105, 1497–1539. [Google Scholar] [CrossRef]
  46. Bisheh, H.; Fani, B.; Shahgholian, G.; Sadeghkhani, I.; Guerrero, J.M. An adaptive fuse-saving protection scheme for active distribution network. Int. J. Electr. Power Energy Syst. 2023, 144, 108625. [Google Scholar] [CrossRef]
  47. Hojjaty, M.; Fani, B.; Sadeghkhani, I. Intelligent protection coordination restoration strategy for active distribution networks. IET Gener. Transm. Distrib. 2021, 16, 397–413. [Google Scholar] [CrossRef]
Figure 1. 22 kV radial distribution system.
Applsci 13 07970 g001
Figure 2. Coordinate protection between recloser R1 and fuse-link of 25k rated. (a) At the phase side; (b) At the ground side.
Applsci 13 07970 g002aApplsci 13 07970 g002b
Figure 3. Coordination between recloser R1 and the fuse-link of 15k sizing. (a) At the phase side; (b) At the ground side.
Applsci 13 07970 g003
Figure 4. Protective coordination between recloser R1 and R2. (a) At the phase side; (b) At the ground side.
Applsci 13 07970 g004aApplsci 13 07970 g004b
Figure 5. Coordination between reclosers R2 and R3. (a) At the phase side; (b) At the ground side.
Applsci 13 07970 g005
Figure 6. Coordinated functions of the recloser R3 and fuse-link 25k rated. (a) At the phase side; (b) At the ground side.
Applsci 13 07970 g006
Figure 7. The coordinates of the recloser R1 and fuse-link of 25k. (a) At the phase side; (b) At the ground side.
Applsci 13 07970 g007
Figure 8. Coordinates protection scheme in various recloser operations. (a) Reclosers R1 and R3 and fuse-link of 25k devices; (b) Reclosers R2 and R3 under the phase-fault condition; (c) Reclosers R2 and R3 under the ground-fault condition.
Applsci 13 07970 g008aApplsci 13 07970 g008b
Figure 9. Improvement of coordinates protection scheme for recloser R3 and fuse-link position 13.
Applsci 13 07970 g009
Table 1. Load characteristics of PEA’s 22 kV radial distribution system.
Load PositionLoad TypesLoad Demand (kVA)
L1Medium scale industry2700
L2, L12, L19Residential50
L3, L4, L6, L9, L10, L13, L15, L32, L37Residential250
L5, L16, L17, L18, L23, L25, L30, L34, L36, L38Residential150
L7, L11, L27Small scale industry500
L8, L14, L21, L22, L24, L26, L31, L33, L35Residential100
L20Residential30
L28Residential10
L29Residential100
L39Medium scale industry1000
Table 2. Cable specification of 22 kV distribution system.
DescriptionsTechnical Information
Cross-Section Area50 mm250 mm250 mm2185 mm2185 mm2
Cable typeSACPICACSRPICSAC
Lead conductor3 conductors
Type of conductorAluminum
Outer diameters8.00 mm.8.00 mm.8.00 mm.15.80 mm.15.98 mm.
DC resistance0.641 Ω0.5711 Ω0.5711 Ω0.164 Ω0.164 Ω
Table 3. Impedance sequence of 22 kV cable.
Cable TypesZero SequencePositive SequenceNegative Sequence
R0X0R1X1R2X2
50SAC1.0193291.8975380.82193530.33951880.82193530.3395188
50PIC1.0016671.6708390.82192790.45534020.82192790.4553402
50ACSR0.82197021.6695770.64033650.45450990.64033650.4545099
185PIC0.39135511.6296870.21065760.41440610.21065760.4144061
185SAC0.4029421.8578750.21065980.29858550.21065980.2985855
Table 4. Voltage level from different measurement points in case of various DG placement.
Distancing from SubstationVoltage Level by Individual Location (kV)
Without DG2 km4 km6 km8 km10 km12 km14 km16 km18 km20 km22 km24 km26 km
2 km22.61022.75922.77222.78522.79222.79922.80222.80322.79822.79722.79422.78822.78222.776
4 km22.35822.50922.66822.68622.69622.70422.70822.70922.70322.70122.69722.69022.68122.673
6 km22.10722.26122.42322.58722.59822.60922.61422.61522.60822.60622.60022.59122.58022.570
8 km22.90922.06522.22922.39522.55222.56422.57022.57222.56322.56022.55322.54322.53022.517
10 km21.72121.87922.04522.21322.37222.53022.53722.53822.52922.52522.51722.50422.49022.475
12 km21.58921.74821.91622.08622.24622.40522.55722.55822.54722.54322.53422.51922.50322.486
14 km21.49721.65821.82621.99722.15922.31922.47222.61722.60522.60022.58922.57422.55522.536
16 km21.31721.48121.65421.82921.99422.15822.31522.46322.56922.56322.54822.52522.49822.471
18 km21.24321.40821.58121.75821.92422.08922.24622.39522.50222.63922.62222.59822.56922.540
20 km21.16721.33221.50721.68421.85122.01622.17422.32422.43122.56822.69422.68822.63722.606
22 km21.11421.28021.45521.63221.80021.96522.12422.27422.38122.51922.64522.76022.72722.694
24 km21.07921.24621.42121.59921.76621.93222.09122.24122.34922.48722.61322.72922.82622.802
26 km21.04521.21121.38721.56521.73321.89922.05822.20922.31722.45422.58122.69722.80522.911
Table 5. Power loss for various DG placements.
Distance of DG Placement from Substation
(km)
Power Loss
(kW)
without DG370
2350
4280
6210
8180
10150
12140
14150
16160
18170
20190
22230
24270
26300
Table 6. Maximum and minimum fault currents in cases without DG.
LocationsMaximum Current (A)Minimum Current (A)
3 Φ1 Φ3 Φ1 Φ
128123262464234
224642182050314
322663131821307
421903111534295
521783111394288
620853081527295
720213061492293
819703041863303
919213021040264
101290296968266
1112302911045274
121211289935262
131141282627219
1411092791012269
151079276752237
16937258836244
Table 7. Parameter setting of recloser R1.
Recloser PositionPhase SettingGround Setting
R1Pick up = 360 A
Curve TCC 2 = 116 Time Interval = 10 s
Reset Time = 120 s
Pick up = 90 A
Curve TCC 2 = 165 Time Interval = 10 s
Reset Time = 120 s
Table 8. Configuration setting of recloser R2.
Recloser PositionPhase SettingGround Setting
R2Pick up = 180 A
Curve TCC 2 = 116
Time Interval = 10 s
Reset Time = 120 s
Pick up = 45 A
Curve TCC 2 = 165
Time Interval = 10 s
Reset Time = 120 s
Table 9. Configuration setting of recloser R3.
Recloser PositionPhase SettingGround Setting
R3Pick up = 125 A
Curve TCC 1 = 101
Curve TCC 2 = 116
Time Interval 1 = 5 s
Time Interval 2 = 15 s
Reset Time = 120 s
Pick up = 30 A
Curve TCC 2 = 102
Curve TCC 2 = 165 Time dial 1.5
Time Interval 1 = 5 s
Time Interval 2 = 15 s
Reset Time = 120 s
Table 10. Three-phase fault current in case of DG placement on the distribution system.
Fault LocationsMaximum Current (A)Minimum Current (A)
At Fault PositionAt SubstationAt DGAt Fault PositionAt SubstationAt DG
13447281266629602394567
23149246468825061960548
32965226670522511720535
42896219071218521400455
52885217871316541248409
62801208572318831402486
72743202173118571368495
82698197073722331630610
9265519217441224885343
10220712909211404821586
11217712309521663940728
12216812119631420794631
132141114110101279841397
142131110910341821943880
152124107910601152585575
16213093712241688742970
Table 11. Single-phase fault to ground current on the distribution system with DG connection.
Fault Locations Maximum Current (A)Minimum Current (A)
At Fault LocationAt SubstationAt DGAt Fault LocationAt SubstationAt DG
13332864732628046
23282745431826552
33262675929125556
43252646127924456
53242636127323855
63232596427824159
73222566627523961
83222536728424565
93202516924721358
103102248627820177
113072178928820484
123052159027619582
133012079523115973
142982029728719593
152961989925417084
16285177109268167103
Table 12. Voltage improvement result in various positions.
Distancing
(km)
Voltage Level without DG
(kV)
Voltage Level with DG
(kV)
222.6222.85
422.3622.69
622.1022.58
821.8922.52
1021.8022.20
1222.4422.20
1422.3222.25
1622.2322.31
1822.1522.42
2022.0822.43
2222.0122.52
2421.9622.63
2621.9022.73
Disclaimer/Publisher’s Note: The statements, opinions and data contained in all publications are solely those of the individual author(s) and contributor(s) and not of MDPI and/or the editor(s). MDPI and/or the editor(s) disclaim responsibility for any injury to people or property resulting from any ideas, methods, instructions or products referred to in the content.

