Article

Experimental Study of the Influence of the Interaction of a Conveyor Belt Support System on Belt Damage Using Video Analysis

1
Faculty of Mining, Ecology, Process Control and Geotechnology, Technical University of Kosice, Park Komenskeho 14, 042 00 Kosice, Slovakia
2
Faculty of Mechanical Engineering, Technical University of Kosice, Letna 9, 042 00 Kosice, Slovakia
3
Faculty of Electrical Engineering and Informatics, Technical University of Kosice, Letna 9, 042 00 Kosice, Slovakia
*
Author to whom correspondence should be addressed.
Appl. Sci. 2023, 13(13), 7935; https://doi.org/10.3390/app13137935
Submission received: 31 May 2023 / Revised: 27 June 2023 / Accepted: 28 June 2023 / Published: 6 July 2023

Abstract

:
This article describes a method of obtaining data from the examination of an impact process by capturing it with a TroubleShooter TSHRMM high-speed camera and evaluating the results of a video analysis of the impact of the load on a conveyor belt using MiDAS Player version 5.0.0.3. By using the conveyor belt deflection obtained from the video analysis and the visual damage to the conveyor belt from an impactor, damage classification models were created. This model was created for two groups of experiments that took place without the presence of a support system and with the presence of a support system, respectively. The experimental research included monitoring the deflection of the conveyor belt and the degree of damage to the conveyor belt from the selected parameters.

1. Introduction

Conveyor systems are widely used for horizontal transport in underground mines, where many elements of the conveyor are continuously monitored [1]. Li et al. [2] proposed a method for predicting the condition and performance evaluation of a conveyor belt based on a dynamic Bayesian network (DBN).
The performance of transport systems related to the faults of conveyor belts was examined by Homisin et al. [3]. An analysis of conveyor belt (CB) faults was carried out using various evaluation methods, including the visualization of CB damage. During monitoring, it is important to record the failures and causes of CB damage and other problems that arise from the use of conveyor belts [4]. Fedorko [5] presented a methodology for performing failure analysis with the support of virtual reality. For an online method of detecting the longitudinal rupture of a conveyor, the authors of [6] proposed belt images based on an improved SSR algorithm. A longitudinal rupture analysis was performed in that study to assess the trend of conveyor belt failure prediction [7]. Kellis [8] examined the development of a conveyor belt condition monitoring system that actively monitors the conveyor belt. Guo et al. [9] dealt with existing techniques and the latest conveyor belt defect detection methods. Hrabovsky et al. [10] present the application of online monitoring of the transport system for the needs of failure analysis, prediction, and evaluation of operating indicators. To improve the efficiency of fault identification, Wang et al. [11] combined an Internet of Things (IoT) platform and a Light Gradient Boosting Machine (LGBM) model to create a fault diagnostics system for a conveyor belt. Currently, many non-destructive testing (NDT) methods have been proposed for belt condition inspection based on machine learning [12]. In [13,14], the authors proposed a method of detecting conveyor belt damage based on deep learning. Qu et al. [15] proposed a method of detecting conveyor belt damage based on an ADCN (Adaptive Deep Convolutional Network) based on a deep learning algorithm. A deep neural network was used by Guo et al. [16] to design a new method of detecting conveyor belt damage based on CenterNet.
User experience has shown that most belt damage is caused by improper operation of the conveyor or its technical condition. Bortnowski et al. [17] presented an overview of CB damage and a classification of their causes using decision trees. For each type of damage, the correct way to prevent and monitor the condition of the belt was indicated. Changes in damage to the CB core can lead to serious defects or even the rupture of the belt. Early detection of damage to the covering layers of a CB can help the user to ensure its maintenance more appropriately. The study in [18] is based on data obtained using the mobile DiagBelt system for non-invasive diagnostics of steel-core conveyor belts. Using non-invasive conveyor belt diagnostics when damage is detected enables a significant reduction in belt replacement costs, as well as evaluation of the belt’s usability and the changes in the degree of wear over time. Kirjanow-Blazej et al. [19] presented an artificial intelligence-based approach for classifying CB damage. Bajda and Hardygora [20] simulated defects in conveyor belts (puncture and longitudinal cuts) and monitored their resistance to these defects.
Many studies [21,22,23] have focused on investigating the resistance of conveyor belts that have been exposed to impact loads. The results are models that describe the process of the impact of the material on the CB.
Stachowiak et al. [24] used video recordings of a moving conveyor belt to detect CB damage. Images taken with a binocular camera were used to detect wear and damage to mining conveyor belts caused by outside materials [25]. Che et al. [26] proposed a method for detecting CB damage (audio–visual fusion). This method collects, processes, and analyzes CB images and sounds in various operating states. Subsequently, the sonic properties of the normal, jerky, and scratched conveyor belts were extracted. The extracted properties of the images and sounds were merged and classified using a machine-learning algorithm.
One of the most critical places where a large number of CB damage incidents occur is the place where the material impacts the conveyor belt. Here, significant deflections of the CB occur. Therefore, the aim of this article is to use video analysis to determine the deflection of a CB at the point of impact of the material and, based on the results obtained, to trace the correlation of the damage to the CB with the magnitude of the deflection.

2. Materials and Methods

2.1. Test Equipment

The experiments were carried out on a test rig (Figure 1). The test facility was equipped with a hydraulic system to clamp the belt sample and an additional hydraulic system to bring the sample to the required tension. The tension and impact forces were measured using two tensiometric sensors mounted on the test rig structure. The design of the test equipment was based on current requirements from previous research and on the requirements of the CB manufacturer in Slovakia.
This device was constructed at the Institute of Logistics and Transport as a unique testing device. Currently, a new impact bed equipped with impact rods is being prepared, which is to replace the current traditional support system consisting of rollers. This device was supported by the filing and issuance of the patents PP 50008-2021 and PP 50054-2021. In addition to testing the impact resistance of the CBs, the institute participates in experimental research by testing the impact resistance of other rubber composites, such as ballistic panels or rubber seals. At the institute, an intelligent diagnostic system for the identification of the damage to the CB is being developed on a test model of an experimental pipe conveyor line with the integration of magnetic wires, magnetic labelling, and RFID cues to identify damage to the CBs.
During the experiment, it was possible to adjust the weight of the impactor between 50 kg and 100 kg (for simulation of the varying specific gravity of the transported material), the impactor head shape may be a ball, needle, or cone (simulation of different types of incident material), the impact height of the impactor up to a height of 2.6 m (simulation of different impact heights of conveyor belt transport), the type of CB (simulation of different operating conditions, for which different types of conveyor are also intended), and to conduct experiments with and without the support system.
Experiments were carried out both without a support system and with a support system (two steel rollers with a diameter of 80 mm and an axial distance of 160 mm). The impactor fell between the rollers. The ball-shaped head of the impactor simulated the impact of incoherent crumbly material. In the experiments, the simulated weight m of the incident material ranged from 50 to 100 kg. The impact heights h were selected ranging from 0.2 to 2.6 m with a differential of 0.2 m. A rubber–textile CB of type P2500 was studied. P stands for the polyamide textile layer and 2500 expresses the rigidity of the CB [Nmm−1]. Each test sample had dimensions of 1400 × 160 mm. The samples were prepared according to the methodology described in [27]. The tension force in the experiments was 40 kN, which is one-tenth of the belt strength per millimetre of width (the manufacturer’s recommendation). The described test device did not enable the movement of the CB. The conveyor belt sample was firmly fixed in the hydraulic jaws. Experimental testing of the belt during motion could not be performed using this device. Throughout the experiment, the impact force exerted by the falling load on the CB at the moment of impact was recorded using a strain gauge sensor.

2.2. Video Analysis

A high-speed TroubleShooter TSHRMM camera was used to capture the testing of the conveyor belt (Figure 2). This provides different options for the camera resolution and recording speed, and it also enables the use of 3 GB of camera memory using different combinations of the resolution and recording speed.
The measurement used a resolution of 1280 × 1024 pixels and a frame rate of 250 frames per second. Various lenses were also available, which were used depending on the situation. The recording location was additionally illuminated using a halogen reflector.
MiDAS Player version 5.0.0.3 was used for the video analysis of the load falling on the CB (Figure 3). This served as an aid for evaluating the data that could be determined from the video files.

3. Theory/Calculation

3.1. Degree of Belt Damage

When the material falls on the CB, multiple types of damage can occur, including destructive damage, i.e., the conveyor belt breaks. A puncture is usually considered to damage all the layers (the upper covering layer, the skeleton, and the lower covering layer) of the CB at the same time. The conveyor belt puncture resistance is the ability of the conveyor belt to absorb the impact energy generated by the impact of the material on the conveyor belt without damaging it. Otherwise, the conveyor belt would be damaged.
Previous experimental research shows that damage to the conveyor belt is manifested mainly on the upper covering layer in the form of transverse and longitudinal grooves, point punctures, or punctures, which can lead to damage to the CB skeleton.
For the purpose of the analysis and evaluation of our research, the tested test samples of conveyor belts were divided into four basic groups based on the resulting degree of damage (Table 1). A detailed classification of the damage is presented in [22].
Damage 0 and Damage 1 (non-serious damage) define the degree of damage which, in the case of practical use of the CB, does not cause it to be immediately taken out of service. On the other hand, Damage 2 and Damage 3 (serious damage) are defined as damage that can cause a conveyor belt to be taken out of service.

3.2. Evaluation Methods

Basic statistical methods, regression, and correlation analysis were used to analyze the damage and impact resistance of the conveyor belts using video analysis. A decision tree was used to create a classification model for classifying the damage to test the samples.
Regression analysis was used to determine the relationship between the dependent variable Y and the k-independent variables. The model
Y = β 0 + j = 1 k β j X j + ε
is the classic linear regression model, where β 0 and β j for j = 1 ,   2 , ,   k are the parameters; Y is the output (dependent) variable; the variables X j , j = 1 ,   2 , ,   k represent k-independent input variables; and ε is a random error. The least squares method was used to calculate the parameters.
The statistical significance of the regression model or the parameters of the regression model was verified using statistical significance tests. We rejected the null hypothesis if the p-value was less than the significance level α. Otherwise, we did not reject the null hypothesis. We determined the degree of dependence between variables using the multiple coefficients of determination r 2 , r 2 0 ; 1 .
Decision trees are among the basic methods of data mining. Currently, there are several algorithms for creating decision trees. The C5.0 algorithm was used when creating a decision tree. To measure the consistency of the classification of an output variable using a classification model, we used the overall accuracy, which we determined using a confusion matrix.

4. Results

Experimental tests were carried out on the P2500 rubber–textile CB. One group of measurements was made using a support system, and the other group of measurements was made without a support system. The aim of the experimental research was as follows:
  • To determine the magnitude of the deflection of the CB at the point of impact of the material using video analysis,
  • To determine the degree of damage to the CB in relation to the magnitude of the deflection of the CB;
  • To create a model of the dependence of the deflection magnitude on selected parameters (weight and impact height).

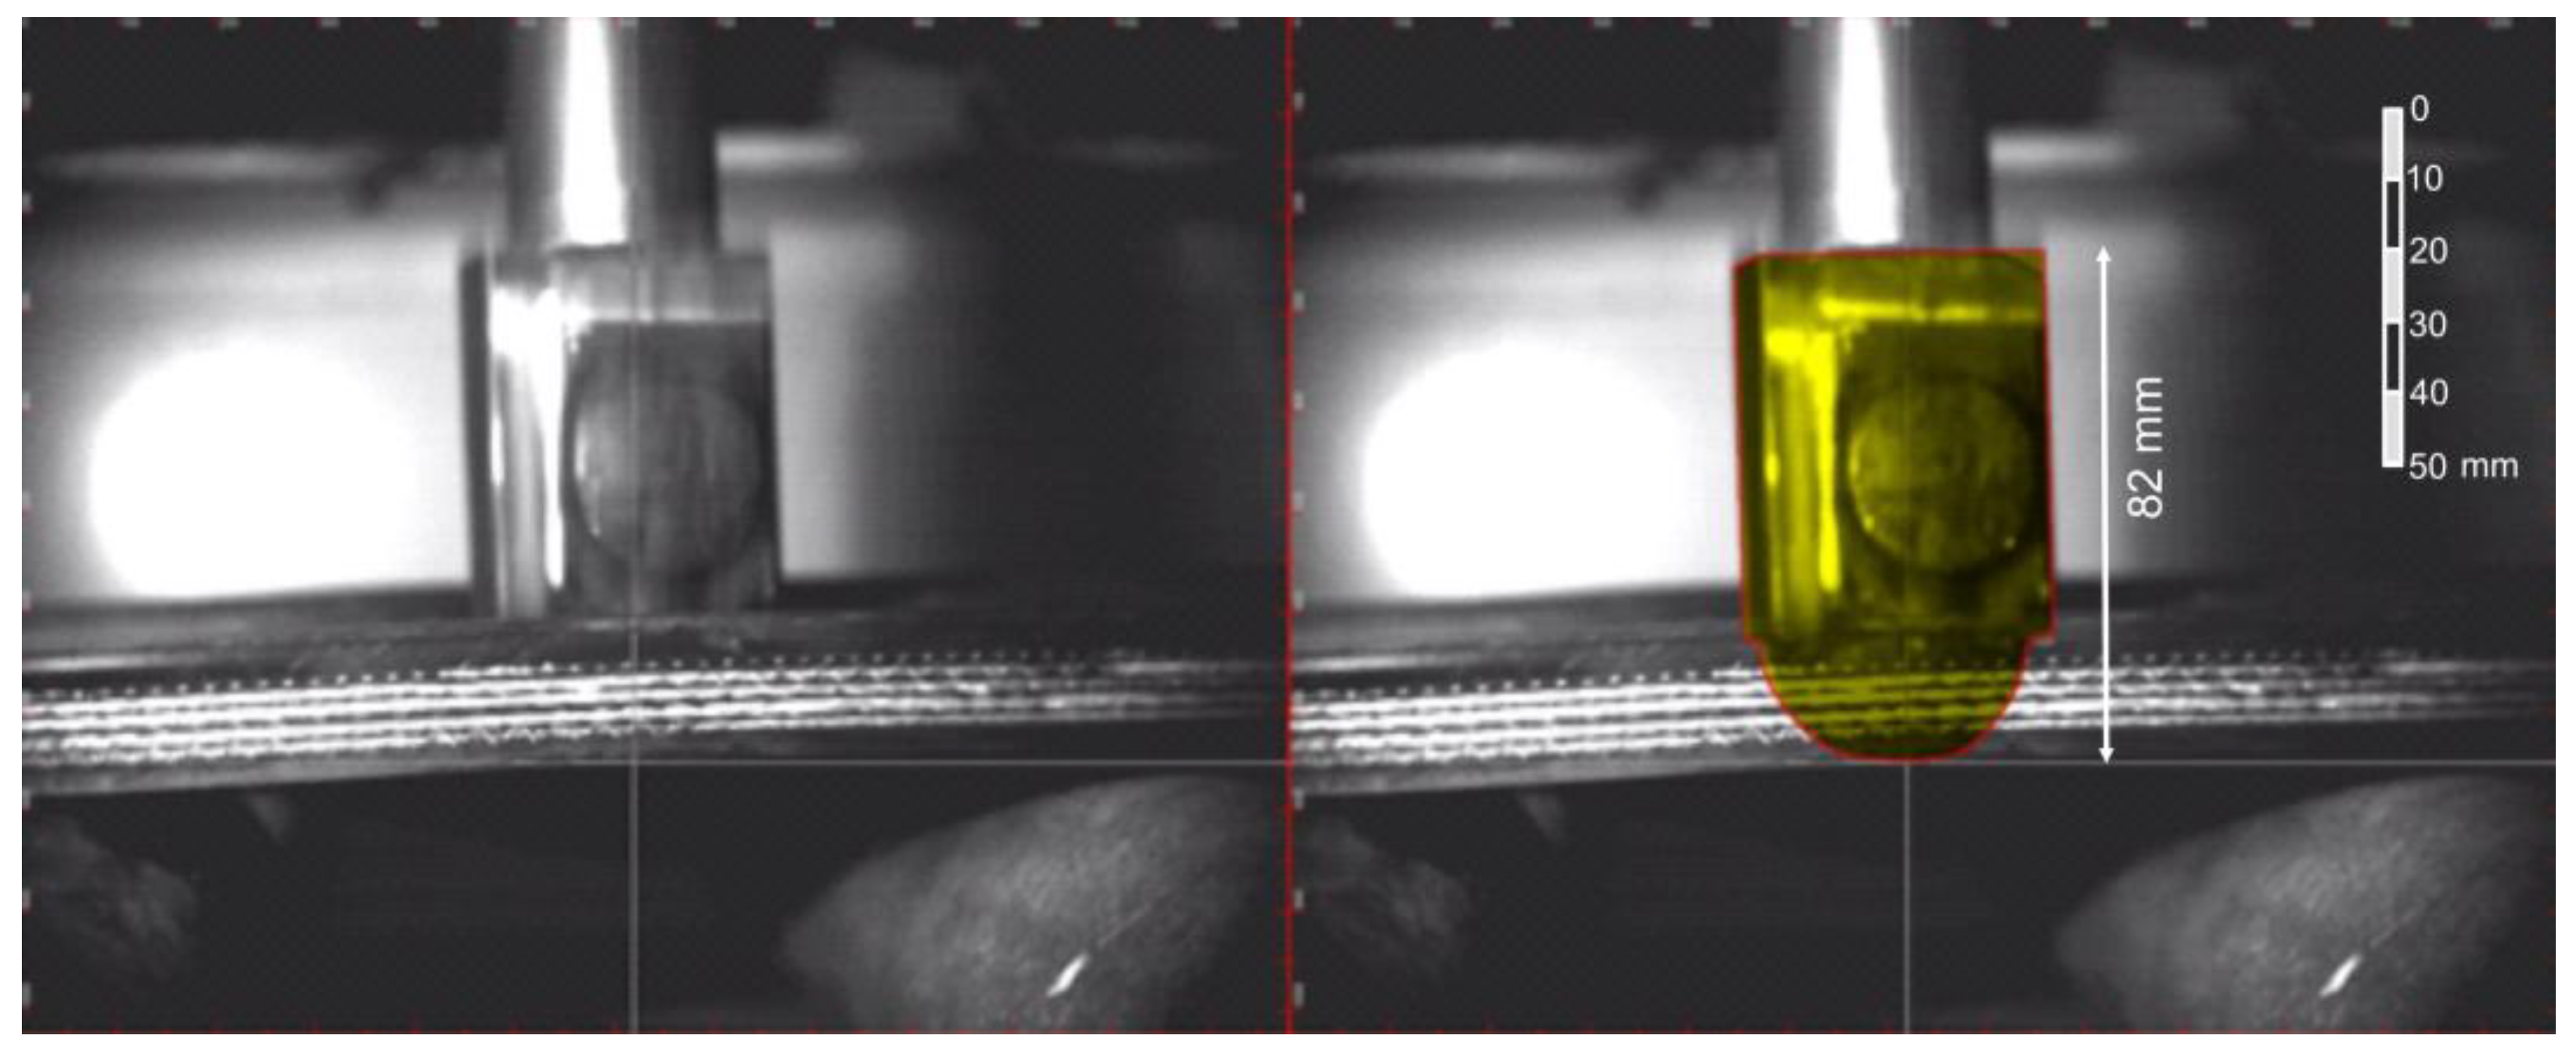
4.1. Determination of the Magnitude of Deflection of the CB at the Point of Impact of the Material

When the material falls on the CB, the conveyor belt bends. By playing, scrolling frame by frame, or scrolling along the time/frame axis, images of the impact of the load head on the belt were evaluated, and the deflection d of the CB was determined (Figure 4). The zero-deflection value was identified with the CB in a state of rest before the impact of the material (white line, Figure 4). The magnitude of the CB deflection is defined as the maximum deviation from the zero value at point x.
It was not possible to accurately read the required deflection value from the image (Figure 5, left). Therefore, using a graphic editor, the load head was added to the image (Figure 5, right), which was obtained from the image when the head was visible and not blurred by movement. For better visibility, the load head was colour-coded using a red line.
Values were obtained from the video analysis that needed to be converted from pixels to millimetres. The ruler in the vertical direction ranged from 0 to 1024 pixels (from top to bottom). When converted, one pixel was 0.348 millimetres. The values of the conveyor belt deflections at different input parameters (weight and impact height) for both options investigated (without the support system and with the support system) are shown in Figure 6 and Figure 7.
During the analysis and evaluation, the following variables were monitored: impact height, weight of the falling impactor, presence/absence of the support system, and the magnitude of deflection of the CB. A total of 145 test samples of the CBs were used in the experiment, of which 78 samples were for the case without the support system and 67 samples were for the case with the support system.
The curve breaks in Figure 7 show serious damage to the CB test samples.

4.2. Determination of the Degree of Damage to the CB Depending on the Magnitude of the Deflection

The evaluation of the test also included a visual inspection of the CB and the determination of the degree of CB damage. The observed variable damage characterizes the severity of the damage to the sample at the point of impact of the impactor.
Damage was classified into two basic categories (Table 1): no damage (Figure 8a, Damage 0), non-significant (partial) damage (e.g., damage to the upper or lower covering layer without skeletal damage, Damage 1, Figure 8b), and serious damage (damage to the upper covering layer, skeleton, and lower covering layer of the conveyor belt sample, Damage 2, Figure 8c, or puncture Damage 3, Figure 8d).
The visual assessment shows that in the experiment without the support system, significant damage was not caused to the CB samples throughout the measurement range. At greater heights and higher weights, there was minor damage to the upper or lower covering layer. Out of a total of 78 samples, 48 samples were classified as Damage 0 (61.5%) and 30 samples as Damage 1 (38.55%). Non-significant damage (Damage 1) occurs when the magnitude of deflection of the CB is below a value of approximately −100 mm (Figure 9).
When the support system was used, at some impactor weights and impact heights, the test sample was severely damaged or even destroyed (punctured). Of the total 67 samples, 23 samples were classified as Damage 0 (34.3%), 16 samples as Damage 1 (23.9%), 17 samples as Damage 2 (25.4%), and 11 samples as Damage 3 (16.4%). Serious damage to the body of the test sample occurred as early as an impactor weight of 60 kg from an impact height of 2 metres. The situation in which severe damage occurred is shown in Figure 10 at the site of significant curve breaks. The results of the video analysis showed that serious damage (Damage 2, Damage 3) occurred if the measured value of the CB deflection was less than −70 mm (Figure 10).
A classification model of the damage to the CB with a support system was created using a decision tree. The training group consisted of 78 test samples of conveyor belts without a support system and 67 test samples of conveyor belts with a support system.
The classification criterion is the variable Damage, which has four classification categories: Damage 0 (D0), Damage 1 (D1), Damage 2 (D2), and Damage 3 (D3). Three other input variables (Deflection, Height, and Weight) were used to characterize the examined samples of conveyor belts (Table 2).
We considered the variables (Height, Weight, and Damage) as categorical variables and deflection as a continuous variable. The results of the decision trees for both cases are shown in Figure 11 and Figure 12. The first division occurred according to the deflection magnitude of the CB. The graphs were constructed using the R package.
Simple decision-making rules that resulted from the decision tree:
IF (DEFLECTION > −94) THEN (DAMAGE = D0)
IF (DEFLECTION ≤ −109) THEN (DAMAGE = D1)
IF (−109< DEFLECTION ≤ −94) AND (WEIGHT>90) THEN (DAMAGE = D1)
IF (−109< DEFLECTION ≤ −94) AND (WEIGHT<=90) AND (HEIGHT ≤ 1.4)
       THEN (DAMAGE = D0)
IF (−109< DEFLECTION ≤ −94) AND (HEIGHT > 1.4) AND (50 < WEIGHT < 90)
       THEN (DAMAGE = D1)
IF (−109 < DEFLECTION ≤ −94) AND (HEIGHT > 1.4) AND (WEIGHT ≤ 50)
       THEN (DAMAGE = D0)
Simple decision-making rules that resulted from the decision tree:
IF (DEFLECTION ≤ −51) AND (WEIGHT ≤ 50) THEN (DAMAGE = D1)
IF (−56-< DEFLECTION ≤ −51) AND (WEIGHT > 50) AND (HEIGHT ≤ 1.2)
       THEN (DAMAGE=D1)
IF (DEFLECTION ≤ −56) AND (WEIGHT > 50) AND (HEIGHT ≤ 1.2)
       THEN (DAMAGE=D2)
IF (−66< DEFLECTION ≤ −51) AND (WEIGHT > 50) AND (HEIGHT > 1.2)
       THEN (DAMAGE = D2)
IF (DEFLECTION ≤ −66) AND (WEIGHT > 50) AND (HEIGHT > 1.2)
       THEN (DAMAGE = D3)
IF (DEFLECTION > −51) AND (HEIGHT > 1.8) THEN (DAMAGE = D2)
IF (DEFLECTION > −51) AND (HEIGHT ≤ 1.8) AND (WEIGHT ≤ 50)
       THEN (DAMAGE = D0)
IF (−51< DEFLECTION ≤ −48) AND (HEIGHT ≤ 1.8) AND (WEIGHT > 50)
       THEN (DAMAGE = D0)
IF (DEFLECTION < −48) AND (HEIGHT ≤ 1.8) AND (WEIGHT > 50)
       THEN (DAMAGE = D1)
To describe the correspondence between the classification obtained from visual assessment and the classification determined by the decision tree, we used the confusion matrix (Table 3).
The classification model incorrectly classified three conveyor belt samples for the case without a support system out of a total of 78 samples. The overall accuracy, i.e., the probability that the conveyor belt samples were correctly classified, was 88.5%. With a support system, 62 samples out of a total of 67 samples were classified correctly. The overall accuracy was 92.5%.

4.3. Creation of a Model of the Dependence of the Magnitude of Deflection on Selected Parameters

The aim of this extended research is to find a regression model that expresses the dependence of the magnitude of conveyor belt deflection on two independent input parameters: impactor weight and impact height. For both cases (the presence/absence of the support system), we started with the following model:
D e f l e c t i o n = f W e i g h t ,   H e i g h t + ε ,
where ε is a random error. The output variable Deflection is a continuous variable that is determined by analyzing the video recording.
The parameters of the model were obtained using the least squares method, which was sensitive to outlier values. For that reason, the input data were assessed for outliers and influential values, and values that were recorded under conditions of severe belt damage were excluded from the database.
The best regression model without a support system (Model I) has a point estimate of the following form:
D e f l e c t i o n = b 0 + b 1 W e i g h t + b 2 H e i g h t ,
Or, if a support system is present (Model II), then it is
D e f l e c t i o n = b 0 + b 1 W e i g h t H e i g h t ,
where b 0 , b 1 , and b 2 are point estimates of the model parameters. Point estimates of the parameters, their statistical significance, and the significance of the models are shown in Table 4 and Table 5.
The test results show that the Model I regression model is statistically significant (p-value = 3 × 10⁻⁴ < α), and both variables are considered statistically significant (p-value < α). The coefficient of determination is equal to 0.911, which means that 91.1% of the variability of the Deflection variable can be explained using the proposed regression model.
The test results show that the Model II regression model is also statistically significant (p-value = 1.2 × 10⁻²⁵ < α), and both variables are considered statistically significant (p-value < α variable), which represents the interaction between weight and impact height. The coefficient of determination is equal to 0.831, which means that 83.1% of the variability of the Deflection variable can be explained by the proposed regression model.
The empirical and theoretical (model) deflection values for the selected input parameters are shown in Figure 13.

5. Conclusions

During the operation of a belt conveyor, the conveyor belt is subject to many stresses, which leads to wear and damage to the conveyor belts, thereby reducing their service life. Operational experience shows that the most critical location, where 66 to 80% of all conveyor belt damage occurs, is the place of impact of the material on the CB. When the material falls onto the CB, deflection occurs at the point of impact. The aim of this article was to monitor the deflection magnitude of the CB using video analysis. Based on the results obtained, the dependence of CB damage on the magnitude of the deflection and selected input parameters (weight of impacting material, impact height, and presence/absence of the support system) was investigated.
The following findings emerged from the experimental research:
  • The impact height has a significant influence on the occurrence of serious damage in the event of an impactor falling on the CB + support system.
  • The impact weight and impact height have a significant influence on the occurrence of serious damage in the event of the impactor falling on the CB + support system.
  • The presence/absence of a support system has a significant influence on the amount of deflection of the CB and on the type of damage.
  • The absence of a support system does not cause serious damage to the set parameters of the experiment. If the deflection value of the CB is less than approximately −100 mm, Damage 1 occurs at most. Otherwise, the conveyor belt is free of visible damage (Damage 0).
  • The presence of a support system causes serious damage that significantly affects the smooth operation of the belt. The results of the video analysis show that serious damage (Damage 2 and Damage 3) occurs when the measured value of the CB deflection is less than −70 mm.
The classification of conveyor belts according to the degree of severity of CB damage from material impact is important for manufacturers, suppliers, and users. The created tree structure makes it possible to identify and predict the risk of serious damage to the CB when the material impacts it in various situations.

Author Contributions

Conceptualization, M.A., D.M. and A.G.; methodology, M.A. and A.G.; software, M.A.; validation, M.A. and A.G.; formal analysis, A.G. and D.M.; investigation, M.A. and A.G.; resources, A.G.; data curation, M.A.; writing—original draft preparation, M.A., A.G. and D.M.; writing—review and editing, A.G. and D.M.; visualization, M.A.; supervision, D.M.; project administration, D.M.; funding acquisition, D.M. All authors have read and agreed to the published version of the manuscript.

Funding

This research received no external funding.

Institutional Review Board Statement

Not applicable.

Informed Consent Statement

Not applicable.

Data Availability Statement

Not applicable.

Acknowledgments

This article was prepared with the support from the project titled APVV-18-0248 “Smart belt conveyors”, the project titled KEGA 013TUKE-4/2023 “Creation and innovation of university and lifelong education in study field ‘transport’ according to the development of digital and practical skills”, and the project titled VEGA 1/0168/21 “Research and application of contact and contactless methods of measuring properties of additive manufacturing products”.

Conflicts of Interest

The authors declare no conflict of interest.

References

  1. Alharbi, F.; Luo, S.H.; Zhang, H.Y.; Shaukat, K.; Yang, G.; Wheeler, C.A.; Chen, Z.Y. A Brief Review of Acoustic and Vibration Signal-Based Fault Detection for Belt Conveyor Idlers Using Machine Learning Models. Sensors 2023, 23, 1902. [Google Scholar] [CrossRef]
  2. Li, X.G.; Zhang, Y.Z.; Li, Y.; Zhan, Y.J.; Yang, L. Health State Prediction and Performance Evaluation of Belt Conveyor Based on Dynamic Bayesian Network in Underground Mining. Shock Vib. 2021, 2021, 6699611. [Google Scholar] [CrossRef]
  3. Homisin, J.; Grega, R.; Kassay, P.; Fedorko, G.; Molnar, V. Removal of systematic failure of belt conveyor drive by reducing vibrations. Eng. Fail. Anal. 2019, 99, 199–202. [Google Scholar] [CrossRef]
  4. Marasova, D.; Cehlar, M.; Ambrisko, L. Innovations in Monitoring Conveyor Belts with Implemented RFID Technology. In Proceedings of the 4th International Innovative Mining Symposium, T F Gorbachev Kuzbass State Tech Univ, Kemerovo, Russia, 14–16 October 2019. [Google Scholar] [CrossRef] [Green Version]
  5. Fedorko, G. Application possibilities of virtual reality in failure analysis of conveyor belts. Eng. Fail. Anal. 2021, 128, 105615. [Google Scholar] [CrossRef]
  6. Li, J.; Miao, C.Y. The conveyor belt longitudinal tear on-line detection based on improved SSR algorithm. Optik 2016, 127, 8002–8010. [Google Scholar] [CrossRef]
  7. Hu, X.; Zong, M. Fault Prediction Method of Belt Conveyor Based on Grey Least Square Support Vector Machine. In Proceedings of the 13th International Conference on Measuring Technology and Mechatronics Automation (ICMTMA), Beihai, China, 16–17 January 2021. [Google Scholar] [CrossRef]
  8. Kellis, J.K. Conveyor belt condition monitoring. In Proceedings of the 2000 SME Annual Meeting, Salt Lake City, UT, USA, 28 February–1 March 2000. [Google Scholar]
  9. Guo, X.Q.; Liu, X.H.; Zhou, H.; Stanislawski, R.; Krolczyk, G.; Li, Z.X. Belt Tear Dete.ction for Coal Mining Conveyors. Micromachines 2022, 13, 449. [Google Scholar] [CrossRef]
  10. Hrabovsky, L.; Molnar, V.; Fedorko, G.; Tkac, J.; Frydrysek, K. Experimental determination of force acting on a sandwich conveyor’s pressure roller in transport of bulk materials for the needs of failure analysis. Measurement 2022, 202, 111832. [Google Scholar] [CrossRef]
  11. Wang, M.; Shen, K.J.; Tai, C.W.; Zhang, Q.F.; Yang, Z.W.; Guo, C.B. Research on fault diagnosis system for belt conveyor based on internet of things and the LightGBM model. PLoS ONE 2023, 18, e0277352. [Google Scholar] [CrossRef]
  12. Guo, X.Q.; Liu, X.H.; Krolczyk, G.; Sulowicz, M.; Glowacz, A.; Gardoni, P.; Li, Z. Damage Detection for Conveyor Belt Surface Based on Conditional Cycle Generative Adversarial Network. Sensors 2022, 22, 3485. [Google Scholar] [CrossRef]
  13. Zhang, M.C.; Zhang, Y.; Zhou, M.S.; Jiang, K.; Shi, S.; Yu, Y.; Hao, N.N. Application of Lightweight Convolutional Neural Network for Damage Detection of Conveyor Belt. Appl. Sci. 2021, 11, 7282. [Google Scholar] [CrossRef]
  14. Zhang, M.C.; Shi, H.; Zhang, Y.; Yu, Y.; Zhou, M.S. Deep learning-based damage detection of mining conveyor belt. Measurement 2021, 175, 109130. [Google Scholar] [CrossRef]
  15. Qu, D.R.; Qiao, T.Z.; Pang, Y.S.; Yang, Y.; Zhang, H.T. Research On ADCN Method for Damage Detection of Mining Conveyor Belt. IEEE Sens. J. 2021, 21, 8662–8669. [Google Scholar] [CrossRef]
  16. Guo, X.Q.; Liu, X.H.; Gardoni, P.; Glowacz, A.; Klolczyk, G.; Incecik, A.; Li, Z.X. Machine vision based damage detection for conveyor belt safety using Fusion knowledge distillation. Alex. Eng. J. 2023, 71, 161–172. [Google Scholar] [CrossRef]
  17. Bortnowski, P.; Kawalec, W.; Krol, R.; Ozdoba, M. Types and causes of damage to the conveyor belt—Review, classification and mutual relations. Eng. Fail. Anal. 2022, 140, 106520. [Google Scholar] [CrossRef]
  18. Kirjanow-Blazej, A.; Jurdziak, L.; Burduk, R.; Blazej, R. Forecast of the remaining lifetime of steel cord conveyor belts based on regression methods in damage analysis identified by subsequent DiagBelt scans. Eng. Fail. Anal. 2019, 100, 119–126. [Google Scholar] [CrossRef]
  19. Kirjanow-Blazej, A.; Rzeszowska, A. Conveyor Belt Damage Detection with the Use of a Two-Layer Neural Network. Appl. Sci. 2021, 11, 5480. [Google Scholar] [CrossRef]
  20. Bajda, M.; Hardygora, M. Laboratory tests of operational durability and energy—Efficiency of conveyor belts. In Proceedings of the Annual Conference on Mining of Sustainable Development, Gliwice, Poland, 28 November 2018. [Google Scholar] [CrossRef]
  21. Ambrisko, L.; Marasova, D. Experimental Research of Rubber Composites Subjected to Impact Loading. Appl. Sci. 2020, 10, 8384. [Google Scholar] [CrossRef]
  22. Andrejiova, M.; Grincova, A.; Marasova, D. Failure analysis of rubber composites under dynamic impact loading by logistic regression. Eng. Fail. Anal. 2018, 84, 311–319. [Google Scholar] [CrossRef]
  23. Grincova, A.; Andrejiova, M.; Marasova, D. Measuring and comparative analysis of the interaction between the dynamic impact loading of the conveyor belt and the supporting system. Measurement 2015, 59, 184–191. [Google Scholar] [CrossRef]
  24. Stachowiak, M.; Koperska, W.; Stefaniak, P.; Skoczylas, A.; Anufriiev, S. Procedures of Detecting Damage to a Conveyor Belt with Use of an Inspection Legged Robot for Deep Mine Infrastructure. Minerals 2021, 11, 1040. [Google Scholar] [CrossRef]
  25. Zhang, L.; Hao, S.K.; Wang, H.S.; Wang, B.; Lin, J.G.; Sui, Y.P.; Gu, C. Safety Warning of Mine Conveyor Belt Based on Binocular Vision. Sustainability 2022, 14, 3276. [Google Scholar] [CrossRef]
  26. Che, J.; Qiao, T.Z.; Yang, Y.; Zhang, H.T.; Pang, Y.S. Longitudinal tear detection method of conveyor belt based on audio-visual fusion. Measurement 2021, 176, 109152. [Google Scholar] [CrossRef]
  27. Fedorko, G.; Molnar, V.; Marasova, D.; Grincova, A.; Dovica, M.; Zivcak, J.; Toth, T.; Husakova, N. Failure analysis of belt conveyor damage caused by the falling material. Part I: Experimental measurements and regression models. Eng. Fail. Anal. 2014, 36, 30–38. [Google Scholar] [CrossRef]
Figure 1. Schematic diagram of the test facility.
Applsci 13 07935 g001
Figure 2. TroubleShooter high-speed camera and video camera location.
Applsci 13 07935 g002
Figure 3. MiDAS Player environment.
Applsci 13 07935 g003
Figure 4. Impact of the load on the CB—the occurrence of deflection.
Applsci 13 07935 g004
Figure 5. Impact of the load on the CB.
Applsci 13 07935 g005
Figure 6. Graph of the dependence of the deflection magnitude on the impact height for different impactor weights (without a support system).
Applsci 13 07935 g006
Figure 7. Graph of the dependence of the deflection magnitude on the impact height for different impactor weights (with a support system).
Applsci 13 07935 g007
Figure 8. Types of CB damage.
Applsci 13 07935 g008
Figure 9. Occurrence of damage depending on the CB deflection (without a support system).
Applsci 13 07935 g009
Figure 10. Occurrence of damage depending on the CB deflection (with a support system).
Applsci 13 07935 g010
Figure 11. Decision tree (without a support system).
Applsci 13 07935 g011
Figure 12. Decision tree (with a support system).
Applsci 13 07935 g012
Figure 13. Empirical and theoretical values of conveyor belt deflection.
Applsci 13 07935 g013
Table 1. Classification of the sample according to the degree of damage.
Non-Serious DamageSerious Damage
Damage 0Damage 1Damage 2Damage 3
No damage is visibleVisible damage to the upper or lower covering layer (cracks and punctures) without visible damage to the skeletonVisible damage to the upper or lower covering layer and also damage to the skeletonPuncture (simultaneous complete damage to the upper covering layer, skeleton, and bottom covering layer)
Table 2. Summary of variables.
VariablesDescription
Dependent Variables
DamageDamage type:
Damage 0 (D0), Damage 1 (D1),
Damage 2 (D2), Damage 3 (D3)
Independent Variables
HeightImpact height (m)
WeightWeight of impactor (kg)
DeflectionDeflection amount (mm)
Table 3. Confusion matrix.
Observed
Damage
Classification Determined by the Decision Tree
WSS (n = 78) 1SS (n = 67) 2
D0D1D0D1D2D3
D046223000
D112911500
D2xx01151
D3xx0029
1 WSS-without support system, 2 SS-support system.
Table 4. Parameter estimates—Model I (α = 0.05).
ParameterEstimateStandard Errort-Statp-Value95%-Confidence Interval
LowerUpper
Intercept−14.6243.939−3.7120.0004−22.471−6.776
Weight−27.4041.079−25.389<0.0001−29.554−25.254
Height−0.5240.047−11.074<0.0001−0.618−0.429
Table 5. Parameter estimates—Model II (α = 0.05).
ParameterEstimateStandard Errort-Statp-Value95%-Confidence Interval
LowerUpper
Intercept−31.9811.329−24.069<0.00001−34.637−29.325
Weight*Height−0.2460.014−17.490<0.00001−0.274−0.218
Disclaimer/Publisher’s Note: The statements, opinions and data contained in all publications are solely those of the individual author(s) and contributor(s) and not of MDPI and/or the editor(s). MDPI and/or the editor(s) disclaim responsibility for any injury to people or property resulting from any ideas, methods, instructions or products referred to in the content.

