Article

Electrochemical Analysis of MnO2 (α, β, and γ)-Based Electrode for High-Performance Supercapacitor Application

1
Department of Physics, COBS&H, CCS Haryana Agricultural University, Hisar 125004, India
2
Department of Electrical and Computer Engineering, Ajou University, Suwon 16499, Republic of Korea
3
Department of Materials Science and Engineering, Ajou University, Suwon 16499, Republic of Korea
*
Authors to whom correspondence should be addressed.
Appl. Sci. 2023, 13(13), 7907; https://doi.org/10.3390/app13137907
Submission received: 9 May 2023 / Revised: 19 June 2023 / Accepted: 30 June 2023 / Published: 5 July 2023
(This article belongs to the Special Issue Advances in Surface Science and Thin Films)

Abstract

:
MnO2 is the most favorable material in power storage due to its technological significance and potential applications in pseudocapacitance (due to various oxidative states allowing efficient charge transfer to meet energy demands), where its properties are considerably influenced by its structure and surface morphology. In the present study, a facile hydrothermal route was used to produce different phases of MnO2 (α, β, and γ) with different morphologies. The electrochemical performance of the synthesized phases was studied in aqueous sodium sulfate as an electrolyte. X-ray diffraction, UV–Vis spectroscopy, and Fourier-transform infrared spectroscopy were used to characterize the synthesized material. The surface morphology and topography were examined using field-emission scanning electron microscopy. The direct band gap of α-, β-, and γ-MnO2 was found to be 1.86 eV, 1.08 eV, and 1.68 eV, lying in the semiconducting range, further enhancing the electrochemical performance. It was found that α-MnO2 had a maximum specific capacitance of 138 F/g at 1 A/g, and the symmetric device fabricated using α-MnO2 had a specific capacitance of 86 F/g at 1 A/g.

1. Introduction

As intermittent energy demands rapidly increase globally, energy storage devices have become vital to sustaining this demand. Short-lived storage (power-concentrated) and long-lived storage (energy-concentrated) are necessary to maintain sustainability in energy storage devices [1]. Additionally, electric automobiles need energy storage devices to provide efficient power (accelerating the vehicle) and energy (deriving the distance). Fuel cells/batteries provide high energy densities, and capacitors offer high power densities. In this regard, supercapacitors and electrochemical capacitors satisfy power (high power densities related to batteries) and energy (high energy densities related to capacitors) requirements [2]. In supercapacitors, two mechanisms (electric double-layer capacitance (EDLC) and pseudocapacitance) occur at the electrode–electrolyte interface and provide sufficient specific capacitance [3]. In EDLC, the energy storage process involves the collection of charge on the exterior of the electrode; the pseudo energy storage process is a rapid redox reaction that leads to a higher energy density than that of EDLC. Carbonaceous materials like porous charcoal, biochar, graphene, graphene oxide, reduced graphene oxide, and carbon-based nanotubes all come under the category of EDLC [4,5]. They are suitable for various applications due to their high specific surface area [6]. Metal oxides (with transition states), numerous sulfates [7,8], and phosphates with excellent electric, magnetic, and electrochemical properties exhibit pseudocapacitor behavior. Of all the metal oxides, the most explored redox-reaction-based pseudocapacitors are ruthenium oxide (RuO2) and manganese oxide (MnO2), which are famous for their high theoretical specific capacitance, cyclability, and power density. MnO2 is low-cost due to its abundant nature (the 12th most prevalent element in the Earth’s crust) [9].
MnO2 is the most prospective material because of its technological significance and potential applications in pseudocapacitance (due to various oxidative states allowing efficient charge transfer to meet energy demands). Its structure and morphology significantly influence its properties, allowing researchers to investigate their impacts on electrochemical performance [10]. MnO2 exhibits various crystalline phases (alpha (α), beta (β), gamma (γ), and delta (δ)) by networking the octahedron unit (MnO6) in different conditions [11]. A double chain with 2 × 2 tunnels containing a framework of shared edges and corners is present in α-MnO6, whereas a single chain of MnO6 with 1 × 1 tunnels is present in β-MnO2, and a single chain of MnO6 with 1 × 1 and 2 × 1 tunnels is present in γ-MnO2, as depicted in Figure 1 [12]. The arrangement of atoms within these distinct crystallographic phases creates different types of pores, which affects the electrolytic ion moment or electron transfer process in the charge storage mechanism. Thus, the electrochemical performance of MnO2 changes with a change in the crystallographic phase. The tunnel size, surface area, and morphology of MnO2 depend on the synthesis process and conditions. Different synthesis methods, including solvothermal synthesis, precipitation, thermal decomposition, sol–gel, and electrode deposition, have been used to synthesize nanostructured MnO2. Among all these methods, the hydrothermal technique is low-cost and easy to handle. By simply changing the temperature and pressure of the autoclave, this technique can provide pure and various morphological forms of nanostructured MnO2.
In the present study, a simple hydrothermal route was used to synthesize different phases of MnO2 (α, β, and γ) with different morphologies. The electrochemical performance of the synthesized phases was studied in aqueous sodium sulfate (Na2SO4) as an electrolyte. A comparison was carried out as part of the electrochemical studies (cyclic voltammetry (CV), galvanostatic charging–discharging (GCD), and electrochemical impedance spectroscopy (EIS)). A change in the specific capacitance was expected due to the various crystal structures and morphologies. A device was fabricated for the sample having high specific capacitance, and its electrochemical performance was also investigated.

2. Experimental

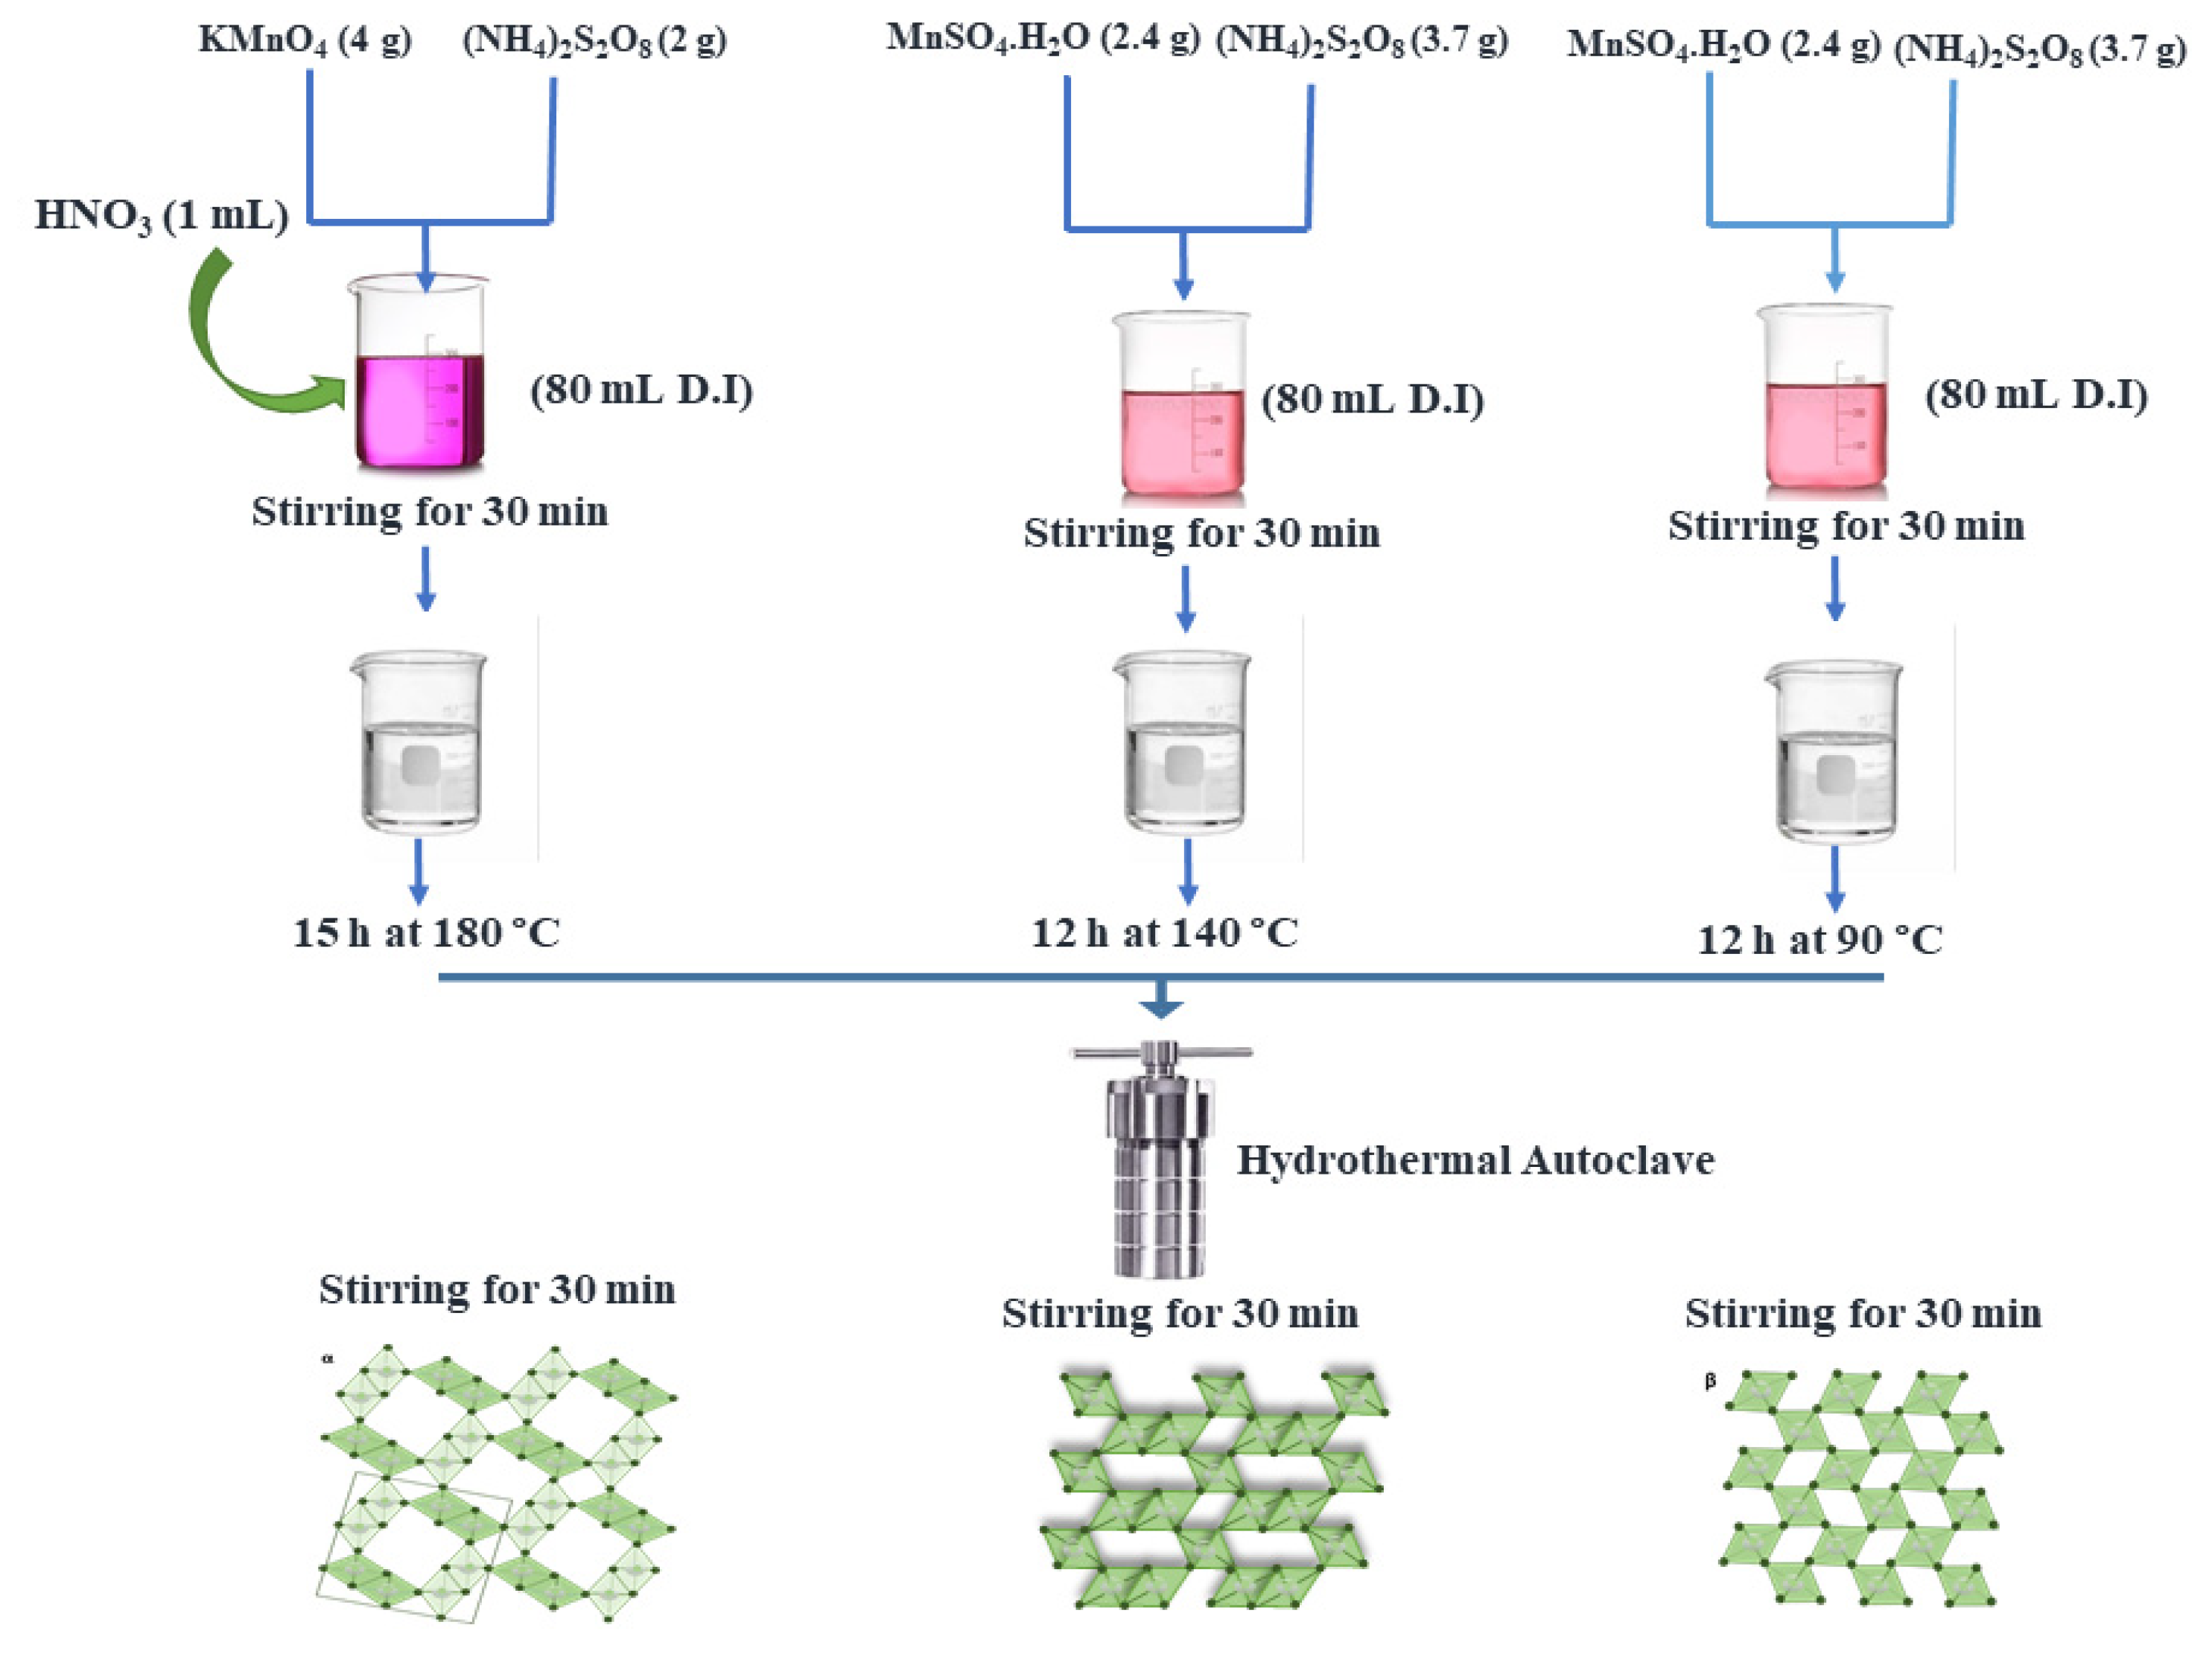
2.1. Material Preparation

All chemicals utilized (KMnO4, HNO3, MnSO4.H2O, and (NH4)2S2O8) were of high purity and used without refinement. The synthesis process diagram is shown in Figure 2.
Synthesis of α-MnO2: To synthesize alpha MnO2 nanowires, KMnO4 (4 g) was poured into double-distilled water (80 mL) to form a homogenous mixture after stirring. The obtained solution was then mixed with (NH4)2S2O8 (2 g) and HNO3 (1 mL) for 30 min. After that, the prepared mixture was transferred into a hydrothermal autoclave (100 mL) and placed for 15 h at 180 °C. The final material was obtained after multiple washes with double-distilled water and oven drying at 80 °C.
Synthesis of β-MnO2: To synthesize beta MnO2 nanorods, MnSO4.H2O (2.4 g) and (NH4)2S2O8 (3.7 g) were placed in distilled water (80 mL) to form a homogenous mixture. Then, the prepared mixture was transferred into a hydrothermal autoclave (100 mL) and placed for 12 h at 140 °C. The final product was obtained after multiple washes with distilled water and oven drying at 80 °C.
Synthesis of γ-MnO2: To synthesize the gamma MnO2 flower- or urchin-like structure, MnSO4.H2O (2.4 g) and (NH4)2S2O8 (3.7 g) were placed in distilled water (80 mL) to produce a homogenous mixture. Then, the prepared solution was moved into a hydrothermal autoclave (100 mL) and placed for 12 h at 90 °C. The final material was obtained after numerous washes with distilled water and oven drying at 80 °C.

2.2. Electrode Preparation and Electrochemical Measurements for Supercapacitor

The working electrodes used for the electrochemical measurements were prepared by blending MnO2 with a binder (polyvinylidene fluoride) and activated charcoal using a small amount of volatile organic solvent (N-methyl pyrrolidinone) in a specific proportion (8:1:1). The mixture was agitated constantly for 12 h in a stirrer, leading to a perfectly uniform slurry, which was then deposited into the current collector (1 × 1 cm2) substrate (graphite sheet). The treated electrodes were allowed to anneal for 24 h at 80 °C (vacuum oven). Additionally, Ag/AgCl and spiral Pt wires were used as reference and counter electrodes, respectively. The CV, GDC, and EIS techniques were used in the experimental electrochemical measurements. CV was carried out on the prepared electrodes using an aqueous electrolyte (1 M Na2SO4) at various scan rates (10–100 mVs−1) with a potential window of 0.8 V. EIS was used to investigate the response of the electrode in the frequency range of 100 kHz to 10 mHz. GCD was used to investigate the charging and discharging properties of the prepared electrode at varied current densities ranging from 1 to 10 A/g.
Preparation of symmetric supercapacitor device: The active electrode was created using the same procedure with the deposition of α-MnO2 directly on the graphite sheet. After deposition, the sample was oven-dried for 24 h. The active electrodes with a coated area (1 × 1 cm2) were used in two electrode cells with a gap of 0.25 mm controlled by a spacer. The loading mass (1.5 mg/cm2) was calculated by taking the difference between the materials coated with the graphite sheet substrate and the uncoated materials. The symmetric supercapacitors were assembled by using two active electrodes with a separator (Whatman filter paper, Grade 42) and an aqueous electrolyte (1 M Na2SO4).

3. Results and Discussion
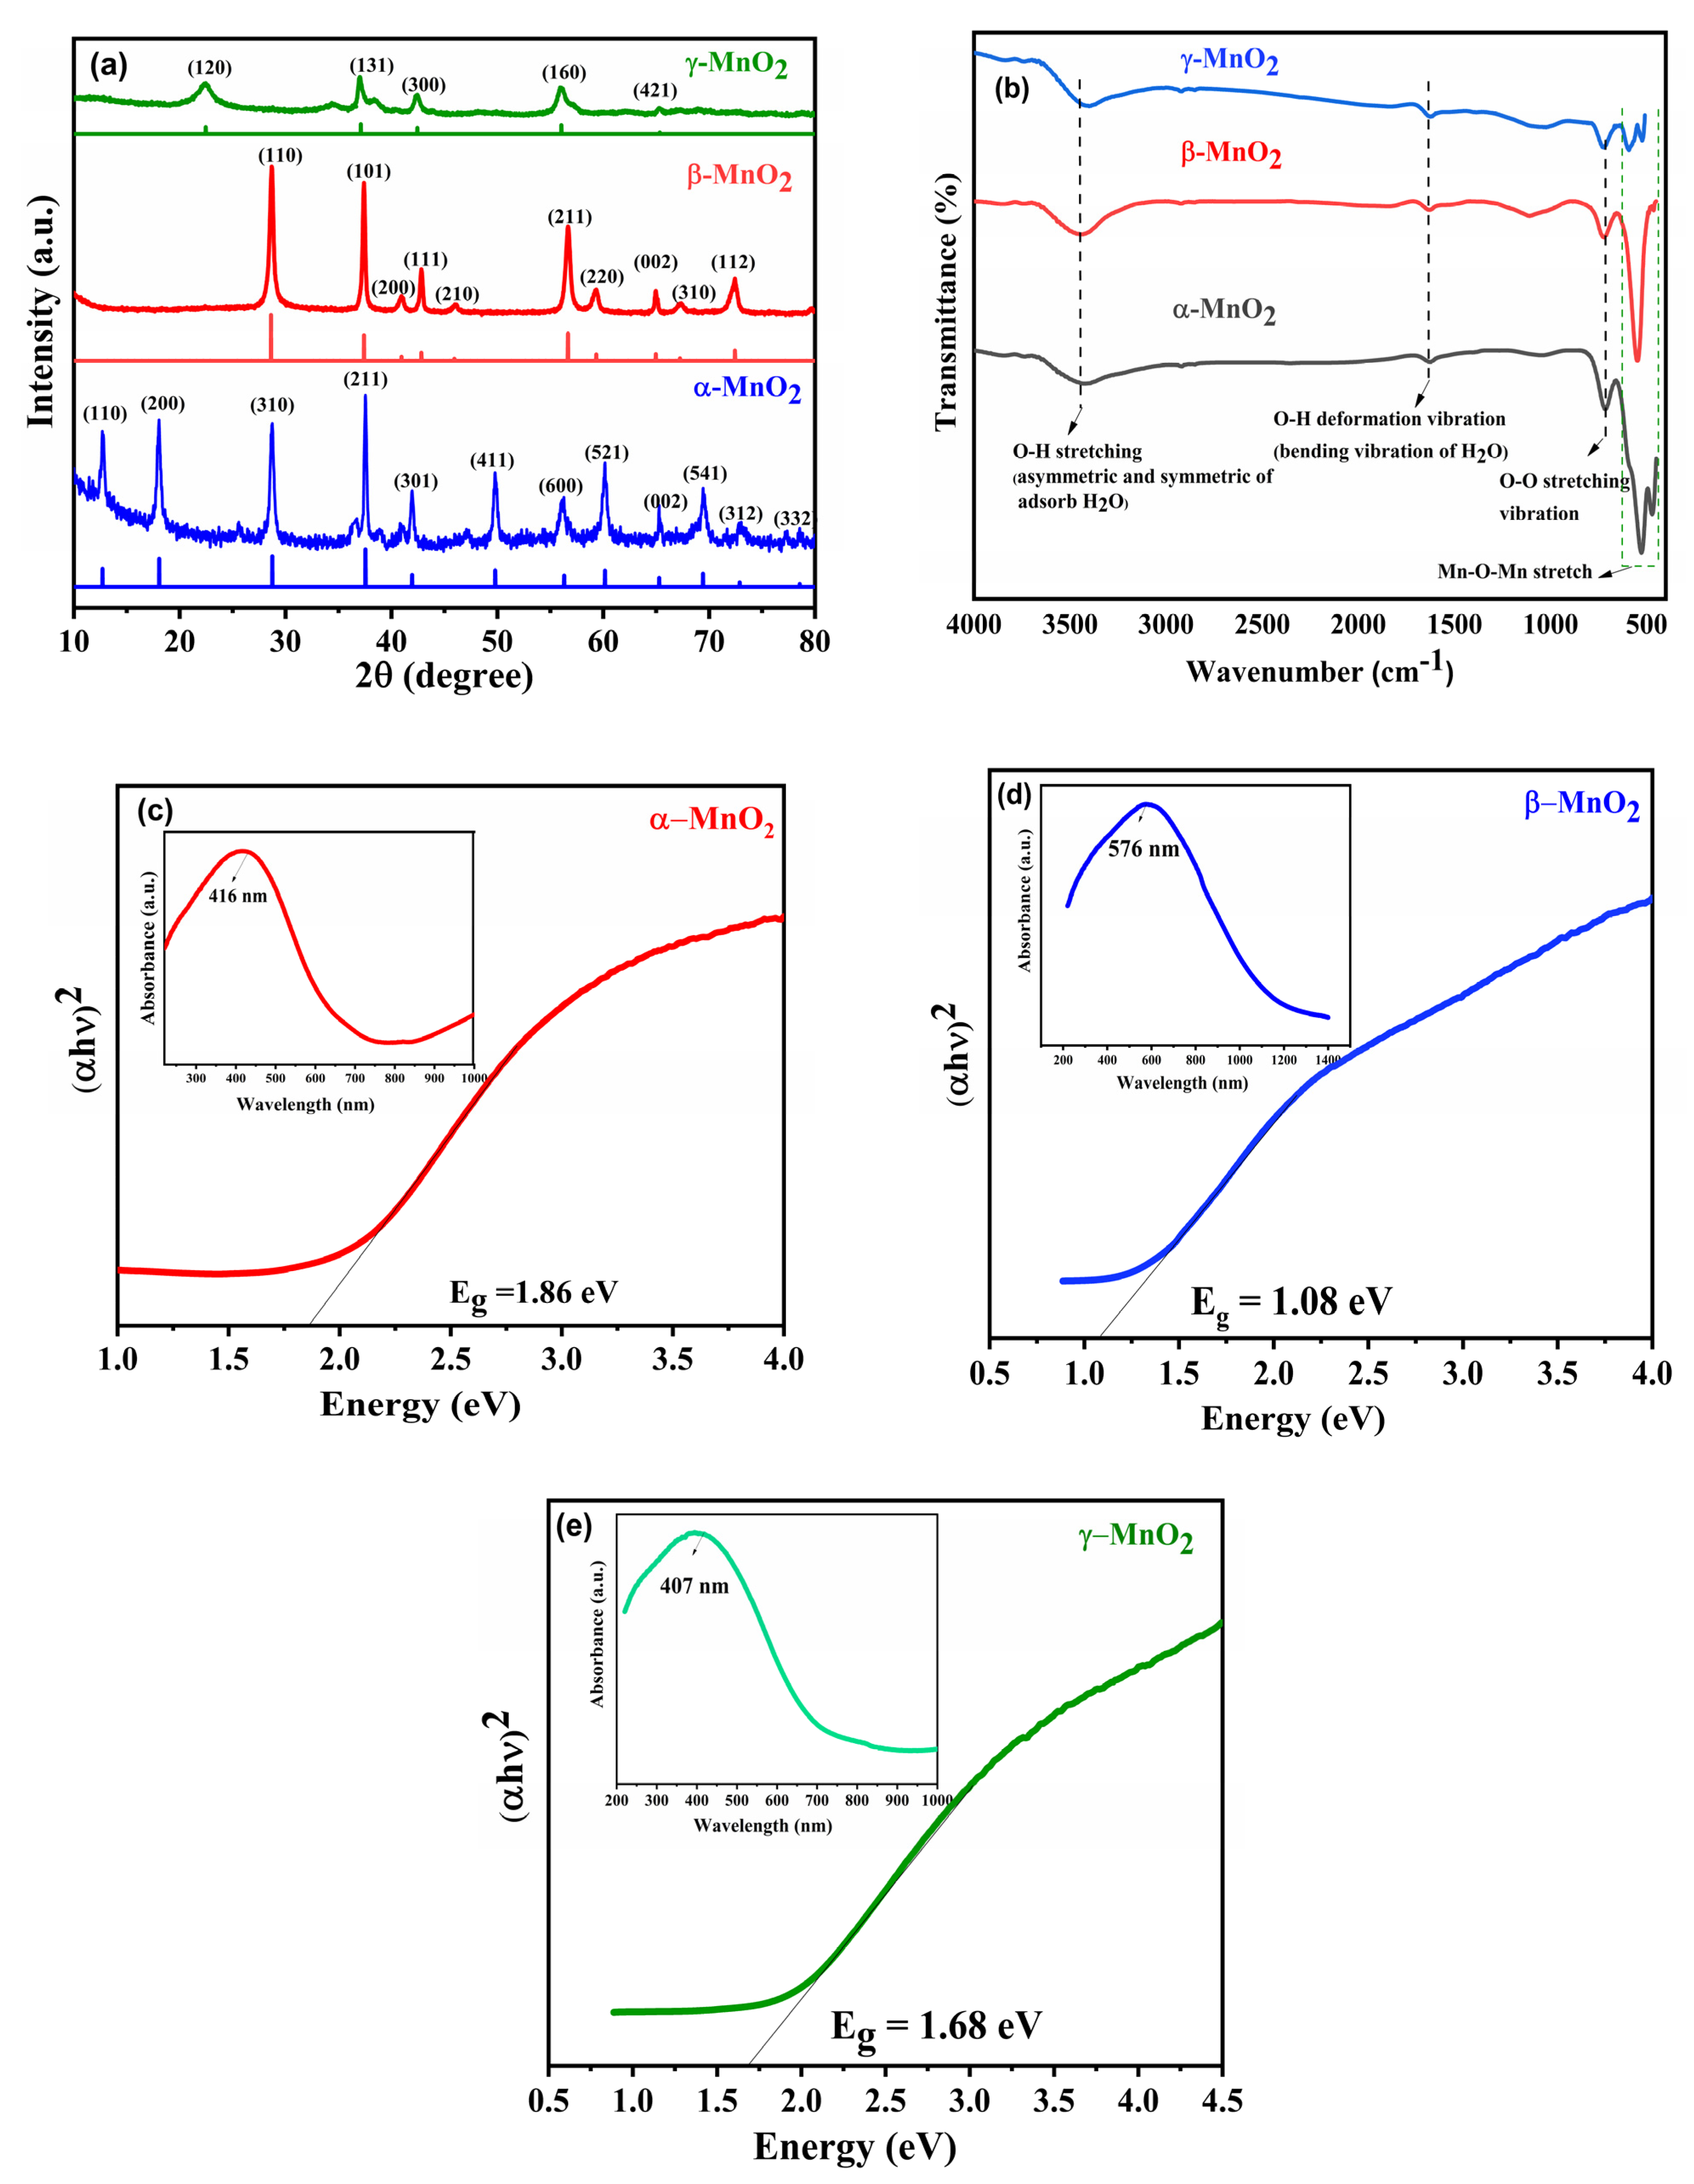
3.1. XRD Analysis

X-ray diffraction was performed at ambient temperature to examine the crystal structure and size of the prepared MnO2 phases. Based on the synthesis conditions and amount of precursor used, the XRD spectrum of all the tunneled structures synthesized via the facile hydrothermal route is shown in Figure 3a. The sharp peaks (crystalline nature) at 2θ equaled 12.7, 18.1, 28.8, 37.4, 41.9, 49.8, 56.3, 60.2, 65.1, 69.7, 72.7, and 78.5 (JCPDS 440141) for the α-MnO2 (tetragonal structure with a = 9.375 A° and c = 2.908 A°) phase [13]. The interplanar spacing d calculated for plane (110) was 0.69 nm. The peaks obtained at 2θ equaled 28.6, 37.3, 40.9, 42.8, 46.1, 56.7, 59.3, 64.9, 67.3, and 72.4 for β-MnO2 (rutile structure) [14]. The five distinct diffraction peaks at 2θ equaling 22.2, 37.6, 42.5, 56.2, and 65.3 corresponded to γ-MnO2 (ramsdellite structure) [15]. The peaks corresponding to γ-MnO2 were not very sharp and exhibited a semi-crystalline behavior. The crystallite size of α-, β-, and γ-MnO2 was 19.7, 22.2, and 8 nm, respectively, calculated using the Debye–Scherrer formula. Thus, the XRD pattern demonstrates the successful synthesis of polymorphous MnO2 phases.

3.2. FTIR Analysis

The FTIR spectrum of all the prepared MnO2 phases is compiled in Figure 3b. Two intense peaks at 3440 (bending vibration of water) and 1620 cm−1 (stretching vibration of O-H) were observed for all the polymorphous phases [16]. Confirmation of the materials provided by the FTIR spectrum’s fingerprint region was found between 400 and 1600 cm−1. α-MnO2 was confirmed by the peaks observed at 718, 524, and 476 cm−1. The strong peak at 524 was attributed to the Mn-O bond vibration, which was further shifted to 548 and 589 cm−1 for β-MnO2 and γ-MnO2, respectively, due to the Mn-O-Mn stretching vibration. Octahedral unit (MnO6) O-O stretching vibration corresponded to the peaks obtained around 718 cm−1 for all the phases [17].

3.3. UV–Vis Analysis

The optical properties were studied by performing UV–Vis absorption spectroscopy (220 to 1400 nm), and a broad spectrum lying between 400 and 550 nm was obtained for α-MnO2 with a peak at 416 nm, as shown in Figure 3c. For β-MnO2, this broad spectrum lay between 300 and 600 nm, and a peak at 576 nm, as shown in Figure 3d, with maximum absorbance was detected. A strong absorbance peak at 407 nm, as shown in Figure 3e, was obtained for γ-MnO2, with a broad spectrum lying between 300 and 600 nm. Further, the band gap was calculated using Tauc’s equation, and the direct band gap of α-, β-, and γ- was found to be 1.86 eV, 1.08 eV, and 1.68 eV, respectively. All the synthesized nanostructures fall under the categories of semiconducting materials. The band gap of α-MnO2 was higher than that of β-MnO2 due to its smaller crystalline size [18], and γ-MnO2 had the lowest band gap compared to α-MnO2, despite having the smallest crystalline size; this might be due to its semi-crystalline nature [19].

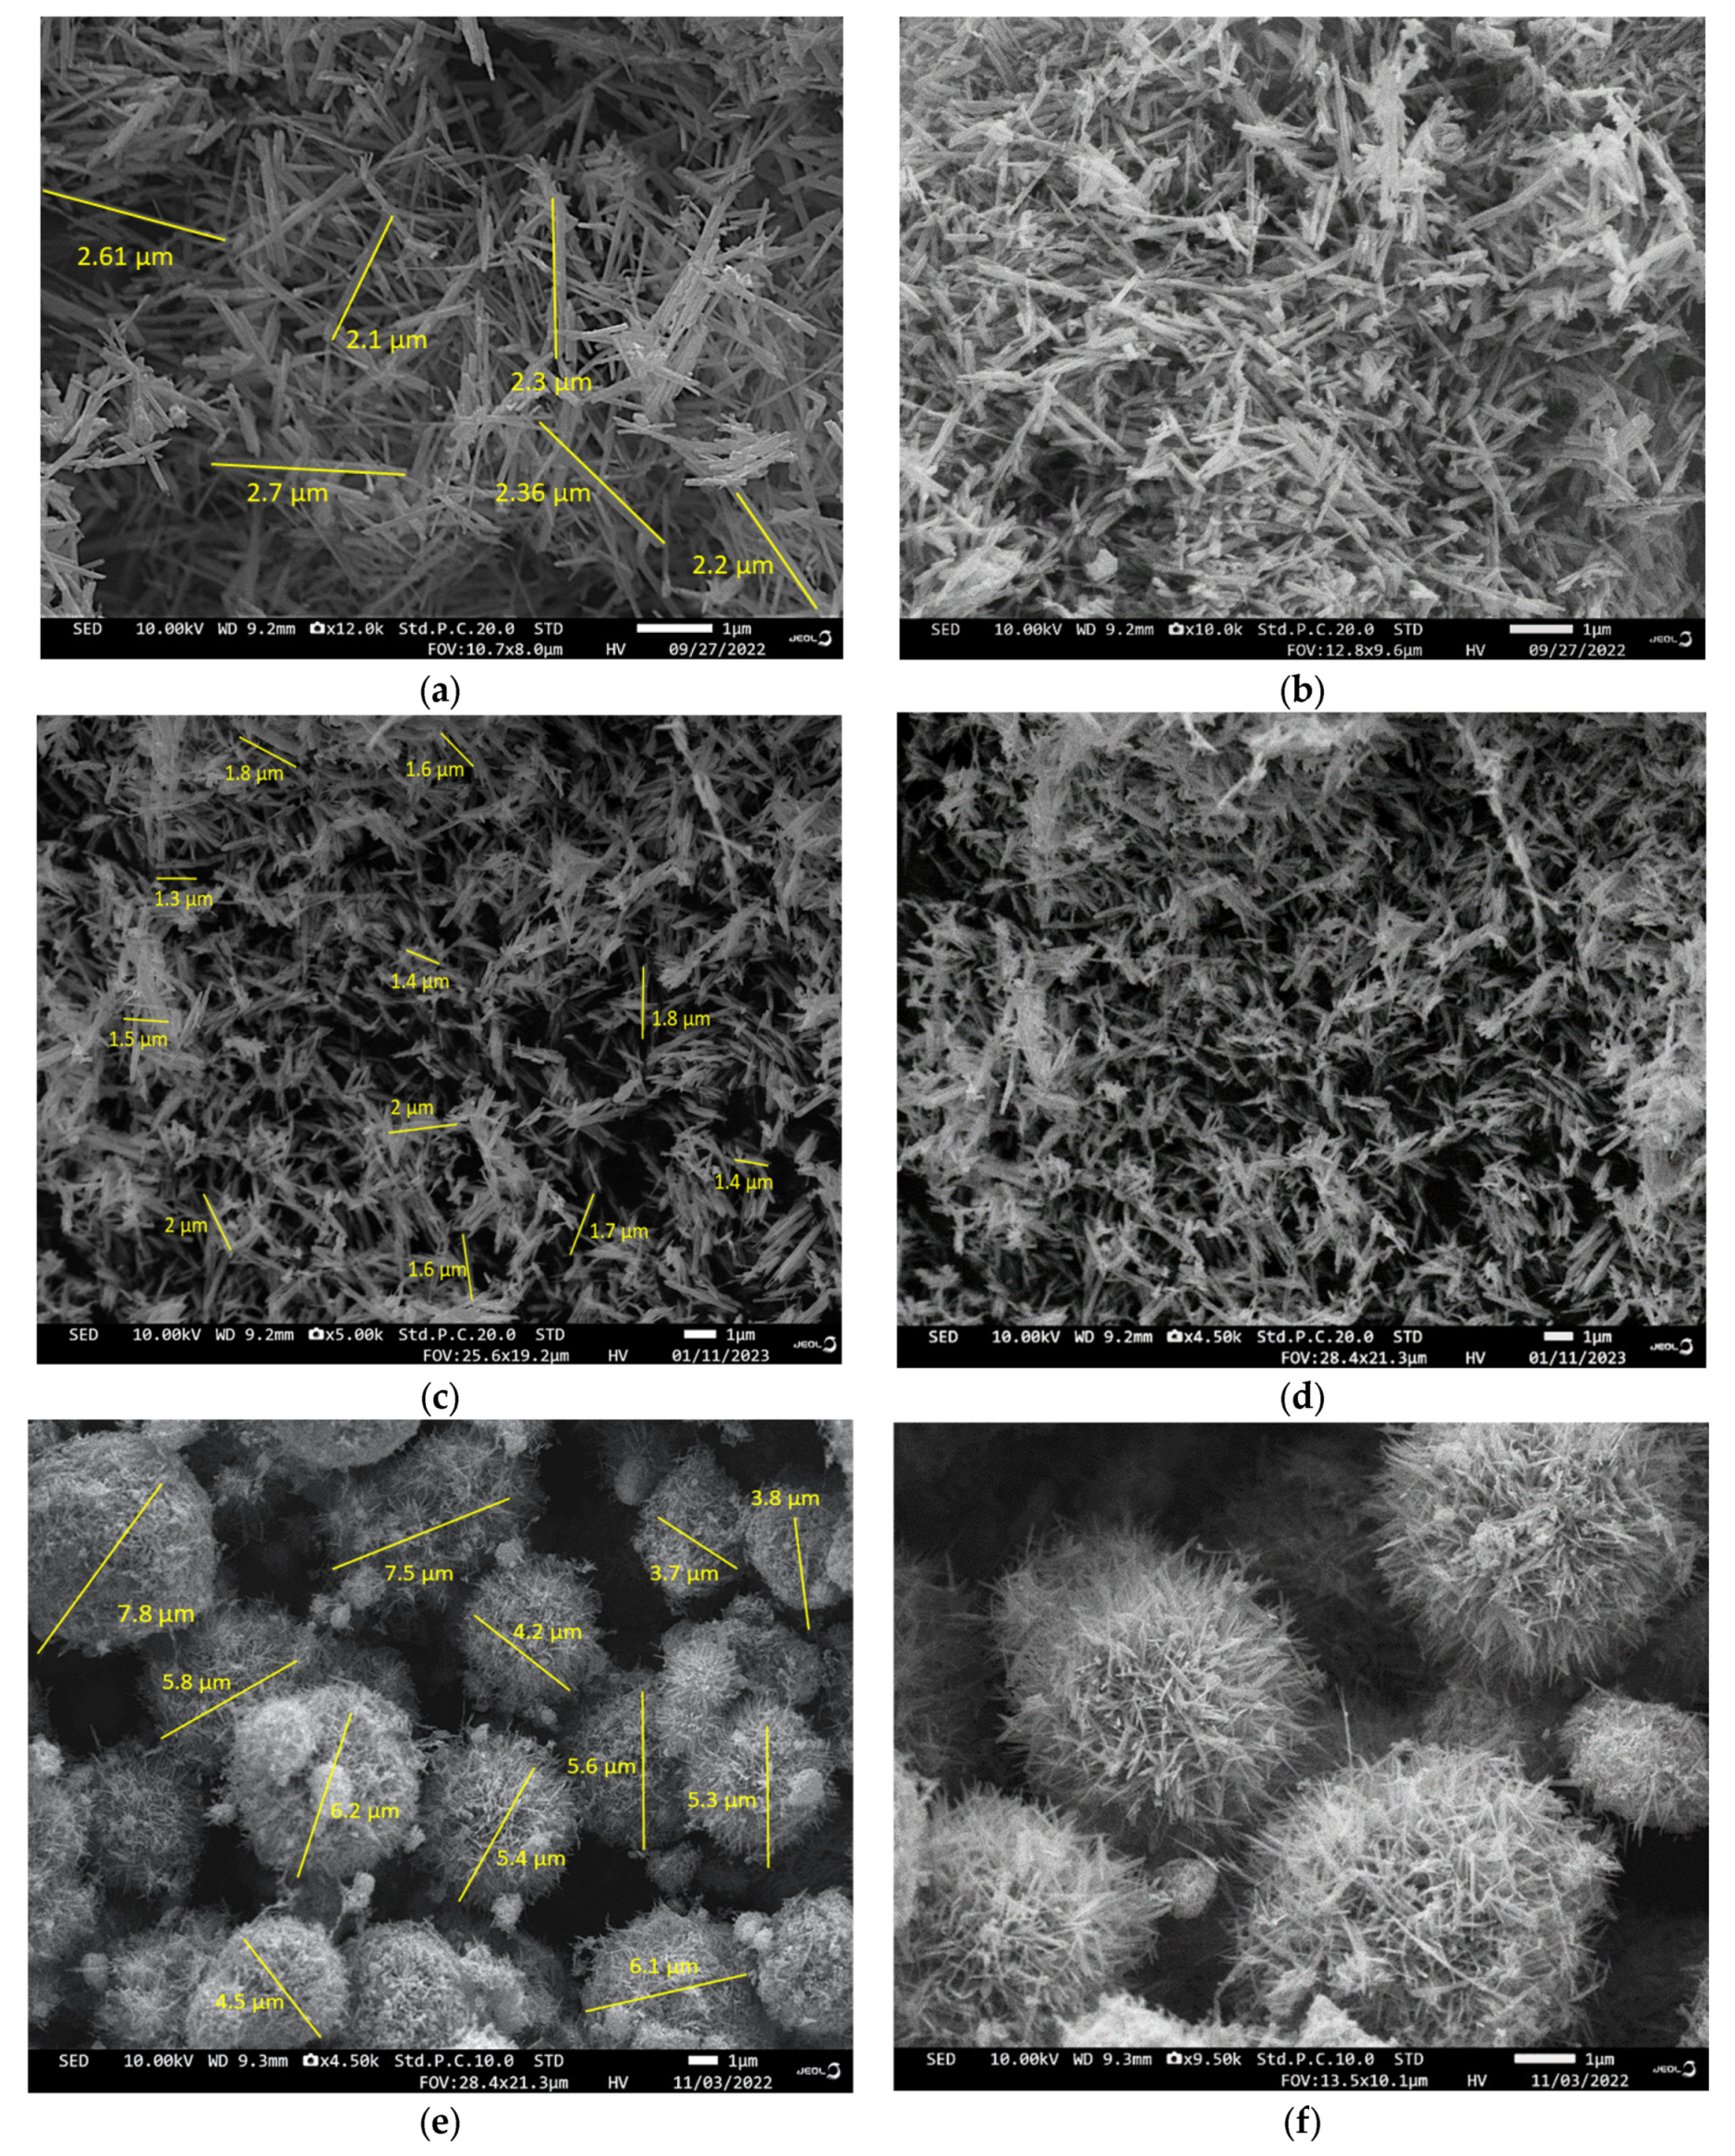
3.4. FE-SEM Analysis

FE-SEM images of various MnO2 nanostructures are shown in Figure 4. It is clearly shown in these images that all the synthesized MnO2 phases were in the nano range. Figure 4a,b show the SEM images of α-MnO2, Figure 4c,d show images of β-MnO2, and Figure 4e,f show images of γ-MnO2. The FE-SEM images of α-MnO2 revealed the formation of nanowires having lengths in the micrometer range (average 2.368 µm) with a 20–30 nm diameter. For β-MnO2, nanorod-like structures with a length of 1.6 µm were revealed.
In γ-MnO2, these nanorods folded into urchins with average diameters of 5 µm, as shown in Figure 4e, and this may be due to the mild temperature conditions. The size of the phase morphology was calculated using ImageJ software Version 1.44. Temperature and synthesis parameters affect various morphologies of MnO2 [20]. As the temperature increased, these urchins unfolded into nanorods or nanowire-like structures, as shown for α- and β-MnO2. At high temperatures, the nanoparticles’ energy increased, encouraging the nucleation route; hence, these nuclei clustered into longer nanofibers. These longer fibers have more active sites for intercalation/de-intercalation of charges on their surface. Therefore, from the surface morphology, we can comment that α-MnO2 had a higher electrochemical performance compared to β- and γ-MnO2.

3.5. Electrochemical Analysis

The electrochemical study of the prepared electrode was carried out in a three-electrode system. Electrochemical tests were used to determine the capacitance of MnO2 (α, β, and γ). To examine the behavior of the charge storage mechanism, CV was performed with a diverse scan rate (10 to 100 mV/s) and a voltage window of 0.8 V in 1 M Na2SO4. Figure 5a–c show the CV plots corresponding to α-, β-, and γ-MnO2. At the lower scan rate, all the CV curves show a rectangular shape due to the formation of a double layer [21]. With the increase in the scan rate, the shape of the CV curves becomes distorted, probably due to the redox reaction occurring on the surface of the electrode. The distorted shape of the CV curves represents the pseudocapacitive behavior of the charge storage [22]. The linearity of the CV curves for all the MnO2 phases is maintained even at the high scan rate, demonstrating the good charge intercalation of ions of the electrolyte or smooth charge transfer. The area under the CV curves represents the specific capacitance of the electrode [23]. It is clearly shown in Figure 5a that α-MnO2 exhibited the highest specific capacitance.
Figure 5d–f show the GCD plots of α-, β-, and γ-MnO2 performed at a fixed voltage of 0.8 V V/s Ag/AgCl at various current densities (1 to 10 A/g). The shape of the GCD curves represents the mixed charge storage mechanism (pseudo and electrostatic) for the electrodes. The below equation was used to determine the specific capacitance of the material:
C s = I d × t   Δ V
where Cs is the specific capacitance, Id is the current density, t is the discharging time, and ∆V is the voltage window [24]. It can be seen from the GCD plots that the discharging time increased uniformly for each of the MnO2 phases. Among all the GCD plots, α-MnO2 had a large discharging time and the highest specific capacitance.
The specific capacitance calculated at 1 Ag−1 was 138, 112, and 103 F g−1 for α-, β-, and γ-MnO2, respectively. The α-MnO2 electrode maintained a specific capacitance of approximately 112, 90, 48, and 40 Fg−1 at 1.5, 3, 6, and 10 Ag−1, respectively. The β-MnO2 electrode maintained a specific capacitance of approximately 88, 60, 39, and 30 Fg−1 at 1.5, 3, 6, and 10 Ag−1, respectively.
The γ-MnO2 electrode maintained a specific capacitance of approximately 78, 55, 36, and 27 Fg−1 at 1.5, 3, 6, and 10 Ag−1, respectively. The electrochemical performance of these distinct crystallographic phases was found to be different, which might be due to their atomic arrangements. α-MnO2 exhibited a higher electrochemical performance as compared to the other phases due to its 2 × 2 tunnel-containing network that supports the electrolytic ion moment or electron transfer process in the charge storage mechanism. Thus, the electrochemical performance of MnO2 changed with a change in the crystallographic phase.
Figure 6a–d show the electrochemical analysis comparison plots for the different phases of MnO2; as demonstrated in Figure 6a, α-MnO2 had the highest area of the CV curve of all three phases and, consequently, an excellent specific capacitance, which is due to its surface morphology [25]. Figure 6b shows the GCD curve, which indicates that α-MnO2 had the highest specific capacitance.
EIS experiments were carried out to investigate the inherent features, such as solution resistance (Rs) and charge transfer resistance (Rct).
The EIS analysis in Figure 6c shows the Nyquist plot, in which the absence of a semicircle could be due to the faradaic reactions and excellent chemical stability of all MnO2 phases. The solution resistance (RS) determined through electrochemical circuit fitting was 7.50, 7.56, and 7.59 Ω for α-, β-, and γ-MnO2, respectively. The nearly straight line in the low-frequency region of the Nyquist plot for α-, β-, and γ-MnO2 indicated that the reactions were limited by diffusion resistance (constant-phase element (CPE)) rather than charge transfer resistance (Rct) [26]. Also, the straight line inclined towards the imaginary z-axis indicated the perfect capacitive behavior of MnO2. The charge transfers resistance (Rct) was found to be 2.24, 2.45, and 2.56 Ω for α-, β-, and γ-MnO2, respectively.
Despite the fact that α-MnO2 has a large band gap, it has the lowest charge transfer resistance due to its well-organized tunnel-shape nanostructure.
The Bode plot shown in Figure 6d from the EIS analysis shows that the negative phase angle was found to be 64.5°, 62.4°, and 58.0° for α-, β-, and γ-MnO2, respectively. It was observed that α-MnO2 had the highest phase angle among all the phases, and hence it can be considered a good supercapacitor electrode material. It was observed that in the case of γ-MnO2, the phase angle had a low value as compared to α-MnO2 and β-MnO2, indicating that it had poor conductivity. It is clear that the slopes obtained in the high-frequency region were almost zero, which is a salient characteristic of a pure resistor. However, the slope increases in the low-frequency region correspond to the characteristics of a pseudocapacitor [26]. All these results demonstrate that the material behaves like a resistor in the high-frequency range, whereas it behaves like a pseudocapacitor in the low-frequency region. Further, the Bode plot of the phase angle is shown in Figure 6d. The phase line strongly deviated from that of an ideal capacitor (an ideal capacitor shows a phase angle of 90°). Such a non-ideal behavior further substantiates the pseudocapacitive nature of MnO2.
The EIS plots show that α-MnO2 had the lowest Rct as compared to the other phases, resulting in a high specific capacitance. Based on these results, the best working electrode material (α-MnO2) was chosen for the device fabrication.
The electrochemical analysis of the fabricated symmetric device was tested using a two-electrode set-up; one acts as a cathode and the other as an anode. Figure 7a depicts the CV analysis of the symmetric α-MnO2/α-MnO2 device in the potential window of 1.2 V with diverse scan rates (10 to 100 mV s−1). The plots demonstrate capacitive performance with a distorted quasi-rectangular shape, which is preserved even when the voltage window is changed, exhibiting the characteristics of EDLC with the pseudocapacitive combination. With an increased scan rate, the CV curve shape hardly varies, confirming the excellent cyclability and high-speed capabilities of the symmetric α-MnO2/α-MnO2 supercapacitor. Figure 7b shows the GCD plots at different specific current densities (1 to 10 Ag−1) for the symmetric α-MnO2/α-MnO2 supercapacitor device over a potential range of 1.2 V. Using the GCD technique, the specific capacitance of 86 Fg−1 was obtained at a current density of 1 Ag−1. The symmetric α-MnO2/α-MnO2 supercapacitor cell maintained a specific capacitance of approximately 54, 38, 30, and 24 Fg−1 at 1.5, 2, 3, and 4 Ag−1, respectively. The Nyquist plot of the symmetric α-MnO2/α-MnO2 supercapacitor cell is shown in Figure 7c. The noble electrical conductivity of the working electrode can be observed, which is due to the lower resistance of the electrode material. Figure 7d shows the CV scan using different potential windows (0.4 to 1.4) of a single cell, exhibiting sustainability up to 1.4 V without any distortion or an illuminating red LED. Figure 7e reveals the Ragone plot of the developed cell. The specific energy ( E s ) and specific power ( P s ) were calculated using the below equations:
  E s = C s   × Δ V 2 2 × 3.6  
P s =     E s   × 3600 Δ t  
The specific energy and power were found to be 17.2 Wh/kg and 596 W/kg using GCD. In terms of the specific energy and power, our constructed device (α-MnO2/α-MnO2) falls into the categories between supercapacitors and batteries. Figure 7f shows the capacitance retention of the device up to 2000 cycles, with a cycle stability of 94% at 4 A/g and an excellent coulombic efficiency of 117%.

4. Conclusions

In the present study, a facile hydrothermal route was used to produce different phases of MnO2 (α, β, and γ) with different morphologies. It was noticed that the surface morphology was affected by the temperature and synthesis parameters. The direct band gap of α-MnO2, β-MnO2, and γ-MnO2 was found to be 1.86 eV, 1.08 eV, and 1.68 eV, lying in the semiconducting range, further enhancing the electrochemical performance. A comparative study was carried out to investigate the electrochemical performance of all the phases of MnO2 (Supplementary Materials). The specific capacitance calculated at a current density of 1 A/g was 138 F/g, 112 F/g, and 103 F/g for α-, β-, and γ-MnO2, respectively. It was also noticed that the CV curve shape hardly changed with the increase in the scan rate, confirming the excellent reversibility of all the MnO2 phases. α-MnO2 had the highest specific capacitance, possibly due to its 2 × 2 tunnel-containing network, which facilitates the electrolytic ion moment or electron transfer process in the charge storage mechanism. The symmetric device fabricated using α-MnO2 had a specific capacitance of 86 F/g at 1 A/g. The device had a maximum specific energy and power of 17.2 Wh/kg and 596 W/kg, respectively. This device also maintained an outstanding cycle stability of 94% at 4 A/g with a coulombic efficiency of 117% up to 2000 cycles.

Supplementary Materials

The following supporting information can be downloaded at: https://www.mdpi.com/article/10.3390/app13137907/s1, Table S1: Comparison of electrochemical performance with previously reported studies. References [27,28,29,30,31,32] are cited in the supplementary materials.

Author Contributions

Conceptualization, V.K.; Methodology, R.D.; Validation, S.K. and M.B.; Formal analysis, S.K. and A.S.; Investigation, R.D. and A.S.; Resources, S.S.; Data curation, R.D., S.K., M.B. and A.S.; Writing — original draft, R.D.; Writing — review & editing, V.K. and S.S.; Visualization, M.B.; Supervision, V.K.; Funding acquisition, S.S. All authors have read and agreed to the published version of the manuscript.

Funding

This research received no external funding.

Institutional Review Board Statement

Not applicable.

Informed Consent Statement

Not applicable.

Data Availability Statement

The data is confidential and cannot be shared at this time.

Conflicts of Interest

The authors declare no conflict of interest.

References

  1. Musil, M.; Choi, B.; Tsutsumi, A. Morphology and Electrochemical Properties of α-, β-, γ-, and δ-MnO2 Synthesized by Redox Method. J. Electrochem. Soc. 2015, 162, A2058. [Google Scholar] [CrossRef]
  2. Su, X.; Liang, Z.; He, Q.; Guo, Y.; Luo, G.; Han, S.; Yu, L. Advanced three-dimensional hierarchical porous α-MnO2 nanowires network toward enhanced supercapacitive performance. Nanotechnology 2022. [Google Scholar] [CrossRef] [PubMed]
  3. Modi, K.H.; Pataniya, P.M.; Siraj, S.; Sahatiya, P.; Patel, V.; Sumesh, C.K. Synergistic effect from Ni2+ ions with SnS for all solid-state type symmetric supercapacitor. J. Energy Storage 2023, 63, 107040. [Google Scholar] [CrossRef]
  4. Rani, P.; Dahiya, R.; Bulla, M.; Devi, R.; Jeet, K.; Jatrana, A.; Kumar, V. Hydrothermal-assisted green synthesis of reduced graphene oxide nanosheets (rGO) using lemon (Citrus Limon) peel extract. Mater. Today Proc. 2023, in press. [Google Scholar] [CrossRef]
  5. Devi, R.; Kumar, V.; Kumar, S.; Jatrana, A.; Agrawal, A.; Singh, P. Development of biochar-based functional materials for electrochemical supercapacitor applications. ECS Trans. 2022, 107, 7979. [Google Scholar] [CrossRef]
  6. Devi, R.; Kumar, V.; Kumar, S.; Sisodiya, A.K.; Mishra, A.K.; Jatrana, A.; Singh, P. Development of Activated Carbon by Bio Waste Material for Application in Supercapacitor Electrodes. Mater. Lett. 2023, 335, 133830. [Google Scholar] [CrossRef]
  7. Pataniya, P.M.; Dabhi, S.; Patel, V.; Sumesh, C.K. Liquid phase exfoliated ReS2 nanocrystals on paper based electrodes for hydrogen evolution and supercapacitor applications. Surf. Interfaces 2022, 34, 102318. [Google Scholar] [CrossRef]
  8. Kumar, S.; Kumar, V.; Devi, R.; Sisodia, A.K.; Jatrana, A.; Singh, R.B.; Mishra, A.K. Sustainable and Scalable Approach for Enhancing the Electrochemical Performance of Molybdenum Disulfide (MoS2). Adv. Mater. Sci. Eng. 2022. [Google Scholar] [CrossRef]
  9. Chand, P.; Joshi, A.; Lal, S.; Singh, V. Effect of hydrothermal temperature on structural, optical and electrochemical properties of α-MnO2 nanostructures for supercapacitor application. Chem. Phys. Lett. 2021, 777, 138742. [Google Scholar]
  10. Zhu, S.; Li, L.; Liu, J.; Wang, H.; Wang, T.; Zhang, Y.; Dong, F. Structural directed growth of ultrathin parallel birnessite on β-MnO2 for high-performance asymmetric supercapacitors. ACS Nano 2018, 12, 1033–1042. [Google Scholar] [CrossRef]
  11. Sivakumar, S.; Prabu, L.N. Synthesis and Characterization of α-MnO2 nanoparticles for Supercapacitor application. Mater. Today Proc. 2021, 7, 52–55. [Google Scholar] [CrossRef]
  12. Alfaruqi, M.H.; Gim, J.; Kim, S.; Song, J.; Jo, J.; Kim, S.; Kim, J. Enhanced reversible divalent zinc storage in a structurally stable α-MnO2 nanorod electrode. J. Power Source 2015, 288, 320–327. [Google Scholar] [CrossRef]
  13. Toufiq, A.M.; Wang, F.; Javed, Q.U.A.; Li, Q.; Li, Y. Hydrothermal synthesis of MnO2 nanowires: Structural characterizations, optical and magnetic properties. Appl. Phys. A 2014, 116, 1127–1132. [Google Scholar] [CrossRef]
  14. Chen, W.M.; Qie, L.; Shao, Q.G.; Yuan, L.X.; Zhang, W.X.; Huang, Y.H. Controllable synthesis of hollow bipyramid β-MnO2 and its high electrochemical performance for lithium storage. ACS Appl. Mater. Interfaces 2012, 4, 3047–3053. [Google Scholar] [CrossRef] [PubMed]
  15. Zhang, B.; Cheng, G.; Lan, B.; Zheng, X.; Sun, M.; Ye, F.; Cheng, X. Crystallization design of MnO2 via acid towards better oxygen reduction activity. CrystEngComm 2016, 18, 6895–6902. [Google Scholar] [CrossRef]
  16. Taranu, B.O.; Novaconi, S.D.; Ivanovici, M.; Gonçalves, J.N.; Rus, F.S. α-MnO2 Nanowire Structure Obtained at Low Temperature with Aspects in Environmental Remediation and Sustainable Energy Applications. Appl. Sci. 2022, 12, 6821. [Google Scholar] [CrossRef]
  17. Gangwar, D.; Rath, C. Structural, optical and magnetic properties of α-and β-MnO2 nanorods. Appl. Surf. Sci. 2021, 557, 149693. [Google Scholar] [CrossRef]
  18. Singh, M.; Goyal, M.; Devlal, K. Size and shape effects on the band gap of semiconductor compound nanomaterials. J. Taibah Univ. Sci. 2018, 12, 470–475. [Google Scholar] [CrossRef] [Green Version]
  19. Sato, N. Electrochemistry at Metal and Semiconductor Electrodes; Elsevier: Amsterdam, The Netherlands, 1998. [Google Scholar]
  20. Khan, Y.; Durrani, S.K.; Mehmood, M.; Khan, M.R. Mild hydrothermal synthesis of γ-MnO2 nanostructures and their phase transformation to α-MnO2 nanowires. J. Mater. Res. 2011, 26, 2268–2275. [Google Scholar] [CrossRef]
  21. Rajagopal, R.; Ryu, K.S. Synthesis of MnO2 nanostructures with MnS-deposits for high performance supercapacitor electrodes. New J. Chem. 2019, 43, 12987–13000. [Google Scholar] [CrossRef]
  22. Li, Y.; Xu, Z.; Wang, D.; Zhao, J.; Zhang, H. Snowflake-like core-shell α-MnO2@ δ-MnO2 for high performance asymmetric supercapacitor. Electrochim. Acta 2017, 251, 344–354. [Google Scholar] [CrossRef]
  23. Song, J.; Li, H.; Li, S.; Zhu, H.; Ge, Y.; Wang, S.; Liu, Y. Electrochemical synthesis of MnO2 porous nanowires for flexible all-solid-state supercapacitor. New J. Chem. 2017, 41, 3750–3757. [Google Scholar] [CrossRef]
  24. Singu, B.S.; Hong, S.E.; Yoon, K.R. Ultra-thin and ultra-long α-MnO2 nanowires for pseudocapacitor material. J. Solid State Electrochem. 2017, 21, 3215–3220. [Google Scholar] [CrossRef]
  25. Kumar, A.; Sanger, A.; Kumar, A.; Kumar, Y.; Chandra, R. An efficient α-MnO2 nanorods forests electrode for electrochemical capacitors with neutral aqueous electrolytes. Electrochim. Acta 2016, 220, 712–720. [Google Scholar] [CrossRef]
  26. Zhang, S.; Lin, C.; Ye, J.; Zhao, D.; Chen, Y.; Zhang, J.M.; Huang, Z. Bi2S3/rGO nanocomposites with covalent heterojunctions as a high-performance aqueous zinc ion battery material. Ceram. Int. 2023, 49, 22160–22169. [Google Scholar] [CrossRef]
  27. Arkhipova, E.A.; Ivanov, A.S.; Isaikina, O.Y.; Novotortsev, R.Y.; Stolbov, D.N.; Xia, H.; Savilov, S.V. Application of MnO2/MWCNT composite in supercapacitors. Mater. Today Proc. 2022, 60, 1008–1011. [Google Scholar] [CrossRef]
  28. Aquino, C.L.E.; Gorospe, A.E.; Rezaga, B.F.Y.; Avila, R.A.M.; Macugay, J.K.; Tercero, J.U.; Balela, M.D.L. Effect of ammonium persulfate on the growth of MnO2 nanostructures prepared via hydrothermal synthesis for supercapacitor applications. Mater. Today Proc. 2020, 33, 1945–1948. [Google Scholar] [CrossRef]
  29. Wickramaarachchi, K.; Minakshi, M. Consequences of electrodeposition parameters on the microstructure and electrochemical behavior of electrolytic manganese dioxide (EMD) for supercapacitor. Ceram. Int. 2022, 48, 19913–19924. [Google Scholar] [CrossRef]
  30. Xie, Y. Electrochemical properties of sodium manganese oxide/nickel foam supercapacitor electrode material. Inorg. Nano-Met. Chem. 2022, 52, 548–555. [Google Scholar] [CrossRef]
  31. Dhas, S.D.; Maldar, P.S.; Patil, M.D.; Nagare, A.B.; Waikar, M.R.; Sonkawade, R.G.; Moholkar, A.V. Synthesis of NiO nanoparticles for supercapacitor application as an efficient electrode material. Vacuum 2020, 181, 109646. [Google Scholar] [CrossRef]
  32. Erdemir, F.; Tuzcu, E.; Bilgin, S.; Alver, Ü.; Çanakçı, A. Influence of fluorine doping of zinc oxide on its electrochemical performance in supercapacitors. Mater. Chem. Phys. 2021, 259, 124033. [Google Scholar] [CrossRef]
Figure 1. Crystalline structures of α-, β-, and γ-MnO2.
Applsci 13 07907 g001
Figure 2. The synthesis process of α-, β-, and γ-MnO2.
Applsci 13 07907 g002
Figure 3. (a) XRD spectrum, (b) FTIR spectrum, and (ce) Tauc plots of α-, β-, and γ-MnO2, respectively.
Applsci 13 07907 g003
Figure 4. FE-SEM images: (a,b) α-MnO2, (c,d) β-MnO2, and (e,f) γ-MnO2.
Applsci 13 07907 g004
Figure 5. (ac) CV plots and (df) GCD plots of α-, β-, and γ-MnO2, respectively.
Applsci 13 07907 g005
Figure 6. (ad) Comparison of the CV, GCD, Nyquist, and Bode plots of α-, β-, and γ-MnO2, respectively.
Applsci 13 07907 g006
Figure 7. (ac) CV, GCD, and EIS plots of the symmetric α-MnO2 device. (d) CV scan using various potential windows. (e) Specific energy vs. specific power. (f) GCD cycling at 4 A/g up to 2000 cycles.
Applsci 13 07907 g007
Disclaimer/Publisher’s Note: The statements, opinions and data contained in all publications are solely those of the individual author(s) and contributor(s) and not of MDPI and/or the editor(s). MDPI and/or the editor(s) disclaim responsibility for any injury to people or property resulting from any ideas, methods, instructions or products referred to in the content.

