Article

Pore Structure and Fluid Evaluation of Deep Organic-Rich Marine Shale: A Case Study from Wufeng–Longmaxi Formation of Southern Sichuan Basin

1
School of Geoscience and Technology, Southwest Petroleum University, Chengdu 610500, China
2
The Unconventional Reservoir Evaluation Department, PetroChina Key Laboratory of Unconventional Oil and Gas Resources, Chengdu 610500, China
3
Sichuan Collaborative Innovation Center for Shale Gas Resources and Environment, Chengdu 610500, China
*
Author to whom correspondence should be addressed.
Appl. Sci. 2023, 13(13), 7827; https://doi.org/10.3390/app13137827
Submission received: 28 March 2023 / Revised: 21 June 2023 / Accepted: 28 June 2023 / Published: 3 July 2023

Abstract

:
Deeply buried (>3500 m) marine shale has become a focus point for the future exploration and exploitation of shale hydrocarbon in China. Low-temperature nitrogen adsorption (LTNA), scanning electron microscopy (SEM), nuclear magnetic resonance (NMR), and other experiments were combined to characterize the pore structure and fluid division in deep-marine shale of the southern Sichuan Basin in this study. The results suggest that the deep-marine shale had a relatively developed nanopore network, especially with honeycomb organic pores. These organic pores were largely macropores with good connectivity in three-dimensional space and constituted the major reservoir space of the deep-marine shale gas. Microfractures were predominantly clay-mineral-related fractures, and the development degree of microfractures connected with organic pores was low, which contributed to the preservation of organic pores. Within the deep-marine shale interval, the pore volumes of Section 1 and Section 3 were higher. Pore volume was predominantly contributed by pores above 10 nm, where macropores accounted for a large proportion. Based on a combination of high-speed centrifugation and gradient temperature drying, the pore fluid of deep-marine shale reservoirs was quantitatively classified into four types: clay-bound fluid, capillary-bound fluid, free-flowing fluid, and closed-pore fluid. The clay-bound fluid existed in pores of less than 4.25 nm, which cannot be exploited. Quantitative division of the shale pore system could be realized by using the pore space differences of different types of fluids.

1. Introduction

Inspired by the success of unconventional hydrocarbon exploration in the U.S., China’s unconventional hydrocarbon has developed rapidly in recent years and has continuously obtained industrial oil and gas production from transitional [1], continental, and marine shale fields [2,3,4]. In recent years, the annual output of marine shale gas has accounted for more than 10% of the total annual output of natural gas in China [2]. Despite the steady and rapid promotion of annual output, the current production of shale gas in China is mainly derived from shallow–medium-buried (<3500 m) marine shale [5,6,7,8,9], and there is still a big gap compared with the shale gas production of the U.S. [10,11,12]. Deep-marine shale (buried depth of > 3500 m) gas resources in the southern Sichuan Basin have great potential, a large distribution area, and good preservation conditions, which is of great importance for the exploration and development of unconventional hydrocarbon in China [13,14,15].
Compared with conventional reservoirs, a shale reservoir is characterized by abundant nanopores and a complex pore structure, possessing ultra-low porosity and permeability [16], which increases the difficulty of the efficient exploitation of hydrocarbon. The burial depth of the main shale gas production layers of North America is rarely more than 3500 m [17,18,19,20]. The gas production layers with burial depths exceeding 4100 m are relatively low after fracturing, and the cost of a single well-drilling and fracturing project is more than USD 14 million [21]. It is difficult to achieve an economic and effective use of resources. Therefore, there is less experience with deep-marine shale exploration and exploitation.
Pores of various sizes provide reservoir space for natural gas in deep-marine shale [22]. It is significant to illustrate pore structure when evaluating the heterogeneity of shale reservoirs and improving shale gas well recovery [23]. Pore structure has a certain indication for the maintenance of abnormally high pressure in deep-marine shale reservoirs and even for the preservation and accumulation of shale gas, which is a key study topic related to the preservation and accumulation of deep-marine shale reservoirs. Moreover, the occurrence of pore fluid in reservoir spaces influences the adsorption capacity and flow capacity of natural gas to a large extent [24], which increases difficulties when evaluating shale gas resources and predicting commercial production [25,26,27,28,29,30,31].
In this study, taking the Wufeng (O3w)–Longmaxi Fm. (S1l) deep-marine shale as an example, pore structure and pore fluid in deep-shale reservoirs are evaluated on the basis of X-ray diffraction (XRD), scanning electron microscopy (SEM), nuclear magnetic resonance (NMR), and low-temperature nitrogen adsorption (LTNA).

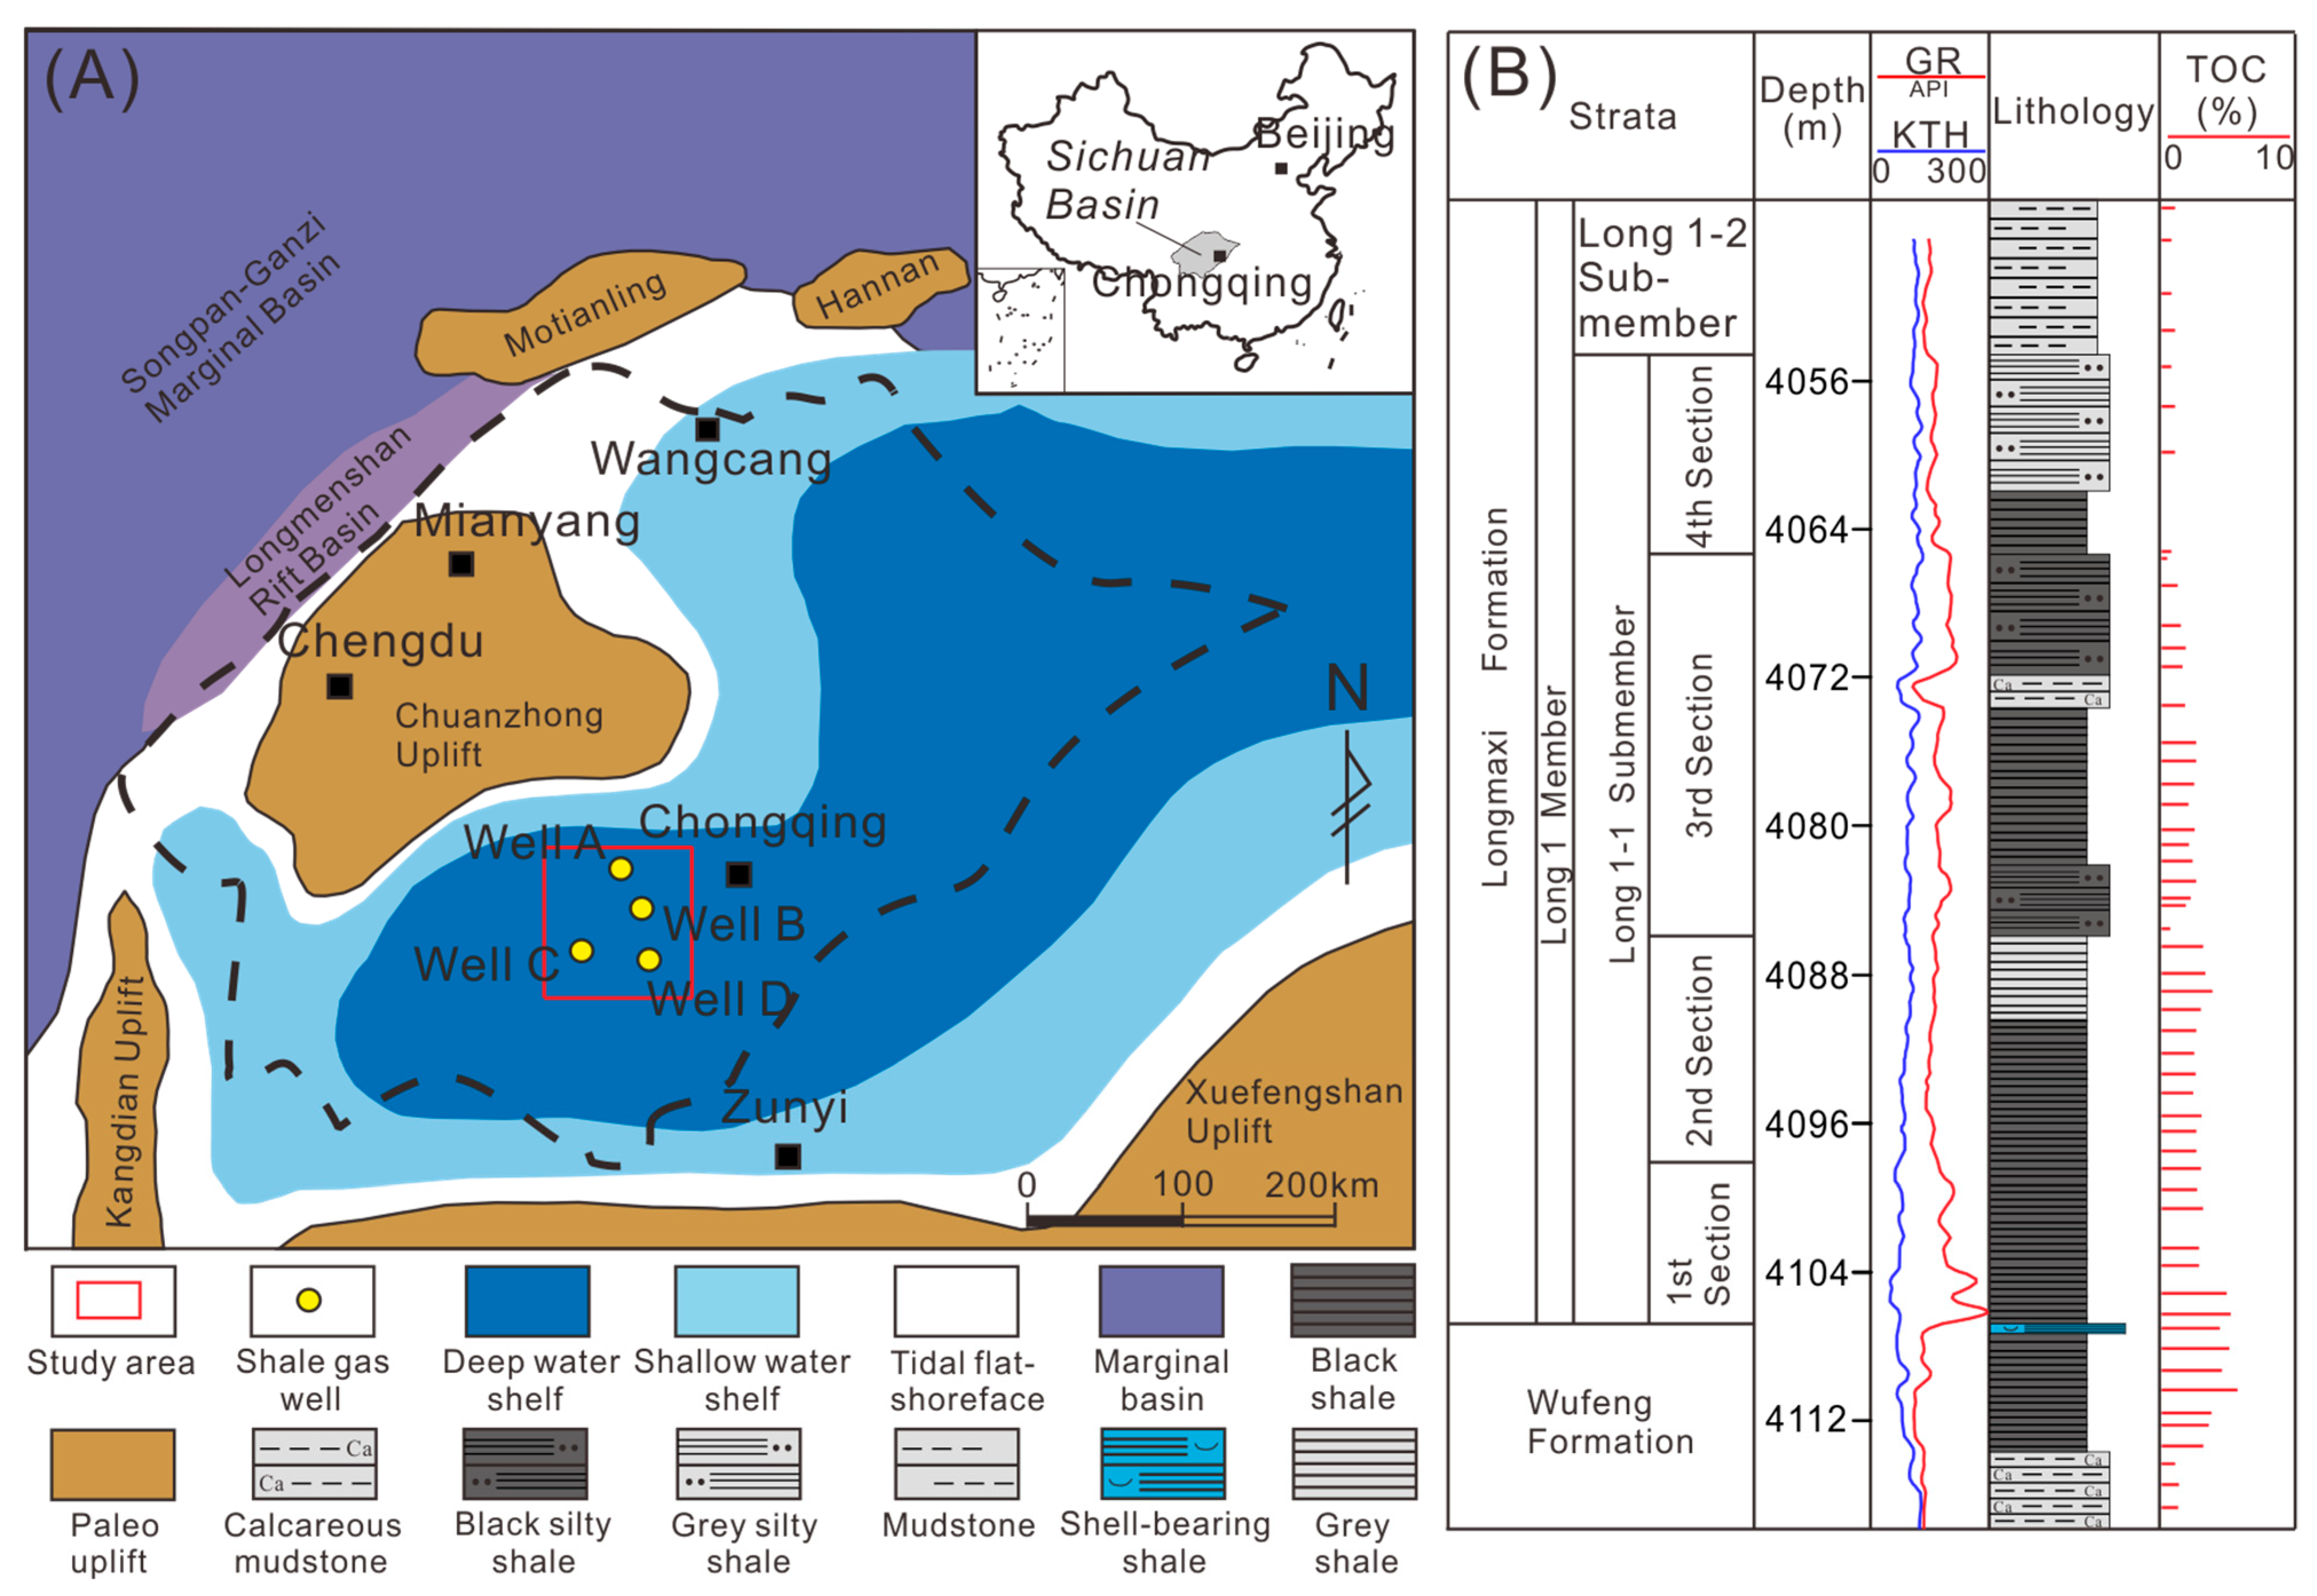
2. Geological Background

The study area was located in the south of the Sichuan Basin, west of Chongqing (Figure 1A). From the Late Ordovician to the Early Silurian period, the southern part and eastern part of this basin were dominated by deep-water shelf facies. A large area of continuous marine shale was formed in this deposition period [2], which is the focus point of deep shale gas development at present. Based on the sedimentary cycle, the S1l can be divided into two members from bottom to top: Long 1 Member and Long 2 Member. Among these, Long 1 Member is a progradational reverse cycle of continuous regression and is composed of the Long 1-1 Submember and the Long 1-2 Submember from bottom to top based on lithologic characteristics and the sedimentary cycle [32]. The Long 1-1 Submember is the major gas production interval of commercial deep-shale gas in the Sichuan Basin and is comprised of organic-rich black siliceous shale (S) and mixed shale (M). According to the demands of exploration and development, it is divided into four sections based on petrological characteristics and logging characteristics (Figure 1B).

3. Materials and Methods

A total of 20 core samples of O3w–S1l deep-marine shale were collected from four wells for NMR, LTNA, and SEM measurement. These experimental tests were carried out in the PetroChina Key Laboratory in Chengdu.
For SEM, the samples were first made into cubes of 20 mm × 20 mm × 10 mm, and then mechanical polishing, argon ion polishing, and short-time gold spraying were carried out successively. The experimental instrument used was an FEI Quanta 650 FEG SEM made by FEI Company (Hillsboro, OR, USA). For LTNA, these deep-shale samples were crushed into 60–80 mesh and dried in a drying chest at 110 °C over twelve hours. The processed shale samples were placed in an Autosorb-IQ3 analyzer made by Cantor Company (New York, NY, USA). The pretreatment was finished through evacuation at 110 °C for twelve hours under vacuum conditions. The N2 bath temperature was set to −196 °C (77.15 K). After LTNA, the Brunauer–Emmett–Teller (BET) model was used to obtain the specific surface area, and the density functional theory (DFT) model was applied to acquire pore size range and volume. Pore size classification was completed on the basis of a scheme proposed by previous studies [33]. Micropores represented pores smaller than 2 nm, while mesopores represented pores ranging between 2 nm and 50 nm. Macropores represented pores larger than 50 nm [34].
For NMR tests, the shale samples were first processed into cylindrical plunger samples. Then, these samples were dried at 110 °C for twenty-four hours. After twelve hours of evacuation, the shale plunger samples were saturated with aqua pura under 25 MPa for 48 h. After the saturation process, the plunger samples were taken out, and the NMR T2 signals were obtained after standing in saturated fluid for twelve hours. For the occurrence of different fluid types, two groups of parallel plunger samples saturated with aqua pura were tested at different centrifugation speeds and drying temperatures, and NMR experiments were carried out after each round of drying and centrifugation. The centrifugation time of each shale plunger sample was set to thirty minutes, and the drying time was set to twenty-four hours. The NMR test sequence was CPMG, with a main frequency of 12 MHz, and the test parameters were as: TE was 0.1 ms, NECH was 10,000, NS was 64 times, and TW was 3000 ms.

4. Results and Discussion

4.1. Reservoir Space Characterization

4.1.1. Organic Pores

Pores within organic matter are widely considered as a major part of nanoscale pores in organic-rich shale [35]. These pores seem to be isolated in solid space (Figure 2) but have good connectivity in solid space [36]. The two-dimensional shapes of the Wufeng Formation for Section 3 shale were mostly bubble-like, elliptical, round, and honeycomb-like (Figure 2A–D). The pore size of these pores was between several nanometers and hundreds of nanometers, and they were mainly composed of macropores above 50 nm. The pore morphology of Section 4 shale was mostly irregular shapes (Figure 2E).

4.1.2. Intraparticle Pores

Intraparticle pores within a shale reservoir are formed as a result of selective dissolution within brittle mineral particles, including calcite and feldspar (Figure 2F). Based on pore size distribution, the intraparticle pores of Long 1-1 were in the range of mesopore–macropore, but the development degree of intraparticle pores was generally low.

4.1.3. Interparticle Pores

Interparticle pores within deep-marine shale develop between different particles, including brittle minerals and clay minerals (Figure 2G). The pore size of these pores is influenced by particle size and compaction strength. The size of the mineral particles determines the original size of interparticle pores. As the burial depth continues to increase, intergranular pores gradually decrease under the continuous impact of compaction.

4.1.4. Microfracture

Microfractures not only provide reservoir spaces for hydrocarbon, but also act as migration pathways for hydrocarbon. The microfractures of Section 1 were mainly developed between minerals and organic matter and had the characteristics of a narrow width, a short length, and a smooth surface (Figure 2H). The microfractures of Section 2 were formed as the result of shrinkage within clay minerals during diagenesis, and their lengths and widths were larger than those of Section 1 (Figure 2I). The origin of microfractures in Section 3 was the same as that in Section 2 (Figure 2J). The microfractures of Section 4 were also formed by the shrinkage of clay minerals caused by the diagenetic stage. The widths and lengths of the microfractures in Section 4 were the largest of the four sections (Figure 2K). In general, the microfractures in the deep-marine shale reservoir of the south Sichuan Basin were mainly related to clay minerals, and microfractures related to organic matter were rare (Figure 2L). Vertically, the development degree of microfractures increased gradually from Section 1 to Section 4.

4.2. Pore Structure Quantitative Characteristics

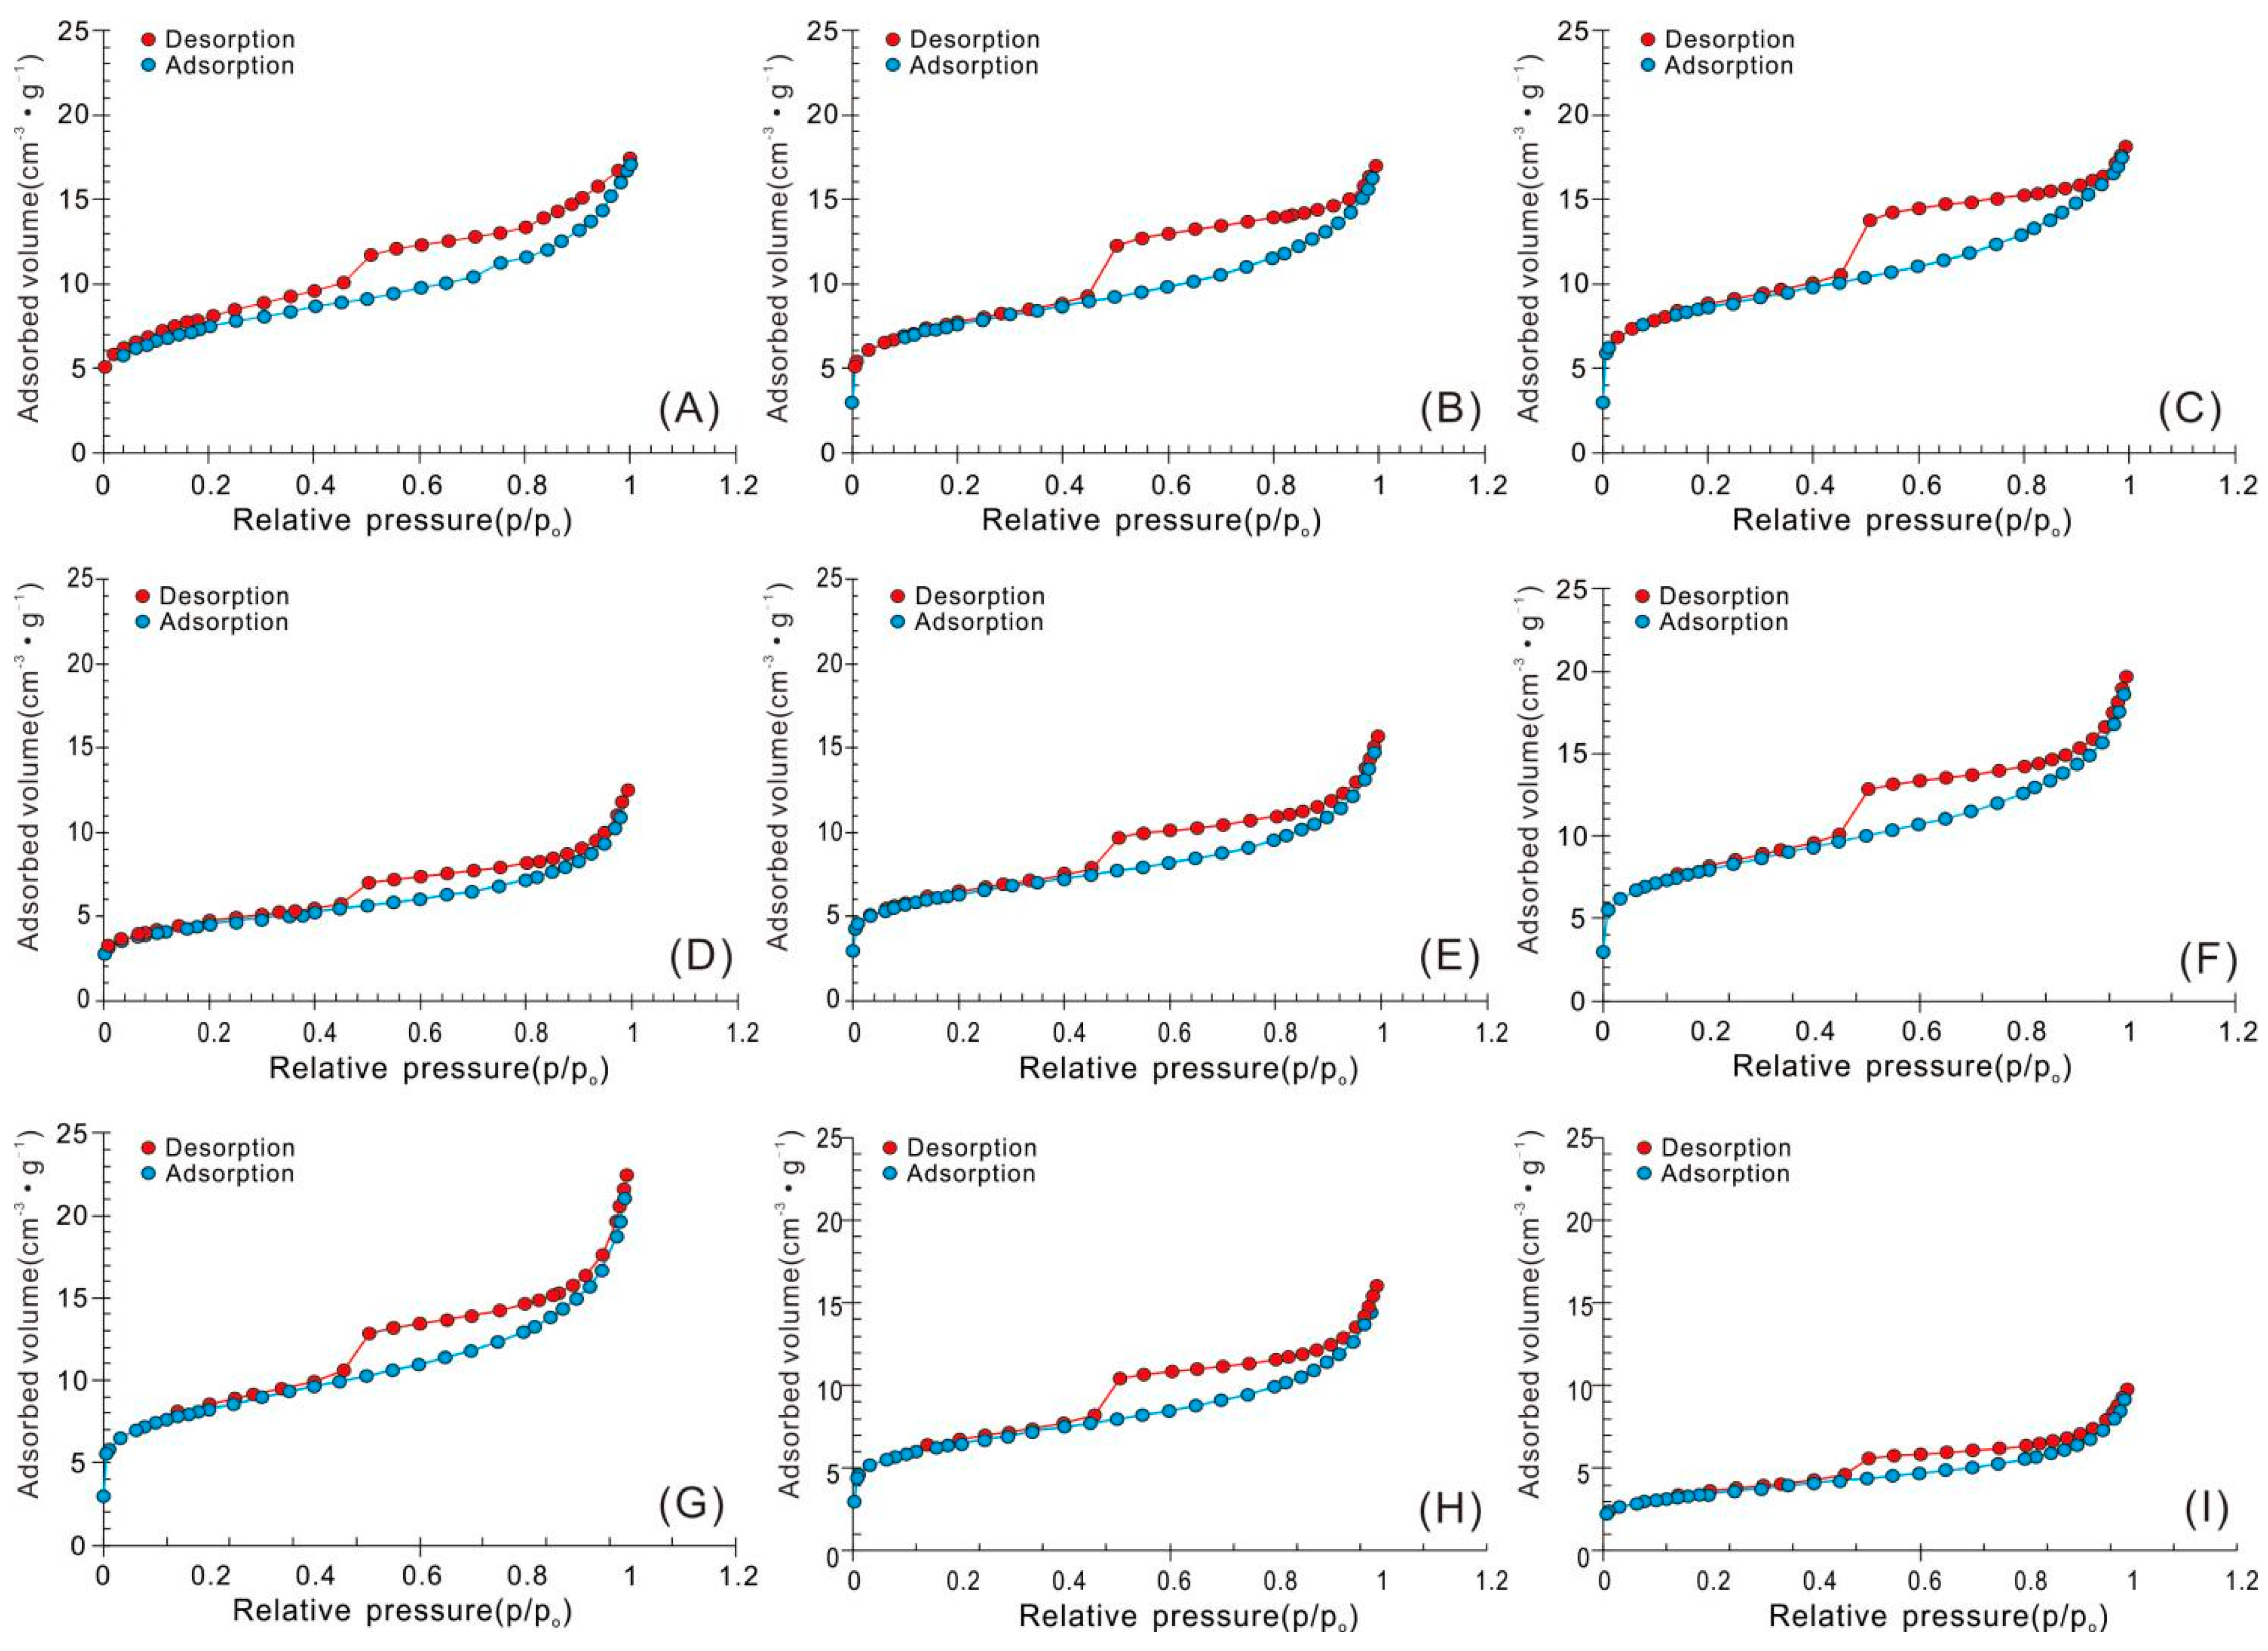
4.2.1. LTNA Isotherms and Pore Geometry

On the basis of LTNA isotherm curve classification proposed by the IUPAC [34], the pore types in the deep-marine shale of the study area included H2, H3, and H4. The isothermal adsorption curve of Wufeng Formation shale (4105.15 m) was similar to that of the H3 type (Figure 3A). The curve shape of the adsorption stage became steeper near the saturated vapor pressure (SVP) point, indicating the large adsorption capacity contributed by abundant micro-nanopores. The desorption curve was gentle at the median pressure point, causing a wide hysteresis loop and suggesting that the pores were mainly parallel plate pores, which are conducive to the seepage migration of gas. The isothermal adsorption curve of Section 1 shale was similar to H2 morphology (Figure 3B). The curve shape of the adsorption stage became steeper at the SVP point, indicating that the adsorption capacity was large and that there were many micro-nanopores (Figure 3C). The desorption curve was steep near the median pressure point, causing a very wide hysteresis loop and suggesting that these pores were dominated by a cylindrical shape with open ends or fine-necked (ink-bottle-like) amorphous pores [37], which are beneficial to the adsorption and storage of natural gas. The adsorption isothermal curve of Section 2 shale was similar to that of H3 and H4 (Figure 3D). The adsorption curve was slower near the SVP point, reflecting that the adsorption content was small due to deficient micro-nanopores [37]. The desorption curve was gentle near the median pressure point, causing a narrow hysteresis loop and reflecting that the pores were mainly parallel-plate-like and slit-like amorphous pores (Figure 3E). The isothermal adsorption curve of Section 3 shale was similar to that of H2 (Figure 3F), and the adsorption curve became steeper at the SVP point, indicating that the adsorption capacity was large due to abundant micro-nanopores. The desorption curve was steeper near the median pressure point, causing a relatively wide and gentle hysteresis loop and suggesting that the pores were similar to those of Section 1 shale (Figure 3G), i.e., mainly cylindrical pores with open ends or fine–necked (ink-bottle-like) amorphous pores. The isothermal adsorption curve of Section 4 shale was similar to that of H4 and H3 (Figure 3H), and the adsorption curve became gentler at the SVP point, indicating that the adsorption capacity was small, which was caused by deficient micro-nanopores. The pores of Section 4 had both parallel-plate-like and slit-like pores, facilitating the migration of pore fluids (Figure 3I). The pore morphologies reflected by the hysteresis loops formed by the nitrogen adsorption–desorption curves were also confirmed with SEM images.

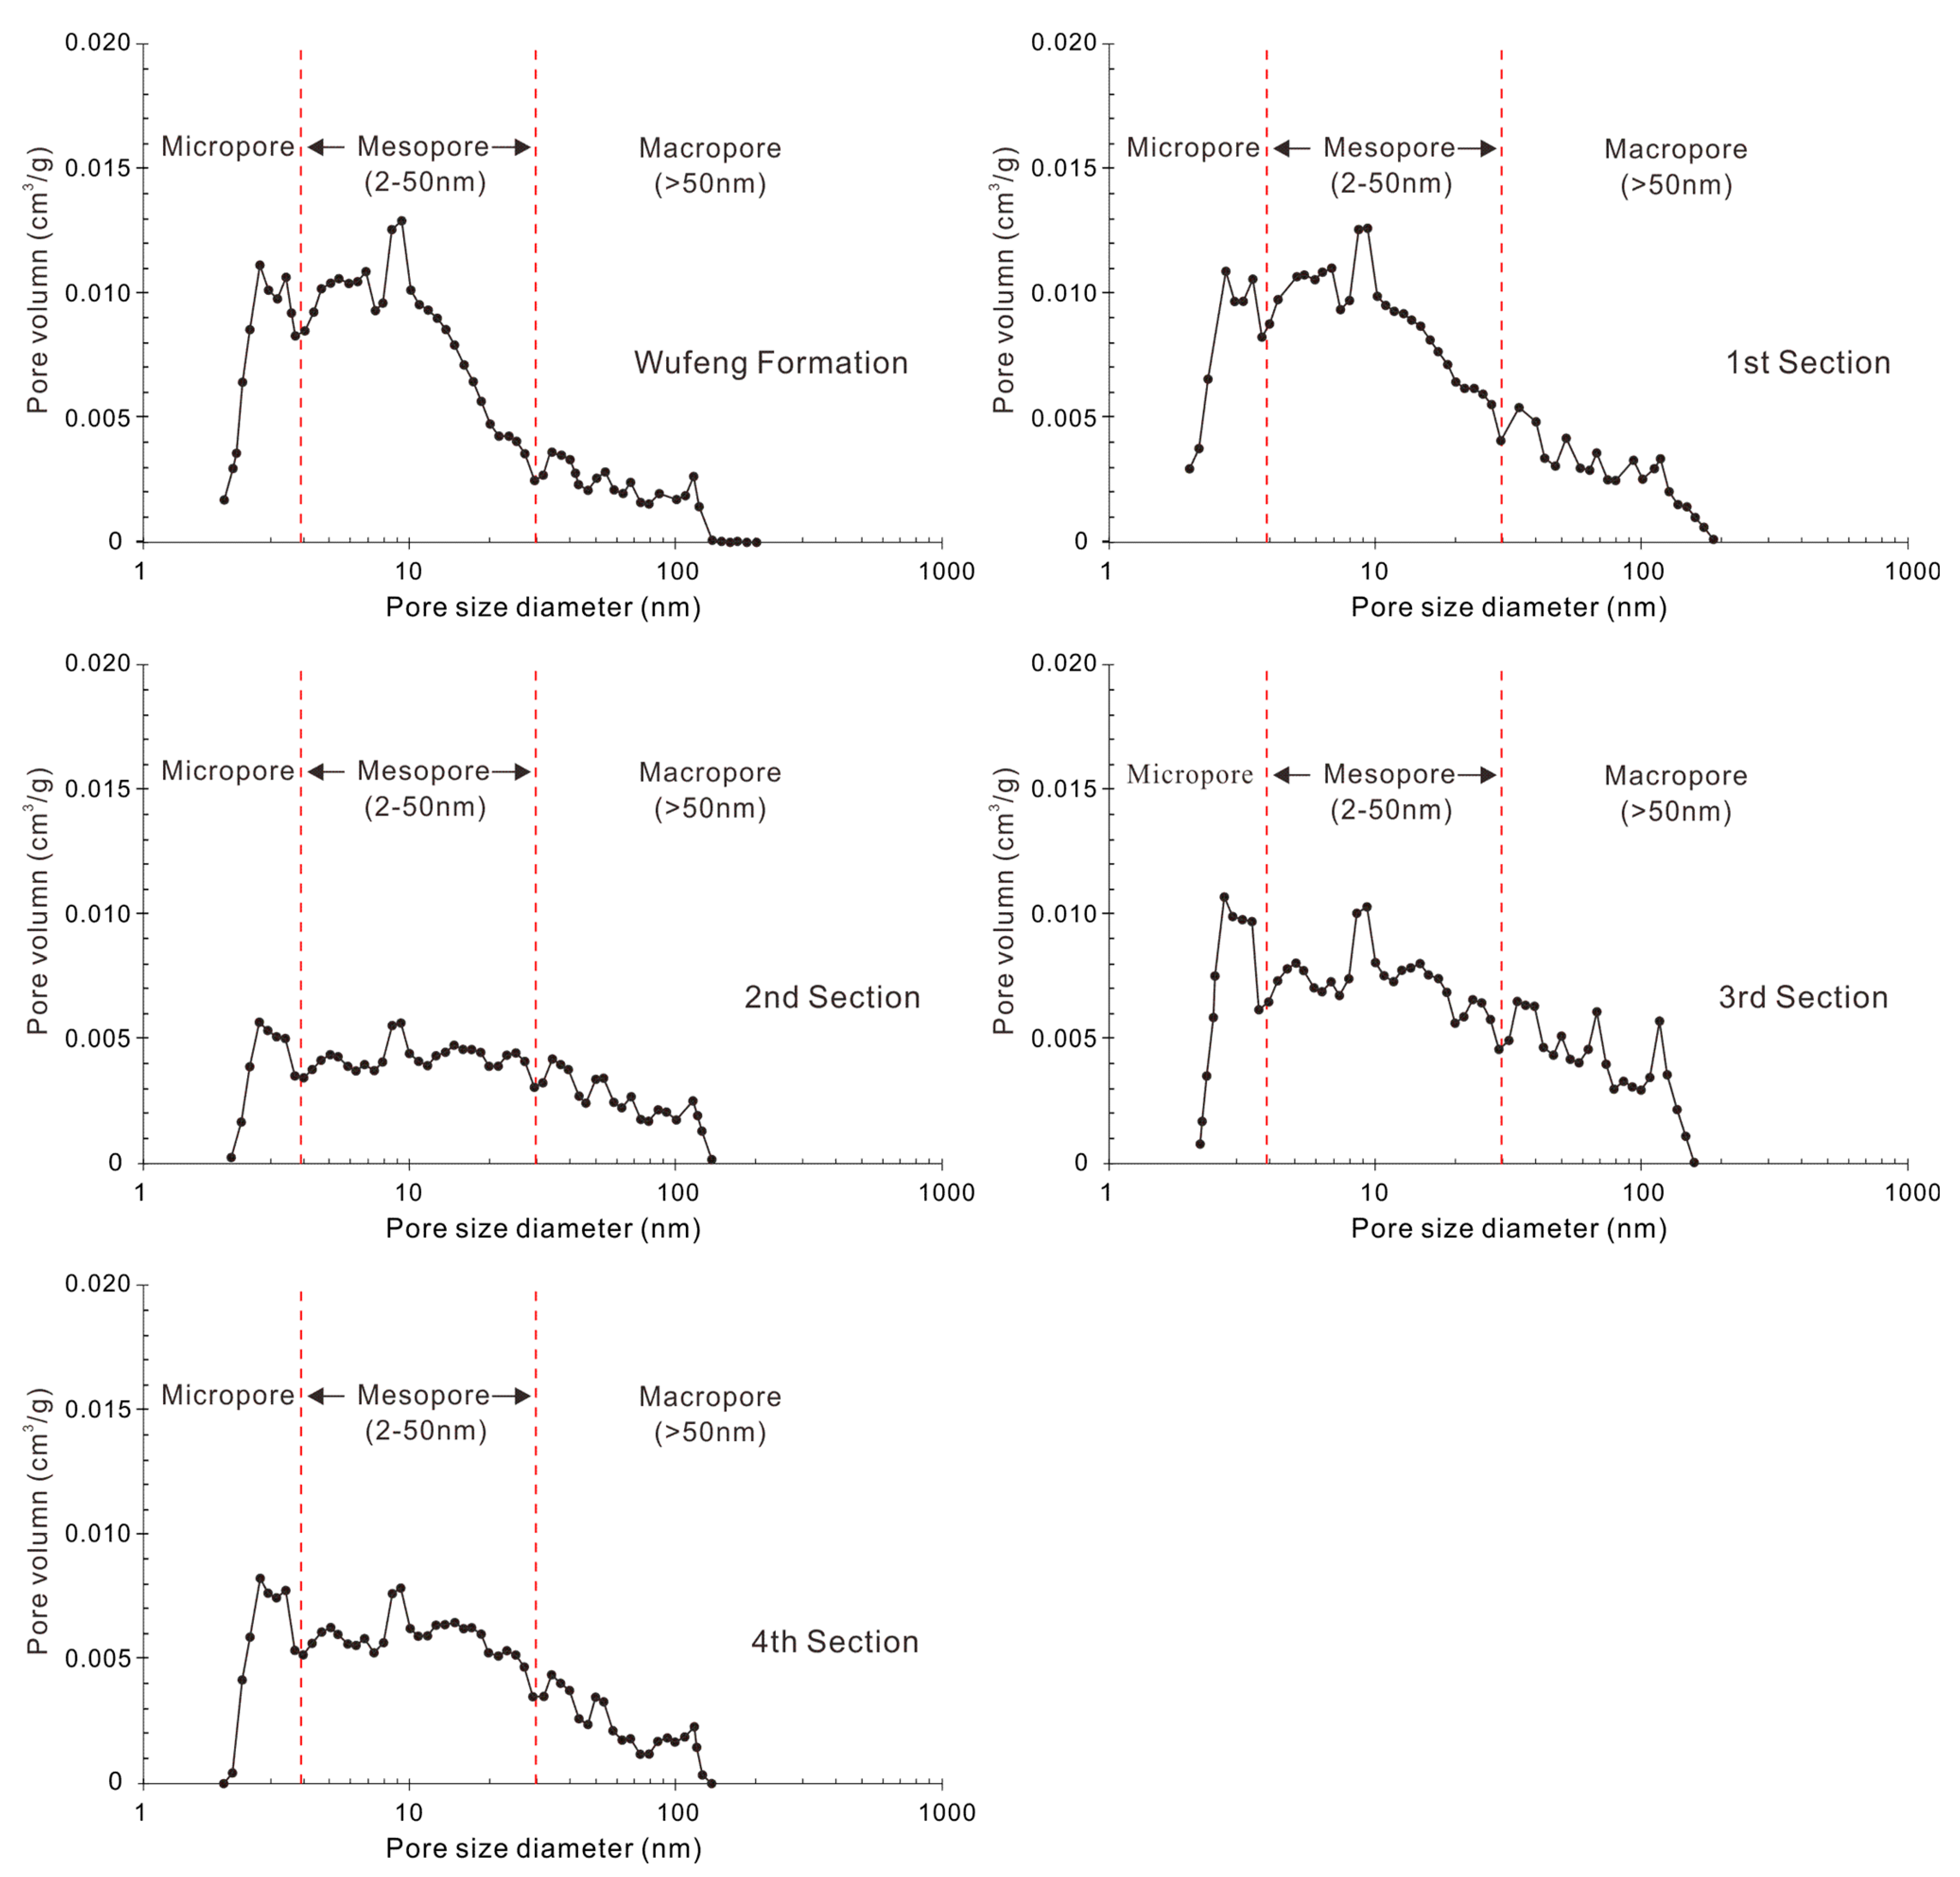
4.2.2. Pore Size Distribution

Based on LTNA analyses, Section 1 shale had the largest pore volume, while Section 2 shale and Section 4 shale had the smallest pore volume. The pore size was mainly distributed in 1 nm–200 nm, and pores ranging between 4 nm and 30 nm composed the major part of the pore volume. The pores larger than 30 nm in Wufeng Formation Section 1 shale and Section 3 shale were the most developed (Figure 4).
NMR T2 time is positively correlated with shale pore size, and spectral peak area is positively correlated with shale porosity [38]. The NMR T2 spectral morphology can also reflect the pore size distribution and development degree in a shale reservoir. The NMR T2 spectra of the deep-marine shale showed a bimodal or trimodal pattern, but the T2 values corresponding to their main peaks were small, indicating that the pore volume of the deep-marine shale was mainly contributed by small pores. The T2 value corresponding to the main peak of the NMR T2 spectrum in Section 1 exceeded 1 ms, indicating a relatively large pore network (Figure 5).
In order to quantitatively characterize the degree of pore development of different pore sizes more intuitively, the LTNA and NMR test results were fitted to calculate the optimal C value (Figure 6), thereby obtaining the pore size distribution on the basis of the NMR results.
The results show that the pore size distribution in O3w and Section 1 shale was concentrated in 10 nm–100 nm, and the large pore size pores were more developed. The pore size distribution in Section 3 was concentrated between 5 nm and 50 nm, and the proportion of pores over 1000 nm was large (Figure 7). The pore size distribution within Section 2 was concentrated in 5 nm–50 nm, and the proportions of macropores and micropores were small. The pore size distribution in Section 4 was concentrated in 2 nm–50 nm, and the proportion of macropores was also small, but the proportion of micropores was relatively large.

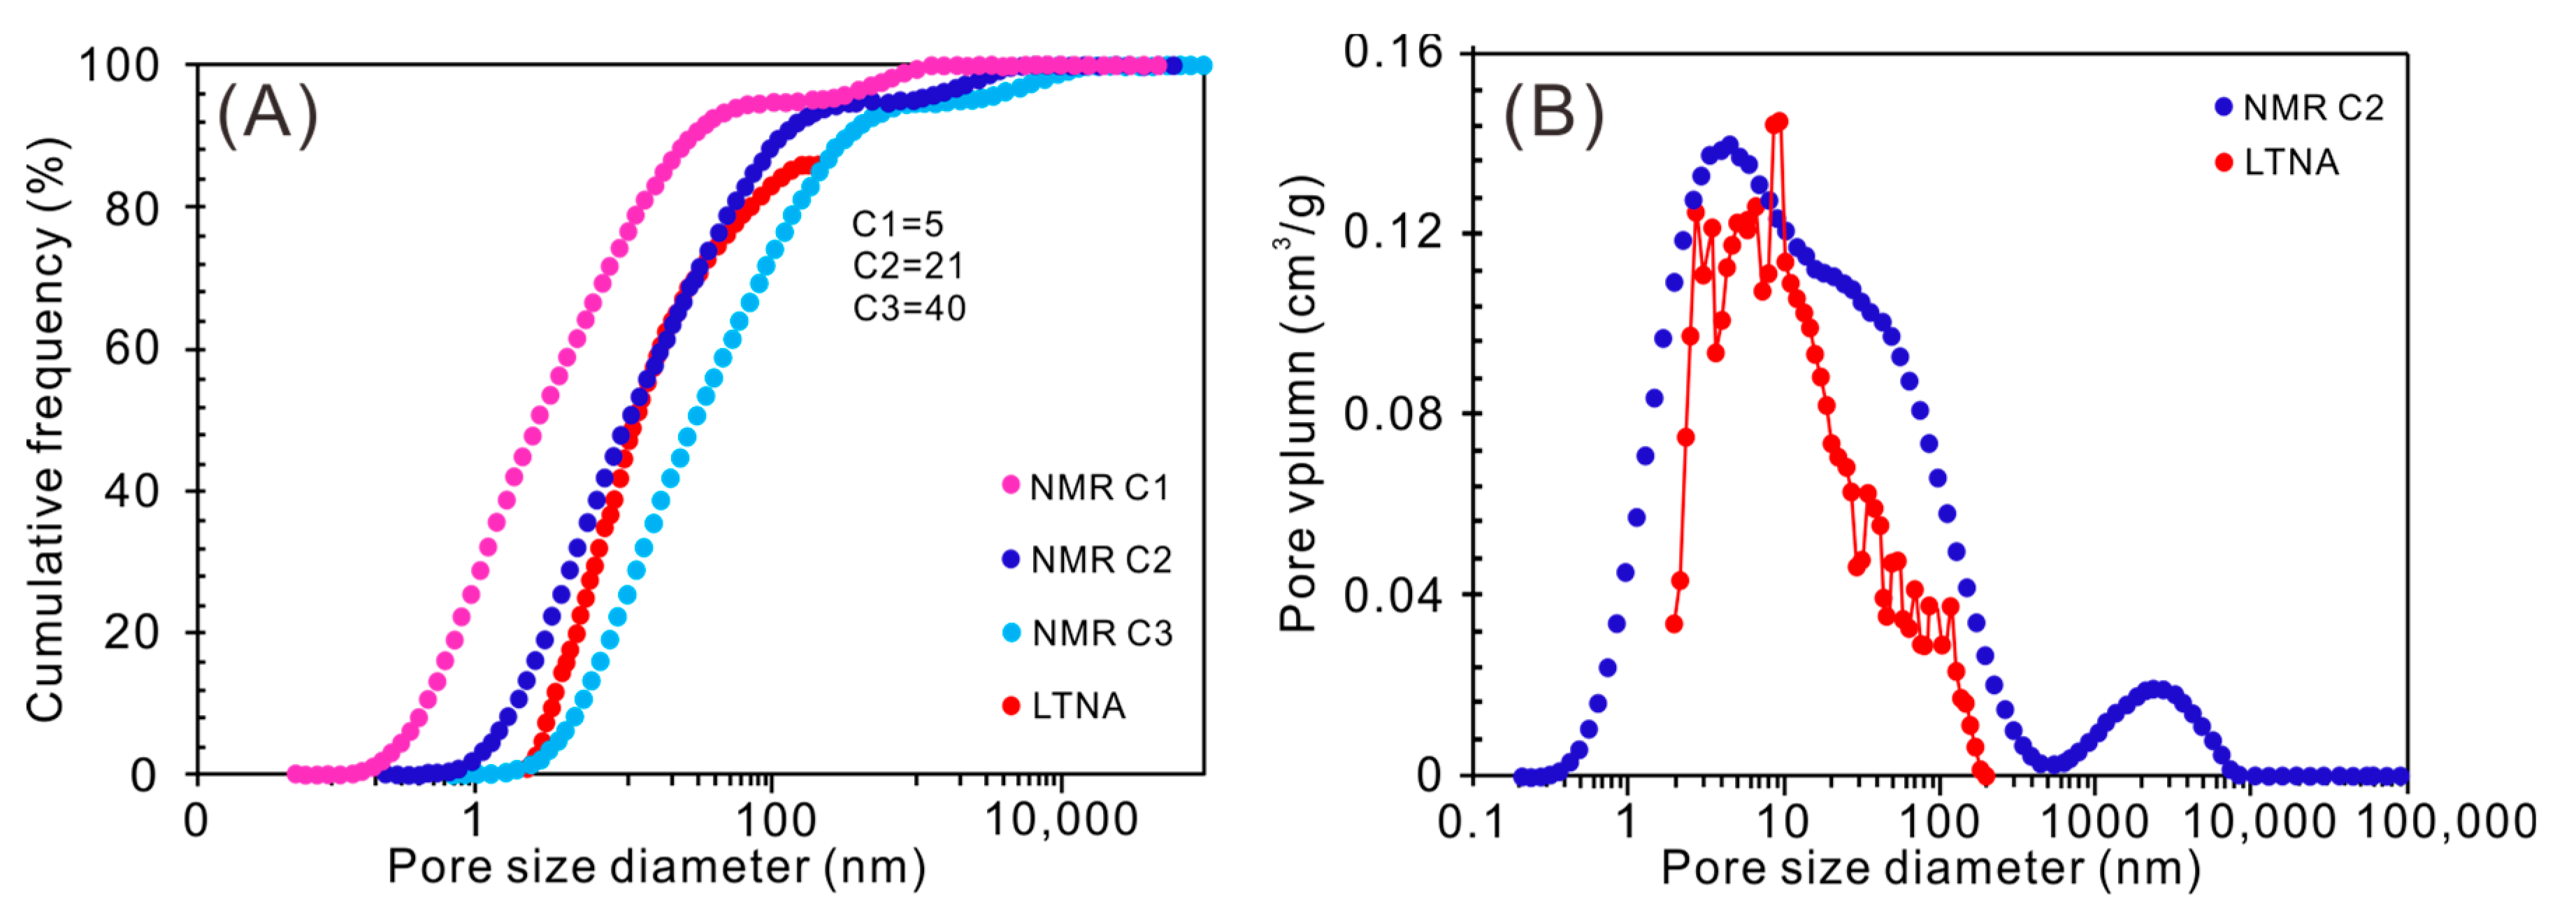
4.3. Pore Fluid Evaluation

By integrating gradient temperature drying with high-speed centrifugation, the pore fluid types within the deep-marine shale reservoir were quantitatively classified [39]. As the centrifugal speed increased (Figure 8A), the decreasing trend of NMR porosity gradually slowed down. When the centrifugal speed reached 12,000 r/min, the NMR porosity of the shale remained basically unchanged, which was close to the real bound–water state. Therefore, 12,000 r/min could be used as the boundary between movable fluid and bound fluid, and then the T2 cutoff value of capillary movable water could be determined. At this time, the residual fluids corresponded to capillary–bound water and clay–bound water in small pores (Figure 8A).
Figure 8B suggests that the NMR porosity of deep-marine shale could be divided into three parts based on drying temperature variation, and the porosity acquired through NMR at each stage changed obviously. The straight slope of the first part was large, the straight slope of the second part tended toward 0, and the straight slope of the third part was small. The different slopes indicate that different types of water in the shale were gradually evaporated. The first stage represented the main evaporation of movable fluid and capillary–bound fluid in the pores. When the temperature exceeded 80 °C, the movable fluid and capillary–bound fluid within pores were basically removed, but only when the temperature reached 120 °C could clay–bound water overcome resistance and migrate out of the shale pores. Therefore, the slope of the straight line in the second stage approached 0. When the drying temperature was below 200 °C, it was quite difficult to completely remove clay–bound water. When the temperature reached 200 °C, the bound water in clay could be effectively removed. However, this temperature could not remove the structural water in clay, so it would not devastate the pore structure of the clay. Stage 3 represented the evaporation of bound water in clay, resulting in a decrease in NMR porosity.
Based on the above centrifugal and gradient–temperature–drying method, the NMR characteristics of shale samples could be classified into solid-related signals and fluid-related signals. The solid-related signals contained NMR signals of kerogen and dry clay. Fluid-related signals were composed of three parts: (1) clay–bound water, (2) capillary–bound water, and (3) movable water. After centrifugation at 12,000 r/min, the content of movable water could be acquired via T2 spectrum (Figure 8). We believe that the signals in the shale mainly came from the fluid part, and compared to the signal contribution of the fluid, the signal contribution of the solid part of the shale could be ignored.
After drying saturated water samples at 120 °C, these removed parts corresponded to movable water and capillary–bound water. The specific content could be calculated from the NMR data. When the drying temperature reached 200 °C, the removed part was clay–bound water, and its specific content was acquired through T2 signals. The remaining part of the NMR response was a shale matrix signal with a smaller signal quantity (including closed pores). Therefore, the shale NMR response mainly came from the fluid-related part at the T2 time, representing the distribution range of the pore size. Fluids were further classified into four parts: (1) free, movable water; (2) capillary–bound water; (3) clay–bound water; and (4) closed–pore fluid (Figure 9). In a subsurface environment, the reservoir spaces of deep-marine shale filled by clay–bound water cannot be charged by shale gas. Thus, the T2 cutoff value of clay–bound water corresponded to the minimum pore size of the exploitable pores of shale gas (i.e., effective pores). The determination of the T2 cutoff value was based on the research of Testamanti et al. [39]. According to the conversion coefficient determined in Figure 6, the T2 cutoff value could be converted into a specific pore size.
For the deep-marine shale samples in this study, the average NMR T2 value corresponding to the effective pore of shale was 0.4 ms, and the corresponding pore size limit was 4.25 nm.
According to the above research, the classification of shale reservoir pore fluid could be applied to evaluate the shale reservoir spaces. The pores less than 5 nm were clay–bound water and closed–pore–bound water, which were not recoverable. The pores ranging between 5 nm and 25 nm represented the capillary–bound water portion, which could be developed by a certain fracturing mining process. The pores larger than 25 nm represented movable water parts that could be directly developed. For actual development and production, the pores corresponding to the capillary–bound water part and the movable water part are available for mining, belonging to effective pores.
According to the above division method, pore fluid was divided into different sections. The data suggest that the proportion of movable fluid in the Wufeng Formation in Section 1 and Section 3 of Well A and Well B was relatively high, ranging from 30% to 42%, and the proportion of immobile fluid was low at less than 30% (Figure 10). The movable fluid of the Wufeng Formation of Section 1 and Section 3 in Wells C and D was relatively low at less than 30%; the proportion of capillary–bound water fluid was between 38% and 49%, and the proportion of immobile fluid was relatively high (Figure 10).

5. Conclusions

(1) Organic pores within deep-marine shale of the Wufeng–Longmaxi Formation showed a variety of shapes, mainly macropores larger than 50 nm. They had good connectivity in three-dimensional space and acted as the major storage area and permeable space for natural gas. Many types of inorganic pores were developed, including intraparticle-dissolved pores of calcite and feldspar and interparticle pores between different minerals.
(2) Within the deep-shale interval, the pore structure of Sections 1 and 3 was the best, and the pore morphology corresponded to the ink-bottle-shape beneficial to the adsorption and storage of natural gas. Meanwhile, Sections 1 and 3 had the largest pore volume, dominated by pores above 10 nm, and a large proportion of macropores.
(3) Pore fluids in deep-marine shale could be classified into four parts: (1) capillary–bound water; (2) free, moveable water; (3) clay–bound water; and (4) closed–pore fluid. Pores smaller than 5 nm were clay–bound water and closed–pore bound water, which are not recoverable. Pores ranging between 5 nm and 25 nm corresponded to the capillary–bound water portion, which can be recovered by a certain fracturing mining process. Pores larger than 25 nm were movable water parts that can be directly developed. Sections 1 and 3 had the highest free–flowing and capillary–bound water content and the best development conditions.

Author Contributions

Conceptualization, G.C. and Y.G.; methodology, G.C.; validation, Y.G., Y.J. and Z.W.; formal analysis, G.C.; investigation, G.C. and Y.G.; data curation, Z.W.; writing—original draft preparation, G.C. and Y.G.; writing—review and editing, G.C. and Y.G.; visualization, Z.W.; supervision, Y.J.; project administration, Y.J. All authors have read and agreed to the published version of the manuscript.

Funding

This research was funded by the National Natural Science Foundation of China (No. 42272171) and the Science and Technology Cooperation Program of CNPC–SWPU Innovation Alliance (No. 2020CX020104).

Institutional Review Board Statement

Not applicable.

Informed Consent Statement

Not applicable.

Data Availability Statement

Data are available upon request due to privacy/ethical restrictions.

Conflicts of Interest

The authors declare that they have no known competing financial interests or personal relationships that might have influenced the work presented in this article.

References

  1. Sun, Y.; Jiang, Y.; Xiong, X.; Li, X.; Li, S.; Qiu, Z.; Sun, X. Lithofacies and sedimentary environment evolution of the Shan23 Submember transitional shale of the Shanxi Formation in the Danilng-Jixian area, eastern Ordos Basin. Coal Geol. Explor. 2022, 50, 104–114. [Google Scholar]
  2. Dong, D.; Liang, F.; Guan, Q.; Jiang, Y.; Zhou, S.; Yu, R.; Gu, Y.; Zhang, S.; Qi, L.; Liu, Y. Development model and identification evaluation technology of Wufeng-Longmaxi Formation quality shale gas reservoirs in the Sichuan Basin. Nat. Gas Ind. 2022, 42, 96–111. [Google Scholar] [CrossRef]
  3. Gu, Y.; Li, X.; Qi, L.; Li, S.; Jiang, Y.; Fu, Y.; Yang, X. Sedimentology and geochemistry of the Lower Permian Shanxi Formation Shan 23 Submember transitional shale, Eastern Ordos Basin, North China. Front. Earth Sci. 2022, 10, 859845. [Google Scholar] [CrossRef]
  4. Gu, Y.; Hu, D.; Wei, Z.; Liu, R.; Hao, J.; Han, J.; Fan, Z.; Jiang, Y.; Wang, Z.; Xu, Q. Sedimentology and geochemistry of the Upper Permian Linghao Formation marine shale, Central Nanpanjiang Basin, SW China. Front. Earth Sci. 2022, 10, 914426. [Google Scholar] [CrossRef]
  5. Jiang, Y.; Song, Y.; Qi, L.; Chen, L.; Tao, Y.; Gan, H.; Wu, P.; Ye, Z. Fine lithofacies of China’s marine shale and its logging prediction: A case study of the Lower Silurian Longmaxi marine shale in Weiyuan area, southern Sichuan Basin, China. Earth Sci. Front. 2016, 23, 107–118. [Google Scholar]
  6. Jiang, Y.; Chen, L.; Qi, L.; Luo, M.; Chen, X.; Tao, Y.; Wang, Z. Characterization of the Lower Silurian Longmaxi marine shale in Changning area in the south Sichuan Basin, China. Geol. J. 2018, 53, 1656–1664. [Google Scholar] [CrossRef]
  7. Li, H.; Zhou, J.; Mou, X.; Guo, H.; Wang, X.; An, H.; Mo, Q.; Long, H.; Dang, C.; Wu, J.; et al. Pore structure and fractal characteristics of the marine shale of the Longmaxi Formation in the Changning Area, Southern Sichuan Basin, China. Front. Earth Sci. 2022, 10, 1018274. [Google Scholar] [CrossRef]
  8. Li, J.; Li, H.; Yang, C.; Wu, Y.; Gao, Z.; Jiang, S. Geological characteristics and controlling factors of deep shale gas enrichment of the Wufeng-Longmaxi Formation in the southern Sichuan Basin, China. Lithosphere 2022, 12, 4737801. [Google Scholar] [CrossRef]
  9. Li, H. Research progress on evaluation methods and factors influencing shale brittleness: A review. Energy Rep. 2022, 8, 4344–4358. [Google Scholar] [CrossRef]
  10. Milliken, K.L.; Rudnicki, M.; Awwiller, D.N.; Zhang, T. Organic matter-hosted pore system, Marcellus Formatior (Devonian), Pennsylvania. AAPG Bull. 2013, 97, 177–200. [Google Scholar] [CrossRef]
  11. Avraam, C.; Chu, D.; Siddiqui, S. Natural gas infrastructure development in North America under integrated markets. Energy Policy 2020, 147, 111757. [Google Scholar] [CrossRef]
  12. Bazilian, M.; Brandt, A.R.; Billman, L.; Heath, G.; Logan, J.; Mann, M.; Melaina, M.; Statwick, P.; Arent, D.; Benson, S.M. Ensuring benefits from North American shale gas development: Towards a research agenda. J. Unconv. Oil Gas Resour. 2014, 7, 71–74. [Google Scholar] [CrossRef]
  13. Jiang, Y.; Liu, X.; Fu, Y.; Chen, H.; Zhang, H.; Yan, J.; Chen, C.; Gu, Y. Evaluation of effective porosity in marine shale reservoir, western Chongqing. Acta Pet. Sin. 2019, 40, 1233–1243. [Google Scholar]
  14. Liu, S.; Jiao, K.; Zhang, J.; Ye, Y.; Xie, G.; Deng, B.; Ran, B.; Li, Z.; Wu, J.; Li, J.; et al. Research progress on the pore characteristics of deep shale gas reservoirs:An example from the Lower Paleozoic marine shale in the Sichuan Basin. Nat. Gas Ind. 2021, 41, 29–41. [Google Scholar]
  15. Jiang, C.; Zhang, H.; Zhou, Y.; Gan, H.; Pu, J.; Jiang, Y.; Fu, Y.; Gu, Y.; Li, M.; Wang, Z.; et al. Paleogeomorphic characteristics of Wufeng-Longmaxi formation and its influence on development of high-quality shale in Dazu area, Western Chongqing. J. Cent. South Univ. (Sci. Technol.) 2022, 53, 3628–3640. [Google Scholar]
  16. Clarkson, C.R.; Solano, N.; Bustin, R.M.; Bustin, A.M.M.; Chalmers, G.R.L.; He, L.; Melnichenko, Y.B.; Radliński, A.P.; Blach, T.P. Pore structure characterization of North American Shale gas reservoirs using USANS/SANS, gas adsorption, and mercury intrusion. Fuel 2013, 103, 606–616. [Google Scholar] [CrossRef]
  17. Ko, L.T.; Ruppel, S.C.; Loucks, R.G.; Hackley, P.C.; Zhang, T.W.; Shao, D.Y. Pore-types and pore-network evolution in Upper Devonian-Lower Mississippian Woodford and Mississippian Barnett mudstones: Insights from laboratory thermal maturation and organic petrology. Int. J. Coal Geol. 2018, 190, 3–28. [Google Scholar] [CrossRef]
  18. Chalmers, G.R.; Bustin, R.M.; Power, I.M. Characterization of gas shale pore systems by porosimetry, pycnometry, surface area, and field emission scanning electron microscopy/transmission electron microscopy image analyses: Examples from the Barnett, Woodford, Haynesville, Marcellus, and Doig units. AAPG Bull. 2012, 96, 1099–1119. [Google Scholar] [CrossRef]
  19. Klaver, J.; Desbois, G.; Littke, R.; Urai, J.L. BIB-SEM characterization of pore space morphology and distribution in postmature to overmature samples from the Haynesville and Bossier shales. Mar. Pet. Geol. 2015, 59, 451–466. [Google Scholar] [CrossRef]
  20. Pommer, M.; Milliken, K. Pore types and pore-size distributions across thermal maturity, Eagle Ford Formation, Southern Texas. AAPG Bull. 2015, 99, 1713–1744. [Google Scholar] [CrossRef]
  21. Jiang, T.; Bian, X.; Wang, H.; Li, S.; Jia, C.; Liu, H.; Sun, H. Volume fracturing of deep shale gas horizontal wells. Nat. Gas Ind. 2017, 37, 90–96. [Google Scholar] [CrossRef]
  22. Gu, Y.; Cai, G.; Hu, D.; Wei, Z.; Liu, R.; Han, J.; Fan, Z.; Hao, J.; Jiang, Y. Geochemical and geological characterization of Upper Permian Linghao Formation shale in Nanpanjiang Basin, SW China. Front. Earth Sci. 2022, 10, 883146. [Google Scholar] [CrossRef]
  23. Wang, Z.; Jiang, Y.; Fu, Y.; Lei, Z.; Xu, C.; Yuan, J.; Wen, R.; Wang, Z.; Gu, Y.; Yin, X. Characterization of Pore Structure and Heterogeneity of Shale Reservoir from Wufeng Formation-Sublayers Long-1, in Western Chongqing Based on Nuclear Magnetic Resonance. Earth Sci. 2022, 47, 490–504. [Google Scholar]
  24. Wang, E.; Guo, T.; Liu, B.; Dong, X.; Zhang, N.; Wang, T. Geological features and key controlling factors of gas bearing properties of deep marine shale in the Sichuan Basin. J. Cent. South Univ. (Sci. Technol.) 2022, 53, 3615–3627. [Google Scholar]
  25. Gasparik, M.; Bertier, P.; Gensterblum, Y.; Ghanizadeh, A.; Krooss, B.M.; Littke, R. Geological controls on the methane storage capacity in organic-rich shales. Int. J. Coal Geol. 2014, 123, 34–51. [Google Scholar] [CrossRef]
  26. Korb, J.; Nicot, B.; Louis-Joseph, A.; Bubici, S.; Ferrante, G. Dynamics and wettability of oil and water in oil shales. J. Phys. Chem. C 2015, 118, 23212–23218. [Google Scholar] [CrossRef]
  27. Dehghanpour, H.; Zubair, H.A.; Chhabra, A.; Ullah, A. Liquid intake of organic shales. Energy Fuels 2012, 26, 5750–5758. [Google Scholar] [CrossRef]
  28. Ross, D.; Bustin, R.M. The importance of shale composition and pore structure upon gas storage potential of shale gas reservoirs. Mar. Pet. Geol. 2009, 26, 916–927. [Google Scholar] [CrossRef]
  29. Roychaudhuri, B.; Tsotsis, T.T.; Jessen, K. An experimental investigation of spontaneous imbibition in gas shales. J. Pet. Sci. Eng. 2013, 111, 87–97. [Google Scholar] [CrossRef]
  30. Drummond, C.; Israelachvili, J. Fundamental studies of crude oil-surface water interactions and its relationship to reservoir wettability. J. Pet. Sci. Eng. 2004, 45, 61–81. [Google Scholar] [CrossRef]
  31. Zhang, H.; Jiang, Y.; Zhou, K.; Fu, Y.; Zhong, Z.; Zhang, X.; Qi, L.; Wang, Z.; Jiang, Z. Connectivity of pores in shale reservoirs and its implications for the development of shale gas: A case study of the Lower Silurian Longmaxi Formation in the southern Sichuan Basin. Nat. Gas Ind. 2019, 39, 22–31. [Google Scholar] [CrossRef]
  32. Li, Y.; Zhou, A.; Xie, W.; Qiu, X.; Dai, Y.; Hu, X.; Cheng, X.; Jiang, Y.; Fu, Y.; Wang, Z. Lithofacies divisionand main controlling factors of reservoir development in Wufeng Formation-Longitsub-member shale in the Luzhou region, South Sichuan Basin. Nat. Gas Ind. 2022, 42, 112–123. [Google Scholar]
  33. Loucks, R.G.; Reed, R.M.; Ruppel, S.C.; Hammes, U. Spectrum of pore types and networks in mudrocks and a descriptive classification for matrix related pores. AAPG Bull. 2012, 96, 1071–1098. [Google Scholar] [CrossRef] [Green Version]
  34. Thommes, M.; Kaneko, K.; Neimark, A.V.; Olivier, J.P.; Rodriguez-Reinoso, F.; Rouquerol, J.; Sing, K.S.W. Physisorption of gases, with special reference to the evaluation of surface area and pore size distribution (IUPAC Technical Report). Pure Appl. Chem. 2015, 87, 1051–1069. [Google Scholar] [CrossRef] [Green Version]
  35. Chen, Z.; Song, Y.; Jiang, Z.; Liu, S.; Li, Z.; Shi, D.; Yang, W.; Yang, Y.; Song, J.; Gao, F.; et al. Identification of organic matter components and organic pore characteristics of marine shale: A case study of Wufeng-Longmaxi shale in southern Sichuan Basin, China. Mar. Pet. Geol. 2019, 109, 56–69. [Google Scholar] [CrossRef]
  36. Zhang, K.; Jiang, S.; Zhao, R.; Wang, P.; Jia, C.; Song, Y. Connectivity of organic matter pores in the Lower Silurian Longmaxi Formation shale, Sichuan Basin, Southern China: Analyses from helium ion microscope and focused ion beam scanning electron microscope. Geol. J. 2022, 57, 1912–1924. [Google Scholar] [CrossRef]
  37. Brunauer, S.; Emmett, P.H.; Teller, E. Adsorption of gases in multimolecular layers. J. Am. Chem. Soc. 1938, 60, 309–319. [Google Scholar] [CrossRef]
  38. Yao, Y.; Liu, D.M.; Che, Y.; Tang, S.; Huang, W. Petrophysical characterization of coals by low-field nuclear magnetic resonance (NMR). Fuel 2010, 89, 1371–1380. [Google Scholar] [CrossRef]
  39. Testamanti, M.N.; Rezaee, R. Determination of NMR T2 cut-off for clay bound water in shales: A case study of Carynginia Formation, Perth Basin, Western Australia. J. Pet. Sci. Eng. 2017, 149, 497–503. [Google Scholar] [CrossRef] [Green Version]
Figure 1. (A) Location of south Sichuan Basin and studied wells. (B) Stratigraphic division of Wufeng (O3w)–Longmaxi Fm. (S1l) (based on Well C).
Applsci 13 07827 g001
Figure 2. SEM photomicrographs showing reservoir spaces of O3w–S1l deep-marine shale. (A) Organic pores, Well A, Wufeng Formation, 4370.80 m; (B) abundant organic pores in bitumen, Well A, Section 1, 4364.66 m; (C) organic pores in bitumen, Well A, Section 2, 4376.68 m; (D) honeycomb organic pores, Well C, Section 3, 4081.23 m; (E) organic pores, Well A, Section 4, 4344.64 m; (F) intraparticle pores within calcite particles, Well B, Section 1, 3859.50 m; (G) interparticle pores between mineral particles, Well A, Section 4, 4344.64 m; (H) microfracture, Well D, Section 1, 4386.21 m; (I) microfracture in clay minerals, Well C, Section 2, 4095.13 m; (J) microfracture, Well A, Section 3, 4348.55 m; (K) microfracture, Well D, Section 4, 4236.88 m; (L) microfractures between mineral particles and organic matter, Well A, Section 4, 4355.08 m.
Applsci 13 07827 g002
Figure 3. LTNA curves of Wufeng–Longmaxi Formation deep-marine shale. (A) Well C, Wufeng Formation, 4105.15 m; (B) Well C, Section 1, 4100.96 m; (C) Well C, Section 1, 4101.57 m; (D) Well C, Section 2, 4085.45 m; (E) Well C, Section 2, 4092.13 m; (F) Well C, Section 3, 4084.05 m; (G) Well C, Section 3, 4078.23 m; (H) Well C, Section 4, 4067.88 m; (I) Well C, Section 4, 4062.9 m.
Applsci 13 07827 g003
Figure 4. Pore size distribution with LTNA of the Wufeng–Longmaxi Formation deep-marine shale.
Applsci 13 07827 g004
Figure 5. NMR T2 spectra under different states for the deep-marine shale of the Wufeng–Longmaxi Formation. (A) Well A, Wufeng Formation, 4373.7 m; (B) Well A, Section 1, 4366 m; (C) Well A, Section 2, 4359.3 m; (D) Well B, Section 3, 4024.92 m; (E) Well A, Section 4, 4354.71 m.
Applsci 13 07827 g005
Figure 6. Fitting relationship between NMR T2 spectra and LTNA for the O3w–S1l deep-marine shale. (A) Fitting process diagram of NMR T2 spectra and LTNA; (B) Fitting result of NMR T2 spectra and LTNA.
Applsci 13 07827 g006
Figure 7. Pore size distribution of the O3w–S1l deep-marine shale. (A) Well A, Wufeng Formation, 4373.7 m; (B) Well A, Section 1, 4366 m; (C) Well A, Section 2, 4363.05 m; (D) Well A, Section 3, 4355.3 m; (E) Well A, Section 4, 4341.3 m.
Applsci 13 07827 g007
Figure 8. NMR porosity changes in Wufeng–Longmaxi Formation deep-marine shale under different centrifugation and drying conditions. (A) NMR porosity variation curve with centrifugal speed; (B) NMR porosity variation curve with drying temperature.
Applsci 13 07827 g008
Figure 9. Pore fluid classification and pore type characteristics of Wufeng–Longmaxi Formation deep-marine shale.
Applsci 13 07827 g009
Figure 10. Pore fluid proportions of O3w–S1l deep-marine shale. (A) Well A; (B) Well B; (C) Well C; (D) Well D.
Applsci 13 07827 g010
Disclaimer/Publisher’s Note: The statements, opinions and data contained in all publications are solely those of the individual author(s) and contributor(s) and not of MDPI and/or the editor(s). MDPI and/or the editor(s) disclaim responsibility for any injury to people or property resulting from any ideas, methods, instructions or products referred to in the content.

