Article

Hybrid Chaotic-Based PRNG for Secure Cryptography Applications

by
Abdullah M. Alnajim
1,
Ehab Abou-Bakr
2,3,
Sarah S. Alruwisan
4,
Sheroz Khan
5,* and
Rania A. Elmanfaloty
6,7,*
1
Department of Information Technology, College of Computer, Qassim University, Buraydah 51452, Saudi Arabia
2
Department of Computer Science and Information Technology, Jeddah International College, Jeddah 23831, Saudi Arabia
3
Department of Computer Engineering, The Higher Institute of Engineering and Technology, Alexandria Governorate 5515314, Egypt
4
Department of Architecture, College of Engineering and IT, Onaizah Colleges, Al-Qassim 56447, Saudi Arabia
5
Department of Electrical Engineering, College of Engineering and Information Technology, Onaizah Colleges, Onaizah 56447, Saudi Arabia
6
Department of Electrical and Computer Engineering, King Abdulaziz University, Jeddah 21589, Saudi Arabia
7
Department of Electronics and Communications Engineering, Alexandria Higher Institute of Engineering and Technology, Alexandria Governorate 21311, Egypt
*
Authors to whom correspondence should be addressed.
Appl. Sci. 2023, 13(13), 7768; https://doi.org/10.3390/app13137768
Submission received: 17 April 2023 / Revised: 20 June 2023 / Accepted: 25 June 2023 / Published: 30 June 2023
(This article belongs to the Section Computing and Artificial Intelligence)

Abstract

:
This paper suggests a novel one-dimensional (1D) map to address the limitations of traditional chaotic 1D maps. In contrast to traditional 1D maps, the proposed map has three control parameters a, μ , and c, allowing it to exhibit chaotic behavior over a wide range of values. The dynamic behavior of the new 1D map was analyzed using well-known numerical methods, including the bifurcation diagram and Lyapunov exponent. Both tests showed their complex and diverse behavior. In addition, a novel image encryption scheme was devised using the new function as its pseudorandom number generator. Rigorous statistical testing was applied to the proposed encryption algorithm. The mean square error (MSE) and peak signal-to-noise ratio (PSNR) results, in addition to subjecting 28 images to number of pixels change rate (NPCR) and unified average changing intensity (UACI) tests demonstrated the robustness of the system. The results of this study demonstrate the effectiveness of the new 1D map for use in secure image cryptography applications, providing a more robust and secure alternative to traditional chaotic 1D maps.

1. Introduction

The need for privacy and security has been felt intensely in the wake of so many multi-media and social platforms [1] generating significant amounts of unstructured data. To protect sensitive information from being transmitted through communication networks and the data that are being stored in cloud storage services from unauthorized access and cyberattacks, cryptographers have explored various methods of ciphering data. One method is obfuscation, which blurs the visual identity in photos and videos in order [2] to perturb or unsettle original data [3] in order to protect personal information by encrypting the etymological origins of data [4], thus making data unreadable by unauthorized users. Another option is data masking [5], which involves obscuring parts of genomic data to make them unidentifiable during collection, which also makes it unidentifiable during transmission and storage. Tokenization [6] is another approach, which replaces sensitive data with nonsensitive data tokens that retain all essential elements of the data without compromising the security, thus protecting data confidentiality. Homomorphic encryption is a more complex method that allows computations to be performed on encrypted data without the need for decryption [7], which is primarily meant for noncryptographers. The process of encryption is commonly judged by how strong the proposed method is in terms of protection against different types of attacks [8,9]. It involves the use of an encryption mechanism using an encryption key, a communication channel for data transmission, a decryption system, and a key to decrypt the encrypted data. The strength of an encryption system is determined by the attributes of the key, such as its secrecy, difficulty to guess, and ability to withstand against an exhaustive search [10]. Each of these methods has its own benefits and limitations, and the appropriate method depends on the specific requirements and circumstances of each application [11,12]. The security of an encryption scheme is closely linked to the characteristics of the key the scheme uses. For an unbreakable scheme, the key should be truly random, suitable for one use only, and should be of the same length as the message, also called a one-time pad (OTP). However, these properties also have drawbacks. For instance, transmitting a key that is too long over a secure channel may not be practical, and it may make more sense to send the message itself through it. Furthermore, if the same key is utilized twice, the adversary may use XOR or frequency analysis to obtain information about the messages, and create a straightforward running key cipher in disguise.
Despite the importance of the strength of the key, other critically essential factors should be taken into account, including a novel chaotic oscillator for the overall performance of a novel encryption system [13] covering potential perspectives of the proposed PRNG. The results are produced in the form of the cipher versions of images. These include the computational complexity of the mathematics representation, the size of the generated key, and the unpredictable nature of the generated sequencing. In addition, the efficiency and practicality of an encryption algorithm should also be considered, as should the availability of the necessary computational resources and the ease of key management. In particular, under the exceptional circumstances of COVID-19 [14], the tokens shuffling approach (TSA) was introduced for better reliability during the pandemic.
Cryptologists use chaotic functions due to their simple mathematical representation and randomness [15] by applying the proposed algorithm to some original images to be reconstructed subsequently, achieving remarkable results in screening colonoscopy images through neural networks (NN) [16]. Chaos-based image encryption techniques are highly efficient in the case of multimedia data [17], using chaos game for encryption [18], making them ideal in terms of ease of implementation for cybersecurity applications [19].
1D chaotic maps are known for their limited number and range of control parameters, in addition to their tendency to converge under finite precision implementation. To address these issues, studies have proposed using 2D chaotic maps [20] that offer a balance between hardware complexity [21] and chaotic performance [22]. Despite this, due to their simple mathematical representation and low cost in terms of hardware implementation, a series of studies have been conducted to test the response of 1D chaotic systems under finite precision implementation [23,24], introducing novel 1D chaotic functions to expand the number and range of control parameters used [25,26]. The systems proposed in these studies were proven to be robust and secure when used in cryptographic systems.
This paper further explores the trend of expanding the number and range of control parameters of 1D maps [25] to achieve a wide range of dynamic behavior [26] by introducing a new piecewise 1D map with chaotic behavior across a wide range of its control parameters.
Furthermore, the newly introduced map is employed as the pseudorandom number generator (PRNG) within a novel image encryption scheme to assess its resilience and suitability in encryption systems. The scheme successfully withstood all rigorous testing it was subjected to, demonstrating its robustness against well-known statistical and differential attacks.
The paper is organized as follows: Section 2 provides a literature overview of the well-known 1D maps, and Section 3 introduces the new 1D map and presents the results of verifying its chaotic behavior. In Section 4, a new image encryption algorithm is suggested, which utilizes the map as a pseudorandom number generator (PRNG). The robustness of the proposed encryption scheme is demonstrated by applying known attacks in Section 5 before concluding the paper in Section 6. The effectiveness of the proposed algorithm was proven through rigorous testing, showing that it possesses robustness with remarkable confusion–diffusion properties.

2. Known 1D Chaotic Maps
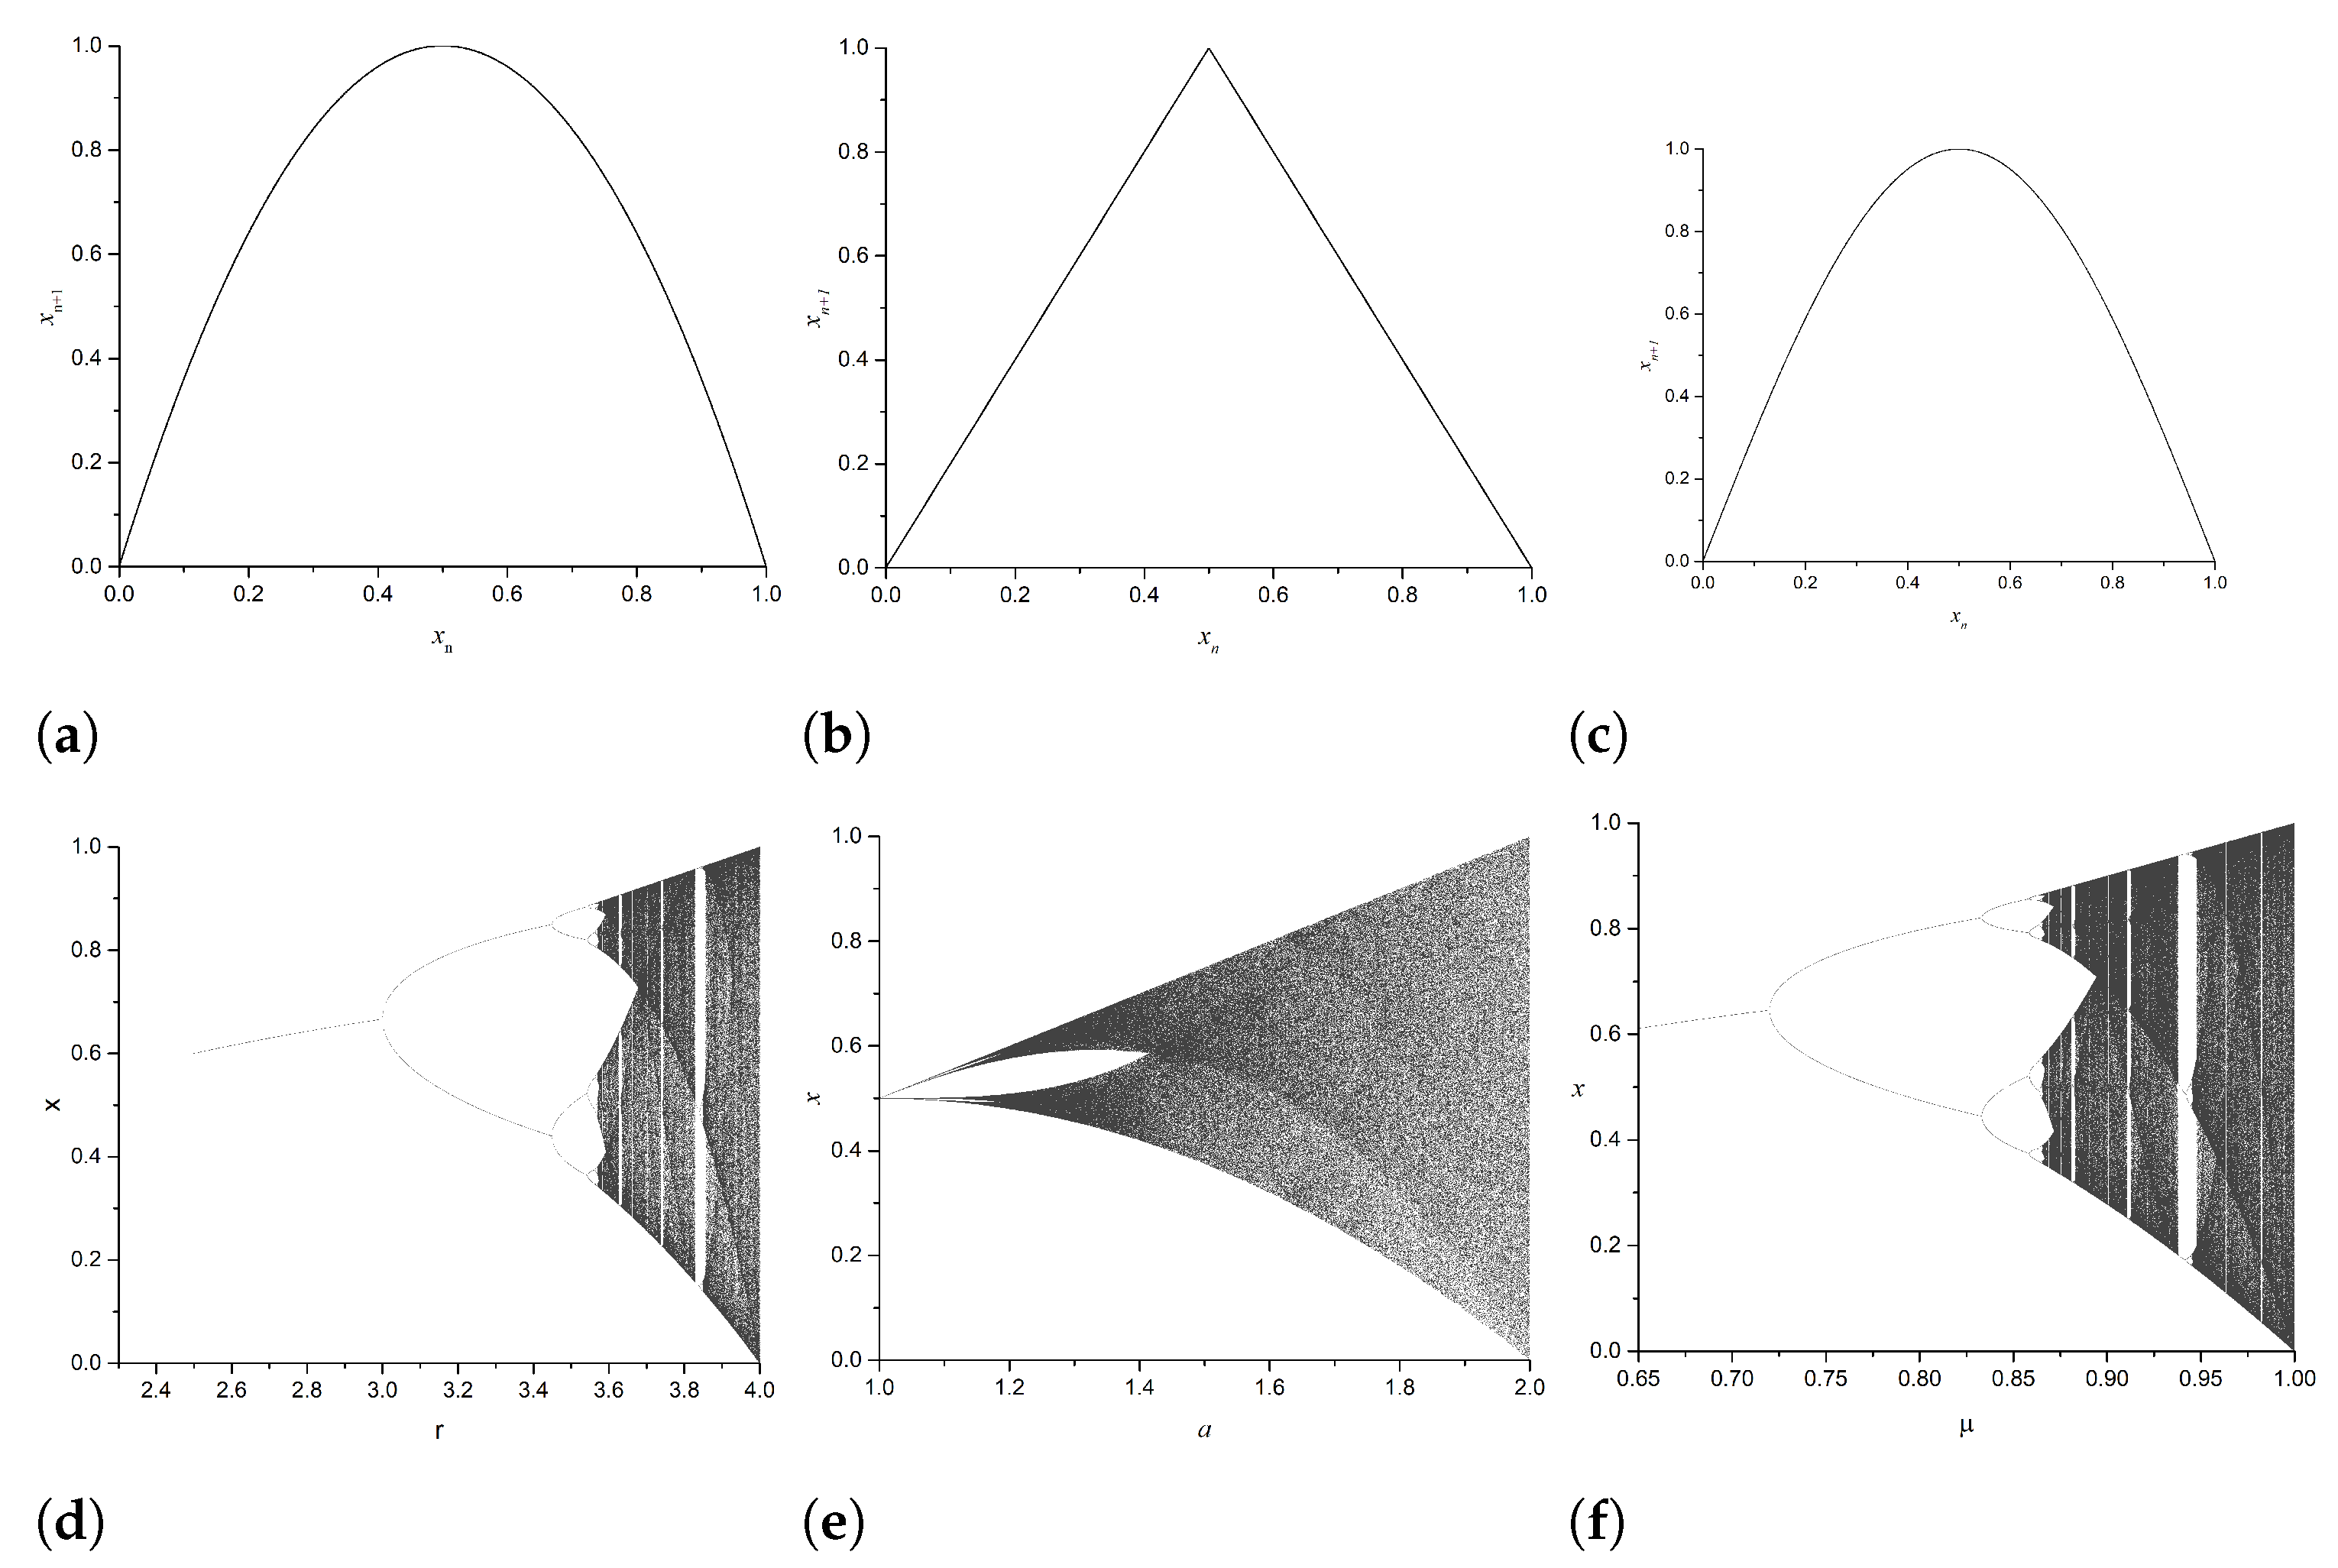
2.1. Logistic Map

Logistic maps make powerful tools for the examination of nonlinear systems, which have been applied to designing encryption schemes in various fields [27]. The simplicity of a logistic map allows for a comprehensive understanding of the underlying dynamics [28], while its complexity can reveal random-like behavior [29]. It is represented by the discrete-time iterative Equation (1), such that each iteration generates an iterate value:
x n + 1 = r x n ( 1 x n )
where 0 < x n < 1 denotes the state of the system at the nth iteration, and r is the control parameter that modulates the behavior of the system.
The behavior of the logistic map is contingent upon the value of the control parameter r. For r < 1 , the logistic map converges to a fixed point of z e r o . As shown in Figure 1a,b, the various forms illustrate that, for 1 < r < 4 values, the map oscillates between fixed points in a bifurcation behavior. For r = 4 , the solutions of the logistic map demonstrate chaos, implying that small variations in the initial conditions can result in fundamental differences in the long-term behavior of the system.

2.2. Tent Map

The tent map is a simple, discrete-time dynamical system that is often used to model chaos-based applications. It is defined by the piecewise Equation (2):
x n + 1 = a x n if x n < 0.5 a ( 1 x n ) if x n 0.5
where x is the state variable, n is the time step, and a is the parameter. The range of the parameter a for 1 < a < 4 between 0 and 2 determines the upper and lower limits of chaos in the system. For a 1 , the map is stable and periodic, while for 1 a 2 , the map exhibits chaotic behavior.
The tent map is known for the tent-like shape of its phase space, and it is one of the simplest examples of a chaotic system. It is often used as a prototypical example in the study of chaotic and nonlinear dynamics.

2.3. Sine Map

The chaotic sine map is a nonlinear function that exhibits complex and dynamic behaviors. It is derived from the sine function defined in Equation (3):
x n + 1 = sin ( ω x n )
where ω is a control parameter that determines the behavior of the map (Figure 1a). The chaotic sine map has been widely explored for its potential applications in cryptography and image encryption due to its ability to generate sequences of numbers that are apparently random and unpredictable.

3. Modified 1D Map

All the above-mentioned maps are simple mathematical functions that have been used in the fields of cryptography and other domains. However, they have certain limitations when it comes to generating pseudorandom sequences for use in the domain of cryptography. One of these limitations is the range of control parameters that results in limited chaotic behavior. For example, for a logistic map to be fully chaotic and to fill the complete space range f ( x ) : x x , x : x [ 0 , 1 ] , the control parameter must be r 4 .
To overcome this limitation, a new function is introduced that consists of a combination of the logistic map as given in Equation (1), a piecewise noniterative linear tent map given by y = 1 | c x 0.5 c | of Equation (3), and finally the iterative tent map as given in Equation (2). The iterative 1D map is given by Equation (4):
x n + 1 = r x n ( 1 x n ) ( 1 | c x 0.5 c | + μ x n ) 2 if x < 0.5 m o d ( r s i n ( π x n ) ( 1 | c x 0.5 c | + μ ( 1 x n ) ) , 1 ) if x 0.5
where x n and x n + 1 show the present and next states, respectively. The parameters r and μ are the control parameters for the logistic map and the tent map with approximate values of 4 and 2. The control parameter c is a global parameter that modifies the slope of the function and is used to create different dynamic behaviors as shown in Figure 2.

3.1. Sensitivity to Control Parameters and Initial Condition

The sensitivity of this system to small changes in the initial conditions or the control parameter c is a key aspect to consider when studying its dynamics. Small changes in the initial conditions can lead to vastly different behaviors in the long term, resulting in a highly sensitive system. Similarly, small changes in the value of the control parameter c can lead to significant changes in the system dynamics. This is clearly depicted in Figure 3 where perturbations of 10 6 in any of the initial conditions or control parameters produced two completely different sequences.
This property is crucial for ensuring the security and robustness of encryption systems that rely on the chaotic nature of the resulting PRNGs. This will make it extremely difficult for an attacker to predict or reproduce the sequence without having knowledge of the initial conditions.

3.2. Bifurcation Diagram

The bifurcation diagram of the function of Equation (4) is a powerful tool for understanding its dynamic behavior. Figure 4 shows a visual representation of how the system changes in its response to changes in the control parameter c. The function does not exhibit any of the usual dynamic behavior consisting of a sequence in the regions of stable fixed points, periodic orbits, and then chaos. Instead, when setting r = 4 and μ 2 while varying c, the function shows full chaotic behavior over the range of 0 c 2 .
It is also worth noting that the function can also show chaotic behavior for a range of r values and specific values of c as can be seen in Figure 4. This suggests that the system behavior is not solely determined by the control parameter c, but also by other parametric values of r. However, in this manuscript, we chose to solely focus on studying the properties of the function for changes in the control parameter c. This allows for a more in-depth analysis of the system’s behavior that relates to this specific parameter. Figure 5 shows examples of the bifurcation diagram of (4) depending on r when (a) c = 0.1, (b) c = 1.8.

3.3. Lyapunov Exponent

The Lyapunov exponent (LE) is a mathematical tool used to measure the rate of separation of nearby trajectories in a dynamic system. It is an important concept in the study of chaos theory and provides a measure of the sensitivity of the system’s behavior to initial conditions.
The Lyapunov exponent is calculated by taking the average rate of change of the distance between two nearby trajectories over time. It is represented mathematically as given in Equation (5):
λ = lim n 1 n i = 0 n 1 ln | δ 1 | | δ o |
where λ denotes the LE, while δ 1 and δ o show the spacing between the two trajectories. The positive Lyapunov exponent implies that the system is sensitive to initial conditions and that small variations in initial conditions will grow exponentially over time, leading to vastly varying outcomes. To calculate the Lyapunov exponent numerically, one can use the method in [30], which involves linearizing the system of equations at a given point and then iterating the linearized equations to calculate the exponential growth rate of the distance between nearby trajectories.
Figure 6 shows that the function of Equation (4) has a λ > 0 in the range of 2 c 2 . This indicates that the system is chaotic within this range of the control parameter c, as the Lyapunov exponent measures the rate of separation of the nearby trajectories, and a positive exponent implies exponential divergence.

4. Proposed Encryption Algorithm

Image encryption is a critical component of the information security domain, particularly in the domain of digital communication. With the proliferation of images being exchanged over various networks, the need for robust and secure image encryption algorithms has become increasingly important. The goal of image encryption is to convert an image into a ciphertext, which is unreadable to anyone unless it is decrypted. The encrypted image should remain confidential, even if intercepted by a cybernetic attacker.
The image encryption process must be secure, providing a high level of protection against various attacks, including brute force attacks and statistical attacks. In addition, the encryption process must be efficient and capable of performing real-time applications. The importance of image encryption cannot be underemphasized, especially in the case of sensitive images, such as medical or military images, which require the highest level of protection.
In this paper, the image encryption method is described in detail, providing a technical and mathematical analysis of the encryption process. The focus is on developing an efficient and secure image encryption algorithm that satisfies the requirements expected for protection of such levels. The algorithm (shown in Algorithm 1) was tested and evaluated using various statistical tests, and the results are discussed in detail.

4.1. Encryption Steps

The proposed image encryption algorithm is based on a permutation–confusion process that utilizes the proposed chaotic function as its core pseudorandom number generator (PRNG) with different keys k 1 and k 2 .
The overall key K is composed of two subkeys, k 1 and k 2 , each of which has a length of 128 bits, with the least significant 64 bits representing the parameter x 0 and the most significant 64 bits representing the parameter c. The generation of these keys is performed through the following steps:
  • Step 1: Key generation
The 256-bit sequence, referred to as the hash, is generated using the SHA-256 algorithm, which is a cryptographic hash function that takes an input of any length and produces a fixed-size output of 256 bits. Key k 1 uses the least, i.e., 128 bits, and k 2 uses the most, i.e., 128 bits. The values of x 0 and c for each key are derived from the hash using Equation (6) to Equation (9). In these equations, x 0 , k 1 and c k 1 denote the Least and Most 64 bits of k 1 , respectively. Similarly, x 0 , k 2 and c k 2 represent the Least and Most 64 bits of k 2 , respectively. The presence of 2 64 in the denominator of all equations ensures that the resulting value falls within the range [0,1). By multiplying this value by 2 in Equations (7) and (9), the range is extended to [0,2).
x 0 , k 1 = i = 0 63 2 i · h a s h ( i + 1 ) 2 64
c k 1 = 2 · i = 0 63 2 i · h a s h ( i + 65 ) 2 64
x 0 , k 2 = i = 0 63 2 i · h a s h ( i + 129 ) 2 64
c k 2 = 2 · i = 0 63 2 i · h a s h ( i + 193 ) 2 64
These equations ensure that x 0 and c stay in the ranges 0 x 0 1 and 0 c 2 .
  • Step 2: Permutation stage
In the permutation stage, a simple and effective algorithm is used to break the correlation between adjacent pixels in the message image, which is an important step for securing the scheme against statistical attacks. This is achieved by using the dimension of the original image [ M × N ] and the subkey k 1 to generate a sequence using the function f ( k 1 ) . The permuted pixels are then sorted based on this generated sequence.
The permutation process starts by reading a grayscale message image ( I m ) with size [ M × N ] . Each pixel in the image is converted to its binary form ( B ) . The image is then reshaped into a 1D array. The sequence is generated from a pseudorandom number generator (PRNG) using Equation (4) with a length of W × n , where n = M × N and W { 3 , 4 , 5 , 6 } . The subsequence of length n is extracted from this generated sequence. This subsequence is sorted while keeping the sorted element original index. The pixels in 1D I m are also sorted based on this generated sequence.
  • Step 3: Confusion stage
In the confusion stage, the goal is to increase the resistance against differential attacks by ensuring that any small change in the original image leads to nonuniform spreading across the ciphered image.
To achieve this, a stream y i is generated from the function f ( k 2 ) and used to replace the bit level value of each encrypted pixel using Equation (10):
C i = I m i f l o o r ( m o d ( y i t i m e s 10 4 , 256 ) )
where I m is the permuted pixels, y is the generated subsequence, and C i is the resulting image after the confusion step. This equation generates a confused image by performing an XOR operation on each pixel value with a value in the range of 0–255 derived from the “ f l o o r ( m o d ( y i t i m e s 10 4 , 256 ) ) ” part of the equation.
Algorithm 1 Proposed Image Encryption Algorithm
  • i m a g e readImage ( )
  • h a s h SHA 256 ( i m a g e )
  • k 1 least significant 128 bits of h a s h
  • k 2 most significant 128 bits of h a s h
  • x 0 k 1 , c k 1 DeriveFromHash ( k 1 )
  • x 0 k 2 , c k 2 DeriveFromHash ( k 2 )
  • s e q u e n c e 1 f ( k 1 , imageDimension )
  • p e r m u t e d I m a g e PermutePixels ( i m a g e , s e q u e n c e 1 )
  • s e q u e n c e 2 f ( k 2 , image . size )
  • c i p h e r t e x t confusePixels ( p e r m u t e d I m a g e , s e q u e n c e 2 )
  • functionDeriveFromHash( k e y )
  •      x 0 first 64 bits of k e y
  •      c last 64 bits of k e y
  •     return  x 0 , c
  • end function
  • functionPermutePixels( i m a g e , s e q u e n c e 1 )
  •     for each  p i x e l in i m a g e  do
  •          i n d e x getNextIndex ( sequence 1 )
  •          P I m a g e [ i n d e x ] p i x e l
  •     end for
  •     return  P I m a g e
  • end function
  • functionConfusePixels( i m a g e , s e q u e n c e 2 )
  •      c i p h e r I m a g e createEmptyImage ( image . size )
  •     for each  p i x e l in i m a g e  do
  •          e n c r y p t e d P i x e l p i x e l s e q u e n c e 2
  •          c i p h e r I m a g e . append ( e n c r y p t e d P i x e l )
  •     end for
  •     return  c i p h e r I m a g e
  • end function

4.2. Decryption Steps

The decryption process is the reverse of the encryption process. By using the same key and reversing the steps of encryption, decryption can be performed.

5. Results and Analysis

The algorithm is considered to be secure if it can effectively defend against any known forms of attacks, including brute-force key attack, statistical attacks, and similar types of known attacks. The proposed method was evaluated using various security analysis techniques to demonstrate its robustness. The analysis was carried out using a 64-bit double-precision floating-point representation, implemented using 64-bit MATLAB (R2020a) on a Windows 11 operating system, running on a Intel(R) Core(TM) i7-10510U CPU @ 1.80 GHz 2.30 GHz machine with 16 GB of RAM. For all tested images, the embedded initial conditions and control parameters in the utilized keys were generated by hashing the image under test using the SHA-256 cryptographic hash function.

5.1. Encryption Quality Analysis

5.1.1. Key Space Analysis

The proposed encryption algorithm utilizes two keys, k 1 and k 2 , in its permutation and confusion stages, respectively. Both keys consist of a control parameter c and an initial condition x 0 . The key space of the algorithm is determined by the range of possible values for c and x 0 . It is safe to say that, even with the fastest computers available today, the time required to brute-force a 256-bit key would be much greater than the estimated age of the universe. For example, consider a 64-bit key, a typical Intel(R) Core(TM) i7 computer with a clock speed of 1.8 billion cycles per second would take approximately 5.8 × 10 16 years to perform a brute-force attack on a 64-bit key. This demonstrates the importance of selecting strong cryptography keys in order to ensure the security and integrity of sensitive information.
Further, both keys are designed to have a large key space in the floating-point representation format, which ensures that the encryption algorithm is secure against key brute-force attacks. The use of different keys for the permutation and confusion stages further increases the security of the encryption algorithm by making it more difficult for an attacker to crack the encryption open and gain access to the message.

5.1.2. Key Sensitivity Analysis

The results of encryption algorithm’s sensitivity to changes analysis are presented in Figure 7, where a pixel-by-pixel subtraction was performed between two encrypted images, I = | I 1 ( K 1 ) I 2 ( K 2 ) | , using two slightly different keys K 1 and K 2 , where K 1 and K 2 differed only by a small amount in one of their control parameters, such that δ = K 1 ( c 1 ) K 2 ( c 2 ) < 10 8 .
The noisy appearance of encrypting a high-resolution image 3264 × 4841 I in Figure 7d confirms that the algorithm produced different encrypted images, I 1 using K 1 in Figure 7b and I 2 using K 2 in Figure 7d.

5.1.3. MSE and PSNR

The mean squared error (MSE) measures the average of the squared differences between the original and the encrypted image. A lower MSE value indicates that the encrypted image is more similar to the original image, and so a lower MSE value image has a lower level of distortion.
The peak signal-to-noise ratio (PSNR) is a measure of the quality of the encrypted image compared to the original image. It is calculated as the ratio of the maximum possible power of a signal and the power of the distortion caused by the encryption process. A higher PSNR value indicates that the encrypted image is of higher quality and has less distortion compared to the original image as a result of encryption.
To further demonstrate the robustness of the proposed method, the previously mentioned tests were conducted by making slight changes to keys k 1 and k 2 . The mean square error (MSE) and peak signal-to-noise ratio (PSNR) were calculated using Equations (11) and (12):
M S E = 1 m n i = 1 m j = 1 n ( p i , j q i , j ) 2
P S N R = 20 l o g 10 ( M A X p ) M S E
where m and n are the number of rows and columns in the image, p is the original image, and q is the embedded image. The results of these calculations are listed in Table 1, showing two encrypted images c 1 and c 1 as a function of variations in the keys k 1 and k 2 . The obtained numbers confirm the sensitivity of the scheme to small changes in the key. Since k 1 was used for permuting the pixels and k 2 was used for changing the gray levels, the results in the table demonstrate that the scheme showed a good level of confusion–diffusion properties.
Table 1 shows the MSE and PSNR values of two encrypted images that were generated by changing the parameters k 1 and k 2 in the image encryption scheme. Both MSE values are relatively high, indicating that the ciphered images were significantly different from the original image. Moreover, both PSNR values are relatively low, indicating that the level of distortion in the ciphered images was high compared to the original image.
This is a desirable property of a good image encryption scheme since it implies that the ciphered image underwent both confusion and diffusion.

5.1.4. Histogram Analysis

The distribution of color intensities in an image can be visualized through a histogram. The more robust encryption scheme should result in an encrypted image with a more uniform histogram, even if the original image had a weak intensity distribution. The histograms of the original images have unique intensity distributions that characteristically represent the images as shown in Figure 8. In contrast, the histograms of all the encrypted images exhibit a uniform shape, showing no unique features for potential decryption purposes. This indicates that the proposed algorithm can effectively resist statistical attacks.

5.1.5. Correlation Analysis and Chi-Square Test

The security of an image against statistical attacks is often dependent on the correlation between adjacent pixels. A robust encryption scheme should aim to break this correlation in the (V) vertical, (H) horizontal, and (D) diagonal directions. To quantify this, we calculated the correlation coefficient between pairs of adjacent pixels, denoted by r x y . This was done by selecting S random pairs of adjacent pixels and substituting them into Equation (13) to Equation (18):
D ( x ) = 1 S i = 1 S ( x i E ( x ) ) 2
D ( y ) = 1 S i = 1 S ( y i E ( y ) ) 2
E ( x ) = 1 S i = 1 S x i
E ( y ) = 1 S i = 1 S y i
c o v ( x , y ) = 1 S i = 1 S ( x i E ( x ) ) ( y i E ( y ) )
r x y = c o v ( x , y ) D ( x ) D ( y )
where x i and y i are the values of the selected adjacent pixels. The results of this calculation are as shown in Figure 9, which demonstrate that the correlation was strong and compact in the original image, but scattered and weak in the encrypted image. Further results of this analysis for different images are as listed in Table 2, which show that all of the encrypted images had a weak correlation and, hence, showed resilience against statistical attacks.
Another statistical test that can be employed to test the randomness of the generated encrypted image is the nonparametric chi-square test as follows:
χ 2 = i = 0 255 ( v i e i ) 2 e i
e i = M × N 256
where χ 2 represents the statistical chi-square test statistic, v i and e i denote the observed and expected occurrence frequencies of each gray level (0–255), respectively. The lower the resulting value, the more statistically uniform the distribution of pixel values.
The test applies a comparison between the pixel value distribution of the encrypted image and the expected distribution of a random image. In the Table, all calculated chi-square values for the sample encrypted image fell below the theoretical chi-square value of 293 (at a significance level of 0.05). These results confirm that the encryption process altered the image’s statistical properties, making it distinct from the original one.

5.1.6. Information Entropy

The benefit of using entropy as a measure of information security in cryptography is that it provides a quantitative measure of the uncertainty or randomness in the data distribution, which is directly related to the security of the ciphering algorithm. A higher entropy value indicates a more uniform distribution of data and less information to be extracted from it, resulting in a more secure ciphering algorithm. Entropy is a measure of the overall randomness of an image or a system and is as expressed by Equation (19):
H = i = 1 2 n P ( m i ) log 2 P ( m i )
where n represents the number of bits of color intensity, and P ( m i ) is the probability of a color intensity, m i , in the image. The higher the entropy value, the more uniform the distribution of the encrypted image will be, i.e., almost nothing is left as information that can be extracted from the image. Local Shannon entropy, on the other hand, analyzes the randomness of the image at a local scale. The local entropy of nonoverlapping blocks of an image is calculated using Equation (20):
L S E = 1 k i = 1 k H ( I B i )
where k is the number of blocks, and H ( I B i ) is the Shannon entropy of the block. In this paper, the significant values are α = 0.05 , α = 0.01 , α = 0.001 , k = 30, and a block size of 1936 pixels. In cryptography, the higher the entropy of an encrypted image, the more secure it is considered to be, as it contains less information that can be extracted by an attacker. Table 3 confirms that the proposed scheme falls within this critical interval of different image sizes.

5.2. Resistance to Differential Attack

  • Number of Pixels Change Rate (NPCR)
NPCR is a measure of the robustness of an image encryption algorithm. It is defined as the percentage of pixels in a given encrypted image that change when one bit of the original image changes. NPCR is commonly used to evaluate the strength of an encryption algorithm against chosen-plaintext attacks, where an attacker attempts to determine the encryption key by observing how changes to the plaintext affect the encrypted image. The NPCR is given by Equations (21) and (22):
N P C R = i = 1 N [ C i E i ] N × 100
N α * = L + Φ 1 ( α ) L / T L + 1
where N is the total number of pixels in the encrypted image, C i and E i are the i-th pixel values of the original image and the encrypted image, respectively. The numerator of the equation counts the number of pixels that differ between the original and encrypted images, and the denominator normalizes this count to the total number of pixels in the image. The resulting percentage value gives a measure of the NPCR of the encryption algorithm. The higher the NPCR value, the more robust the algorithm will be against chosen plain-text attacks.
  • Unified Average Changing Intensity (UACI)
UACI is a metric used to calculate the difference in the average intensity between two encrypted images, denoted as C and C . The difference is calculated using Equation (23):
U A C I ( C , C ) = i , j | C ( i , j ) C ( i , j ) | T × L
where L is the maximum level of color intensity and T is the total number of pixels in the image. The result of UACI is declared as a “Pass” if it falls within the interval [ U α * , U α * + ].
U α * = μ U Φ 1 ( α / 2 ) σ U U α * + = μ U + Φ 1 ( α / 2 ) σ U
where μ U and σ U are given by Equations (25) and (26):
μ U = L + 2 3 L + 3
σ U = ( L + 2 ) ( L 2 + 2 L + 3 ) 18 ( L + 1 ) 2 L T
In this study, 28 grayscale images of different sizes and intensities were subjected to both the NPCR and UACI tests with α = 0.05 . The results in Table 4 show that all scores represent pass grades, indicating that the proposed system has good confusion and diffusion properties, enabling it to withstand differential attacks while ensuring data security.

5.3. Encryption Speed Analysis

The encryption speed analysis was conducted using a 64-bit double-precision floating-point representation, implemented in MATLAB (R2020a) on a Windows 11 operating system. The experiments were performed on a machine equipped with an Intel® Core™ i7-10510U CPU @ 1.80 GHz 2.30 GHz and 16 GB of RAM. Table 5 presents the obtained results, demonstrating satisfactory encryption speeds for different image dimensions.

6. Discussion and Conclusions

This paper introduces a novel 1D chaotic function that exhibits complete chaotic behavior across a broad range of a single control parameter c [ 2 , 2 ] . This new chaotic function was utilized as the core of a pseudorandom number generator (PRNG) in a proposed image encryption scheme, which was subjected to various tests to determine its robustness. The key space analysis indicated that the proposed scheme had a key space size of 256 bits, which is sufficient to withstand brute force attacks. The sensitivity analysis demonstrated that the scheme is sensitive to any small changes in the key, with acceptable values of mean squared error (MSE) and peak signal-to-noise ratio (PSNR). The histogram analysis revealed a uniform distribution of pixel values, indicating good image quality after encryption. The algorithm also passed the entropy analysis test for significant parameter values of α = { 0.05 , 0.01 , 0.001 } , indicating high randomness in the generated PRNs. Moreover, the proposed encryption scheme was found to be resistant to differential attacks based on the results of tests using 28 grayscale images of various sizes for NPCR and UACI. Overall, the tests demonstrated that the proposed image encryption scheme, which employs a hybrid chaotic map as its PRNG, exhibits good confusion and diffusion properties. These findings contribute to the field of image encryption and chaos-based cryptography by providing a suitable solution for systems that possess a wide range of chaotic behavior in their control parameters. It also opens the door to further explore the potential of the proposed hybrid chaotic map in other cryptographic applications in future work.

Author Contributions

Conceptualization, R.A.E. and E.A.-B.; methodology, A.M.A.; software, S.S.A.; validation, R.A.E. and E.A.-B.; formal analysis, A.M.A.; investigation, S.K.; resources, S.K.; data curation, R.A.E. and E.A.-B.; writing—original draft preparation, A.M.A. and E.A.-B.; writing—review and editing, S.S.A. and S.K.; visualization, S.S.A.; supervision, R.A.E.; project administration, A.M.A. All authors have read and agreed to the published version of the manuscript.

Funding

This research received no external funding.

Institutional Review Board Statement

Not applicable.

Informed Consent Statement

Not applicable.

Data Availability Statement

Not applicable.

Conflicts of Interest

The authors declare no conflict of interest.

References

  1. Wang, C.; Tianqing, Z.; Xiong, P.; Ren, W.; Choo, K.K.R. A privacy preservation method for multiple-source unstructured data in online social networks. Comput. Secur. 2022, 113, 102574. [Google Scholar] [CrossRef]
  2. Sun, Q.; Tewari, A.; Xu, W.; Fritz, M.; Theobalt, C.; Schiele, B. In Proceedings of the European conference on Computer Vision (ECCV). Munich, Germany, 8–14 September 2018; pp. 553–569. [Google Scholar]
  3. Cunha, M.; Mendes, R.; Vilela, J.P. A survey of privacy-preserving mechanisms for heterogeneous data types. Comput. Sci. Rev. 2021, 41, 100403. [Google Scholar] [CrossRef]
  4. Zhao, Y.; Chen, J. A survey on differential privacy for unstructured data content. ACM Comput. Surv. CSUR 2022, 54, 1–28. [Google Scholar] [CrossRef]
  5. Ghadirli, H.M.; Nodehi, A.; Enayatifar, R. An overview of encryption algorithms in color images. Signal Process. 2019, 164, 163–185. [Google Scholar] [CrossRef]
  6. Gagliardelli, L.; Zecchini, L.; Ferretti, L.; Beneventano, D.; Simonini, G.; Bergamaschi, S.; Orsini, M.; Magnotta, L.; Mescoli, E.; Livaldi, A.; et al. A big data platform exploiting auditable tokenization to promote good practices inside local energy communities. Future Gener. Comput. Syst. 2023, 141, 595–610. [Google Scholar] [CrossRef]
  7. Fontaine, C.; Galand, F. A survey of homomorphic encryption for nonspecialists. Eurasip J. Inf. Secur. 2007, 2007, 13801. [Google Scholar] [CrossRef]
  8. Taleby Ahvanooey, M.; Li, Q.; Hou, J.; Rajput, A.R.; Chen, Y. Modern text hiding, text steganalysis, and applications: A comparative analysis. Entropy 2019, 21, 355. [Google Scholar] [CrossRef] [Green Version]
  9. Thakkar, B.; Thankachan, B. A Survey for Comparative Analysis of various Cryptographic Algorithms used to Secure Data on Cloud. Int. J. Eng. Res. Technol 2020, 9, 753–756. [Google Scholar]
  10. Cao, C.; Tang, Y.; Huang, D.; Gan, W.; Zhang, C. IIBE: An improved identity-based encryption algorithm for WSN security. Secur. Commun. Netw. 2021, 2021, 8527068. [Google Scholar] [CrossRef]
  11. Yazdeen, A.A.; Zeebaree, S.R.; Sadeeq, M.M.; Kak, S.F.; Ahmed, O.M.; Zebari, R.R. FPGA implementations for data encryption and decryption via concurrent and parallel computation: A review. Qubahan Acad. J. 2021, 1, 8–16. [Google Scholar] [CrossRef]
  12. You, X.; Wang, C.X.; Huang, J.; Gao, X.; Zhang, Z.; Wang, M.; Huang, Y.; Zhang, C.; Jiang, Y.; Wang, J.; et al. Towards 6G wireless communication networks: Vision, enabling technologies, and new paradigm shifts. Sci. China Inf. Sci. 2021, 64, 110301. [Google Scholar] [CrossRef]
  13. El-Latif, A.A.A.; Ramadoss, J.; Abd-El-Atty, B.; Khalifa, H.S.; Nazarimehr, F. A Novel Chaos-Based Cryptography Algorithm and Its Performance Analysis. Mathematics 2022, 10, 2434. [Google Scholar] [CrossRef]
  14. Bahbouh, N.; Basahel, A.; Sendra, S.; Sen, A.; Ahmed, A. Tokens Shuffling Approach for Privacy, Security, and Reliability in IoHT under a Pandemic. Appl. Sci. 2023, 13, 114. [Google Scholar] [CrossRef]
  15. Pourasad, Y.; Ranjbarzadeh, R.; Mardani, A. A new algorithm for digital image encryption based on chaos theory. Entropy 2021, 23, 341. [Google Scholar] [CrossRef]
  16. Zhang, W.; Fu, C.; Zheng, Y.; Zhang, F.; Zhao, Y.; Sham, C.W. HSNet: A hybrid semantic network for polyp segmentation. Comput. Biol. Med. 2022, 150, 106173. [Google Scholar] [CrossRef]
  17. Kumar, S.; Srivastava, P.K.; Srivastava, G.K.; Singhal, P.; Singh, D.; Goyal, D. Chaos based image encryption security in cloud computing. J. Discret. Math. Sci. Cryptogr. 2022, 25, 1041–1051. [Google Scholar] [CrossRef]
  18. Pour, N.R.; Yaghoobi, M. A new method in encryption of gray scale images using chaos game representation. Multimed. Tools Appl. 2022, 81, 29653–29672. [Google Scholar] [CrossRef]
  19. Salleh, M.; Ibrahim, S.; Isnin, I.F. In Proceedings of the 2003 International Symposium on Circuits and Systems, ISCAS’03. Bangkok, Thailand, 25–28 May 2003; Volume 2, p. II. [Google Scholar]
  20. Boriga, R.E.; Dăscălescu, A.C.; Diaconu, A.V. A new fast image encryption scheme based on 2D chaotic maps. IAENG Int. J. Comput. Sci. 2014, 41, 249–258. [Google Scholar]
  21. Akhshani, A.; Behnia, S.; Akhavan, A.; Hassan, H.A.; Hassan, Z. A novel scheme for image encryption based on 2D piecewise chaotic maps. Opt. Commun. 2010, 283, 3259–3266. [Google Scholar] [CrossRef]
  22. Zhu, L.; Jiang, D.; Ni, J.; Wang, X.; Rong, X.; Ahmad, M.; Chen, Y. A stable meaningful image encryption scheme using the newly-designed 2D discrete fractional-order chaotic map and Bayesian compressive sensing. Signal Process. 2022, 195, 108489. [Google Scholar] [CrossRef]
  23. Elmanfaloty, R.A.; Abou-Bakr, E. Random property enhancement of a 1D chaotic PRNG with finite precision implementation. Chaos, Solitons Fractals 2019, 118, 134–144. [Google Scholar] [CrossRef]
  24. AbdElHaleem, S.H.; Abd-El-Hafiz, S.K.; Radwan, A.G. A generalized framework for elliptic curves based PRNG and its utilization in image encryption. Sci. Rep. 2022, 12, 13278. [Google Scholar] [CrossRef] [PubMed]
  25. Elmanfaloty, R.A.; Abou-Bakr, E. An image encryption scheme using a 1D chaotic double section skew tent map. Complexity 2020, 2020, 7647421. [Google Scholar] [CrossRef]
  26. Elmanfaloty, R.A.; Alnajim, A.M.; Abou-Bakr, E. A finite precision implementation of an image encryption scheme based on DNA encoding and binarized chaotic cores. IEEE Access 2021, 9, 136905–136916. [Google Scholar] [CrossRef]
  27. Khairullah, M.K.; Alkahtani, A.A.; Bin Baharuddin, M.Z.; Al-Jubari, A.M. Designing 1D chaotic maps for fast chaotic image encryption. Electronics 2021, 10, 2116. [Google Scholar] [CrossRef]
  28. Moysis, L.; Tutueva, A.; Volos, C.; Butusov, D.; Munoz-Pacheco, J.M.; Nistazakis, H. A two-parameter modified logistic map and its application to random bit generation. Symmetry 2020, 12, 829. [Google Scholar] [CrossRef]
  29. Moysis, L.; Volos, C.; Jafari, S.; Munoz-Pacheco, J.M.; Kengne, J.; Rajagopal, K.; Stouboulos, I. Modification of the logistic map using fuzzy numbers with application to pseudorandom number generation and image encryption. Entropy 2020, 22, 474. [Google Scholar] [CrossRef] [Green Version]
  30. Sprott, J.C. Chaos and Time-Series Analysis; Oxford University Press: New York, NY, USA, 2003; Volume 69. [Google Scholar]
  31. The USC-SIPI Image Database, University of Southern California. Available online: https://sipi.usc.edu/database/database.php (accessed on 16 April 2023).
Figure 1. (a) Phase space of the logistic map. (b) Phase space of the tent map. (c) Phase space of the sine map. (d) Bifurcation diagrams of the logistic map. (e) Bifurcation diagram of the tent map. (f) Bifurcation diagram of the sine map.
Applsci 13 07768 g001
Figure 2. Phase space for the map described in Equation (4): (a) for c = 0 ; (b) for c = 0.5 ; (c) for c = 1 ; and (d) for c = 1.5 .
Applsci 13 07768 g002
Figure 3. Sensitivity to small perturbations for iterates of the map described in Equation (4) for two state variables x and y, (a) when x o = 0.01 and (b) y o = x o + 10 6 .
Applsci 13 07768 g003
Figure 4. Bifurcation diagram of the function given by Equation (4) showing full chaotic behavior in the range of 0 c | 2 | .
Applsci 13 07768 g004
Figure 5. Examples of the bifurcation diagram of (4) depending on r when (a) c = 0.1 , (b) c = 1.8 .
Applsci 13 07768 g005
Figure 6. Lyapunov exponent of the function in (4) showing positive values in the range of 2 c 0 .
Applsci 13 07768 g006
Figure 7. Sensitivity of the encryption algorithm to small change in the key K. (a) Original high-resolution image 3264 × 4841. (b) Encrypted image I 1 obtained using K 1 . (c) Encrypted image I 2 obtained using K 2 = K 1 + 10 8 in one ot its control parameters c. (d) The absolute pixel-by-pixel difference between I 1 and I 2 , which confirms the production of two distinct encrypted images.
Applsci 13 07768 g007
Figure 8. Comparison of encrypted images with original images, their histograms, encrypted versions, and histograms of encrypted images (displayed vertically) is shown, with each subfigure labeled: (ad) original image; (eh) histogram; (il) encrypted image; (mp) histogram of encrypted image.
Applsci 13 07768 g008
Figure 9. Correlation analysis of 3000 adjacent pixels in an original and encrypted image: (a) the original image; (b) its diagonal correlation; (c) its horizontal correlation; (d) its vertical correlation; (e) the encrypted image; (f) its diagonal correlation; (g) its horizontal correlation; and (h) its vertical correlation.
Applsci 13 07768 g009
Table 1. Mean square error (MSE) and peak signal-to-noise ratio (PSNR) of two encrypted images.
Changed ParameterMSEPSNR (dB)
k 1 10.872 × 10 3 7.767
k 2 10.921 × 10 3 7.748
Table 2. Vertical, horizontal, and diagonal correlation of some images and their encrypted versions. In addition to the chi-square analysis.
Original ImageEncrypted Image
File NameSizeV-CorrelationH-CorrelationD-Correlation χ 2 V-CorrelationH-CorrelationD-Correlation χ 2
bird.png2625 × 22500.98760.97360.970637,036 × 10 2 −6.46 ×  10 4 0.0188−0.0061271.7370
lion.png2362 × 30470.9710.97640.95742,846 × 10 4 0.0189−0.01640.0198249.2168
pyramids.png4755 × 30900.98940.99080.984162,090 × 10 3 −0.0033−0.0380.0143230.8222
sphinx.png1704 × 22720.97930.98390.973355,280 × 10 2 0.02530.01260.0058235.8652
Table 3. Global and local Shannon entropy of the proposed algorithm.
Global EntropyLocal Shannon Entropy
File NameSize α = 0.05 ̲ α = 0.01 ̲ α = 0.001 ̲
h left l * = 7 . 901901305 h left l * = 7 . 901722822 h left l * = 7 . 901515698
Original ImageEncrypted Image h right l * = 7 . 903037329 h right l * = 7 . 903215812 h right l * = 7 . 903422936
bird 2625 × 2250 7.5593831657.9999668127.9026732657.9021005417.902336555
lion 2362 × 3047 4.8689769647.9999750187.9020848267.9026001087.902215068
pyramids 4755 × 3090 6.8401637017.9999886697.9023172447.902942247.902561135
sphinx 1704 × 2272 6.9511011857.9999560647.9028384467.9018519577.902802677
Table 4. NPCR and UACI score results for 28 images with different sizes [31].
NPCR Test ResultUACI Test Result
File NameScore%StatusRef. [26]Ref. [25]Score %StatusRef. [26]Ref. [25]
Dimention 256 × 256 N α * 99.5527 % U α * , U α * + = ( 33.2255 % , 33.7016 % )
5.1.0999.6094pass99.58899.594133.4659pass33.568833.4722
5.1.1099.5773pass99.668999.572833.4735pass33.522233.6179
5.1.1199.585pass99.574399.574333.5218pass33.489433.5225
5.1.1299.5789pass99.627799.575833.3434pass33.497533.3374
5.1.1399.617pass99.571299.645933.5078pass33.546533.5497
5.1.1499.5895pass99.569799.617033.2638pass33.571133.5752
Dimention 512 × 512 N α * 99.581 % U α * , U α * + = ( 33.3445 % , 33.5826 % )
5.2.0899.5956pass99.599899.591833.429pass33.544633.4202
5.2.0999.5895pass99.608699.604033.4564pass33.497633.3967
5.2.1099.6014pass99.604899.598733.411pass33.378533.5028
7.1.0199.6052pass99.593499.601433.4872pass33.488733.4886
7.1.0299.6193pass99.609499.605633.5014pass33.507333.4162
7.1.0399.612pass99.602599.597533.4781pass33.461233.5348
7.1.0499.6136pass99.618999.600633.4653pass33.524333.4449
7.1.0599.6357pass99.609499.610933.3931pass33.480433.4587
7.1.0699.6033pass99.610599.611333.4627pass33.429233.4813
7.1.0799.6086pass99.607899.596833.3644pass33.459233.4569
7.1.0899.6147pass99.605299.611733.4791pass33.466733.4746
7.1.0999.6204pass99.60499.615133.5324pass33.478133.4900
boat.51299.6067pass99.636599.600933.4882pass33.468333.3759
gray21.51299.5876pass99.617899.593733.4121pass33.54533.4828
File NameScore%StatusRef. [26]Ref. [25]Score %StatusRef. [26]Ref. [25]
ruler.51299.6239pass99.623199.602133.4651pass33.440733.4163
Dimention 1024 × 1024 N α * 99.5952 % U α * , U α * + = ( 33.4040 % , 33.5231 % )
5.3.0199.6078pass99.606399.607833.4627pass33.472533.4706
5.3.0299.6084pass99.60299.600933.483pass33.498333.4801
7.2.0199.5984pass99.607399.601033.4672pass33.472333.4664
Dimention 1704 × 1704 N α * 99.602 % U α * , U α * + = ( 33.4326 % , 33.4945 % )
sphinx99.6099pass--33.4517pass--
Dimention 2362 × 2362 N α * 99.604 % U α * , U α * + = ( 33.4408 % , 33.4863 % )
lion99.6079pass--33.4658pass--
Dimention 2625 × 2625 N α * 99.6034 % U α * , U α * + = ( 33.4385 % , 33.4886 % )
bird99.6108pass--33.4701pass--
Dimention 4755 × 4755 N α * 99.6056 % U α * , U α * + = ( 33.4476 % , 33.4794 % )
pyramids99.6081pass--33.4597pass--
Table 5. Encryption speed analysis for various image dimensions.
File NameDimensionEncryption Speed (s)
5.1.09.tiff256 × 2560.4648439
7.1.01.tiff512 × 5121.6287242
5.3.01.tiff1024 × 10246.9461746
sphinx.tiff1704 × 227222.4399294
bird.tiff2625 × 225038.3284587
lion.tiff2362 × 304746.8042111
pyramids.tiff4755 × 3090103.5472705
Disclaimer/Publisher’s Note: The statements, opinions and data contained in all publications are solely those of the individual author(s) and contributor(s) and not of MDPI and/or the editor(s). MDPI and/or the editor(s) disclaim responsibility for any injury to people or property resulting from any ideas, methods, instructions or products referred to in the content.

