Systematic Review

Ultrasound Elastography for the Differentiation of Benign and Malignant Solid Renal Masses: A Systematic Review and Meta-Analysis

1
Postgraduation School in Radiodiagnostics, Università degli Studi di Milano, Via Festa del Perdono 7, 20122 Milano, Italy
2
Service of Radiology, Imaging Institute of Southern Switzerland (IIMSI), Ente Ospedaliero Cantonale (EOC), Via Tesserete 46, 6900 Lugano, Switzerland
3
Radiology Department, Fatebenefratelli Hospital, ASST Fatebenefratelli Sacco, Piazza Principessa Clotilde 3, 20121 Milano, Italy
4
Department of Biomedical, Surgical and Dental Sciences, Università degli Studi di Milano, Via della Commenda 10, 20122 Milano, Italy
5
Radiology Department, Centro Diagnostico Italiano, Via Simone Saint Bon 20, 20147 Milano, Italy
6
Radiology Department, Policlinico di Milano Ospedale Maggiore, Fondazione IRCCS Ca’ Granda, Via Francesco Sforza 35, 20122 Milano, Italy
*
Author to whom correspondence should be addressed.
These authors contributed equally to this study and share first authorship.
Appl. Sci. 2023, 13(13), 7767; https://doi.org/10.3390/app13137767
Submission received: 21 May 2023 / Revised: 27 June 2023 / Accepted: 29 June 2023 / Published: 30 June 2023

Abstract

:

Featured Application

This systematic review can serve as an educational resource for clinicians, radiologists, and other healthcare professionals. It summarizes the current state of evidence, highlights key issues, and provides an overview of the strengths and limitations of ultrasound elastography for renal masses. This promotes awareness and understanding of the technique in the medical community.

Abstract

The incidental finding of small renal masses in CT and MRI examinations can present a diagnostic challenge. Renal cell carcinoma (RCC) and angiomyolipoma (AML) are the most common incidental malignant and benign renal lesions but may present with similar US features. US elastography is a non-invasive technique that can assess tissue elasticity, has shown promising results in many clinical settings, and could be able to differentiate between benign and malignant renal lesions based on tissue stiffness. The purpose of this article is to systematically review the applications of US elastography in the characterization of solid renal masses and to derive and compare the summary estimates of different stiffness values across different lesion subtypes. In December 2022, a systematic search was carried out on the MEDLINE (PubMed) and EMBASE databases to retrieve studies on the application of US elastography in the characterization of solid renal masses. After article selection by three researchers, 14 studies entered qualitative synthesis. A total of 1190 patients were included, and the elastography data of 959 lesions were examined: 317/959 (33%) benign and 642/959 (67%) malignant. Among the malignancies, 590 (91%) were RCC, whereas, among the 317 benign lesions, 244 (77%) were AML. All lesions were classified using a histopathological (biopsy or operative specimen) or imaging (US follow-up/CT/MRI) reference standard. After data extraction and methodological quality evaluation, quantitative synthesis was performed on 12 studies, 4 using strain elastography (SE) and 8 using shear wave elastography (SWE), with single- and double-arm random-effects meta-analyses. Lesion stiffness measured with SE was available in four studies, with an RCC strain ratio higher than the AML strain ratio both in an indirect comparison (Cochran’s Q test p = 0.014) and in a direct comparison (p = 0.021). Conversely, the SWE measurements of RCC and AML stiffness did not significantly differ either at an indirect comparison (p = 0.055) or direct comparison (p = 0.114).

1. Introduction

In recent decades, the proliferation of abdominal imaging studies has led to an increase in the detection of incidental renal masses, which are now estimated to occur in over 50% of patients over 50 years of age undergoing abdominal imaging with US, CT, or MRI [1]. These findings represent a diagnostic challenge, as renal tumors may remain asymptomatic for a long time, and late diagnosis is associated with a poor prognosis [2].
US is the ideal method for early diagnosis due to its safety and wide availability [3]; however, it presents several limitations [4]. For example, a B-mode ultrasound can easily diagnose simple cysts, but it is not suitable for the study of complex cysts and solid masses [5]. This constitutes a crucial issue, as over 80% of solid renal masses are malignant, whereas benign lesions are mostly represented by oncocytomas (OCY) and angiomyolipomas (AML) [6]. The latter is the most frequent benign renal tumor and typically presents as a well-defined, homogeneous hyperechoic renal lesion; however, both fat-poor AML and hyperechoic renal cell carcinoma (RCC) have been described [7,8], further complicating the work-up of incidental renal masses [6,9].
In routine practice, after detection in US, almost all renal masses undergo further examination (MRI, CT, contrast-enhanced US), although some authors suggest that small, hyperechoic lesions (<1 cm) in patients without risk factors may be suitable for a short-term follow-up with US [8]. Therefore, a complementary US-based technique that is able to distinguish between benign and malignant lesions could be particularly helpful, especially in those situations in which contrast-enhanced imaging modalities are contraindicated, not immediately available, or inconclusive due to the small size of the lesion [5].
One option is represented by US elastography: a non-invasive imaging technique for assessing the elasticity of biological tissues. Excluding Fibroscan®—which is used exclusively in the hepatological field—there are two US elastography techniques [10]. Strain elastography (SE) requires the active compression of the tissue by the operator and expresses elasticity in terms of the dimensionless strain ratio between two ROIs [11]. Shear wave elastography (SWE)—the most recent method and nowadays the most prevalent one in clinical practice [11]—expresses elasticity in terms of the shear wave velocity [m/s] or Young’s modulus [kPa].
However, while US elastography is widely employed in current practice, its application in nephrology presents several challenges due to technical and methodological issues [12]. Most studies have been conducted in patients with chronic kidney disease (CKD), assessing the relation between kidney elasticity, fibrotic changes, and the glomerular filtration rate, whereas the role of US elastography in the diagnosis of focal lesions to guide a referral to further imaging or follow-up has been less extensively investigated.
We, therefore, aimed to systematically review the applications of US elastography in the characterization of solid renal masses to derive and compare the summary estimates of different stiffness values among different subtypes of these lesions.

2. Methods

No ethics committee approval was required for this systematic review, whose protocol was not preliminarily registered and which was reported according to the Preferred Reporting Items for Systematic Reviews and Meta-Analysis (PRISMA) guidelines [13].

2.1. Article Search and Selection

A systematic search was conducted on the MEDLINE (PubMed) and EMBASE databases for studies applying US elastography to the estimation of elasticity in the solid lesions of the kidney. The search was limited to studies written in English, published either on paper or online in peer-reviewed journals, with an available abstract; considering that the application of US elastography for kidney masses outside small-scale technical and pilot studies is extremely recent, the search was limited to studies published after 1 January 2009. The search string for MEDLINE was:
((renal) OR (kidney)) AND ((stiffness) OR (elasticity) OR (elasto*) OR (ARFI) OR (“acoustic radiation force impulse”)) AND ((mass*) OR (neoplasm*) OR (tumor*) OR (lesion*)).
The systematic search was first carried out on 1 December 2022 and was last updated on 15 May 2023.
Articles were considered eligible for inclusion if they reported the stiffness values of solid lesions in the kidney—derived from US elastography—and a confirmation of the benign or malignant nature of these lesions, either by histopathology or follow-up, was conducted. Pre-clinical studies, technical notes, case reports, narrative, and systematic reviews were excluded.
After duplicate removal and data import on an Excel spreadsheet, two researchers (A.C. and M.C., respectively, with 5 and 2 years of experience in conducting systematic reviews) independently performed the initial screening of the retrieved articles based on the titles and abstracts only; then, a second selection round was performed on the full texts. Disagreements on article selection were settled by consensus. The references of the included articles and excluded reviews were manually checked to verify the presence of further eligible studies.

2.2. Data Extraction and Quality Appraisal

For each included article, data extraction was performed by the two aforementioned researchers and by a third researcher (E.S., with 2 years of experience in US elastography). Data extracted included: total population enrolled in each study, number of patients excluded for technical reasons, number of lesions sampled, type of reference standard (US/CT/MRI), number of lesions proven by biopsy, surgical pathology, and imaging, number of benign and malignant lesions, number of lesions for each type, mean and standard deviation of elasticity values for each type of lesion.
When stiffness measurements were expressed in kPa, they were recalculated in m/s according to the formula E = 3ρc2 [10]. When data were presented with subgroup means and standard deviations, the overall mean was recalculated according to the mean and standard deviation decomposition method.
Methodological quality appraisal for all articles included in qualitative synthesis, according to an adapted version of the Newcastle-Ottawa scale [14], was carried out by the three researchers performing data extraction.

2.3. Statistical Analysis

All analyses were performed by separately considering studies with stiffness values expressed as strain ratios and studies with stiffness values expressed in kPa and m/s, the former being recalculated in m/s as described above.
Considering data availability and distribution, the quantitative analysis focused on US elastography characteristics of RCC and AML, which were the only two groups of lesions with sufficient available data to allow meta-analytic integration. Single-arm random-effects meta-analyses with the Paule-Mandel method for the estimation of between-study variance [15,16] were conducted to obtain summary estimates of lesion stiffness in the two different subtypes of solid kidney lesions and their corresponding 95% confidence intervals (CI), summary estimates of the two subtypes being compared with the Cochran’s Q test. Then, random-effects meta-analyses of continuous outcomes (again calculating between-study variance with the Paule-Mandel method) were performed to directly compare summary estimates of RCC and AML lesion stiffness in studies including both kinds of lesions, calculating Hedges’s g standardized mean differences (SMDs) with their corresponding 95% CIs. Heterogeneity was assessed with Cochran’s Q test, whereas the τ2 and the I2 statistics were used to quantify inconsistency among studies, with I2 values > 70% considered to represent significant heterogeneity. The possibility of performing univariable and multivariable meta-regression considering technical, clinical, and pathophysiological variables was limited by the scarcity and sparsity of data: mean patients’ age and mean lesion size were identified as the only two covariates with sufficient information to allow model convergence. All analyses were conducted with the “meta” module in STATA (version MP 17.1, StataCorp).

3. Results

3.1. Qualitative Synthesis

As depicted in the PRISMA flowchart (Figure 1), 14 studies [17,18,19,20,21,22,23,24,25,26,27,28,29,30] entered qualitative synthesis, involving a total of 1190 patients (Table 1).
All studies were observational, with 13/14 (93%) having a prospective design, whereas only the study by Sun et al. [28] had a retrospective design. Study size varied widely, from 15 patients with 15 masses in the study by Clevert et al. [20] to 209 patients with 197 masses in the study by Lu et al. [26]. Among these 1190 patients, 234 (20%) were excluded for technical reasons (cystic components, inability to hold breath, obesity, etc.), lacking a reference standard, or inconclusive examinations at imaging. Thus, the results of US elastography were available for 976 patients, with a mean age ranging from 47 years in the study by Sun et al. [28] to 64 years in the study by Thaiss et al. [17]. When multiple lesions were present, a single mass (usually the largest and best visualized) was examined with the exception of Sun et al. [28], in which two patients had two renal masses, and Sagreiya et al. [30], in which one patient had two renal masses. Overall, a total of 959 lesions were examined, of which 317/959 (33%) were benign and 642/959 (67%) malignant. Among the 642 malignancies, 590 (91%) were RCC, whereas among 317 benign lesions, 244 (77%) were AML. All lesions were classified using a histopathological (biopsy or operative specimen) or imaging (US follow-up/CT/MRI) reference standard. Concerning the US elastography technique, 4 studies used SE and 10 SWE (Table 1, Table 2, Table 3 and Table 4).

3.2. Quantitative Synthesis

According to the criteria defined in the Section 2, only 12 studies entered quantitative synthesis [17,18,19,20,21,22,23,24,25,26,27,29]. Four studies [23,24,27,29] expressed the results as strain ratios for a total of 301 patients with 254 lesions, of which 138/254 (54%) were RCC and 77/254 (30%) were AML. Eight studies [17,18,19,20,21,22,25,26] used SWE and expressed the results in [m/s] or [kPa] for a total of 889 patients with 705 lesions, of which 452/705 (64%) were RCC and 157/705 (22%) were AML. As detailed in Table 5, the methodological quality of the included study was generally high (average score 6.3/8), with only one study having an overall score lower than 6.

3.2.1. Strain Elastography

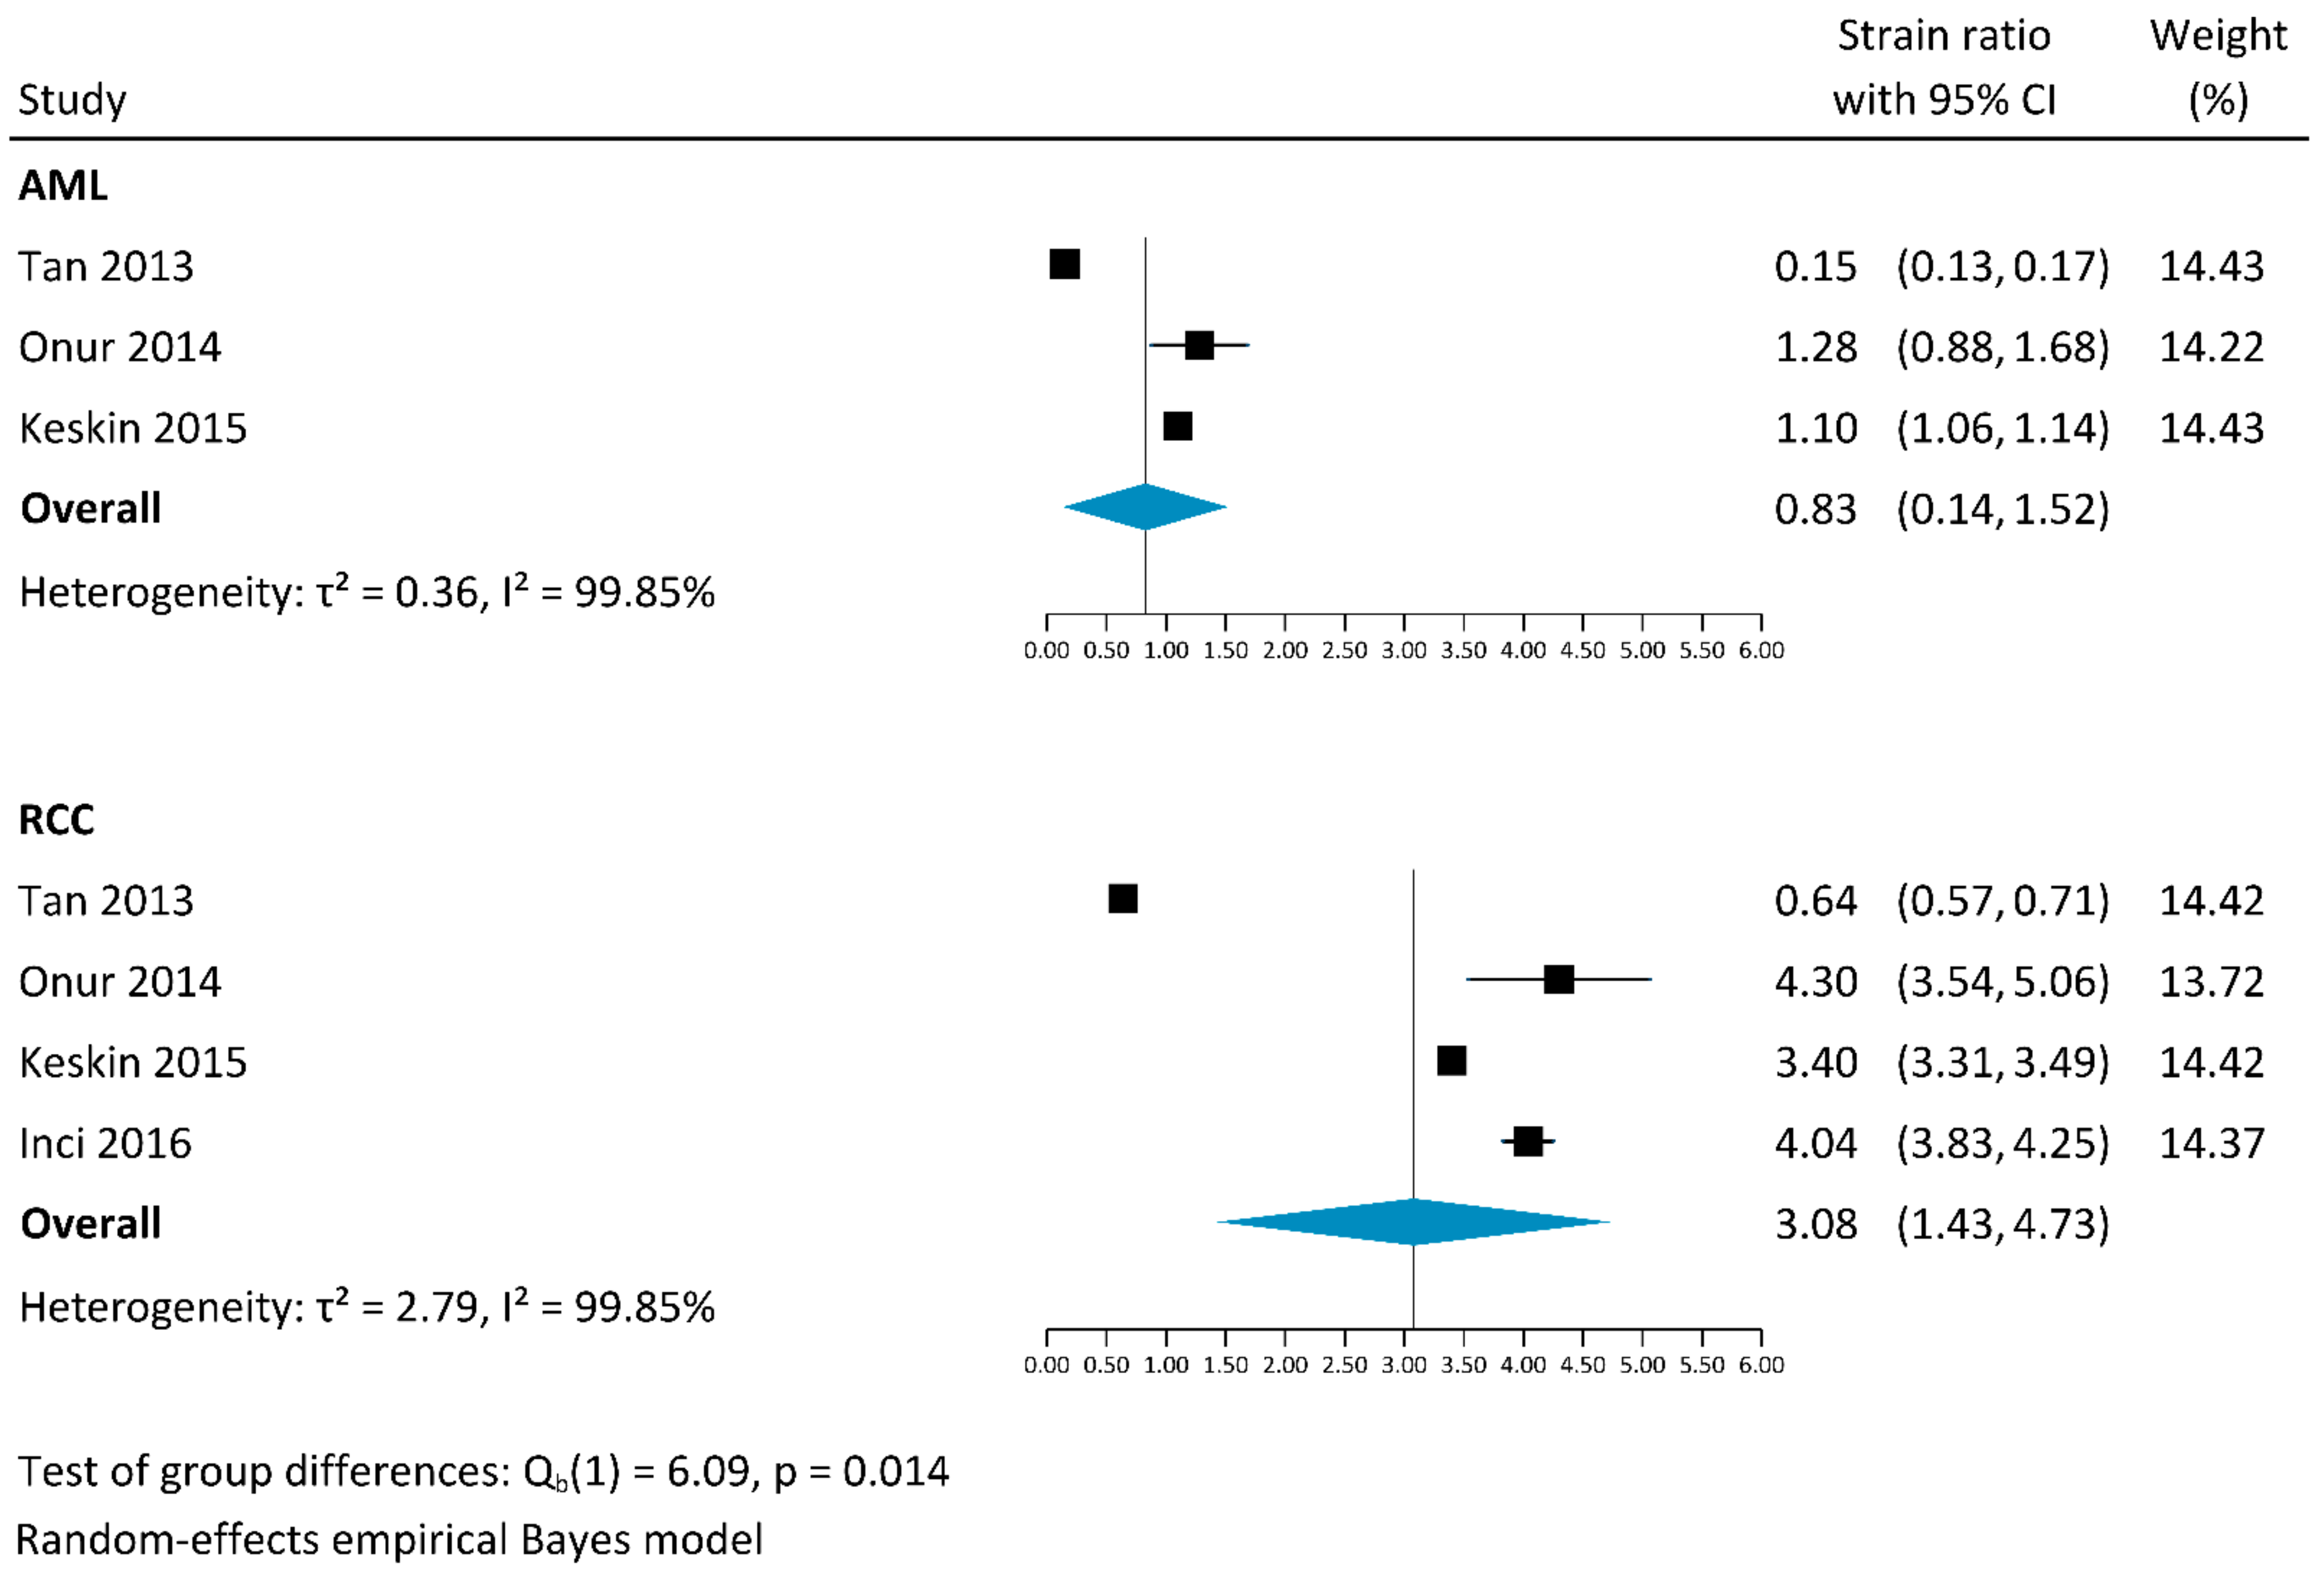
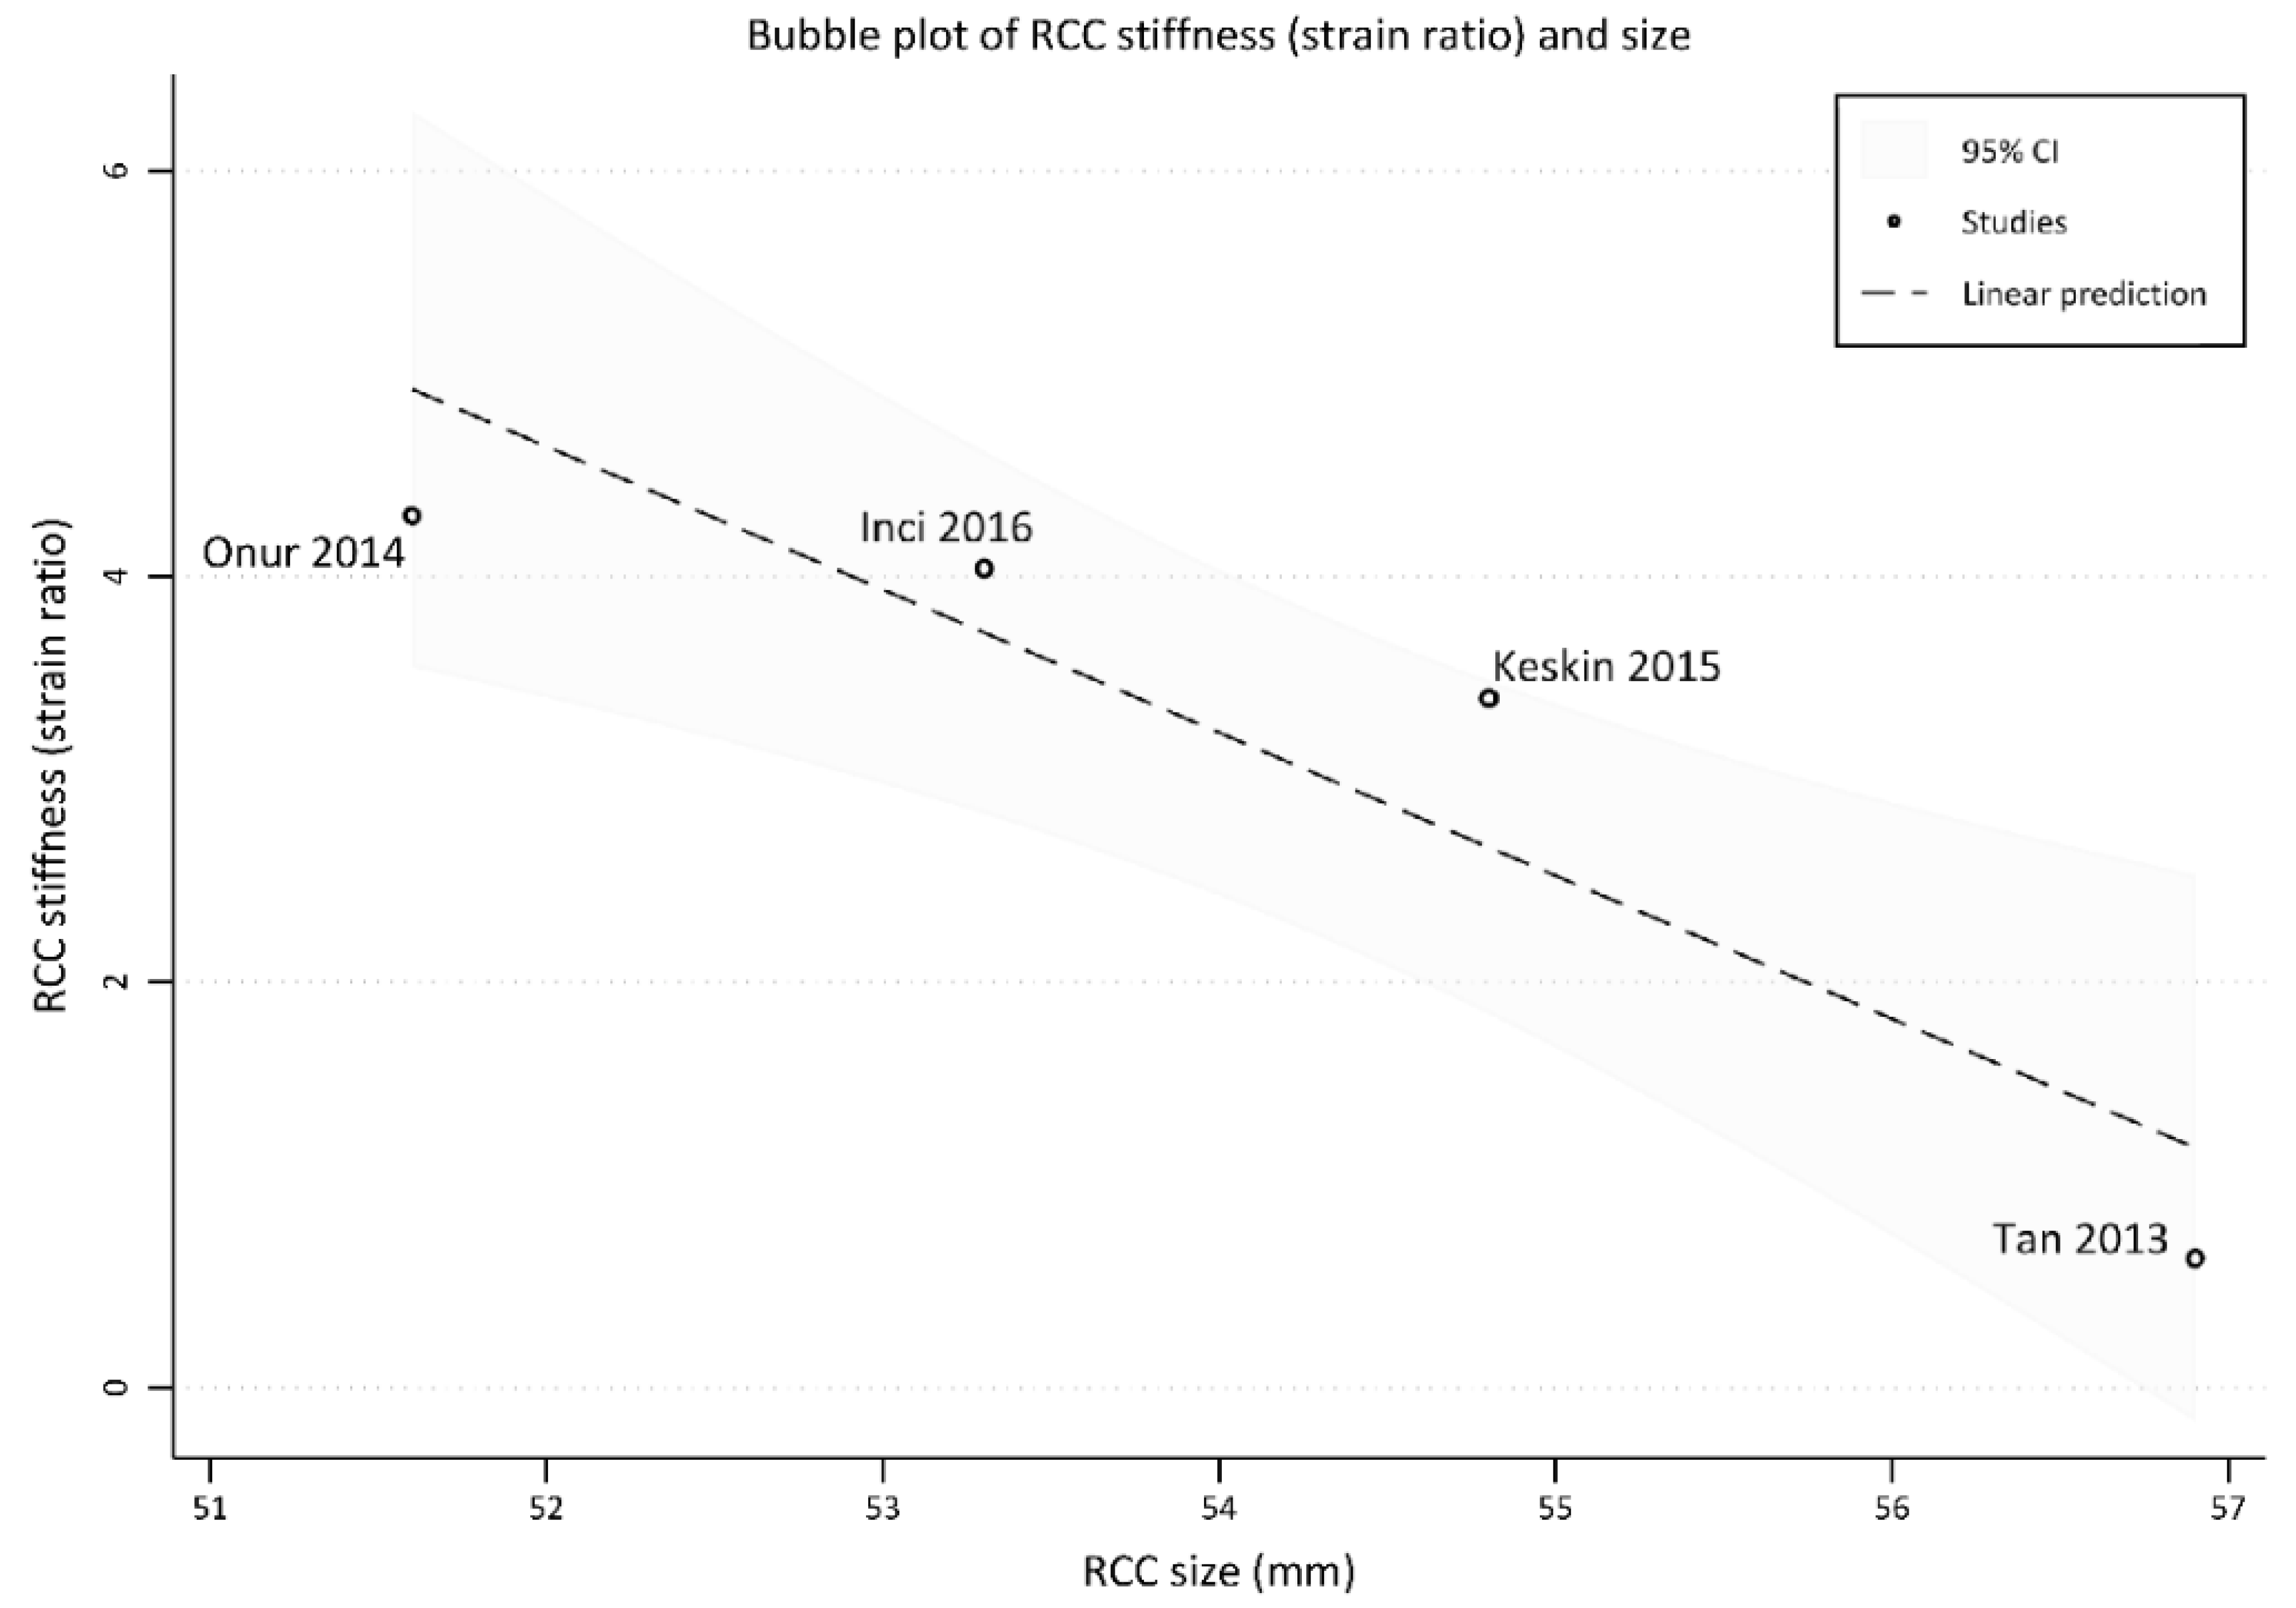
As detailed in the forest plot (Figure 2), RCC stiffness measured with SE was available in 4 studies, with a 3.08 summary strain ratio (95% CI 1.43–4.73, τ2 = 2.79, I2 = 99.85%). In an indirect comparison, this summary estimate was significantly higher (Cochran’s Q test p = 0.014) than the 0.83 summary strain ratio of AML (95% CI 0.14–1.52, τ2 = 0.36, I2 = 99.85%), which was obtained from 3 studies. At meta-regression, AML strain ratios were not influenced by patients’ age (β coefficient 0.28, 95% CI −0.08–0.64, p = 0.132) nor by the lesion size (β coefficient 0.12, 95% CI −0.07–0.31, p = 0.221), whereas RCC strain ratios were not significantly influenced by patients’ age (β coefficient 0.40, 95% CI −0.11–0.92, p = 0.121) but were significantly lower (Figure 3) for large lesions (β coefficient −0.71, 95% CI −1.12–0.29, p = 0.001). These results were confirmed in a direct comparison (Figure 4), where strain ratios of RCC were shown to be significantly higher (p = 0.021) than those of AML (summary SMD 5.07, 95% CI 0.74–9.40), with extremely high heterogeneity (τ2 = 14.29, I2 = 98.07%). At meta-regression, none of the analyzed covariates (patient’s age, RCC lesion size, AML lesion size) had any significant influence on SMDs (p ≥ 0.417, residual heterogeneity I2 ≥ 97.25%).

3.2.2. Shear-Wave Elastography

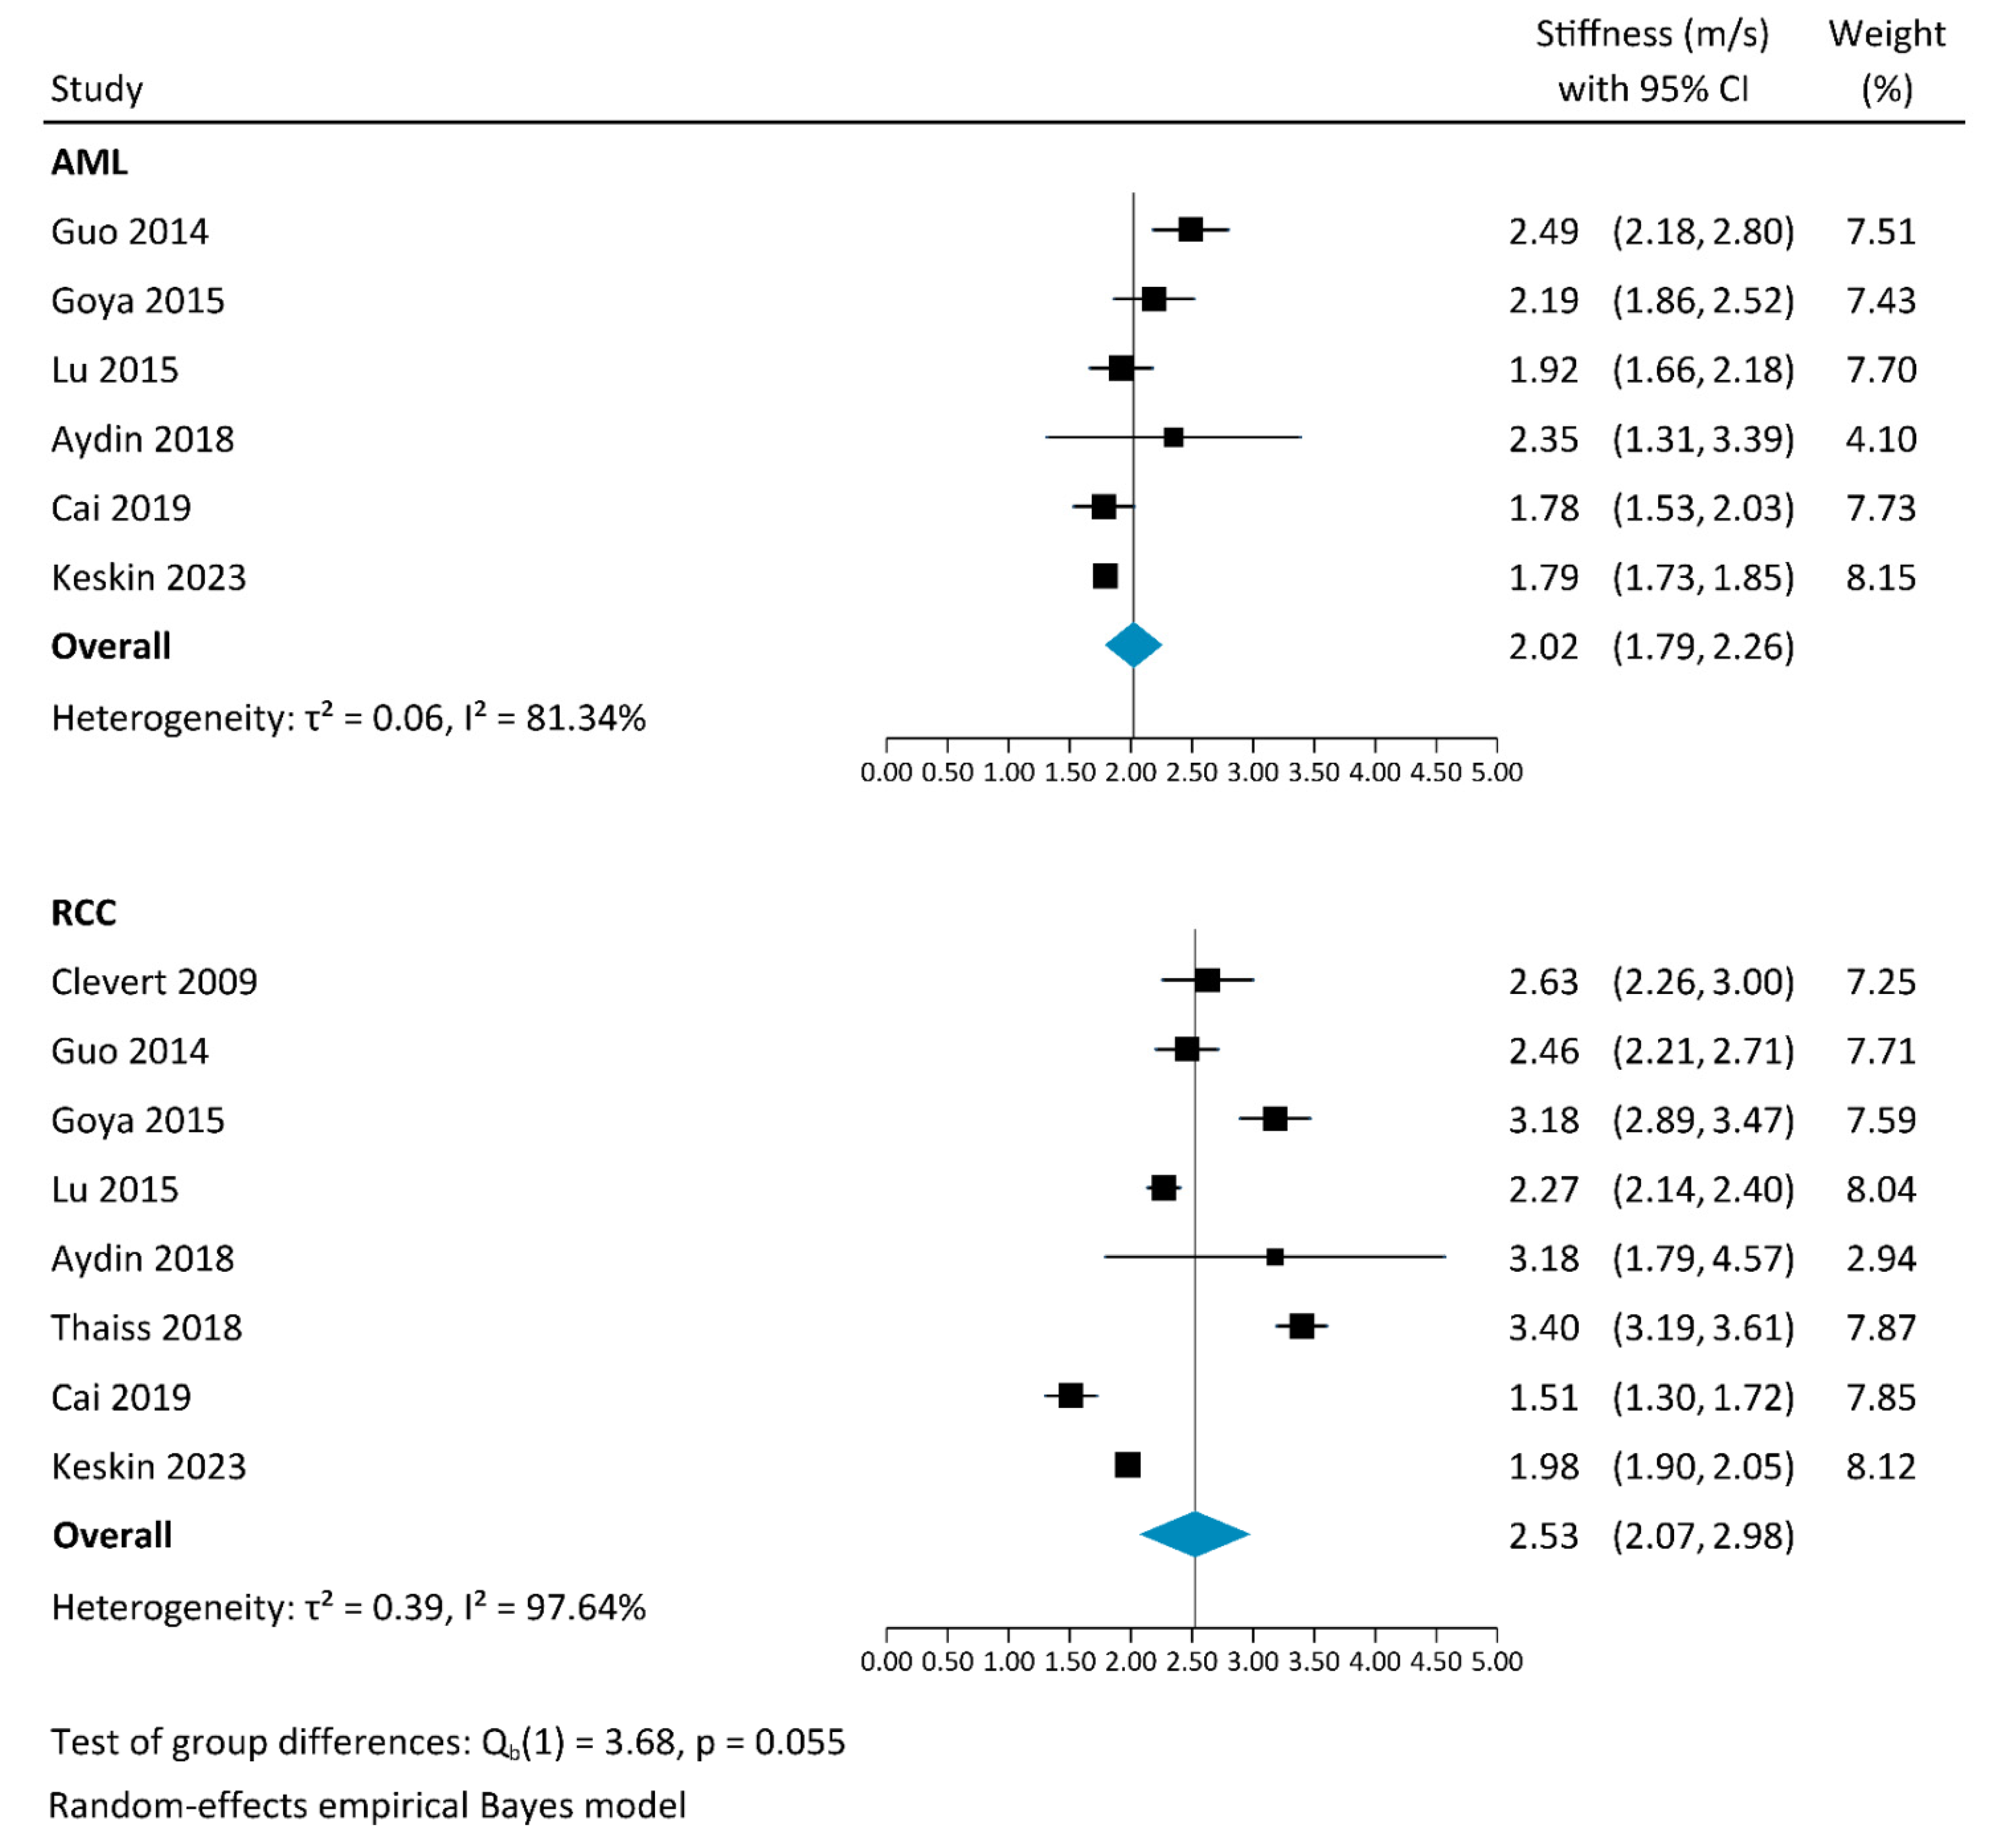
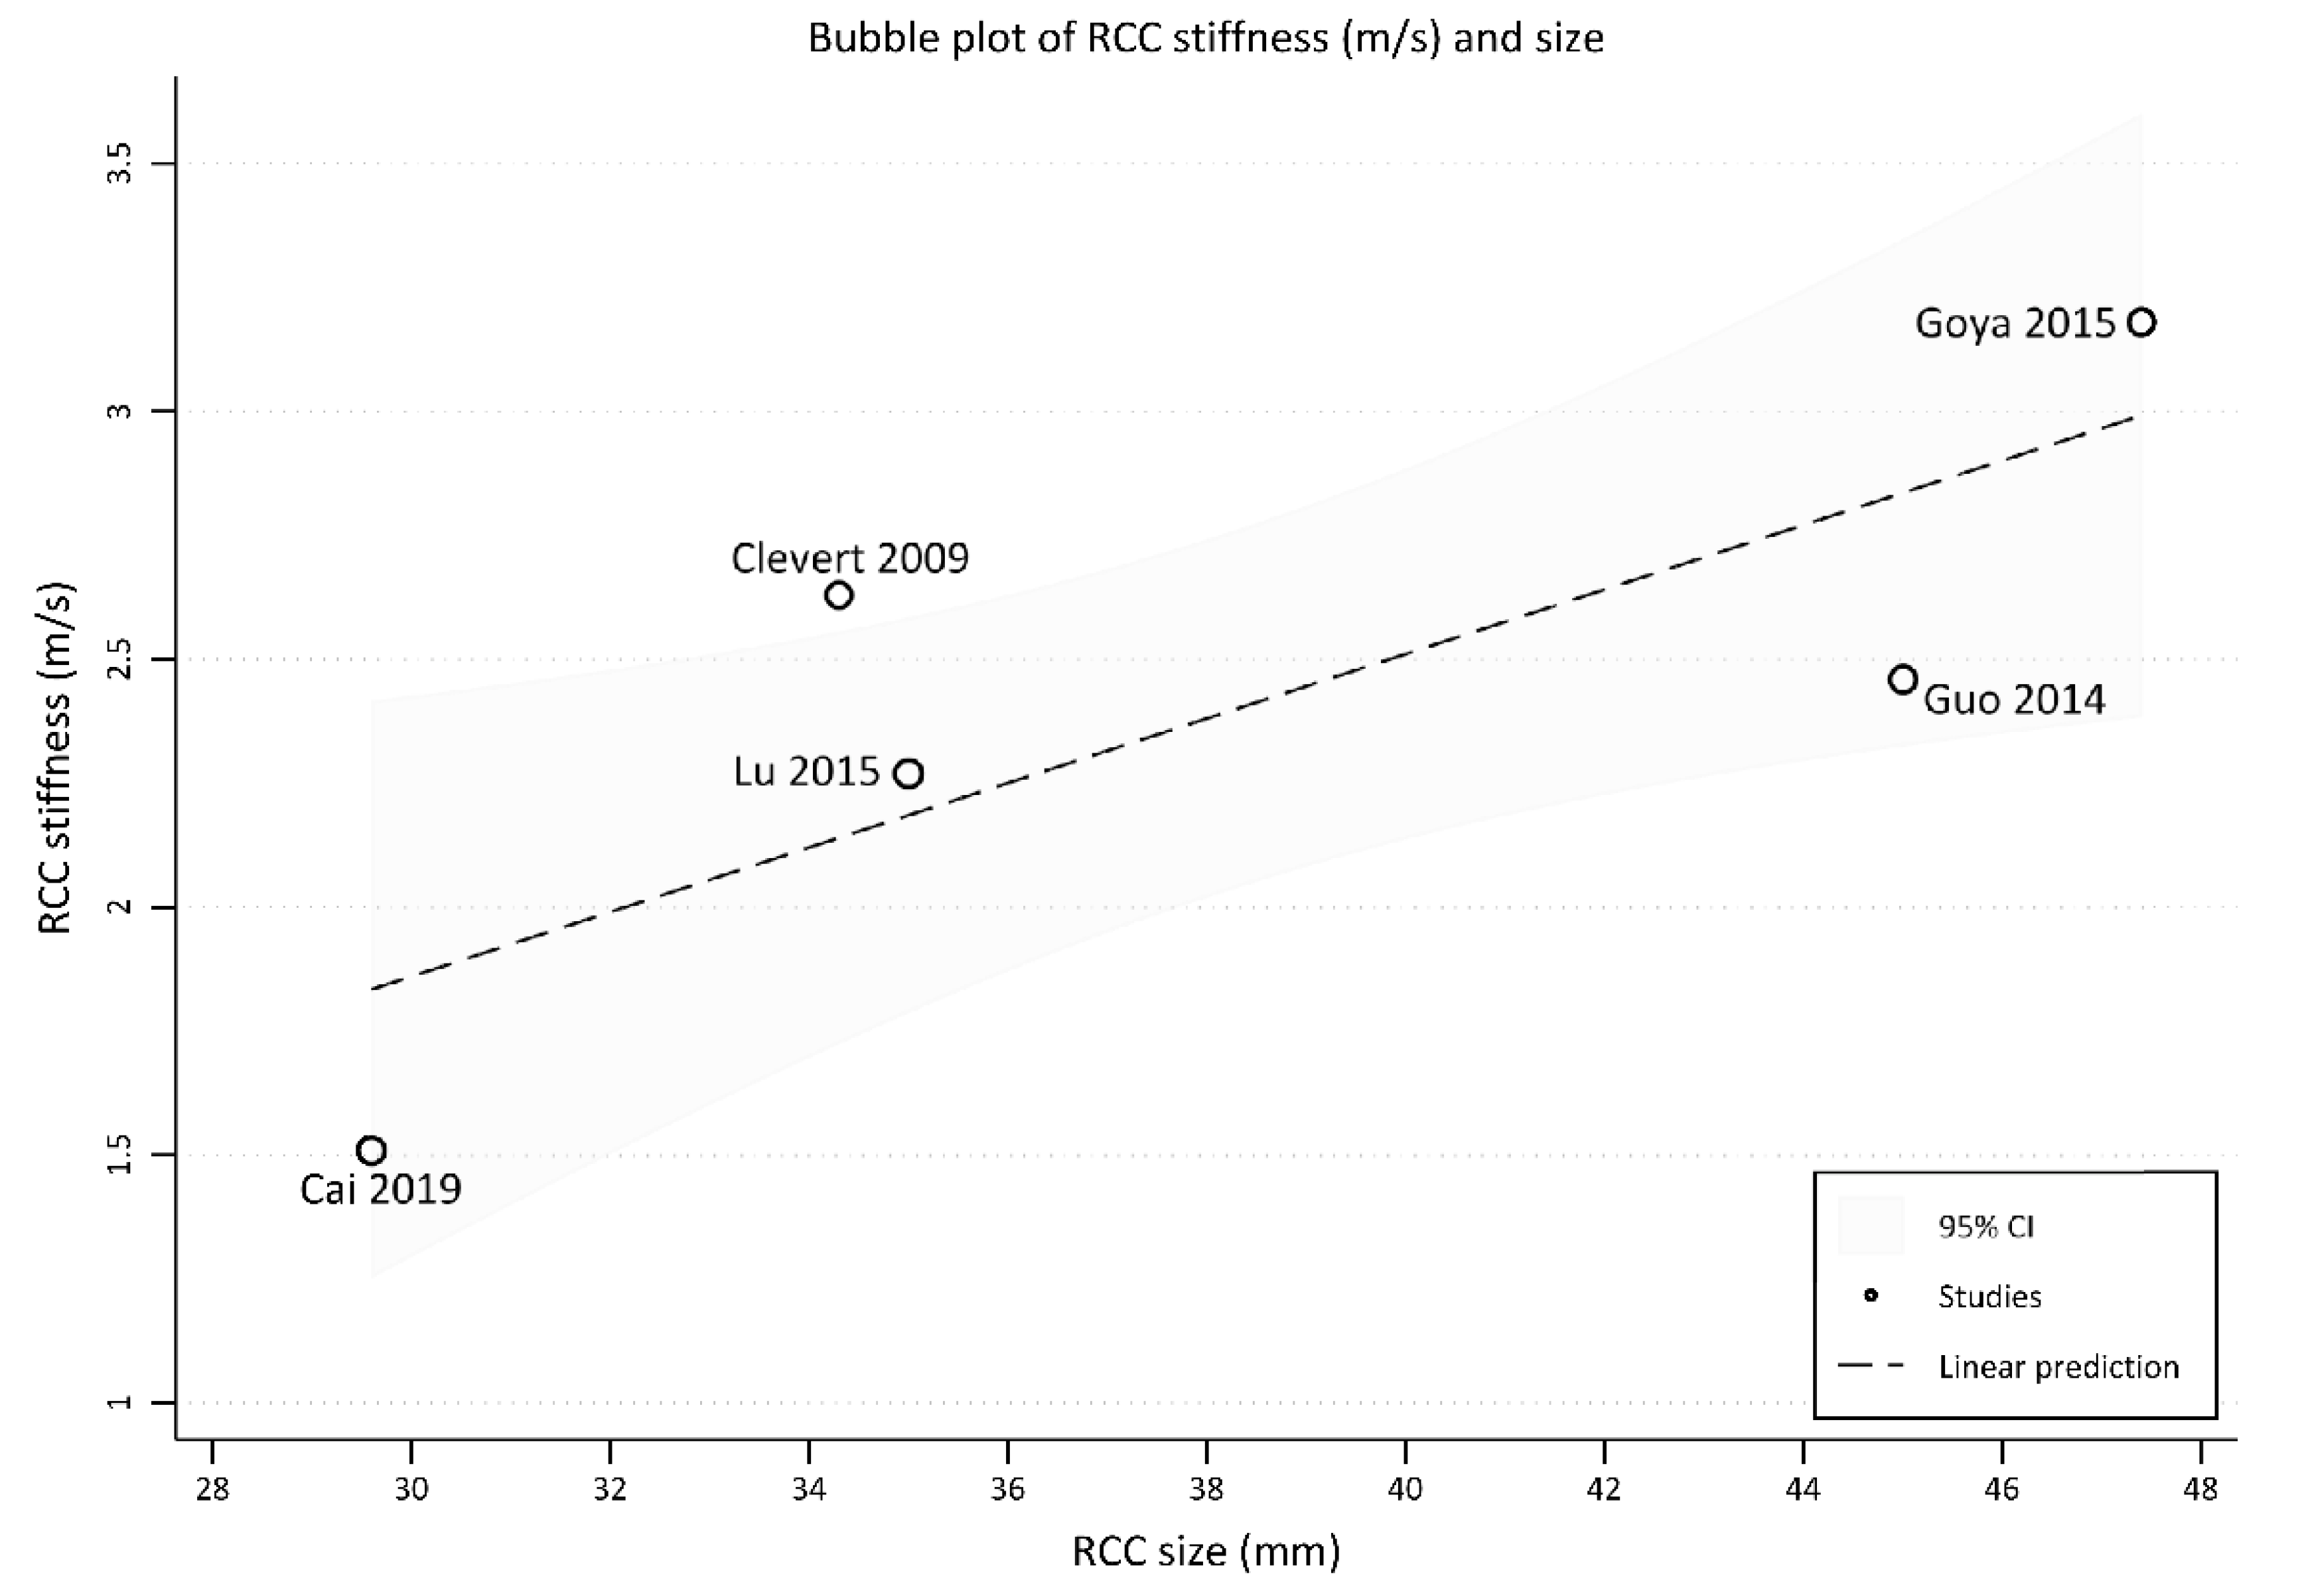
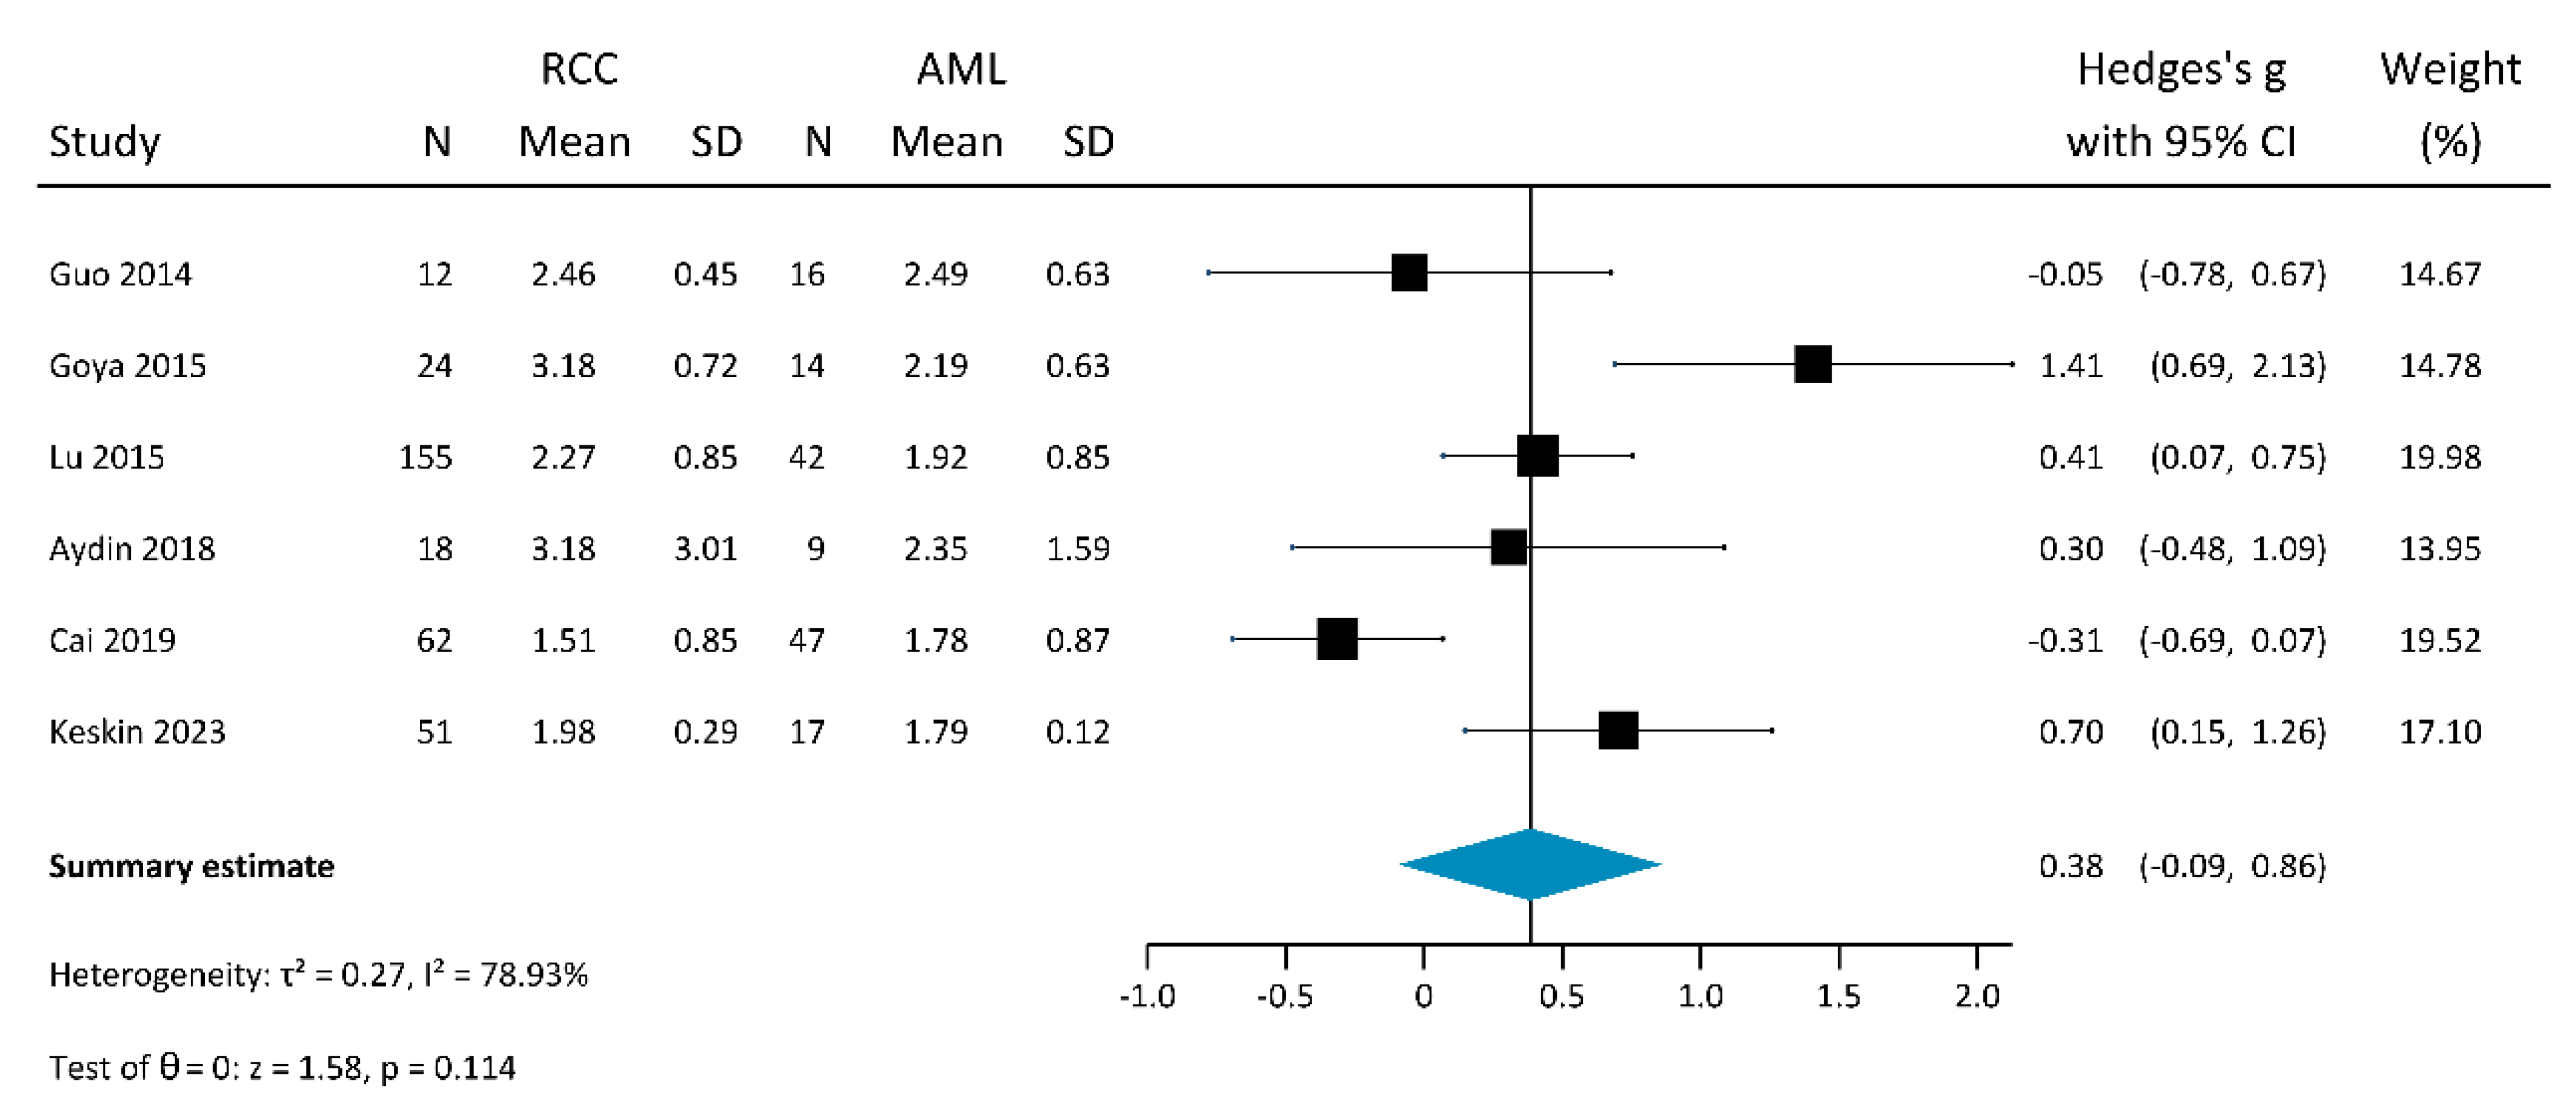
RCC stiffness, measured with SWE, could be retrieved from 8 studies (Figure 5), with a summary estimate of 2.53 m/s (95% CI 2.07–2.98, τ2 = 0.39, I2 = 97.64%), whereas AML stiffness measured with SWE was available in 7 studies, with a summary estimate of 2.02 m/s (95% CI 1.79–2.26, τ2 = 0.06, I2 = 81.34%). At meta-regression, AML stiffness was significantly higher in younger patients (β coefficient 0.07, 95% CI 0.04–0.10, p < 0.001), as depicted in Figure 6, but was not influenced by lesion size (β coefficient −0.01, 95% CI −0.06–0.04, p = 0.641). Conversely, RCC stiffness was not influenced by the patient’s age (β coefficient −0.002, 95% CI −0.12–0.11, p = 0.967) but was significantly higher (Figure 7) in large lesions (β coefficient 0.07, 95% CI 0.01–0.12, p = 0.017). The summary estimates of RCC and AML stiffness were not significantly different either at an indirect comparison (Cochran’s Q test p = 0.055) or at a direct comparison (summary SMD 0.38, 95% CI −0.09–0.86, τ2 = 0.27, I2 = 78.93%, p = 0.114), as shown in the corresponding forest plot (Figure 8). At meta-regression, none of the analyzed covariates (patient’s age, RCC lesion size, AML lesion size) had any significant influence on SMDs (p ≥ 0.180, residual heterogeneity I2 ≥ 82.68%).

4. Discussion

4.1. Imaging of Renal Masses

Except for simple renal cysts, which can be easily diagnosed by ultrasound, other renal masses need further investigation or follow-up. MR is considered the most accurate diagnostic tool but has several contraindications [31,32], whereas CT involves exposure to ionizing radiation and iodinated contrast agents, presenting a potential risk of nephrotoxicity in patients with renal insufficiency. Furthermore, the main diagnostic limitation of both methods lies in their poor ability to adequately characterize small lesions for various reasons, including motion artifacts on MRI or the presence of pseudo enhancement in cystic lesions on CT [33,34]. Alternatively, when performed by a skilled operator, CEUS proved to be a suitable alternative diagnostic tool, but it is not widely available and requires specific equipment and the collaboration of a second operator [5].

4.2. Management of Small Renal Lesions

Among solid renal lesions, most are RCCs [6]. Among benign lesions, AMLs are the most frequent and are typically present with characteristic US features, suggesting a presumptive diagnosis, differently from OCY [9,35]. At US, AML typically appears as a small, well-defined rounded mass located within the cortex, homogeneously hyperechoic, and is sometimes associated with posterior shadowing. However, several subtypes of renal AMLs exist, collectively composing a heterogeneous group of neoplasms, with variable clinical and radiological behavior [36,37]. In a minority of cases, fat-poor AMLs may be iso- or hypoechoic to the renal parenchyma or present inhomogeneous areas (particularly in large AMLs). On the other hand, subtypes of RCC may have a high-fat content and present with AML-like characteristics, representing a diagnostic challenge [7,9]. For this reason, caution is needed in the work-up of hyperechoic renal lesions [6]. In the general population without risk factors, there is a reasonable probability that a small solid renal lesion exhibiting the typical US features of AMLs is benign [6,38], whereas lymphomas and metastases are malignant lesions with unique clinical settings, and, in most cases, can be easily diagnosed at imaging [31].
Given the technical difficulty of characterizing the contrast enhancement of small masses and the difficulty of performing a biopsy, active surveillance is currently the accepted management paradigm for small solid lesions, which can be referred to for imaging follow-up [6].

4.3. US Elastography

US elastography is a safe and widely available complementary technique that could improve the early characterization of solid renal masses after incidental detection [30]. It has been applied with promising results for the study of thyroid nodules and breast lesions, showing, for example, that breast cancer presents higher stiffness compared to glandular parenchyma [10]. In nephrology, US elastography has been applied mainly to patients with chronic kidney disease, both in native and transplanted kidneys, demonstrating an increase in parenchymal stiffness due to the progression of fibrosis, while its relationship with the glomerular filtration rate remains controversial, probably due to many confounding factors [12]. A minor setting for the application of US elastography consists of the differentiation of focal lesions, i.e., if different elasticity values could be identified between different types of renal lesions and, in particular, between AML and CCR [30]. This is also the focus of our systematic review and meta-analysis, which aimed to assess the differences in stiffness values among different subtypes of solid renal masses.

4.4. Results of This Systematic Review and Meta-Analysis

Our systematic search identified a limited number of studies and investigated the application of elastography in renal lesions, with significant heterogeneity in terms of study aims, design, instrumentation characteristics, target population, and results.
First of all, we found great variability regarding the total number of patients and lesions included in the studies and also regarding the types of lesions. The most numerous lesions were RCC (some studies distinguish between different histotypes) and AML, and these data are consistent with the literature [6,39]. For other types of solid renal masses, it was not possible to meta-analyze elasticity values due to the scarcity and sparseness of the data.
Second, further variability among studies is clearly attributable to the presence of different reference standards, as histological confirmation was usually available only for malignant lesions, while the others were usually referred to as follow-up, and only an imaging-based diagnosis was available. Other factors to consider regarding US elastography techniques (SWE and SE) and the lack of protocol uniformity among different research groups (including ROI size and placement, number of samplings per lesion, patient positioning, etc.). SWE, especially 2D-SWE, is nowadays established as the preferred technique, as it presents some advantages [10]: it does not require manual compression, it provides both a point and a 2D-quantitative estimation of the tissue elasticity, and it visualizes a color-coded 2D map when superimposed on B-mode visualization, which can be matched to a “confidence threshold” map to visually appreciate in real time the reliability of the measurements. Indeed, although theoretically, we should expect increased stiffness at SWE in malignant lesions—as a consequence of high cellularity—some studies among those using SWE have unexpectedly presented opposite results [19,22]. Consequently, when comparing the mean stiffness values between RCC and AML in SWE studies, we found a general trend of greater stiffness in RCC than in AML, but this trend was not statistically significant at an indirect comparison (Cochran’s Q test p = 0.055) or at a direct comparison (summary SMD 0.38, 95% CI −0.09–0.86, p = 0.114).
Conversely, it should be noted that all studies using SE consistently showed higher strain ratio values in RCC compared to AML, with these results confirmed both at an indirect (Cochran’s Q test p = 0.014) and direct comparison, where strain ratios of RCC were shown to be significantly higher (p = 0.021). The strain ratio is a dimensionless semi-quantitative measure that takes into account the differential displacement between the lesion and its surroundings (since the second ROI is positioned on the normal renal parenchyma). Even if it is not possible to estimate the magnitude of the stress applied, which could be very different between the various operators—as the stiffness of the lesions is always evaluated in comparison with the surrounding parenchyma, which is subjected to the same stress—this factor could contribute to explain the higher consistency of the SE results compared to SWE, in which ROIs were placed only within the lesion.
To explain these results, another aspect that could be considered is the intrinsic heterogeneity of lesions that can affect the elasticity values. One might expect that larger lesions would be mostly heterogeneous due to the development of necrotic areas, which are not always easy to detect in US (otherwise, they should be excluded, as US elastography cannot be performed on cystic lesions). However, at meta-regression among studies employing SWE, we even observed the opposite effect of lesion size on RCC stiffness and no effect of lesion size on AML stiffness, which was instead influenced by patients’ age. If this positive relationship between size and stiffness can be confirmed by larger studies, this could represent a limitation for the application of US elastography since its added value is mainly to be expected in the classification of small lesions, whereas larger ones are generally diagnosed on contrast-enhanced imaging.

4.5. Limitations and Future Perspectives

The results of this systematic review were affected by several limitations.
Some of these limitations were intrinsic to the systematic review process, such as the potential presence of a publication bias, attrition bias, and selective outcome reporting; we tried to minimize the latter and the inflation of clinical heterogeneity—even if the protocol of this systematic review was not pre-registered—by focusing on specific lesion types and by distinguishing between different stiffness measurement methods.
Some other limitations could be related to this particular systematic review, such as the availability of only a few studies (also conducted over a large period of time), the high heterogeneity of US elastography equipment, the differences in the acquisition protocols (number of samplings, size, and placement of ROI), and generally small study samples. Furthermore, several important data (e.g., patients’ age and lesion size) were provided in an aggregated manner, limiting our meta-regression and subgroup analysis; thus, individual patient data meta-analysis should be performed to appropriately investigate the covariates that could influence stiffness values [40]. Of note, as the small number of studies (with generally small samples) and the continuous nature of US elastography data were known to substantially influence the power and reliability of the Egger test, we opted to avoid investigating publication bias.
Another methodological limitation was the minimal presence of preliminary evaluations on the reproducibility of the measurements in relation to the experience of radiologists and sonographers. Future studies need to consistently address this issue while also standardizing the acquisition protocols regarding the preferred type of US elastography, the unit of measurement, the number of measurements per lesion, and the size and positioning of the ROI within the lesion.
From a technical point of view, all included SWE studies used a p-SWE technique, which provided a quantitative measurement of a small, dimension-fixed ROI. Conversely, 2D-SWE, when matched with a confidence threshold, could increase its accuracy. Furthermore, elastography can be used as a complementary technique to improve the diagnostic accuracy of CEUS, which, on the contrary, has shown good results in the characterization of renal lesions, as suggested by Thaiss et al. [17].
Alongside the necessity to sizably increase the study samples and plan appropriately-powered studies, further diagnostic improvements could come from the application of quantitative imaging models based on artificial intelligence [41,42]; substantial gains in the characterization of the intra- and perilesional elasticity landscape could be granted by artificial intelligence tools that are able to work on the two-dimensional elasticity patterns provided by the 2D-SWE technique.

5. Conclusions

Large methodological and technical heterogeneity was found in the studies included in this systematic review. The meta-analysis of renal lesion stiffness values in four studies employing SE was found to have significantly higher strain ratio values for RCC compared to AML. However, no significant difference between RCC and AML stiffness was found among the eight studies using SWE, highlighting the need to improve the study design and standardize US elastography protocols.

Author Contributions

Conceptualization, A.C., M.C. (Michaela Cellina) and M.C. (Maurizio Cè); methodology, A.C., M.C. (Michaela Cellina), M.C. (Maurizio Cè) and G.O.; validation, M.C. (Maurizio Cè) and A.C.; formal analysis, A.C. and M.C. (Maurizio Cè); investigation, A.C., M.C. (Maurizio Cè) and E.S.; writing—original draft preparation, A.C., M.C. (Maurizio Cè), M.C. (Michaela Cellina) and E.S.; writing—review and editing, M.C. (Michaela Cellina), A.C., M.C. (Maurizio Cè), E.S., L.D., D.G. and G.I.; supervision, G.I., S.P., D.G. and G.C.; project administration, G.O., G.I., D.G., L.D. and G.C. All authors have read and agreed to the published version of the manuscript.

Funding

This research received no external funding.

Data Availability Statement

All data extracted and analyzed for this systematic review and meta-analysis are included in this paper.

Conflicts of Interest

The authors declare no conflict of interest.

References

  1. Qayyum, T.; Oades, G.; Horgan, P.; Aitchison, M.; Edwards, J. The Epidemiology and Risk Factors for Renal Cancer. Curr. Urol. 2013, 6, 169–174. [Google Scholar] [CrossRef] [Green Version]
  2. Padala, S.A.; Barsouk, A.; Thandra, K.C.; Saginala, K.; Mohammed, A.; Vakiti, A.; Rawla, P.; Barsouk, A. Epidemiology of Renal Cell Carcinoma. World J. Oncol. 2020, 11, 79–87. [Google Scholar] [CrossRef]
  3. Tufano, A.; Antonelli, L.; Di Pierro, G.B.; Flammia, R.S.; Minelli, R.; Anceschi, U.; Leonardo, C.; Franco, G.; Drudi, F.M.; Cantisani, V. Diagnostic Performance of Contrast-Enhanced Ultrasound in the Evaluation of Small Renal Masses: A Systematic Review and Meta-Analysis. Diagnostics 2022, 12, 2310. [Google Scholar] [CrossRef]
  4. Jinzaki, M.; Ohkuma, K.; Tanimoto, A.; Mukai, M.; Hiramatsu, K.; Murai, M.; Hata, J. Small solid renal lesions: Usefulness of power Doppler US. Radiology 1998, 209, 543–550. [Google Scholar] [CrossRef]
  5. Di Vece, F.; Tombesi, P.; Ermili, F.; Sartori, S. Management of incidental renal masses: Time to consider contrast-enhanced ultrasonography. Ultrasound 2016, 24, 34–40. [Google Scholar] [CrossRef] [Green Version]
  6. Sahni, V.; Silverman, S. Imaging Management of Incidentally Detected Small Renal Masses. Semin. Intervent. Radiol. 2014, 31, 009–019. [Google Scholar] [CrossRef] [Green Version]
  7. Park, B.K. Renal Angiomyolipoma: Radiologic Classification and Imaging Features According to the Amount of Fat. Am. J. Roentgenol. 2017, 209, 826–835. [Google Scholar] [CrossRef]
  8. Doshi, A.M.; Ayoola, A.; Rosenkrantz, A.B. Do Incidental Hyperechoic Renal Lesions Measuring Up to 1 cm Warrant Further Imaging? Outcomes of 161 Lesions. Am. J. Roentgenol. 2017, 209, 346–350. [Google Scholar] [CrossRef]
  9. Flum, A.S.; Hamoui, N.; Said, M.A.; Yang, X.J.; Casalino, D.D.; McGuire, B.B.; Perry, K.T.; Nadler, R.B. Update on the Diagnosis and Management of Renal Angiomyolipoma. J. Urol. 2016, 195, 834–846. [Google Scholar] [CrossRef]
  10. Sigrist, R.M.S.; Liau, J.; Kaffas, A.E.; Chammas, M.C.; Willmann, J.K. Ultrasound Elastography: Review of Techniques and Clinical Applications. Theranostics 2017, 7, 1303–1329. [Google Scholar] [CrossRef]
  11. Shiina, T.; Nightingale, K.R.; Palmeri, M.L.; Hall, T.J.; Bamber, J.C.; Barr, R.G.; Castera, L.; Choi, B.I.; Chou, Y.-H.; Cosgrove, D.; et al. WFUMB Guidelines and Recommendations for Clinical Use of Ultrasound Elastography: Part 1: Basic Principles and Terminology. Ultrasound Med. Biol. 2015, 41, 1126–1147. [Google Scholar] [CrossRef] [Green Version]
  12. Cè, M.; Felisaz, P.F.; Alì, M.; Re Sartò, G.V.; Cellina, M. Ultrasound elastography in chronic kidney disease: A systematic review and meta-analysis. J. Med. Ultrason. 2023. [Google Scholar] [CrossRef]
  13. Page, M.J.; McKenzie, J.E.; Bossuyt, P.M.; Boutron, I.; Hoffmann, T.C.; Mulrow, C.D.; Shamseer, L.; Tetzlaff, J.M.; Akl, E.A.; Brennan, S.E.; et al. The PRISMA 2020 statement: An updated guideline for reporting systematic reviews. BMJ 2021, 372, n71. [Google Scholar] [CrossRef]
  14. Wells, G.; Shea, B.; O’Connell, D.; Peterson, J.; Welch, V.; Losos, M.; Tugwell, P. The Newcastle-Ottawa Scale (NOS) for Assessing the Quality of Nonrandomised Studies in Meta-Analyses. Available online: http://www.ohri.ca/programs/clinical_epidemiology/oxford.asp (accessed on 22 November 2018).
  15. Veroniki, A.A.; Jackson, D.; Viechtbauer, W.; Bender, R.; Bowden, J.; Knapp, G.; Kuss, O.; Higgins, J.P.; Langan, D.; Salanti, G. Methods to estimate the between-study variance and its uncertainty in meta-analysis. Res. Synth. Methods 2016, 7, 55–79. [Google Scholar] [CrossRef] [Green Version]
  16. Novianti, P.W.; Roes, K.C.B.; van der Tweel, I. Estimation of between-trial variance in sequential meta-analyses: A simulation study. Contemp. Clin. Trials 2014, 37, 129–138. [Google Scholar] [CrossRef]
  17. Thaiss, W.M.; Bedke, J.; Kruck, S.; Spira, D.; Stenzl, A.; Nikolaou, K.; Horger, M.; Kaufmann, S. Can contrast-enhanced ultrasound and acoustic radiation force impulse imaging characterize CT-indeterminate renal masses? A prospective evaluation with histological confirmation. World J. Urol. 2019, 37, 1339–1346. [Google Scholar] [CrossRef]
  18. Aydin, S.; Yildiz, S.; Turkmen, I.; Sharifov, R.; Uysal, O.; Gucin, Z.; Armagan, A.; Kocakoc, E. Value of Shear Wave Elastography for differentiating benign and malignant renal lesions. Med. Ultrason. 2018, 1, 21. [Google Scholar] [CrossRef] [Green Version]
  19. Cai, Y.; Li, F.; Li, Z.; Du, L.; Wu, R. Diagnostic Performance of Ultrasound Shear Wave Elastography in Solid Small (≤4 cm) Renal Parenchymal Masses. Ultrasound Med. Biol. 2019, 45, 2328–2337. [Google Scholar] [CrossRef]
  20. Clevert, D.-A.; Stock, K.; Klein, B.; Slotta-Huspenina, J.; Prantl, L.; Heemann, U.; Reiser, M. Evaluation of Acoustic Radiation Force Impulse (ARFI) imaging and contrast-enhanced ultrasound in renal tumors of unknown etiology in comparison to histological findings. Clin. Hemorheol. Microcirc. 2009, 43, 95–107. [Google Scholar] [CrossRef]
  21. Göya, C.; Daggulli, M.; Hamidi, C.; Yavuz, A.; Hattapoglu, S.; Cetincakmak, M.G.; Teke, M. The role of quantitative measurement by acoustic radiation force impulse imaging in differentiating benign renal lesions from malignant renal tumours. Radiol. Med. 2015, 120, 296–303. [Google Scholar] [CrossRef]
  22. Guo, L.-H.; Liu, B.-J.; Xu, H.-X.; Liu, C.; Sun, L.-P.; Zhang, Y.-F.; Xu, J.-M.; Wu, J.; Xu, X.-H. Acoustic radiation force impulse elastography in differentiating renal solid masses: A preliminary experience. Int. J. Clin. Exp. Pathol. 2014, 7, 7469–7476. [Google Scholar]
  23. Inci, M.F.; Kalayci, T.O.; Tan, S.; Karasu, S.; Albayrak, E.; Cakir, V.; Ocal, I.; Ozkan, F. Diagnostic value of strain elastography for differentiation between renal cell carcinoma and transitional cell carcinoma of kidney. Abdom. Radiol. 2016, 41, 1152–1159. [Google Scholar] [CrossRef]
  24. Keskin, S.; Güven, S.; Keskin, Z.; Özbiner, H.; Kerimoğlu, Ü.; Yeşildağ, A. Strain elastography in the characterization of renal cell carcinoma and angiomyolipoma. Can. Urol. Assoc. J. 2015, 9, 67. [Google Scholar] [CrossRef] [Green Version]
  25. Keskin, Z.; Keskin, S. Shear wave elastography in the characterization of renal cell carcinoma and angiomyolipoma. Acta radiol. 2023, 64, 1272–1279. [Google Scholar] [CrossRef]
  26. Lu, Q.; Wen, J.-X.; Huang, B.-J.; Xue, L.-Y.; Wang, W.-P. Virtual Touch quantification using acoustic radiation force impulse (ARFI) technology for the evaluation of focal solid renal lesions: Preliminary findings. Clin. Radiol. 2015, 70, 1376–1381. [Google Scholar] [CrossRef]
  27. Onur, M.R.; Poyraz, A.K.; Bozgeyik, Z.; Onur, A.R.; Orhan, I. Utility of Semiquantitative Strain Elastography for Differentiation Between Benign and Malignant Solid Renal Masses. J. Ultrasound Med. 2015, 34, 639–647. [Google Scholar] [CrossRef]
  28. Sun, D.; Lu, Q.; Wei, C.; Li, Y.; Zheng, Y.; Hu, B. Differential diagnosis of <3 cm renal tumors by ultrasonography: A rapid, quantitative, elastography self-corrected contrast-enhanced ultrasound imaging mode beyond screening. Br. J. Radiol. 2020, 93, 20190974. [Google Scholar] [CrossRef]
  29. Tan, S.; Özcan, M.F.; Tezcan, F.; Balcı, S.; Karaoğlanoğlu, M.; Huddam, B.; Arslan, H. Real-Time Elastography for Distinguishing Angiomyolipoma from Renal Cell Carcinoma: Preliminary Observations. Am. J. Roentgenol. 2013, 200, W369–W375. [Google Scholar] [CrossRef]
  30. Sagreiya, H.; Akhbardeh, A.; Li, D.; Sigrist, R.; Chung, B.I.; Sonn, G.A.; Tian, L.; Rubin, D.L.; Willmann, J.K. Point Shear Wave Elastography Using Machine Learning to Differentiate Renal Cell Carcinoma and Angiomyolipoma. Ultrasound Med. Biol. 2019, 45, 1944–1954. [Google Scholar] [CrossRef]
  31. Nicolau, C.; Antunes, N.; Paño, B.; Sebastia, C. Imaging Characterization of Renal Masses. Medicina 2021, 57, 51. [Google Scholar] [CrossRef]
  32. Kang, S.K.; Huang, W.C.; Pandharipande, P.V.; Chandarana, H. Solid Renal Masses: What the Numbers Tell Us. Am. J. Roentgenol. 2014, 202, 1196–1206. [Google Scholar] [CrossRef] [Green Version]
  33. Israel, G.M.; Hindman, N.; Bosniak, M.A. Evaluation of Cystic Renal Masses: Comparison of CT and MR Imaging by Using the Bosniak Classification System. Radiology 2004, 231, 365–371. [Google Scholar] [CrossRef]
  34. Tappouni, R.; Kissane, J.; Sarwani, N.; Lehman, E.B. Pseudoenhancement of Renal Cysts: Influence of Lesion Size, Lesion Location, Slice Thickness, and Number of MDCT Detectors. Am. J. Roentgenol. 2012, 198, 133–137. [Google Scholar] [CrossRef]
  35. Ishigami, K.; Jones, A.R.; Dahmoush, L.; Leite, L.V.; Pakalniskis, M.G.; Barloon, T.J. Imaging spectrum of renal oncocytomas: A pictorial review with pathologic correlation. Insights Imaging 2015, 6, 53–64. [Google Scholar] [CrossRef] [Green Version]
  36. Jinzaki, M.; Silverman, S.G.; Akita, H.; Nagashima, Y.; Mikami, S.; Oya, M. Renal angiomyolipoma: A radiological classification and update on recent developments in diagnosis and management. Abdom. Imaging 2014, 39, 588–604. [Google Scholar] [CrossRef] [Green Version]
  37. Seyam, R.M.; Alkhudair, W.K.; Kattan, S.A.; Alotaibi, M.F.; Alzahrani, H.M.; Altaweel, W.M. The Risks of Renal Angiomyolipoma: Reviewing the Evidence. J. Kidney Cancer VHL 2017, 4, 13–25. [Google Scholar] [CrossRef] [Green Version]
  38. Forman, H.P.; Middleton, W.D.; Melson, G.L.; McClennan, B.L. Hyperechoic renal cell carcinomas: Increase in detection at US. Radiology 1993, 188, 431–434. [Google Scholar] [CrossRef]
  39. Campbell, S.C.; Novick, A.C.; Belldegrun, A.; Blute, M.L.; Chow, G.K.; Derweesh, I.H.; Faraday, M.M.; Kaouk, J.H.; Leveillee, R.J.; Matin, S.F.; et al. Guideline for Management of the Clinical T1 Renal Mass. J. Urol. 2009, 182, 1271–1279. [Google Scholar] [CrossRef]
  40. Ter Riet, G.; Bachmann, L.M.; Kessels, A.G.H.; Khan, K.S. Individual patient data meta-analysis of diagnostic studies: Opportunities and challenges. Evid. Based Med. 2013, 18, 165–169. [Google Scholar] [CrossRef] [Green Version]
  41. Castiglioni, I.; Rundo, L.; Codari, M.; Di Leo, G.; Salvatore, C.; Interlenghi, M.; Gallivanone, F.; Cozzi, A.; D’Amico, N.C.; Sardanelli, F. AI applications to medical images: From machine learning to deep learning. Phys. Medica 2021, 83, 9–24. [Google Scholar] [CrossRef]
  42. Cellina, M.; Cè, M.; Irmici, G.; Ascenti, V.; Khenkina, N.; Toto-Brocchi, M.; Martinenghi, C.; Papa, S.; Carrafiello, G. Artificial Intelligence in Lung Cancer Imaging: Unfolding the Future. Diagnostics 2022, 12, 2644. [Google Scholar] [CrossRef]
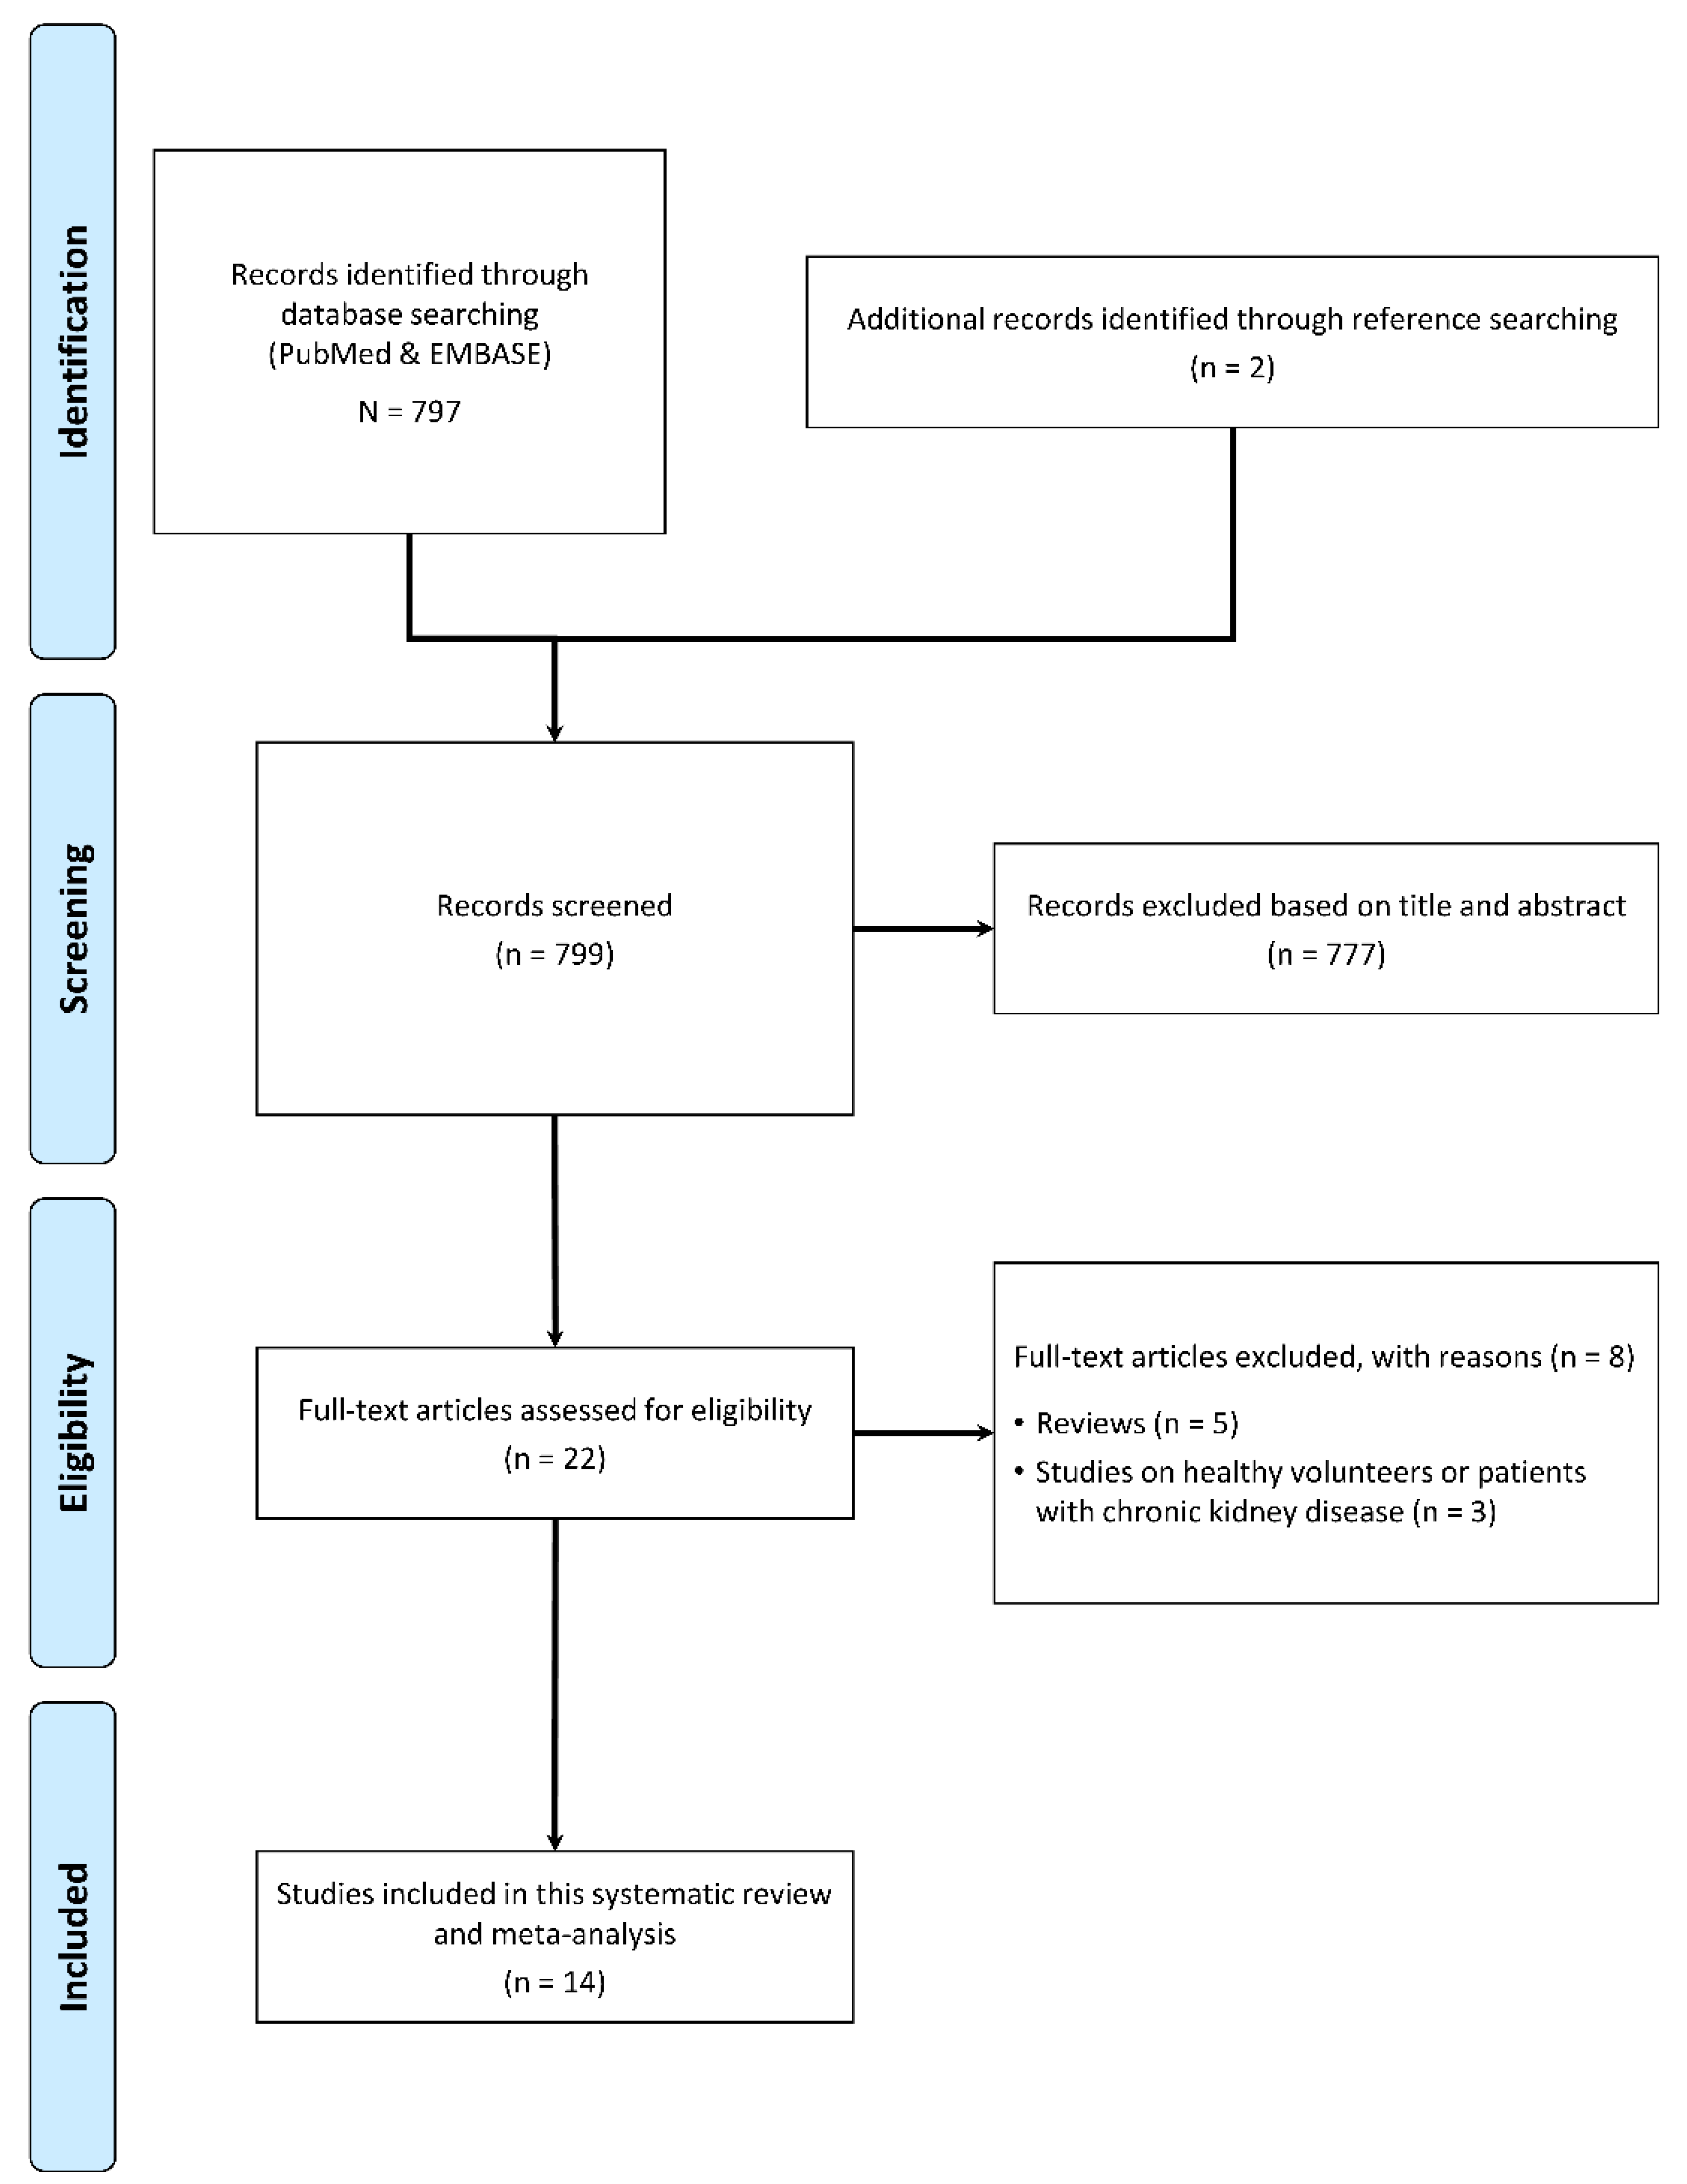
Figure 1. PRISMA flowchart.
Applsci 13 07767 g001
Figure 2. Forest plot for indirect comparison of RCC and AML strain ratios obtained from the four studies using SE [23,24,27,29]. Black squares depict single study estimates with their 95% CIs (black lines). The blue diamonds represent the summary estimates and their 95% CIs.
Applsci 13 07767 g002
Figure 3. Bubble plot of RCC stiffness (expressed as strain ratio) and RCC lesion size from four studies [23,24,27,29].
Applsci 13 07767 g003
Figure 4. Forest plot for direct comparison of RCC and AML strain ratios obtained from the three studies using SE [24,27,29]. Black squares depict single study estimates with their 95% CIs (black lines). The blue diamond represents the summary estimate and its 95% CI.
Applsci 13 07767 g004
Figure 5. Forest plot for indirect comparison of RCC and AML stiffness values (m/s) obtained from the eight studies using SWE [17,18,19,20,21,22,25,26]. Black squares depict single study estimates with their 95% CIs (black lines). The blue diamonds represent the summary estimates and their 95% CIs.
Applsci 13 07767 g005
Figure 6. Bubble plot of AML stiffness (m/s) and patients’ age from five studies [18,19,21,22,25].
Applsci 13 07767 g006
Figure 7. Bubble plot of RCC stiffness (m/s) and RCC lesion size from five studies [19,20,21,22,26].
Applsci 13 07767 g007
Figure 8. Forest plot for the direct comparison of RCC and AML stiffness values (m/s) obtained from six studies using SWE [18,19,21,22,25,26]. Black squares depict single study estimates with their 95% CIs (black lines). The blue diamond represents the summary estimate and its 95% CI.
Applsci 13 07767 g008
Table 1. Methodological study characteristics and technical features.
AuthorYearGeographic OriginStudy TypeElastography TechniqueStiffness MeasurementManufacturerModelProbe and FrequencyMeasurements per LesionReference StandardHistopathology ModalityImaging Modality
Clevert et al.2009EuropeOPSWEm/sSiemensAcuson S2000Convex probe (4C1), 1–4 MHz-Histopathology + Imaging-US/CT/MR
Tan et al.2013EuropeOPSEStrain ratioGELogiQ E9Convex probe, 2.8–5 MHz-Histopathology + ImagingPost-operative pathology/biopsyCT/MR
Guo et al.2014AsiaOPSWEm/sSiemensAcuson S2000Convex probe (4C1), 1–4 MHz7Histopathology + ImagingPost-operative pathology/biopsyCT/MR
Onur et al.2014EuropeOPSEStrain ratioToshibaAplio XGConvex probe, 3.5 MHz-Histopathology + ImagingPost-operative pathology/biopsyCT/MR
Goya et al.2015EuropeOPSWEm/sSiemensAcuson S2000Convex probe (4C1), 1–4 MHz16Histopathology + ImagingPost-operative pathologyUS/CT/MR
Keskin et al.2015EuropeOPSEStrain ratioToshibaAplio XGConvex probe (PVT-375BT), 2.5–5 MHz-Histopathology + ImagingPost-operative pathologyCT/MR
Lu et al.2015AsiaOPSWEm/sSiemensAcuson S2000Convex probe (4C1), 1–4 MHz10Histopathology + ImagingPost-operative pathologyCT/MR
Inci et al.2016EuropeOPSEStrain ratioToshibaAplio 500Convex probe, 3.5–5 MHz-HistopathologyPost-operative pathology/biopsy-
Aydin et al.2018EuropeOPSWEkPaPhilipsiU22Convex probe (C5-1), 1–5 MHz3Histopathology + ImagingPost-operative pathology/biopsy-
Thaiss et al.2018EuropeOPSWEm/sSiemensAcuson S 3000 HELXConvex probe (6C1 HD), 1.5–6 MHz-Histopathology + ImagingPost-operative pathology-
Cai et al.2019AsiaOPSWEkPaAixplorerAixplorerConvex probe (SC6-1), 1–6 MHz-Histopathology + ImagingPost-operative pathologyCT/MR
Sagreiya et al.2019AmericaOPSWE-SiemensAcuson S2000Convex probe (6C1 HD), 1.5–6 MHz10Histopathology + ImagingPost-operative pathologyCT/MR
Sun et al.2020AsiaORSWEm/sSiemensAcuson S2000Convex probe (4C1), 1–4 MHz5---
Keskin et al.2023EuropeOPSWEm/sPhilipsiU22Convex probe (C5-1), 2.5 MHz2Histopathology + ImagingPost-operative pathologyUS/CT/MR
OP = observational prospective; OR = observational retrospective; SWE = shear-wave elastography; SE = strain elastography.
Table 2. Study population characteristics, diagnostic reference standards, lesion number and type.
AuthorYearElastography TechniqueTotal PatientsMean Age ± Standard DeviationPatients Excluded for Technical ReasonsEffectively Sampled LesionsBenign LesionsMalignant LesionsBiopsiesSurgery SamplesImagingRCCTCCMTXOCYLYMAMLSRCABSHEWILPSTHCOther
Clevert et al. 2009SWE1554 15411 11 22
Tan et al. 2013SE5254 ± 1254728192192619 28
Guo et al. 2014SWE8850 ± 384642301219 2312 1 16 13
Onur et al. 2014SE8558.00147129428412234435124
Goya et al. 2015SWE7150 ± 2011602436 33212457 14 3 7
Keskin et al. 2015SE6556 ± 12 652441 412441 24
Lu et al. 2015SWE209 1219742155 16829155 42
Inci et al.2016SE9961 ± 828714671160 441833111
Aydin et al. 2018SWE4050 ± 16 401525328 18221 92111 3
Thaiss et al. 2018SWE1236446771958 77 58 10 1 8
Cai et al.2019SWE17657 ± 11591174968117873068 2 47
Sagreiya et al.2019SWE5857 ± 137521042 44842 10
Sun et al. 2020SWE3547 372215 13 11 13
Keskin et al. 2023SWE7458 ± 126681751 511751 17
SWE = shear-wave elastography; SE = strain elastography; RCC = renal cell carcinoma; TCC = transitional cell carcinoma; MTX = metastasis; OCY = oncocytoma; LYM = lymphoma; AML = angiomyolipoma; SRC = sarcoma; ABS = abscess; HE = hemangioendothelioma; WIL = Wilms tumor; PST = pseudotumor; HC = hemorrhagic cyst.
Table 3. Number and average size of lesions.
RCCTCCMTXOCYLYMAMLSRCABSHEWILPSTHC
AuthorYearNSize (mm)NSize (mm)NSize (mm)NSize (mm)NSize (mm)NSize (mm)NSize (mm)NSize (mm)NSize (mm)NSize (mm)NSize (mm)NSize (mm)
Clevert et al. 20091134 22238
Tan et al. 20131957 2822
Guo et al. 20141245 129 1624 1324
Onut et al. 201434524 3 5 1 2426
Goya et al. 20152447532729 1425 330
Keskin et al. 20154155 2430
Lu et al. 201515535 4241
Inci et al.201644531840331364149154168
Aydin et al. 201818 2 2 1 9 2 1 1 1
Thaiss et al. 201858 10 1
Cai et al.20196830 223 4723
Sagreiya et al.20194235 1022
Sun et al. 202013 11
Keskin et al. 202351Range 23–180 17Range 15–98
RCC = renal cell carcinoma; TCC = transitional cell carcinoma; MTX = metastasis; OCY = oncocytoma; LYM = lymphoma; AML = angiomyolipoma; SRC = sarcoma; ABS = abscess; HE = hemangioendothelioma; WIL = Wilms tumor; PST = pseudotumor; HC = hemorrhagic cyst.
Table 4. US elastography values.
US ElastographyStiffness Values (Mean ± Standard Deviation)
AuthorYearElastography TechniqueStiffness MeasurementRCCTCCMTXOCYLYMAMLSRCABSHEWILPSTHC
Clevert et al.2009SWEm/s2.63 ± 0.63 2.90 ± 0.273.05 ± 0.35
Tan et al.2013SEStrain ratio0.64 ± 0.15 0.15 ± 0.06
Guo et al.2014SWEm/s2.46 ± 0.45 1.60 2.49 ± 0.63 3.24 ± 0.75
Onur et al.2014SEStrain ratio4.30 ± 2.272.43 ± 1.032.54 ± 1.531.79 ± 0.264.731.28 ± 1.01
Goya et al.2015SWEm/s3.18 ± 0.722.33 ± 0.292.90 ± 1.11 2.19 ± 0.63 1.20 ± 0.14
Keskin et al.2015SEStrain ratio3.40 ± 0.30 1.10 ± 0.10
Lu et al.2015SWEm/s2.27 ± 0.85 1.92 ± 0.85
Inci et al.2016SEStrain ratio4.04 ± 0.725.18 ± 1.123.04 ± 1.091.98 ± 0.433.321.424.13
Aydin et al.2018SWEkPa §31.80 ± 28.6419.41 ± 10.048.99 ± 0.728.05 17.46 ± 7.9522.99 ± 7.9732.603.245.12
Thaiss et al.2018SWEm/s3.40 ± 0.80 2.80 ± 0.40
Cai et al. 2019SWEkPa §7.20 ± 2.50 10 ± 2.40 10.00 ± 2.40
Sagreiya et al. 2019SWE-
Sun et al.2020SWEm/s
Keskin et al.2023SWEm/s1.98 ± 0.29 1.79 ± 0.12
§ for quantitative synthesis, values expressed in kPa were recalculated in m/s as described in the Section 2. SWE = shear-wave elastography; SE = strain elastography; RCC = renal cell carcinoma; TCC = transitional cell carcinoma; MTX = metastasis; OCY = oncocytoma; LYM = lymphoma; AML = angiomyolipoma; SRC = sarcoma; ABS = abscess; HE = hemangioendothelioma; WIL = Wilms tumor; PST = pseudotumor; HC = hemorrhagic cyst.
Table 5. Modified Newcastle–Ottawa scale for the evaluation of methodological quality.
Patient SelectionComparabilityReference Standard
Author/YearIs the Malignant Case Definition Adequate?Representativeness of the
Malignant Cases
Selection of
Benign Cases
Definition of
Benign Cases
Comparability of Benign and
Malignant Cases on the basis of the Design or Analysis
Reference
Standard for
Malignancy
Congruence of Reference
Standard for
Benign and
Malignant Cases
Follow-Up TypeTotal Score
Clevert 2009111111017
Tan 2013111111017
Guo 2014111111017
Onur 2014111111006
Goya 2015111110016
Keskin 2015101011004
Lu 2015111111017
Inci 2016111111107
Aydin 2018111111006
Thaiss 2018111101016
Cai 2019111111017
Sagreiya 2019111111006
Sun 2020111111006
Keskin 2023111111006
Disclaimer/Publisher’s Note: The statements, opinions and data contained in all publications are solely those of the individual author(s) and contributor(s) and not of MDPI and/or the editor(s). MDPI and/or the editor(s) disclaim responsibility for any injury to people or property resulting from any ideas, methods, instructions or products referred to in the content.