1. Introduction
In the middle of the twentieth century, it was stated that an enterprise is a collection of production resources, and that maintaining competitive advantage is possible thanks to the appropriate use of resources in production processes [
1,
2]. However, in spite of this, the effective use of resources is still an ongoing issue, and can be seen to be one of the biggest problems regarding the management of production systems [
2,
3,
4]. Increasing competition in the international market and the gradual running out of natural resources make the problem of the high effectiveness of production resources even more important. The production system must be designed to meet the dynamically changing market requirements in terms of quality, costs, reliability, flexibility, and responsiveness to changes in demand [
5,
6,
7]. The classical objectives of managing the production systems presented above overlap with ecological dimensions that are caused by the growing emphasis on economic, environmental and social sustainability. One can increasingly encounter the slogan “Lean and green manufacturing”, which refers to the goals and measures related to the effective use of resources in production processes [
8]. However, in the manufacturing industry in general, sustainability requirements are still not considered to be as important as classic productivity targets, although the market is slowly developing in this direction [
9]. Therefore, manufacturing companies are still looking for appropriate methods to manage production resources effectively. This can be seen, for example, in the increasingly perfect methods of production planning and scheduling, which more and more often use artificial intelligence methods [
10,
11]. However, appropriate methods, tools and measures for evaluating the effectiveness of production systems and their resources are still being sought [
12]. Currently, Overall Equipment Effectiveness (OEE), which was developed by Nakajima [
13], is most commonly used for this purpose, and it is still considered to be one of the best measures for assessing results both in the area of Total Productive Maintenance (TPM) and Lean Manufacturing improvement activities [
3,
14,
15,
16]. However, both OEE and other popular ways of assessing production effectiveness focus primarily on machines and devices. However, losses that reduce production effectiveness can be attributed to various factors, which are mainly related to the machine park, human resources, methods, materials or tools [
17]. Moreover, among these factors, employees are still considered to be the fundamental resource of enterprises—even in the era of Industry 5.0 [
18]. Controlling the results of production processes is therefore a complicated activity due to the variety of factors affecting their effectiveness. In addition, according to observations made in manufacturing companies for the purpose of this work, it is crucial to assign responsibility for production losses to the appropriate organizational units in order to quickly and effectively eliminate problems and carry out improvement activities.
In connection with the above, the aim of this work was to develop a method for assessing the effectiveness of the use of available resources when implementing production processes. Recent research in manufacturing engineering [
7,
19,
20,
21,
22,
23,
24,
25,
26] mainly focuses on developing Industry 4.0 ideology, e.g., developing smart production planning systems or implementing digital tools in the processes. The aspect of complex and detailed effectiveness assessment could influence (even in the era of Industry 4.0, even more so in the coming era of Industry 5.0) the development or at least the possibility of verifying the effectiveness of other proposals for new methods or improvements in manufacturing engineering. Recent scientific papers presenting current methods of effectiveness assessment [
16,
27,
28,
29,
30,
31] indicate the lack of a quantitative method for assessing the production processes effectiveness, which, taking into account the categorization of the production losses, would allow at the same time to evaluate the main areas (production and production-related) contribution in the generation of these losses. The method is based on a set of quantitative indicators and takes into account the categorization of production losses. The diagram in
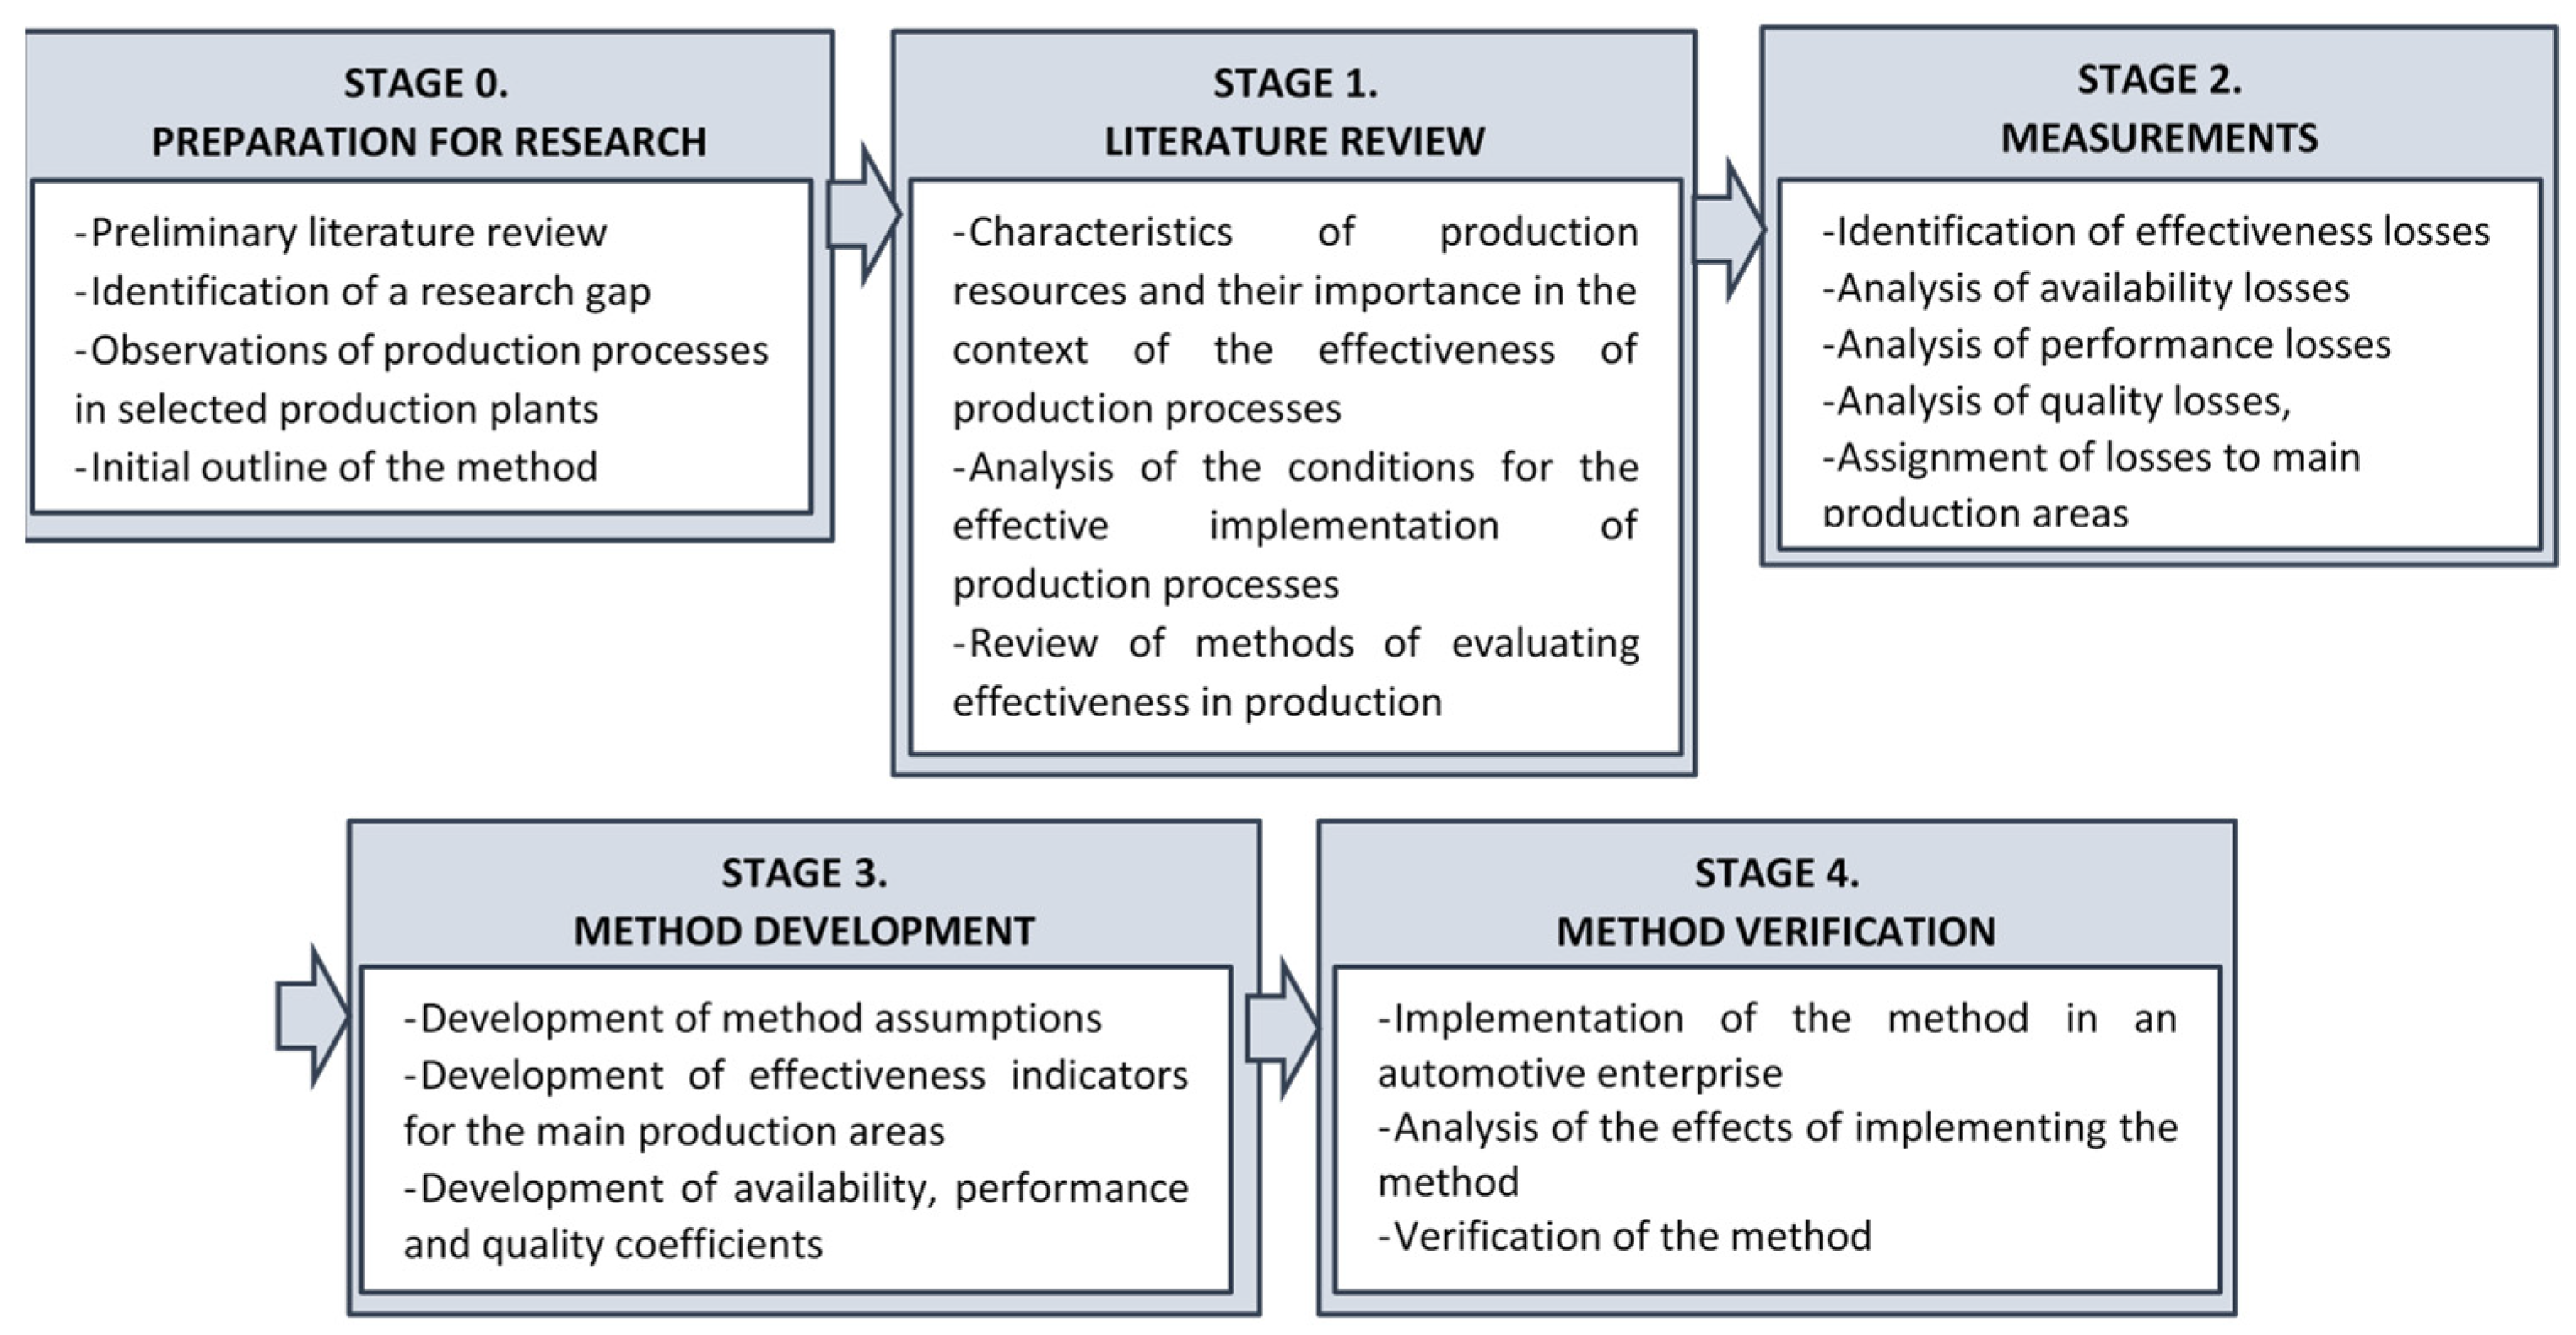
Figure 1 shows the plan of the main stages of the research.
2. Literature Review
The PN-EN ISO 9000:2015 standard defines effectiveness as ”the extent to which planned activities are realized, and planned results are achieved” [
32]. The Cambridge Dictionary defines “effective” as being “successful or achieving the results you want” [
33]. An increase in effectiveness, without a simultaneous decrease in quality, an increase in employee exploitation or costly investments in technology, is possible by identifying and eliminating production losses [
4,
27,
34]. Among the production losses affecting effectiveness, the following are mainly mentioned in the literature: downtime, speed losses and quality losses [
35]. Monitoring losses at various levels of production is possible thanks to production indicators [
36]. Among the indicators used in the practice of enterprises, the OEE indicator and its modifications (TEEP, PEE, OLE, OAE, OPE, OTE, OE, OEEML, ORE, RE—described in more detail in [
37]), KPI indicators and productivity indicators are most often mentioned (
Table 1).
The OEE indicator and its modifications allow for the assessment of the degree of achieving production goals—also at the level of the production station. The assessment of effectiveness is comprehensive, and it includes the assessment of availability, performance and quality at the station, but does not allow for the categorization of losses in terms of the areas of their generation [
2,
14,
17,
35,
36,
38]. KPIs mainly refer to business goals, and focus on the performance of the entire organization [
39]. Productivity indicators relate to production assumptions, and evaluate the results for various groups of resources, which in turn makes it possible to partially identify areas where production losses are generated. The effectiveness assessment takes into account the assessment of availability and performance for selected groups of resources, but it is neither comprehensive nor standardized for all areas [
28].
In the literature there are new proposals for effectiveness assessment methods, among which modifications of the OEE method are most popular. Such modifications include:
introducing measures to determine the effectiveness of isolated equipment, without analyzing the impact of environmental conditions [
2],
introducing a measure to determine material usage effectiveness [
16],
changing the original way [
35] of calculating individual coefficients [
40,
41],
extending the method to include weighting factors [
29].
A summary of various proposals for extending or modifying the OEE method is presented in [
16]. However, none of them takes into account the possibility of valuing production losses categorized according to the area of responsibility. Based on the assumption that losses that reduce production effectiveness can be attributed to various factors, mainly related to the machine park, human resources, methods, materials or tools [
17], it was noticed that there is no method for the quantitative assessment of the effectiveness of production processes. Such a method would consider the categorization of production losses, and at the same time allow for the assessment of the contribution of the main areas (production and production-related) in the generation of these losses, in turn facilitating the identification of the sources of problems and the appropriate targeting of improvement activities.
In this paper, the term losses is understood as the failure to achieve the set goals by the implemented production processes, including mainly those related to production effectiveness—parameters such as: availability, performance and quality [
35]. In the literature on the subject [
1,
42,
43,
44,
45], one can find many ways of classifying production processes. This paper proposes a division resulting from the point of view of the basic unit of the production system. Processes inside the station—defined as production and which include activities performed by operators, and processes outside the station—near production and which are required for the proper course of production, namely: logistics, maintenance and organization and management, were distinguished. In the management of production systems, among the basic production resources, the following are distinguished: means of labor, objects of labor, and human labor [
1]. In the context of production resources, the literature distinguishes the following approaches as the main areas of loss sources: 4M, 5M or 5M + E [
46]. Each includes the area of machine, material, method and man, with the 5M approach additionally including the area of management, and 5M + E also including the area of the environment. In this paper, the modified 5M approach was chosen as the starting point. The modification consists in evaluating the other areas from the level of a standardized method, which allows the extent to which its implementation meets the assumptions to be assessed. In addition, in the nomenclature of the loss categories, the method does not use groups of individual resources, but instead the areas responsible for them in order to more effectively implement subsequent improvement processes. The area of responsibility of the operator, logistics, maintenance and organization and management were distinguished.
4. Method Development
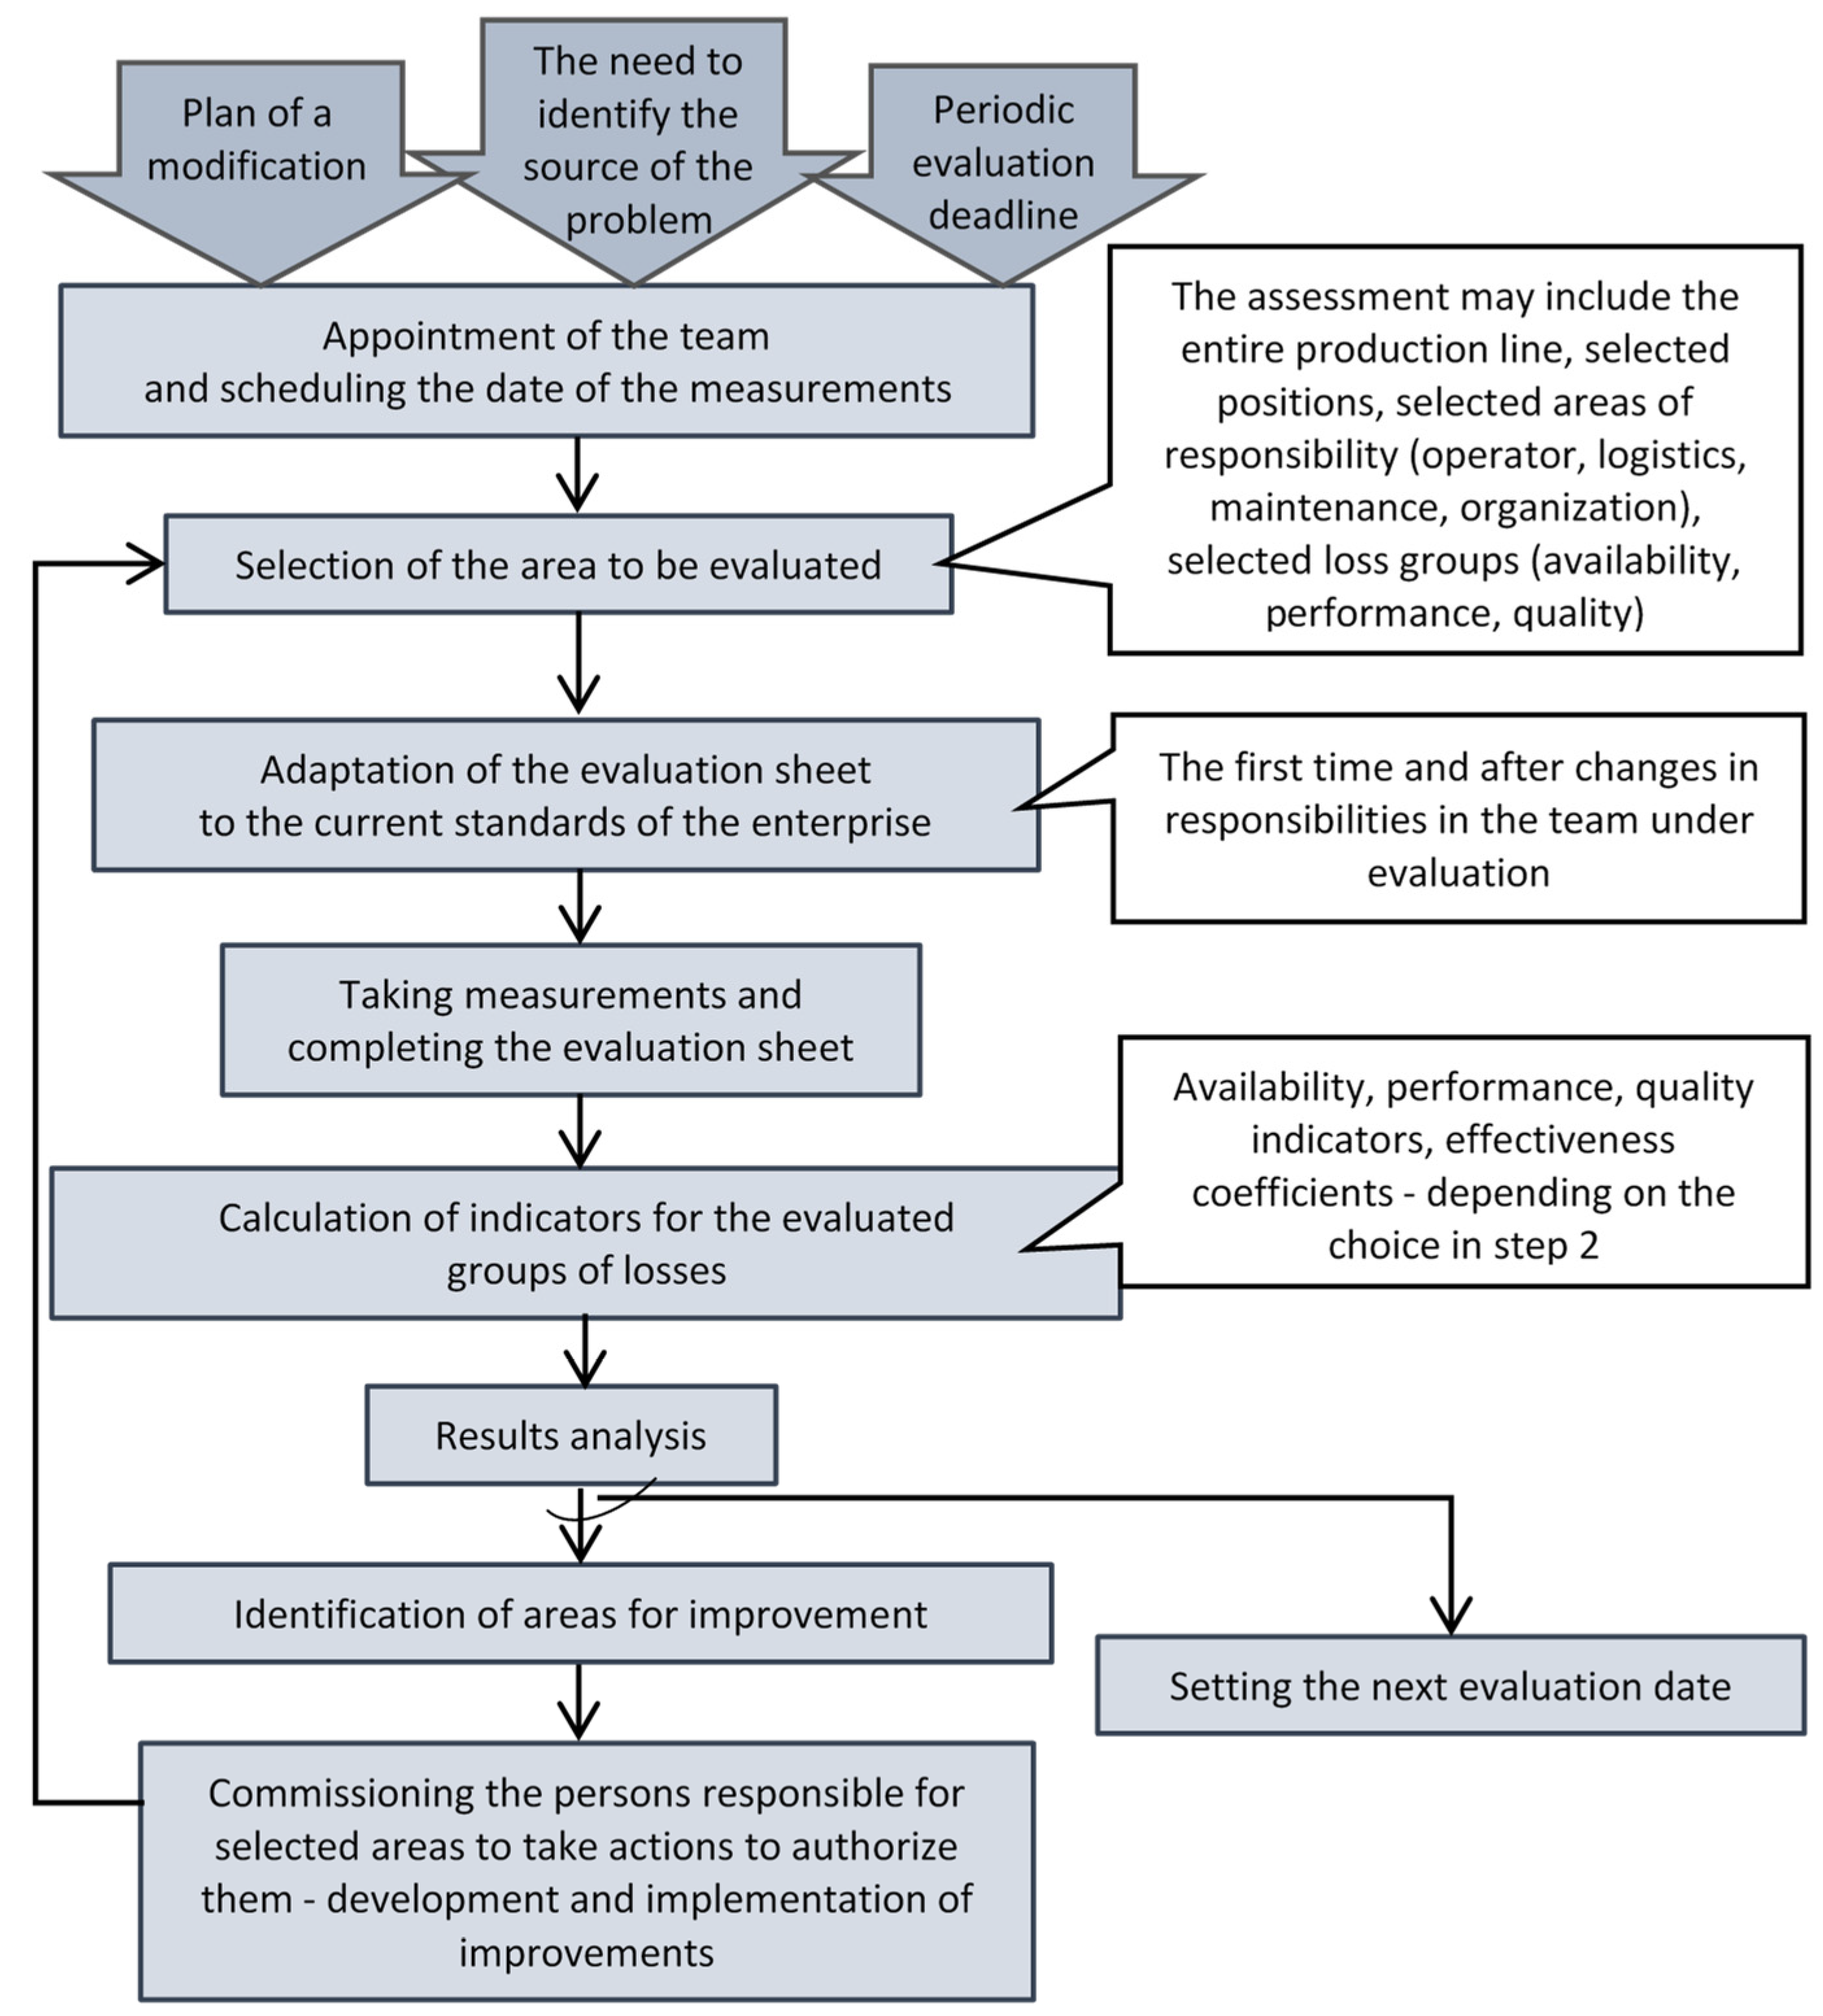
Based on the identified groups of losses, effectiveness indicators were developed for operators, logistics services, organizational services and maintenance services, as well as for the procedure of applying the method (
Figure 2).
The procedure assumes the use of the method for periodic evaluation, for identifying the source of problems, and for monitoring the impact of changes on the production process. The entire production line, or selected positions, as well as selected areas of responsibility or selected groups of losses, can be evaluated. It is recommended that the person conducting the assessment knows the process and the competencies required in its area. The assessment includes the measurement of production losses using an evaluation sheet adapted to the company’s current standards. The results are presented in the form of effectiveness indicators and coefficients of availability, performance and quality, the analysis of which enables the identification of areas for improvement. The ratio of the actual effects to those that are achievable with the use of specific resources was adopted as the effectiveness indicators, with the inputs expressed in the form of the results planned to be achieved with the use of these resources. If the results are satisfactory, another assessment date is set. If it is necessary to implement improvements, the measurements are repeated, with the analysis of the recalculated coefficients and indicators allowing the impact of the introduced changes on the production process to be monitored and the next steps to be decided upon.
The Operator Production Effectiveness indicator was determined as the product of Operator Availability, Operator Production Performance and Operator Production Quality, expressed as a percentage.
OPE: Operator Production Effectiveness
AO: Operator Availability
PO: Operator Production Performance
QO: Operator Production Quality
The Operator Availability coefficient was defined as the ratio of the actual and assumed operator’s working time, minus any losses beyond his/her control. A reduced value of the coefficient may indicate absenteeism at the position, excessively long times of production-related activities, and other downtime caused by the operator. To calculate the Availability coefficient, it is necessary to collect data (based on production records) on the total available time and the time of planned downtime during the time period considered for the study, and then measure the times of unplanned downtime occurring at that time, separately due to the operator, separately independent of the operator.
tO: actual operator working time
tpO: possible operator working time
tsO: unplanned operator downtime
ttO: assumed operator working time
tsU: time of unplanned downtime through no fault of the operator
tt: total available time
tsP: planned downtime
The Operator Production Performance coefficient was defined as the ratio of the amount of production possible to be performed by the operator to the total possible production. A reduced value of the coefficient may indicate either the operator’s failure to comply with certain work procedures, or a reduced ability to perform certain activities. To calculate the Performance coefficient, it is necessary to measure (in addition to the times collected during the measurements of availability) production delay time by the operator (e.g., caused by difficulties in using an inappropriate tool, performing activities in the wrong order, etc.), which reduce the rate of production. The delay is calculated in relation to the theoretical cycle time.
pO: possible operator production
pp: possible production
lO: unrealized production due to the operator
tc: theoretical cycle time
tdO: production delay time by the operator
ts: downtime
The Operator Production Quality coefficient was defined as the share of the operator’s good production in the total actual production, without taking into account defects due to independent causes. A reduced value of the coefficient indicates defects due to the operator. Calculating the Quality coefficient is necessary to collect data on total actual production in the analyzed period and defective production through the operator’s fault.
cO: actual possible good production of the operator
pa: total actual production
dO: defective production through the fault of the operator
Analogous to the operator’s production effectiveness, methods for calculating the effectiveness for production-related areas were developed in such a way as to enable the assessment of their impact on the production process.
LSE: Logistics Support Effectiveness
AC: Component Availability
PL: Logistics Performance
MgSE: Management Support Effectiveness
AW: Workstation Availability
PMg: Management Performance
MtSE: Maintenance Support Effectiveness
AD: Device Availability
PMt: Maintenance Performance
QMt: Maintenance Quality
For the availability coefficient of production-related areas, the reference base is the assumed operator’s working time, because all resources must be provided so that the operator can carry out the production plan at any time. For each area, the total downtime (per analyzed time period) caused by the fault of that area is taken into account.
AX: AC/AW/AD
tY: tL/tMg/tMt
tL: actual time of component availability
tMg: actual time of proper management
tMt: actual time of device availability
tlY: tlL/tlMg/tlMt
tlL: logistical loss time
tlMg: organizational loss time
tlMt: maintenance loss time
The performance coefficient for the production-related areas was related to the possible production in the actual time of the operator’s work at the production station. In the calculations, it is necessary to use downtime data and measure the delay time caused by the analyzed area (e.g., difficulties of working on an unsuitable but approved machine, difficulties of production from inadequate but supplied material, etc.).
PX: PL/PMg/PMt
pX: pL/pMg/pMt
pL: production enabled by logistics service
pMg: production enabled by organizational support
pMt: production enabled by maintenance service
lY: lL/lMg/lMt
lL: unrealized production for logistical reasons
lMg: unrealized production for organizational reasons
lMt: unrealized production for maintenance reasons
tdX: tdL/tdMg/tdMt
tdL: production delay time by logistics
tdMg: production delay time by organization
tdMt: production delay time by maintenance
Meanwhile, for the quality coefficient for all areas, the total actual production was taken as the reference base. For each analyzed area, it is necessary to calculate the number of defective products caused by the fault of that area.
QX: QL/QMg/QMt
cX: cL/cMg/cMt
cL: actual good production enabled by logistics service
cMg: actual good production enabled by organizational service
cMt: actual good production enabled by maintenance service
dX: dL/dMg/dMt
dL: defective production from materials supplied but which are unsuitable
dMg: defective production by improper organization
dMt: defective production on a damaged device
5. Method Verification
The verification of the method was carried out in the Lower Silesian branch of an automotive company. An assembly line for the main foot brake valve, consisting of three production stations, was designated for the implementation of the method. Most assembly operations are performed manually using simple tools and a press. The aim of the research was to assess the effectiveness of the production line‘s utilization of resources in the process by identifying and categorizing production losses and then expressing them in numerical form. Measurements were carried out in two stages: first for the current state, and then for the state after the implementation of improvements. Each stage covered 20 days of measurements of availability, performance and quality losses in the areas of the operator, logistics, organization and management, and maintenance. For the measurements, a time period outside the holiday season and free from audits and visits was chosen. All measurements were conducted on the first production shift. Time measurements were conducted to the accuracy of 1 s. The measurement sheet includes:
various types of possible production losses,
assigning these losses to availability, performance or quality,
the categorization of losses in terms of responsible areas,
basic assumptions of the production plan.
The other sources of data were an electronic tracking system, production documentation, and interviews with operators.
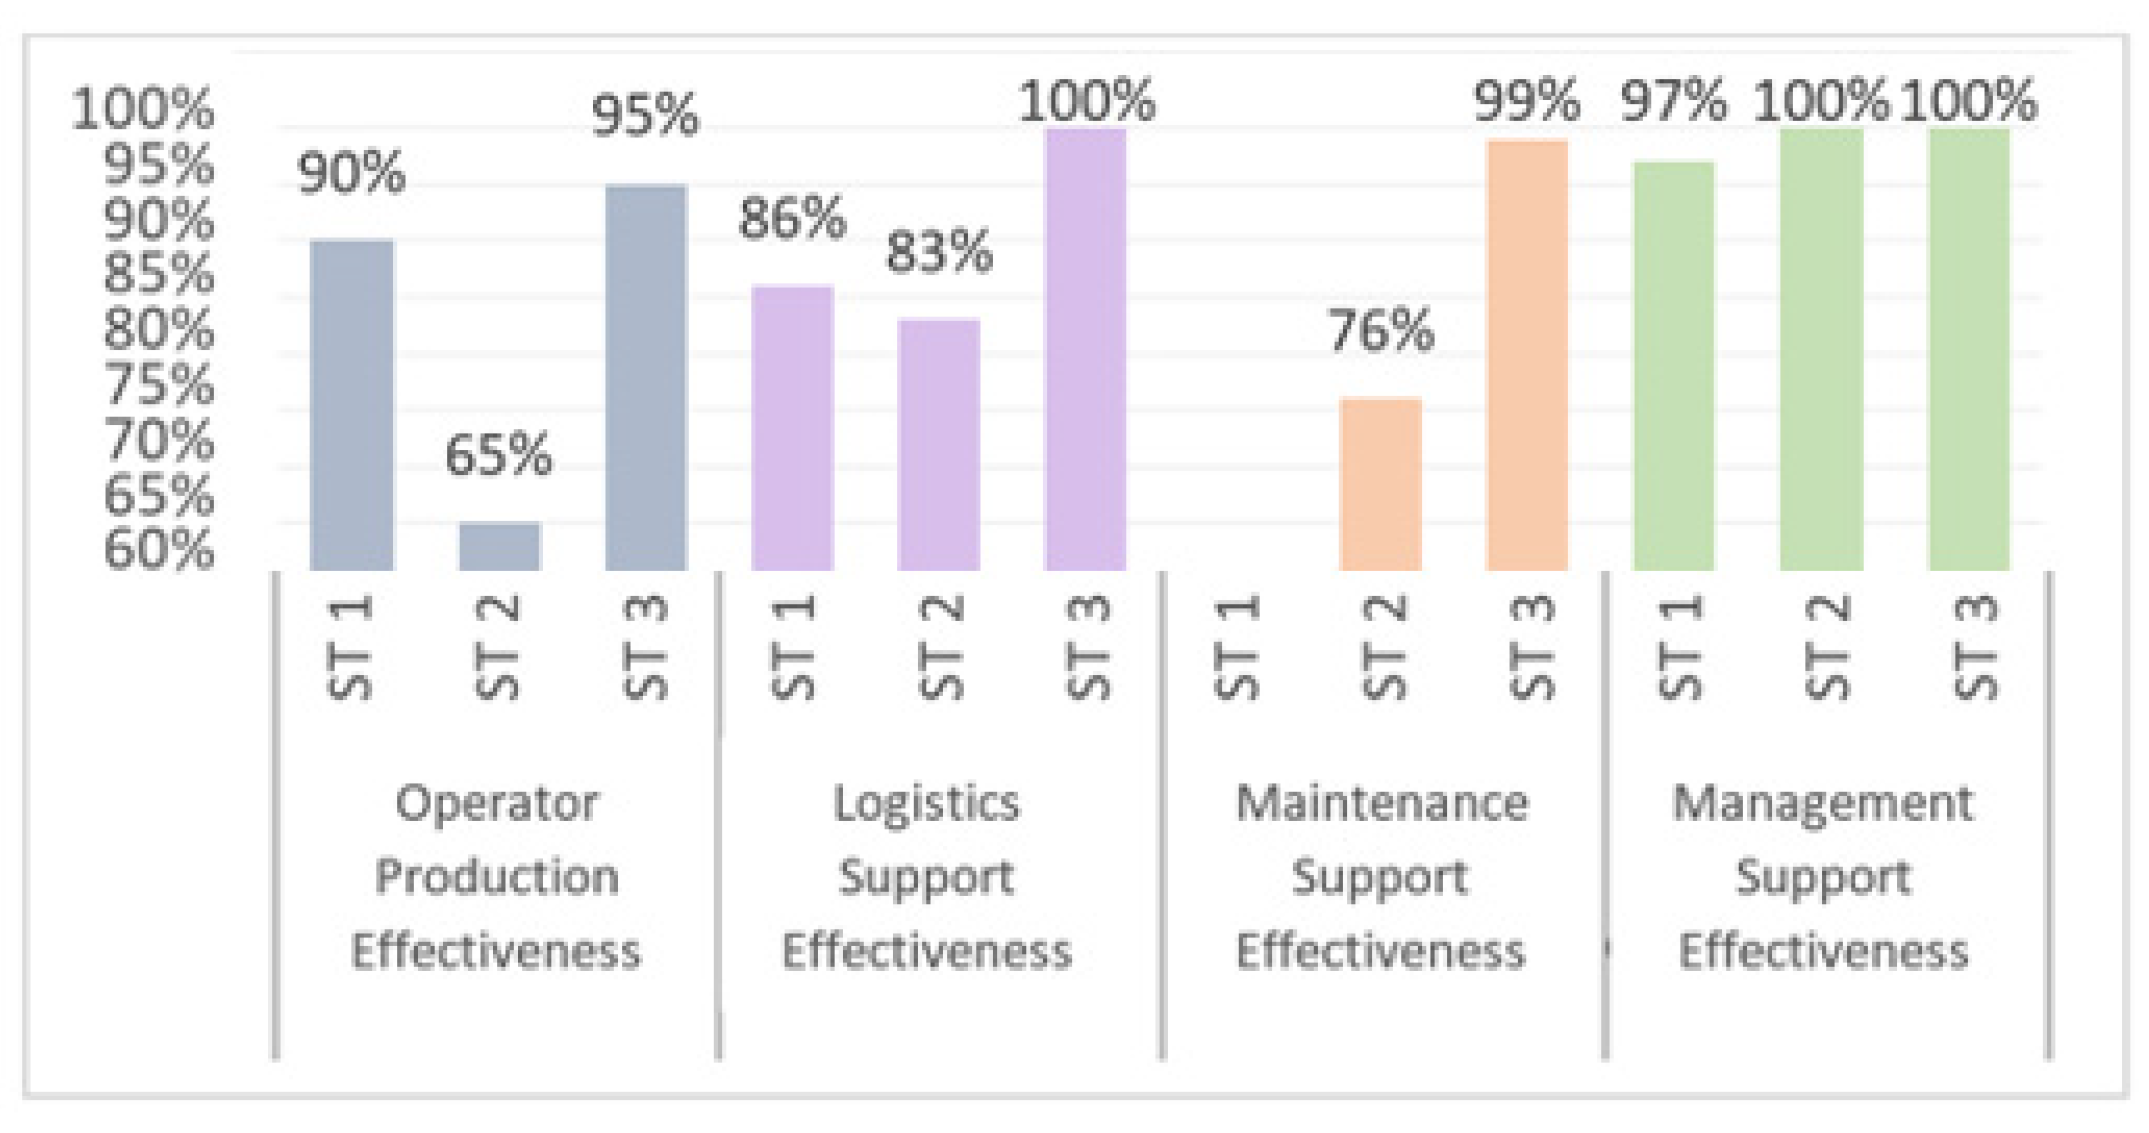
The average value of the effectiveness indicator for the first stage of measurements was (
Figure 3):
Figure 3.
Average values of the effectiveness indicator for three workstations.
Figure 3.
Average values of the effectiveness indicator for three workstations.
Several problems were noted at the first station (
Figure 4), the second station (
Figure 5) achieved the worst results, while the results for the third station turned out to be satisfactory.
Workstation 1 obtained the worst results in the availability coefficients in the area of logistics and the operator, while workstation 2 only obtained good results in the qualitative coefficients and in the organization and management area.
The source of losses in the operator’s area turned out to be, i.e., conversations, both on and outside the workstation, which resulted in short but quite numerous downtimes, as well as a reduced production rate and excessive time spent on preparatory and finishing activities. In the area of logistics, the main problem turned out to be the lack of material for production. This resulted in the need for the operator to leave the workplace and to bring the necessary elements, which involved a time-consuming search due to the multi-variant nature of the product. In the area of maintenance, the problem of an inoperative press became apparent, resulting in a slower production rate. It is worth noting that despite the use of certain waste identification methods in the company, most problems had not been documented earlier; even if they were noticed, they were ignored due to the seemingly small scale of the entire production line. Only their analysis in terms of separate organizational units, and their expression in quantitative form, resulted in corrective actions being taken.
Different solutions were implemented in the form of:
reorganization of the place for the storage of materials delivered irregularly,
updating information about the location of elements,
a new standard for marking containers,
a new method of repackaging materials in the warehouse,
repair of the press,
an incentive system,
employee training,
a new standard of preparatory and finishing activities.
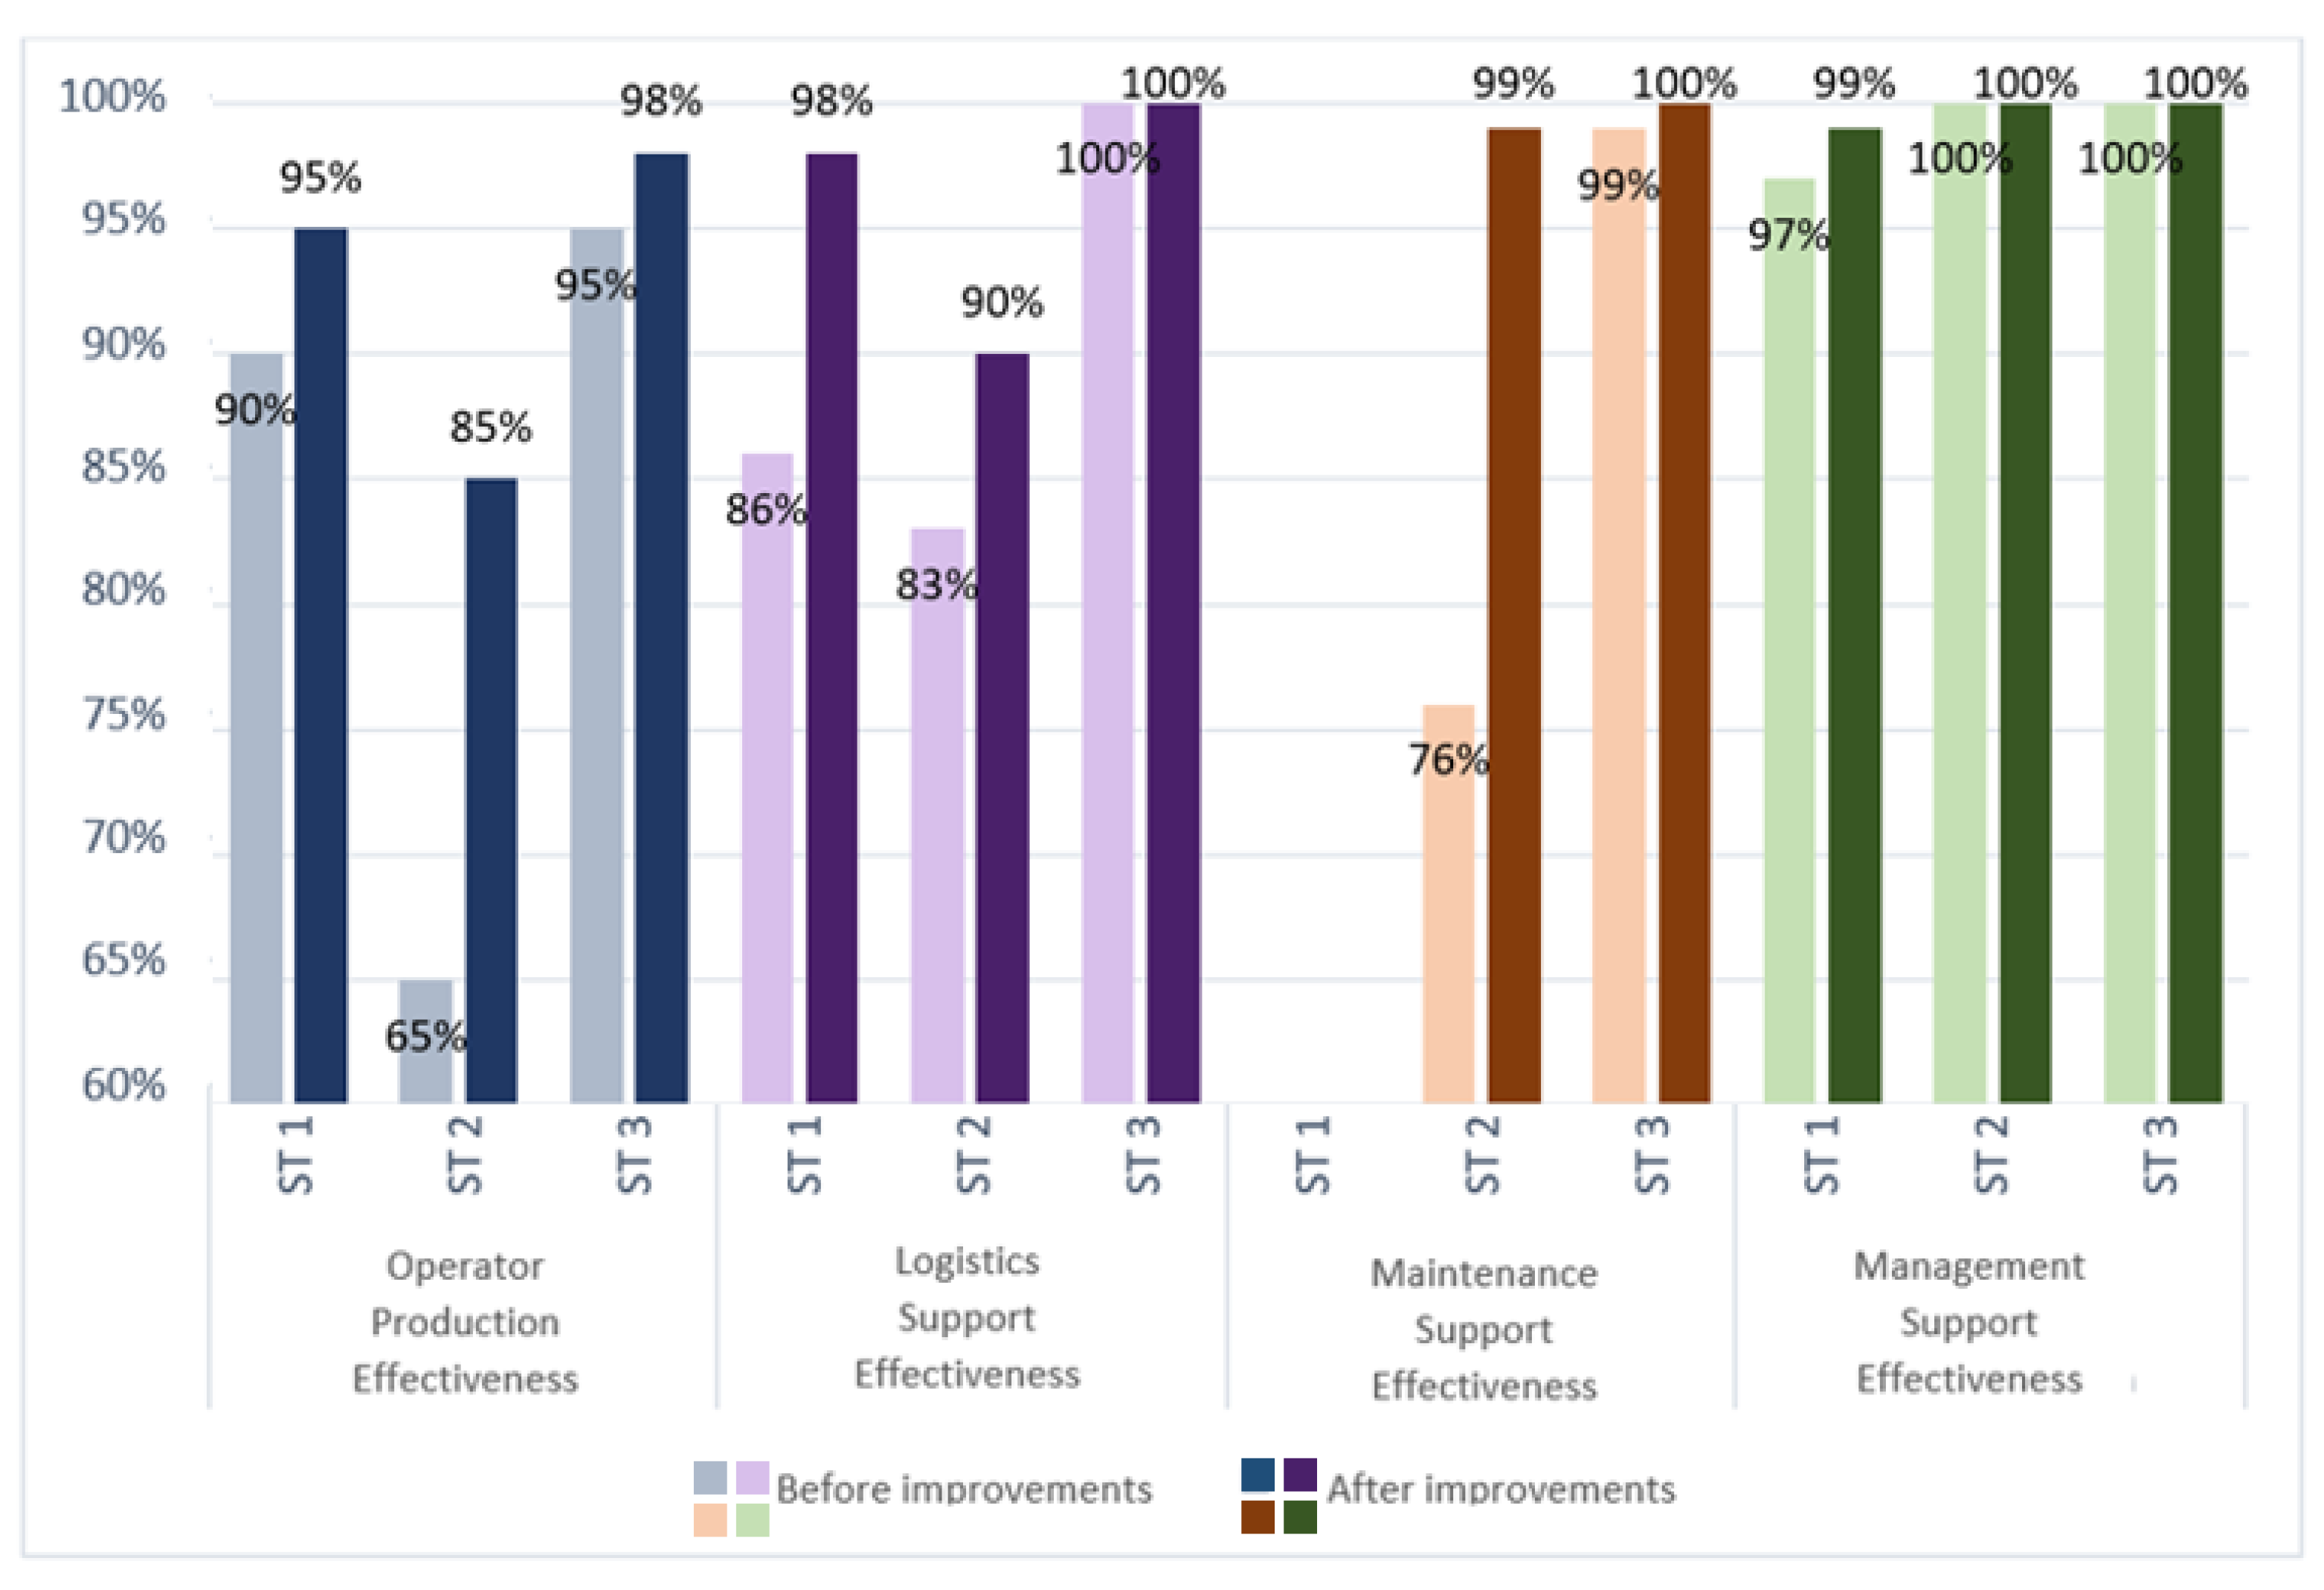
The average value of the effectiveness indicator after the implementation of improvements increased to (
Figure 6):
Figure 6.
Comparison of the average values of the effectiveness indicator for the three workstations after the implementation of improvements.
Figure 6.
Comparison of the average values of the effectiveness indicator for the three workstations after the implementation of improvements.
At the first workstation (
Figure 7), an increase in the values of operator and component availability coefficients was achieved, which means there was a reduction in downtime in these areas. At the second workstation (
Figure 8), the value of the Maintenance Support Effectiveness coefficient improved significantly. This was undoubtedly influenced by the repair of the press, but also the availability coefficients, which proves that there was a relatively large reduction of downtime at this workstation.
For a more complete verification of the method, an analysis of production losses (in the form of downtime and defects) was carried out for the three workstations, both before and after the implementation of improvements (
Figure 9).
Production losses were reduced at each of the workstations.
It can be concluded that the implementation of the method in the analyzed process:
enabled the identification and categorization of production losses,
allowed problems to be presented in numerical form for each of the categories, in turn enabling the comparison of current values with the initial state,
facilitated the reduction of production losses,
confirming that the application of the method enables the monitoring of categorized production losses in the form of quantitative indicators, and also facilitates the reduction of these losses.
6. Conclusions
The author’s contribution to the academic literature is the development of a new method of assessing the effectiveness of the use of available resources when implementing production processes and verification of its applicability in the actual production process of the automotive industry. The method was developed in response to the research gap identified in the literature review [
2,
14,
16,
17,
27,
28,
29,
30,
31,
35,
36,
37,
38,
39,
40,
41], which showed that there is a lack of a quantitative method for assessing the production processes effectiveness, which, taking into account the categorization of the production losses, would allow at the same time to evaluate the main areas (production and production-related) contribution in the generation of these losses. The literature review of the latest research in the field of manufacturing engineering [
7,
19,
20,
21,
22,
23,
24,
25,
26] showed that researchers are currently focusing more on developing digital tools for Industry 4.0 than on assessment methods. Since the method is complex and detailed, it can be used to support the verification of solutions used in multifactor processes—especially in the coming era of Industry 5.0, which emphasizes human collaboration with other resources.
The main purpose of the method is to assess the effectiveness, availability, performance and quality in the implementation of production processes by operators, as well as in the execution of production-related processes (logistics, maintenance, organizational) by identifying production losses in given areas.
The method is designed to control the effects of production realization, so its main area application area is manufacturing enterprises. Since the measurements carried out for the purposes of the method concern production losses, the method can be applied practically anywhere where such losses may occur. Due to the categorization of losses and the numerical nature of indicators, the method can be applied for any production company, for any level of organization, for any period of time, independently for a selected area, or even for a selected factor in a selected area. A fundamental requirement for the method’s success is a standardized scope of duties of the units involved, so that both employees and evaluators know precisely the competencies of each area—the weaknesses of the method, besides the time-consuming process of data collection and analysis and the possibility of human error, are doubts about obtaining reliable results in enterprises with a non-standardized scope of duties. It is recommended to conduct the measurements during the company’s standard work period (outside of vacations or external audits) to obtain reliable data. The time for collecting measurements should be adjusted according to the complexity of the processes and the purpose (shorter if there is a general assessment of efficiency after implementing some improvement, longer if there is a need to identify the specific cause of some problem).
The application of the method to a company from the automotive industry confirmed the validity of the assumption that its effectiveness is influenced by various factors, and not only the operation of machines. Therefore, the extension of the standard OEE method with loss categorization made it possible to fill the research gap.
Further research could include the following:
extending the scope of the method to include new areas or assessment of cooperation with suppliers,
application of the method to other production companies, e.g., to identify the spare capacity or to select the employees for production operations not only based on the competency matrix, but also on the results of the employees’ effectiveness within the scope of possible duties,
integrating production effectiveness results with financial results,
integrating the method with the Andon system,
combining the method with intelligent optimization algorithms in order to select employees for the relevant tasks in more complex systems.


