Article

Evolution Laws of Stress–Energy and Progressive Damage Mechanisms of Surrounding Rock Induced by Mining Disturbance

1
State Key Laboratory of Coal Resources and Safe Mining, School of Mines, China University of Mining and Technology, Xuzhou 221116, China
2
Jiangsu Engineering Laboratory Mine Earthquake Monitoring & Prevention, School of Mines, China University of Mining and Technology, Xuzhou 221116, China
*
Author to whom correspondence should be addressed.
Appl. Sci. 2023, 13(13), 7759; https://doi.org/10.3390/app13137759
Submission received: 28 March 2023 / Revised: 23 June 2023 / Accepted: 26 June 2023 / Published: 30 June 2023

Abstract

:
The rock burst induced by the mutual disturbance of mining and excavation is significantly influenced by high static load stress and external dynamic load disturbance. In this paper, the evolution characteristics and progressive damage mechanism of surrounding rock in the process of mutual disturbance of mining and excavation are systematically studied. The results show that the evolution of surrounding rock stress can be roughly divided into three stages: rapid rise in the early stage, continuous rise and step-like decline in the middle stage, and slow rise in the late stage. In the process of parallel mining, the overlying rock movement above the goaf shows the sequence of horizontal penetration of tiny fissures—fracture intensification transition to stratification—non-coordinated caving of middle–low overlying rock—obvious horizontal cracks in the upper key layer. Only under the quasi-static loading mining action does the upper key layer not reach the breaking condition. The wave side of the heading face which is close to the focal point is affected by the dynamic load disturbance, the acceleration duration is short, and the attenuation is relatively fast, so it is the area prone to the earliest impact failure in the face of mining disturbance. The conclusion is helpful to deepen the understanding of the coal burst mechanism of mutual disturbance of mining and excavation.

1. Introduction

Mining in a world is extending to deeper and deeper levels, facing ever-increasing stress, gas pressure, and gas content conditions in production districts. Mining-induced high-stress concentrations often result in rock bursts. These events not only form a serious safety risk but also represent a problem for coal production and the mines’ economy. Two more recent rock bursts, which occurred in 2022 and 2018 at Zofiówka Colliery in Poland, resulted in ten and five fatalities, respectively. Many other examples of rock bursts and gas and coal outbursts can be referred to from the coalfields of China [1,2,3], Ukraine, Turkey, Kazakhstan, etc. as reported in the literature [4]. Rock burst is caused by the sudden and violent release of elastic energy stored in coal and rock masses, accompanied by strong vibrations and causing severe damage to the roadways and casualties [5]. As the longwall face retreats, the static stress of the coal seam experiences a gradual increase from close to the in situ stress to the peak strength, and then gradually decreases due to the damage and failure of the coal mass. In this process, the dynamic disturbance suffered by the coal and rock is not negligible [6,7,8]. The dynamic disturbance, such as mining-induced seismicity, blasting, and hydraulic fracturing, propagates outwards in the form of vibrational waves and continuously acts on the coal rock mass and causes damage, especially in areas with high static stresses [9,10]. Therefore, it is of great significance to understand the mechanism of rock burst triggering by understanding the evolution characteristics of rock force and energy and the progressive damage mechanism of rock burst.
For a long time, the study of mutual disturbance and impact mechanism of mining is one of the important topics in the field of accurate monitoring and prevention of rock bursts. Ji et al. [11] established a dynamic coulomb failure stress increment model for the quantitative evaluation of mining disturbance effects. Cai et al. [12] put forward a quantitative analysis potential model of mining disturbance by analyzing the spatio-temporal strong law of mining earthquakes induced by the mining fault in Huotai Mine. Li et al. [13] quantitatively revealed the internal relationship and mechanical mechanism between mining disturbance and energy release of mine earthquakes. Nooraddin Nikadat et al. [14] investigated the stress distribution around the tunnels excavated in jointed rock masses by a fictitious stress displacement discontinuity method. Characteristic of reproducing fault activation process with the experimental design of coal seam mining stress path, Hu [15] explained the force–sound–deformation evolution law of the fault activation process under the disturbed stress path of coal seam mining. Han et al. [16] identified the main characteristics that have a great influence on the movement of postharvest strata along the goaf retaining roadway. The roof strata dominated by key strata collapsed to form bidirectional periodic pressure and superimposed disturbance, which made it difficult to maintain the goaf retaining roadway for a long distance. Peng et al. [17] studied the floor failure characteristics in the process of continuous coal seam mining disturbance and showed that the stability of overburden in a large range was reduced due to the influence of repeated mining pressure caused by continuous coal seam mining. Guo [18] et al. have analyzed the spatio-temporal rotation characteristics of the principal stress in the surrounding rock of the roadway under mining disturbance and optimized the layout scheme and blasting parameters of the blasting pressure relief hole according to the principal stress rotation characteristics under the dual influence of mine seismic disturbance and goaf. Liu [19] et al. believed that under the effect of repeated mining disturbance, the coal pillar failure degree reached 90%, which was already in the state of failure. Qi [20] et al. comprehensively adopted theoretical analysis and numerical simulation to reveal the failure mechanism of surrounding rock under intense mining disturbance of thick coal seam and verified it through field measurement results. Su [21] et al. believe that roof impact disturbance in goaf is usually one of the important factors causing the instability of coal pillar and rock pillar, and the impact of impact frequency on the vertical deformation and plastic zone occupancy of coal pillar is more obvious than the impact of impact intensity. In summary, previous studies mainly focused on the evolution of the stress field and energy field under the influence of external mining disturbance on a single working face, and few studies on the influence of mining mutual disturbance on multiple mining faces. The conclusions obtained are not enough to guide monitoring and prevention of disturbance-type impact. Therefore, it is necessary to strengthen the research on the evolution characteristics of force and energy and the mechanism of progressive damage-induced shock in the process of excavation mutual disturbance.
Based on the experimental background of the Y394 working face and the roadway in the Nanwu Mining area, Tangshan, the evolution law of surrounding rock force and energy and the progressive failure mechanism in the process of mutual disturbance of mining and excavation are experimentally studied by using the self-developed dynamic/static combined similar simulation experimental platform. The evolution law of static stress at different measuring points in the process of excavation disturbance is compared, the motion characteristics of overlying rock when the working face is mined to different positions are discussed, the stress evolution and acceleration response characteristics of surrounding rock under the impact dynamic load with different strengths are compared, and the progressive failure mechanism of surrounding rock under the action of different pendulum heights is expounded. The research results can enrich the understanding of the trigger mechanism of mining disturbance.

2. Similarity Simulation Experiment Design

2.1. Experimental Similarity Ratio

This similar material model test takes the working conditions of the Y394 working face and large roadway in the Nanwu Mining area of Kailuan Group, Tangshan Mine Yuexu District as the test background. The working faces mainly mines coal in 8 and 9# combined area, with a thickness between 7.8 m and 9.8 m, with a thickness of 8.8 m. Coal seam dip Angle 21~37°. The buried depth of the working face is about 703.5~885.5 m, and the coal mining method of comprehensive mechanized top caving with strike long wall is adopted. It is assessed that Y394 working face has moderate impact risk. The large roadway in the Nanwu Mining area affected by opposite mining and excavation adopts a rectangular section design, and the roadway size is 5.5 × 3.5 m. According to the first theory of geometric similarity, the second theory of physical phenomenon similarity, and the third theory of initial boundary condition similarity [22], the main technical parameters adopted by the similarity model are determined as shown in Table 1.
According to the above real coal measure formation parameters and ratio principle, combined with the laboratory uniaxial compressive strength test results, the optimal ratio number of consolidations in the similar simulation test is obtained. According to the length, width, rock thickness, and geometric similarity ratio of the model frame, the volume of each laid coal rock can be calculated, and then the weight of each coal rock can be calculated according to the ratio and density of the consolidated material.

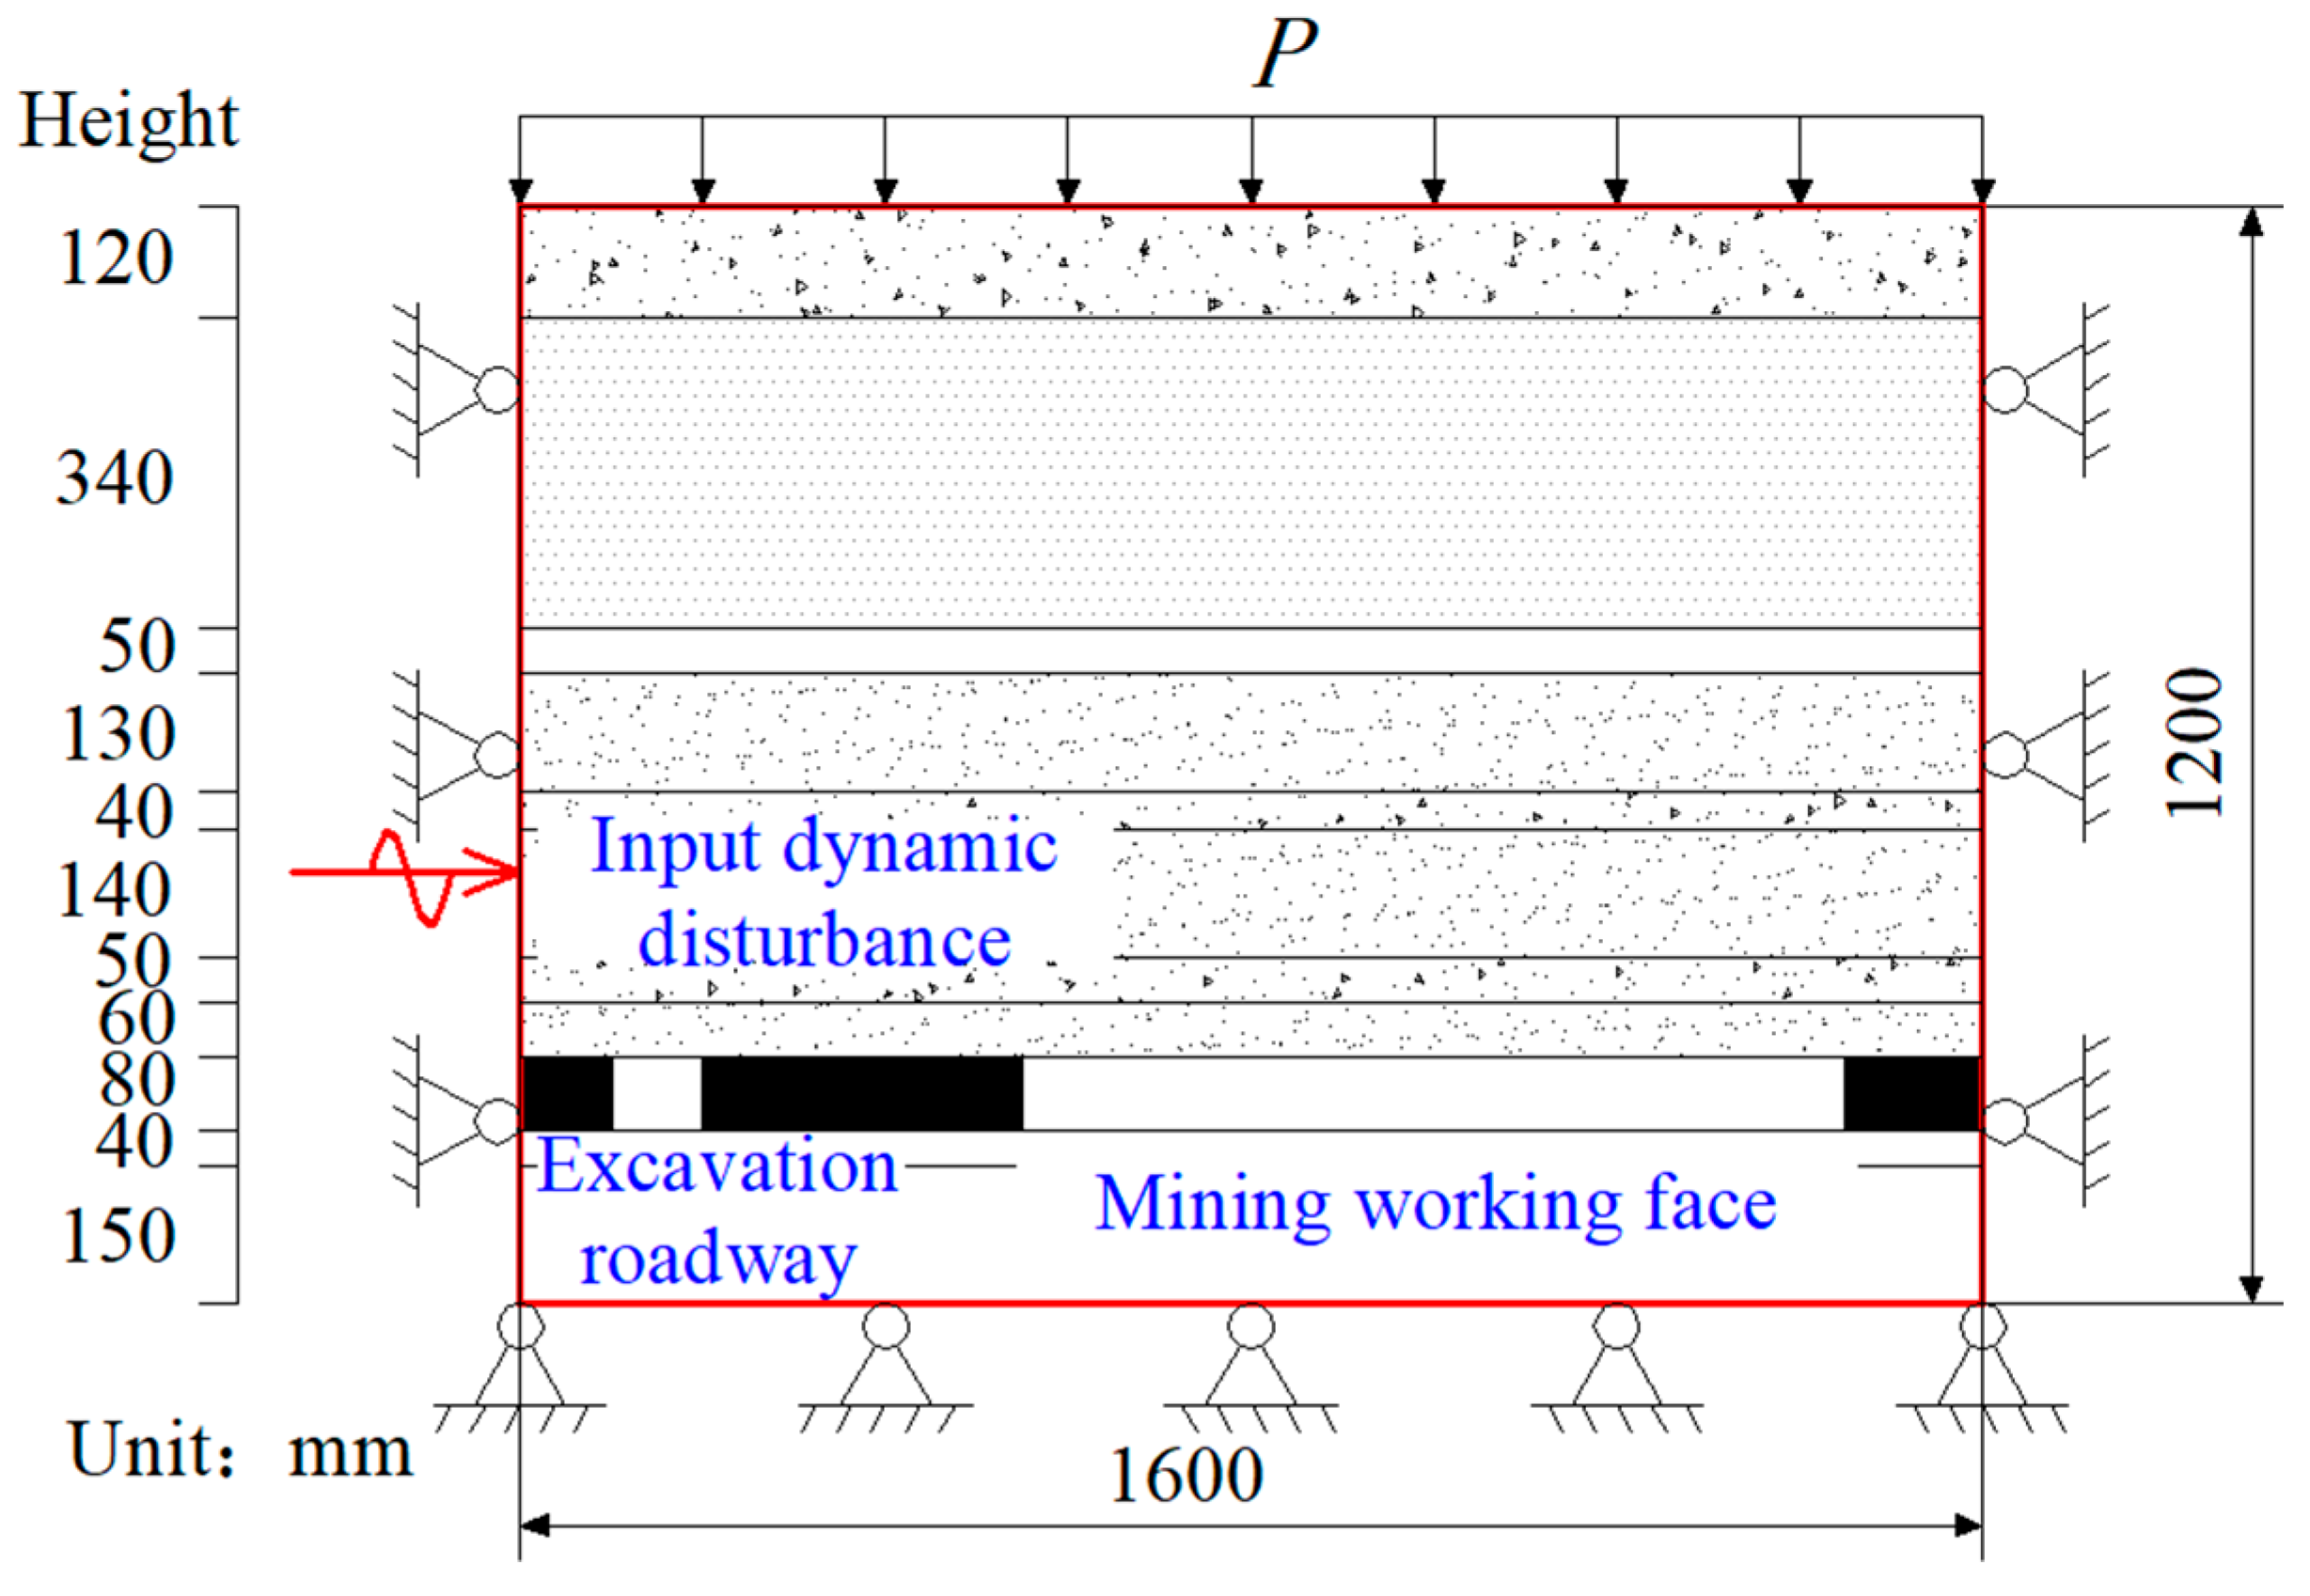
2.2. Model Building Scheme

The large-scale similarity simulation experiment system of the State Key Laboratory of Coal Resources and Safe Mining, China University of Mining and Technology, was adopted in this similarity simulation experiment; the combined dynamic and static load similarity simulation experiment platform is shown in Figure 1. The model frame size of the platform is 1.6 m × 0.4 m × 1.2 m (length × width × height). The platform mainly realizes the adjustment and loading of dynamic and static loads through the control device of the control console. The static load device realizes the application of uniform load on the upper part of the model through the lifting of the loading plate of the hydraulic cylinder. The dynamic load loading device exerts impact dynamic load on the side of the model through the free fall of the pendulum on the left side of the electric control platform and hitting the slide rod [23]. The upper boundary is loaded by a hydraulic cylinder to simulate the real stress field. The left and right boundaries and the lower boundary are constrained by horizontal displacement.
Based on the actual occurrence conditions of a coal seam in the simulation prototype, the average buried depth of the coal seam working face in this similar simulation experiment is about 800 m. The laying height of the model frame is 1.2 m, so the seam floor in the model is 0.19 m away from the bottom boundary of the model frame, and the seam roof is 0.93 m away from the top boundary of the model frame. The upper boundary load of the model is 0.105 MPa. To prevent the model from collapsing due to excessive extrusion pressure along the free surface during the top loading process, half of the actual value of the boundary load is taken based on the boundary load, that is, 0.052 MPa, and the corresponding load is 13.4 KN. The structure size of a similar simulation test is shown in Figure 1.
As shown in Figure 1, a driving roadway and a stopping face along the strike are arranged in the coal seam. The section size of the driving roadway is 80 × 60 mm, and a 150 mm coal pillar is set between the working face and the right boundary to eliminate the influence of the boundary effect of the experimental platform.
In the experiment, the Digi-Metric three-dimensional photogrammetry system was used to monitor the deformation characteristics of roadway overburden. The stress test system of the ZC40 YL physical model was used to monitor the pressure evolution law of the surrounding rock. CJ-ALW4/8 dynamic vibration fault diagnosis and analysis system combined with CJ-YD0000 IEPE acceleration sensor was used to monitor the dynamic response law of surrounding rock under impact dynamic load. Memrecam GX-3 high-speed camera system was used to monitor the transient dynamic failure characteristics of roadway surrounding rock under impact dynamic load.

2.3. Experiment Data and Methods

After the model is established and each monitoring system is prepared, the test stage of the model test is formally entered, including simulation of initial in situ stress field, installation and commissioning of the monitoring system, excavation of roadway, phased excavation of stope face, and loading impact dynamic load, etc. The specific process is as follows:
(1)
Start the electric control loading system and control the hydraulic cylinder to apply a uniform load on the top of the model to simulate the initial ground stress field;
(2)
Connect the pressure sensor connection line with the static resistance strain gauge acquisition channel one by one according to the number in the layout scheme, calibrate and zero the reading of the pressure test system, and start recording. A total of 40 pressure sensors are installed;
(3)
According to the layout plan, the four acceleration sensors are arranged in the designated positions respectively, and the acceleration sensors relate to the vibration signal acquisition instrument. After the quasi-static excavation is completed, the recording starts before the impact dynamic load is applied;
(4)
Adjust the optimal position of the dynamic high-speed camera system, and start recording before the impact dynamic load is applied;
(5)
Excavation roadway, section size of 80 mm × 60 mm (height × length). Then, the stope face is excavated step by step, with a total length of 900 mm. For the excavation method of driving in the opposite direction and stopping face, the driving face is first excavated, and then the stopping face is excavated after standing for 8 h. Each cycle of excavation is 5 cm, representing the actual advancing distance of the stopping face is 5 m. A total of 18 cycles of excavation are completed. At the same time, the internal pressure, surface displacement, and roadway deformation and failure characteristics of the model were observed;
(6)
After the mining face excavation is in place, the electric control system controls the pendulum falling freely from different heights to simulate the impact dynamic load. At the same time, the internal pressure, surface displacement, roadway deformation and failure characteristics, acceleration, and velocity of the model are observed and recorded until the surrounding rock of the roadway is destroyed, and the test is finished.
By adjusting the pendulum falling from different heights to simulate the impact dynamic load of different strengths, according to the design data of the platform, the weight of the pendulum is 20 kg, the length of the pendulum is 1.0 m, and the maximum height that the pendulum can be lifted is 2.0 m. Therefore, the maximum gravitational potential energy that can be input is, and according to the energy similarity ratio of 1.67 × 10⁴, the maximum potential energy that can be simulated in practice is about 6.55 × 10⁶ J, which is roughly equivalent to the value of the maximum mine shock energy generated by the rock burst during on-site production. Therefore, the impact dynamic load can effectively simulate the external mine shock disturbance in the process of coal mine production. Pendulum height and simulated energy are shown in Table 2.

3. Result

3.1. Progress of Stress–Energy of Surrounding Rock during Mining Excavation Disturbance

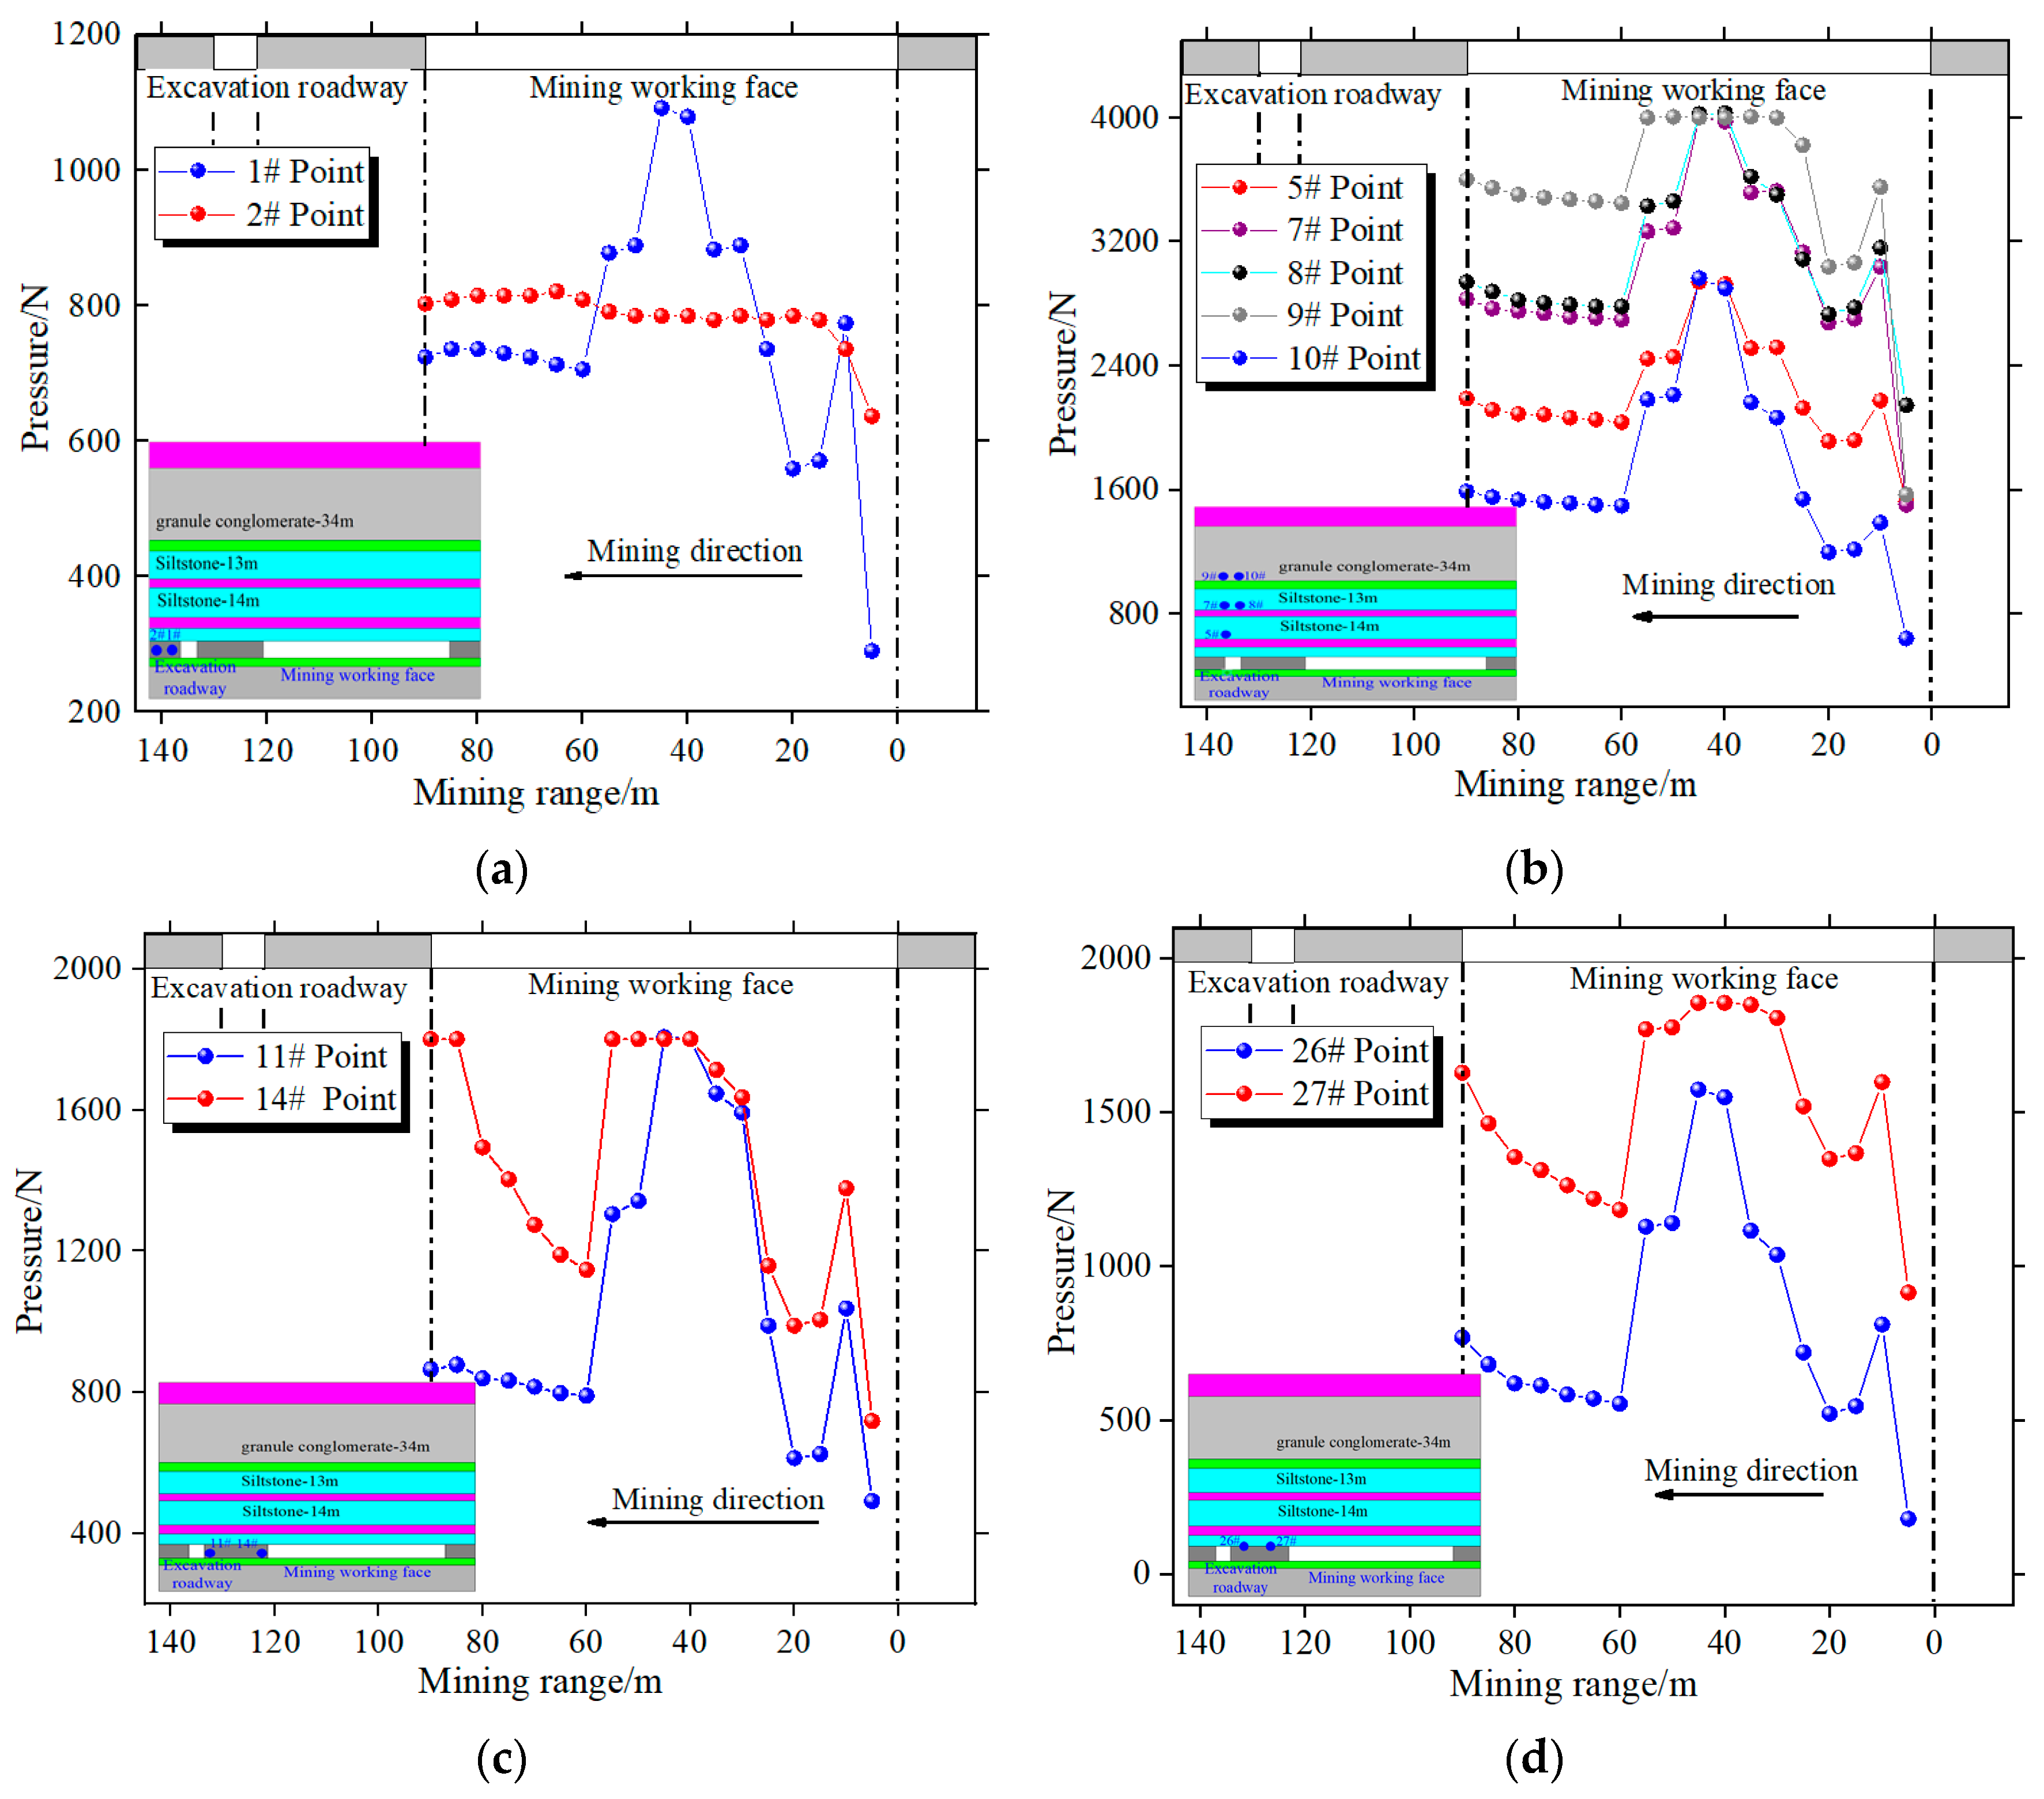
3.1.1. Stress Evolution in the Process of Mining Excavation Disturbance

In this similar test, a total of 40 thin-film pressure sensors were arranged, among which 13 sensors failed to collect effective data due to reasons such as false vibration of the consolidation material and water intake of the sensors. The monitoring data of the remaining 27 sensors were analyzed with emphasis. The stress analysis started from the excavation of the working face, and the formal excavation of the mining face, and stopped after the completion of the excavation of 18 cycles.
As shown in Figure 2a, 1# and 2# monitoring points are located at the coal body floor on the left side of the heading face, 3 m and 6 m away from the left side of the roadway, respectively. In the early stage of working face stopping (5~20 m), the pressure at measuring point 1# rapidly rises to the second highest value and then slightly decreases. When the mining of the working face is in the range of 20~45 m, the advanced abutment pressure moves forward continuously, which results in a significant stress concentration under the influence of the opposite mining and mining disturbance. The pressure of the measuring point rises to the highest value again, which is 1092 N. When the mining range of the working face is 50~60 m, due to the plastic failure of surrounding rock the mining face, the pressure starts to drop like a step. When the working face is mined 65~90 m, the overburden movement is stable, and the stress is gradually maintained at a certain level. Relatively speaking, the 2# monitoring point only showed an upward trend at the initial stage and then remained stable.
Next, 5#, 7#~10# monitoring points are in the middle and high roofs of different levels above the excavation face, 11 m, 29 m, and 47 m away from the roadway roof, respectively. It can be seen that, except for the measuring point 10#, the farther away from the coal roadway roof, the less influenced by the stopping face, the higher the roadway integrity, so the higher the relative pressure value. The overall law in the mining process of the working face can be roughly divided into four stages: the rapid rise and slight decline in the early stage, continuous rise to the extreme value, step-like decline in the middle stage, and slow rise in the late stage.
Monitoring points 11# and 14# are in the central coal pillar between the excavation face and the mining face. The evolution law of the two sensors is consistent in the first three stages, and the difference appears in the fourth stage. The pressure value of sensor 11# rises slowly as it is closer to the excavation. Sensor 14# is closer to the stopping position of the working face. When the working face is stopping 65~90 m, the overlying rock constantly deforms and the stress of the overlying rock is transferred to the coal pillars on both sides. Therefore, the pressure of sensor 14# gradually jumps to the extreme value, indicating that the stopping position near the working face is still significantly affected by the stopping disturbance.
Monitoring points 34#, 35#, 39#, and 40# are in the mid and low roof of the stopping face and the central coal pillar, respectively. The distance from the working face is 11 m and 47 m, respectively. The evolution law of these measuring points in the first three stages is the same; that is, the rapid rise in the early stage and a slight decline, then a continuous rise to the extreme value, and a step-like decline in the middle stage. After mining, the direct roof rises along with mining, while the old roof breaks step by step, with the periodic adjustment of surrounding rock stress. At the end of mining, the 35# sensor above the working face is in the fracture zone, the surrounding rock damage develops to the interior, and the stress decreases significantly. The pressure value of sensor 34#, which is located directly above the stop-mining position, increases significantly to the maximum range of the sensor due to the fracture of the old top of the working face and the formation of an articulated rock beam structure. The 39# and 40# sensors are in the high key layer, which is less affected by the disturbance of mining and excavation under static loading and shows a slowly increasing trend.
To sum up, the basic law of stress evolution of roadway surrounding rock under the influence of opposite mining and excavation disturbance is as follows:
(1)
The internal stress evolution of the excavation face, central coal pillar, and mining face surrounding rock can be divided into four stages: the rapid rise and a slight decline in the early stage, continuous rise to the extreme value later, the step-like decline in the middle stage, and rise in the late stage;
(2)
Around the roadway excavation, the farther away from the roadway, the smaller the impact of mining and excavation, and the lower the stress concentration;
(3)
Under the influence of mining, the integrity of the surrounding rock is damaged, and the cracks expand gradually, leading to a certain degree of pressure reduction;
(4)
The stress peak of the mining face appears at a place about 20~25 m ahead of the mining face, and the impact risk is the highest when superimposed with the mining stress field of the mining face, which is consistent with the theoretical calculation results;
(5)
Under the influence of quasi-static stopping, the upper key stratum has not reached the breaking condition, and the pressure is stable.

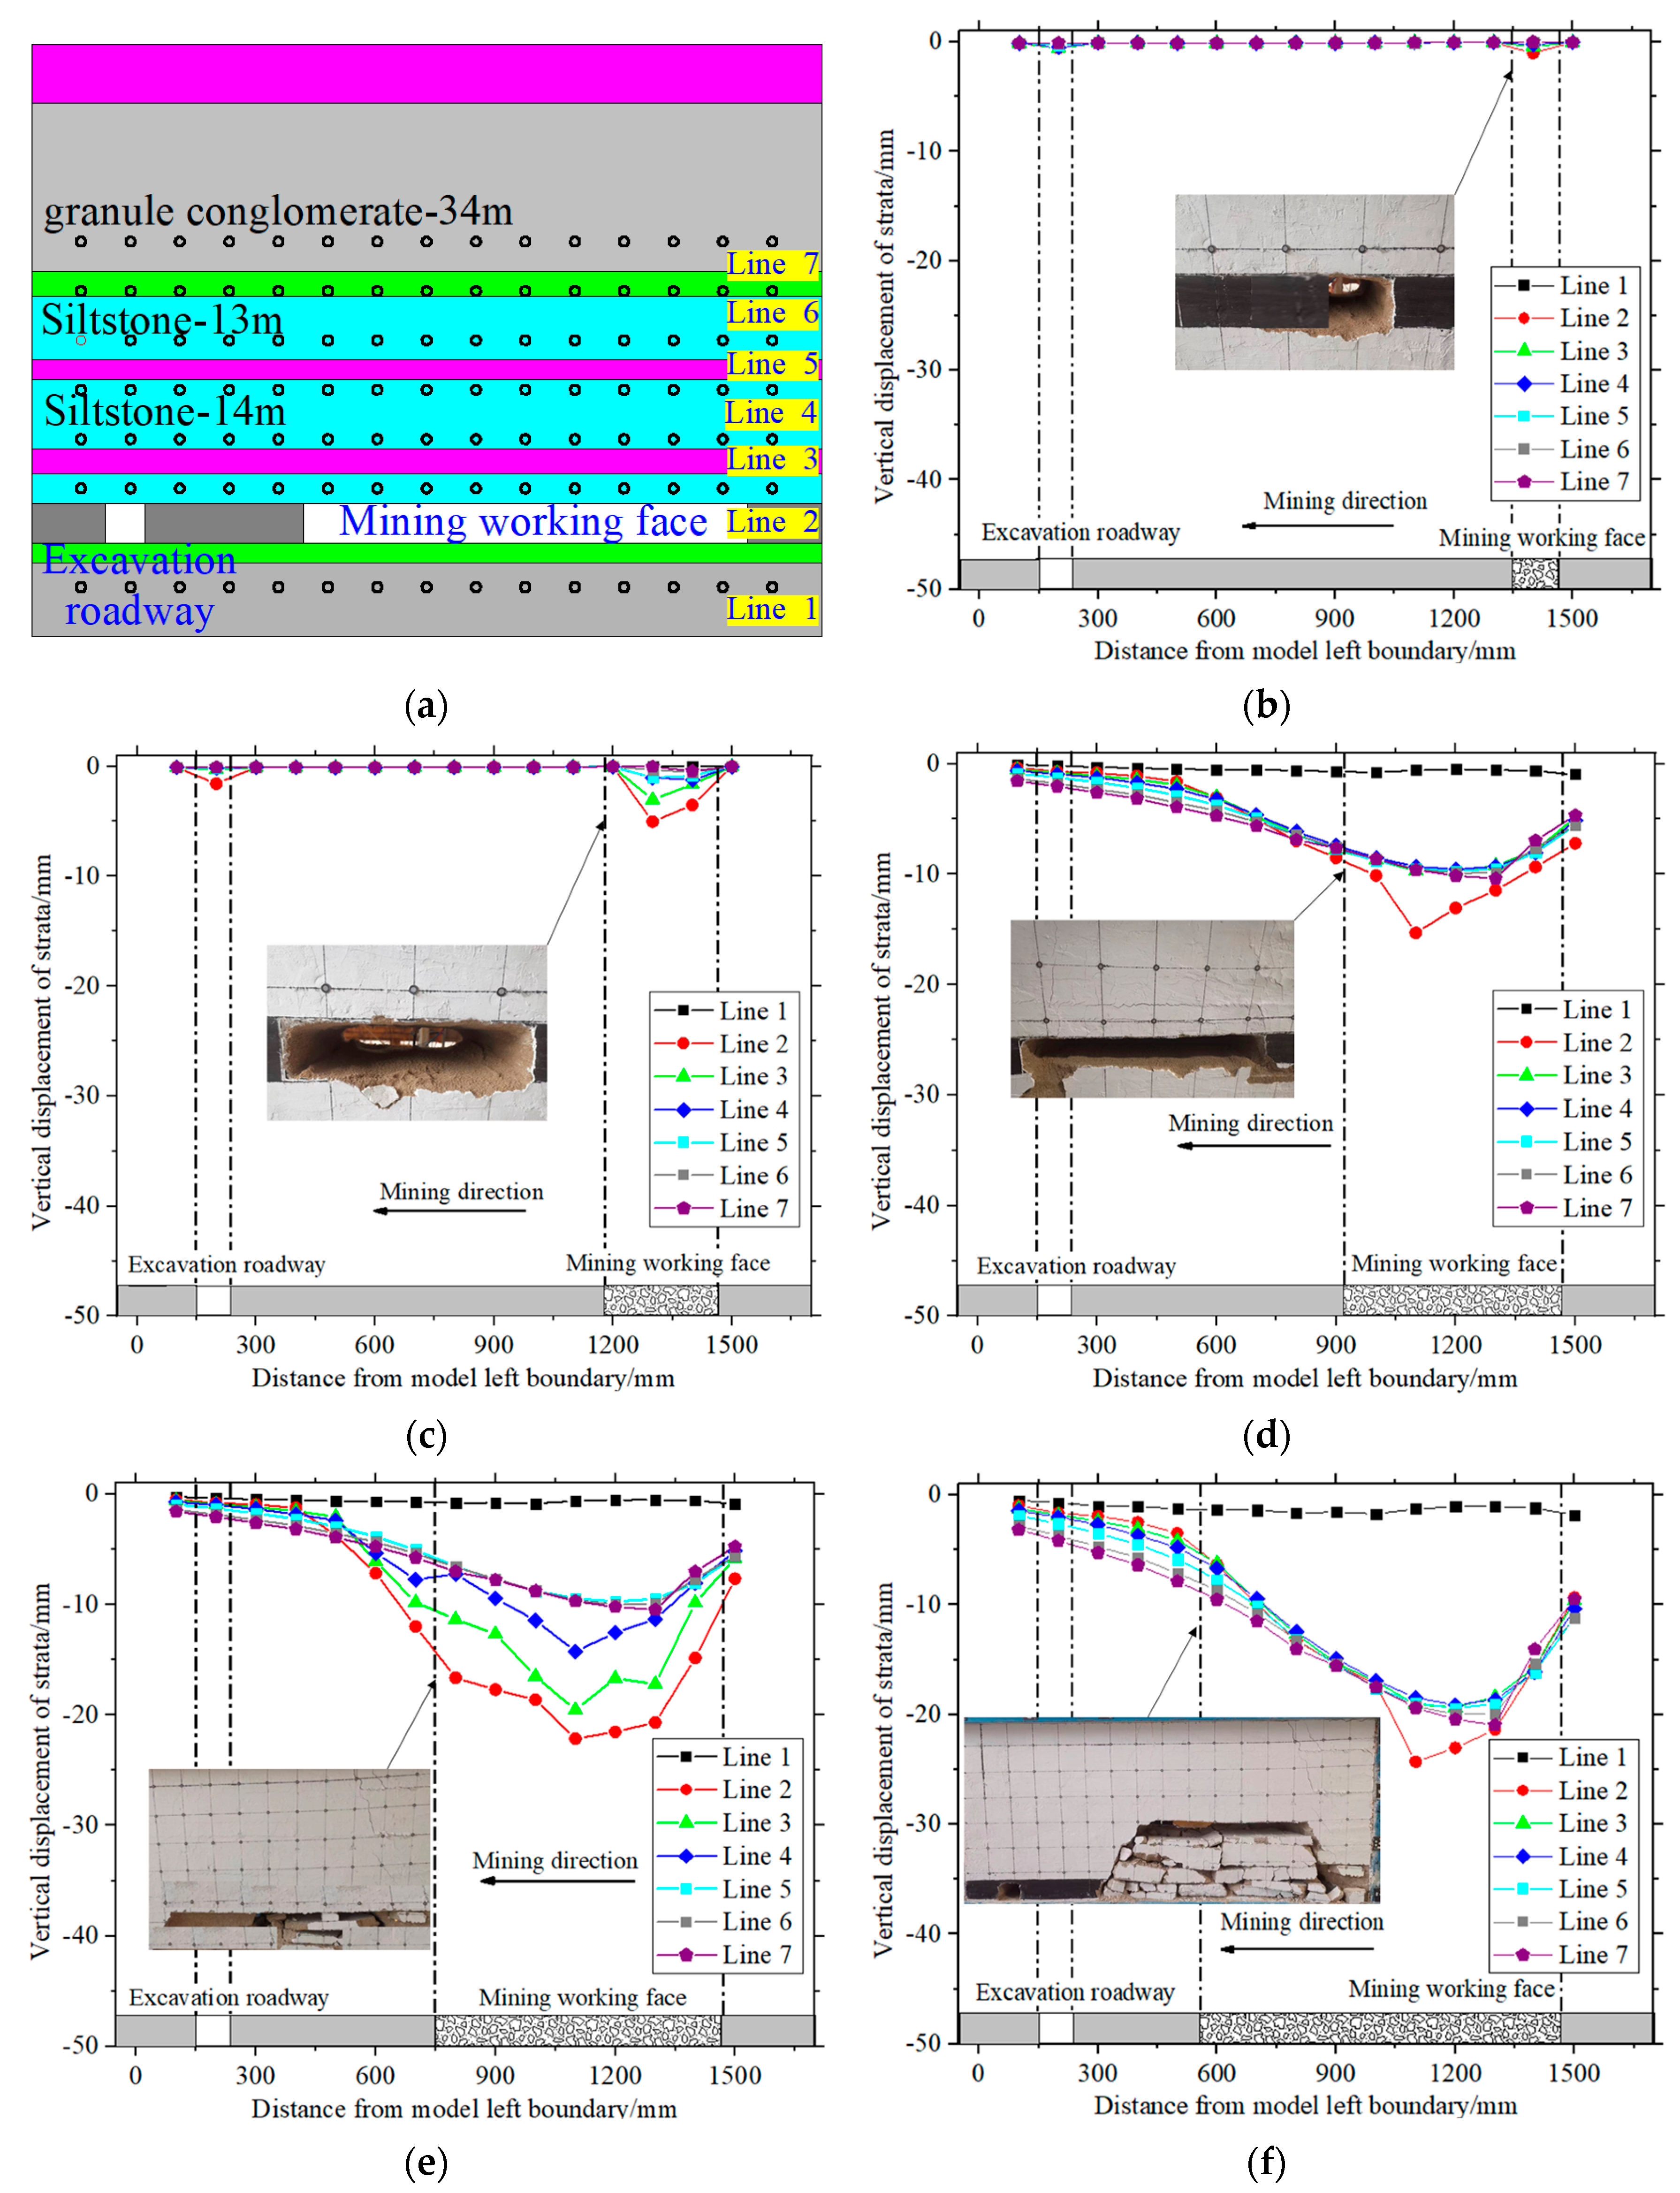
3.1.2. Overburden Migration Law in the Process of Mining and Excavation Disturbance

In this similar test, a total of 11 displacement marker survey lines were arranged. Since the upper and lower protection baffler and coal seam covered four of them during the test, seven representative survey lines were selected in this paper to obtain the overburden migration law in the process of mining and excavation disturbance.
When the working face is mined at 10 m, the overburden deformation and failure range are very small due to the short mining-out length. Under the influence of tunneling, the actual subsidence of the direct roof of the roadway in the original tunneling face is about 0.57 mm (the subsidence in the prototype is about 0.06 m). In the direct roof of the coal seam with a thickness corresponding to the goaf above the tunneling roadway and the mining face, there is no obvious flexural deformation. The peak value of the vertical displacement of siltstone corresponding to the middle of the goaf is about 1.0 mm (the subsidence in the prototype is calculated to be 0.1 m). At this time, the heading face has not begun to be disturbed by the mining face facing the opposite direction.
When the working face is mined 30 m, the damage range of overlying rock movement further increases with the increase in the gob distance along the strike direction. The peak value of vertical displacement at the corresponding measuring line 2 above the working face is about 5.03 mm (the subsidence in the prototype is about 0.5 m). As can be seen from the figure, obvious horizontal through cracks appear in the immediate roof and there is no obvious separation in the vertical direction. At this time, the distance between the heading face and the stopping face is about 920 mm (calculated as 92 m in the prototype), indicating that the peak value of the corresponding vertical displacement above the heading face is about 1.57 mm (calculated as 0.16 m in the prototype), and it can be considered that the heading face is not affected by the opposite stopping face.
It can be seen from Figure 3d that the overlying rock movement is further intensified at 50 m mining of the working face. It can be seen that except for survey line 1 of the floor, all the other survey lines have significant subsidence, and the peak value of vertical displacement at corresponding survey line 2 above the working face is about 15.31 mm (the subsidence in the prototype is about 1.53 m). At this time, there is an obvious separation between the direct roof and the overlying old roof, and inclined through fractures are formed on both sides of the goaf. At this time, the distance between the heading face and the stopping face is about 720 mm (calculated as 72 m in the prototype), which indicates that the peak value of the corresponding vertical displacement above the heading face is about 2.1 mm (calculated as 0.21 m in the prototype), and it can be considered that the excavation face is slightly affected by the opposite mining face.
When the working face is mined 70 m, the displacement of measuring lines 2~7 increases significantly, and the maximum value still appears in the middle of the working face goaf. Currently, horizontal and vertical cracks occur in the siltstone roof of the coal seam with a thickness of 14 m and the siltstone roof of the coal seam with a thickness of 13 m, while the fine recreate roof of the coal seam with a thickness of 34 m still presents elastic flexural deformation. The peak value of vertical displacement at the corresponding measuring line 2 above the stopping face is about 5.03 mm (the subsidence in the prototype is about 0.5 m). Due to the significant difference in the amount of deformation, the overlying key strata show non-coordinated collapse, and the mining work facing the heading face still plays a disturbing role.
Overburden movement is further intensified when mining is 90 m in the working face, and the settlement curve of measuring lines 2–7 presents an asymmetric funnel-shaped shape. The maximum actual subsidence is 24.3 mm, 20.9 mm, 20.1 mm, 19.5 mm, 19.3 mm, and 19.1 mm, respectively (the estimated subsidence in the prototype is about 2.43 m, 2.09 m, 2.01 m, 1.95 m, 1.93 m, and 1.91 m). As can be seen from the figure, because the seam roof with a mining thickness of 34 m has a less obvious horizontal crack in the fine conglomerate, the inclined through crack on both sides of the goaf is intensified. Currently, the disturbance of overlying rock movement failure in the mining face is the strongest.

3.2. Dynamic Response Characteristics of Disturbed Surrounding Rock under Impact Load

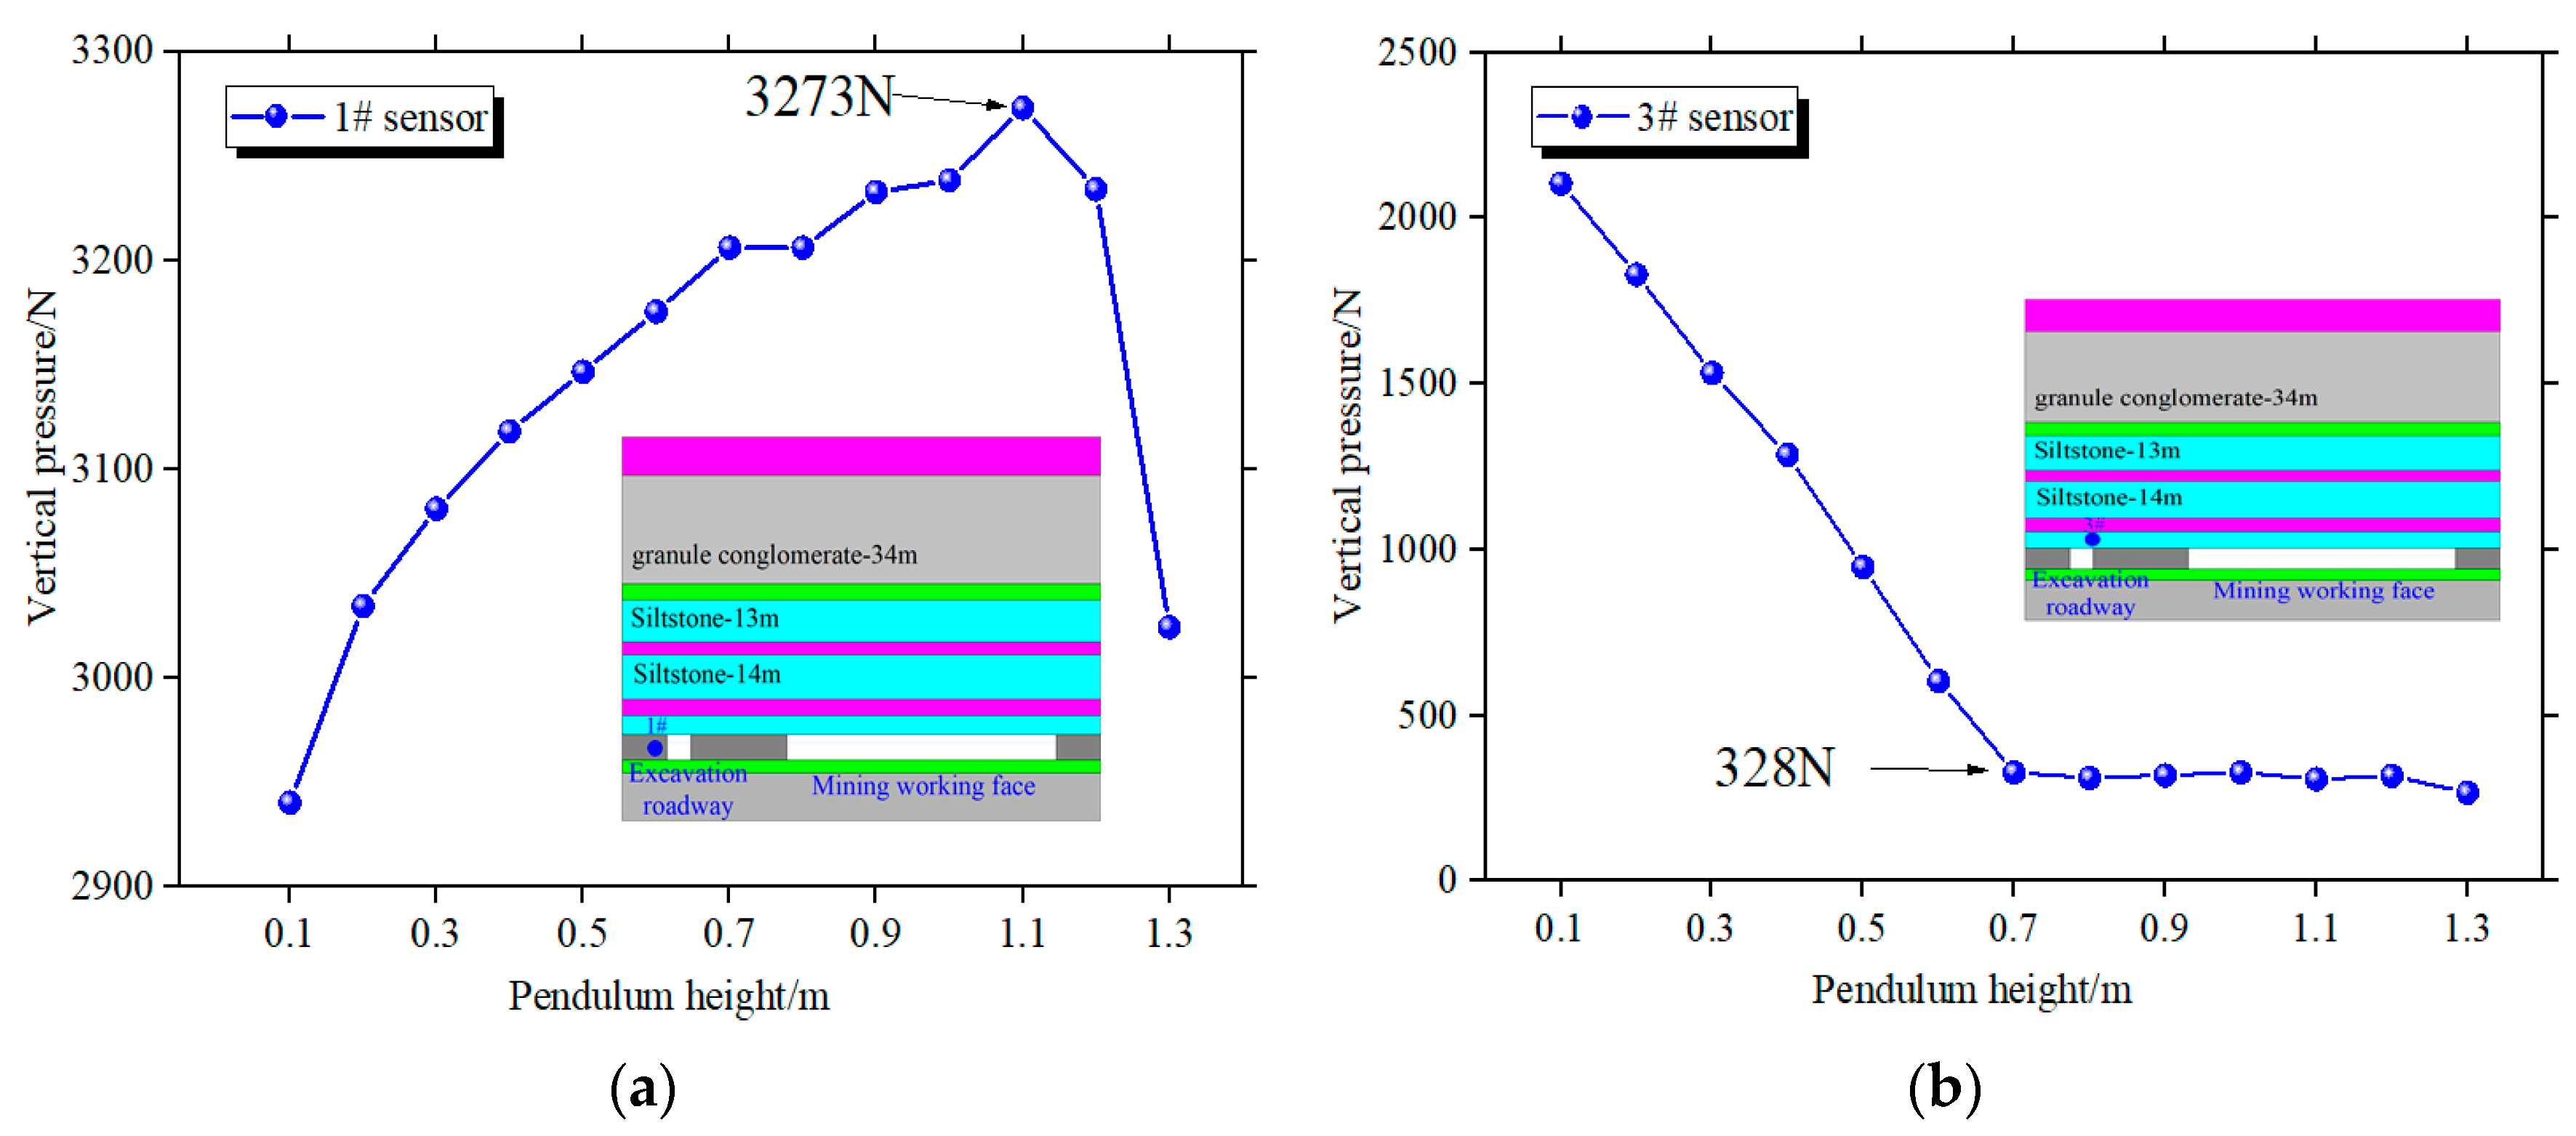
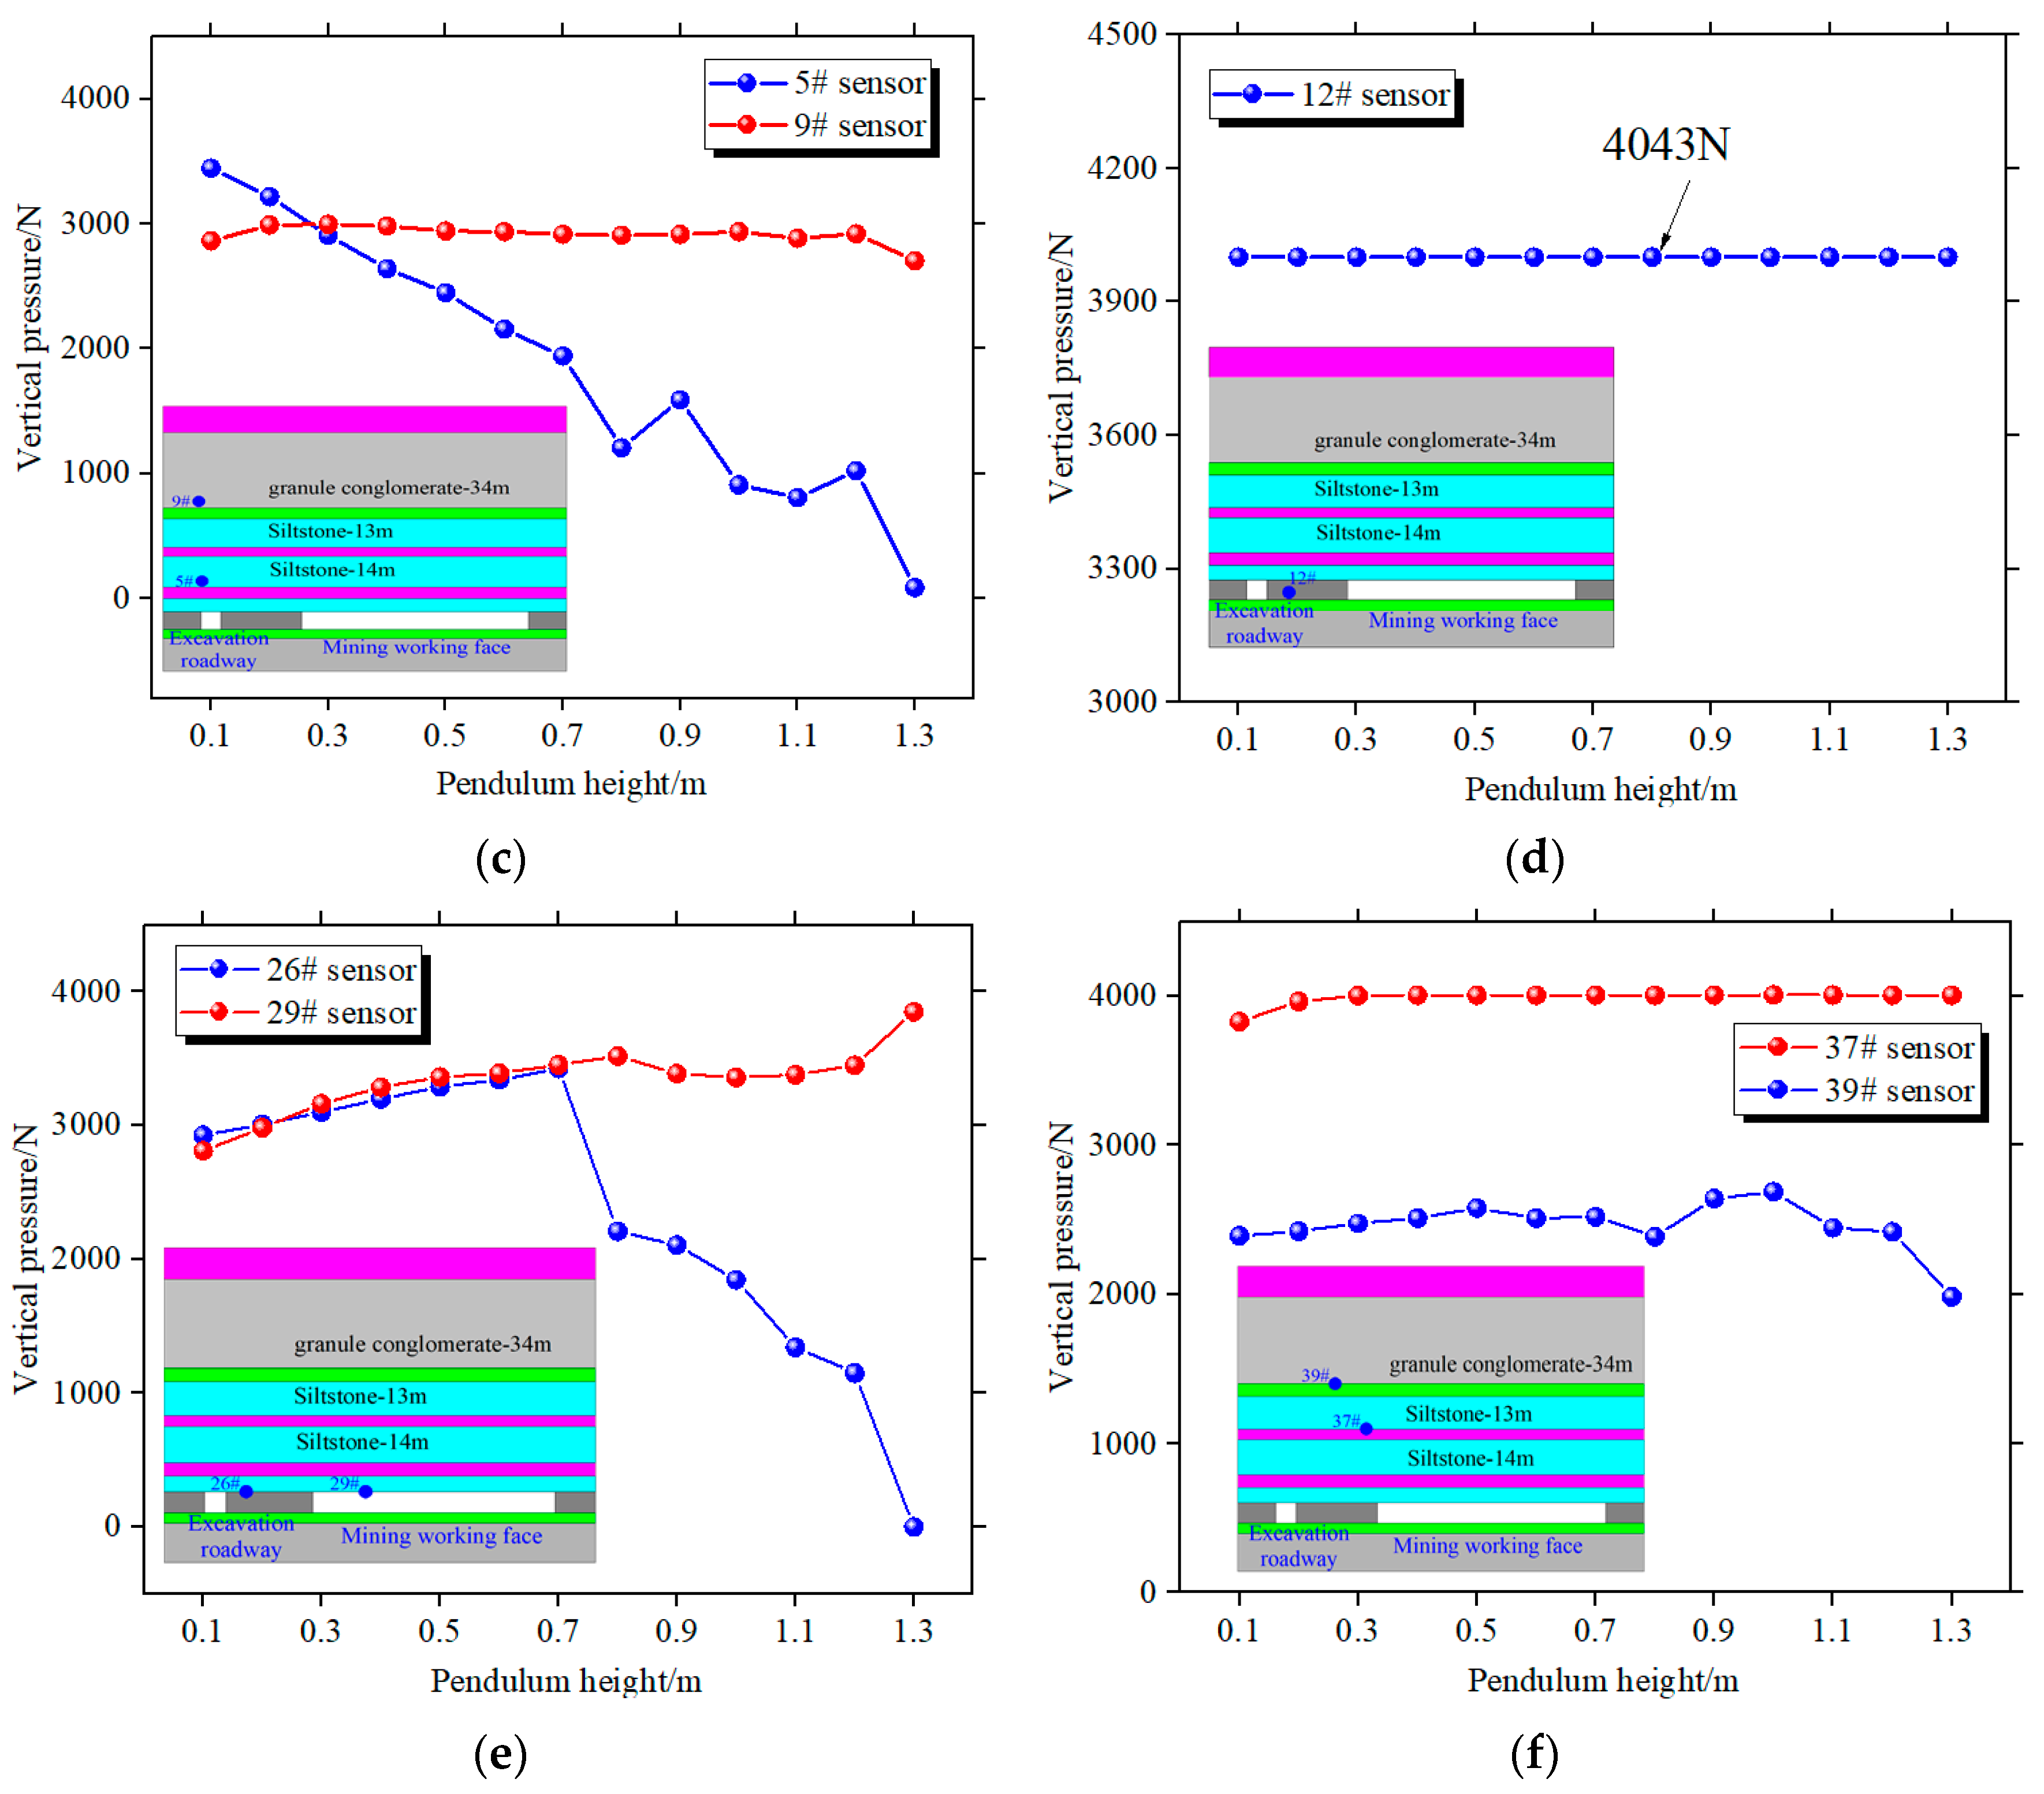
3.2.1. Stress Evolution Law of Disturbed Surrounding Rock under Impact Dynamic Load

The stress values of each measuring point of the model were recorded after each impact dynamic load. Figure 4 shows the stress evolution of measuring points at different positions of the model after the impact dynamic load of different strengths.
When the pendulum height is low, the input impact dynamic load strength is weak. With the increase in the pendulum height, the stress in the coal body on the left side of the heading face gradually increases, indicating that the roadway side of the heading face has considerable self-bearing capacity. The impact dynamic load makes the coal rock mass at the side further compact to a certain extent, and the surrounding rock strength improves. That is, when the height of the pendulum is 1.1 m, the dynamic load strength is about 3.60 × 10⁶ J, and the peak value of surrounding rock stress is about 3273 N. Subsequently, when the height of the pendulum further increases, the surrounding rock stress begins to decrease significantly, and the surrounding rock at the side has been destroyed, which corresponds to the imminent collapse at the site.
As shown in Figure 4b, the surrounding rock stress at the left and right low roof of the roadway begins to decrease significantly when the impact dynamic load begins to act. With the increase in the input dynamic load strength, the roof stress continues to decrease, and the immediate roof also presents a state of cumulative damage. When the pendulum height is 0.7 m, that is, the dynamic load strength is about 2.29 × 10⁶ J, the pressure at the lower roof is about 328 N, and there is no significant change thereafter. Therefore, it can be considered that the direct roof of the heading face has completely collapsed and failed under the disturbance of dynamic load.
The stress of the middle roof and the high roof in the driving face presents different response rules under the impact dynamic load. Similar to the lower roof, the pressure of the 5# sensor located in the 14 m thick siltstone gradually decreases with the increase in the pendulum height under dynamic load and fails only under the last dynamic load impact that causes the overall instability of the model. However, the pressure of the 9# sensor in the 34 m thick fine conglomerate has no significant effect on the increase in dynamic load strength, indicating that the upper key layer still has good stability.
The pressure in the lower roof of the central coal pillar first slowly rises under the impact dynamic load of low energy. When the pendulum height exceeds 0.7 m, the monitoring results of the 26# sensor begin to decrease significantly, indicating that when the dynamic load energy reaches a certain level, the strength of coal and rock exceeds the limit, and the microscopic plastic deformation turns into the macroscopic fracture. However, the pressure in the lower roof of the goaf in the working face rises slowly, which indicates that the working face still has good bearing capacity.
To sum up, the stress response of the disturbed surrounding rock under the impact dynamic load has the following characteristics: (1) Under the impact dynamic load, the wave-facing side of the driving roadway (i.e., the left side of the roadway) is closer to the dynamic load source, with less energy attenuation, so it is greatly affected by the impact dynamic load. The back wave measurement (central coal pillar and working face side) is far away from the dynamic load source, and the stress wave will be transmitted, diffracted, and reflected after passing through the free surface. The energy has been significantly weakened, and the disturbance influence of the impact dynamic load is reduced. (2) The stress response in the roof surrounding rock gradually weakens with the distance from the roadway, and the multi-cyclic effect of the impact stress wave is the main reason for the fracture of the upper strata. (3) No matter the excavation face, coal pillar, or goaf floor, the stress response under the horizontal dynamic load is weaker than that of the roof and roof; that is, roof collapse or wall impact is more likely to occur under similar working conditions on site, rather than floor heave. Therefore, the roof and roof of the roadway are the areas that need to be strengthened to support the disturbed working face facing each other, which is consistent with the above theoretical analysis conclusion. The measured critical induced thrusting energy of the driving face is 2.29 × 10⁶ J, while the measured critical induced thrusting energy of the mining face is 5.24 × 10⁶ J, indicating that the disturbance effect of the same external dynamic load on the stability of surrounding rock in the driving face is significantly stronger than that of mining face.

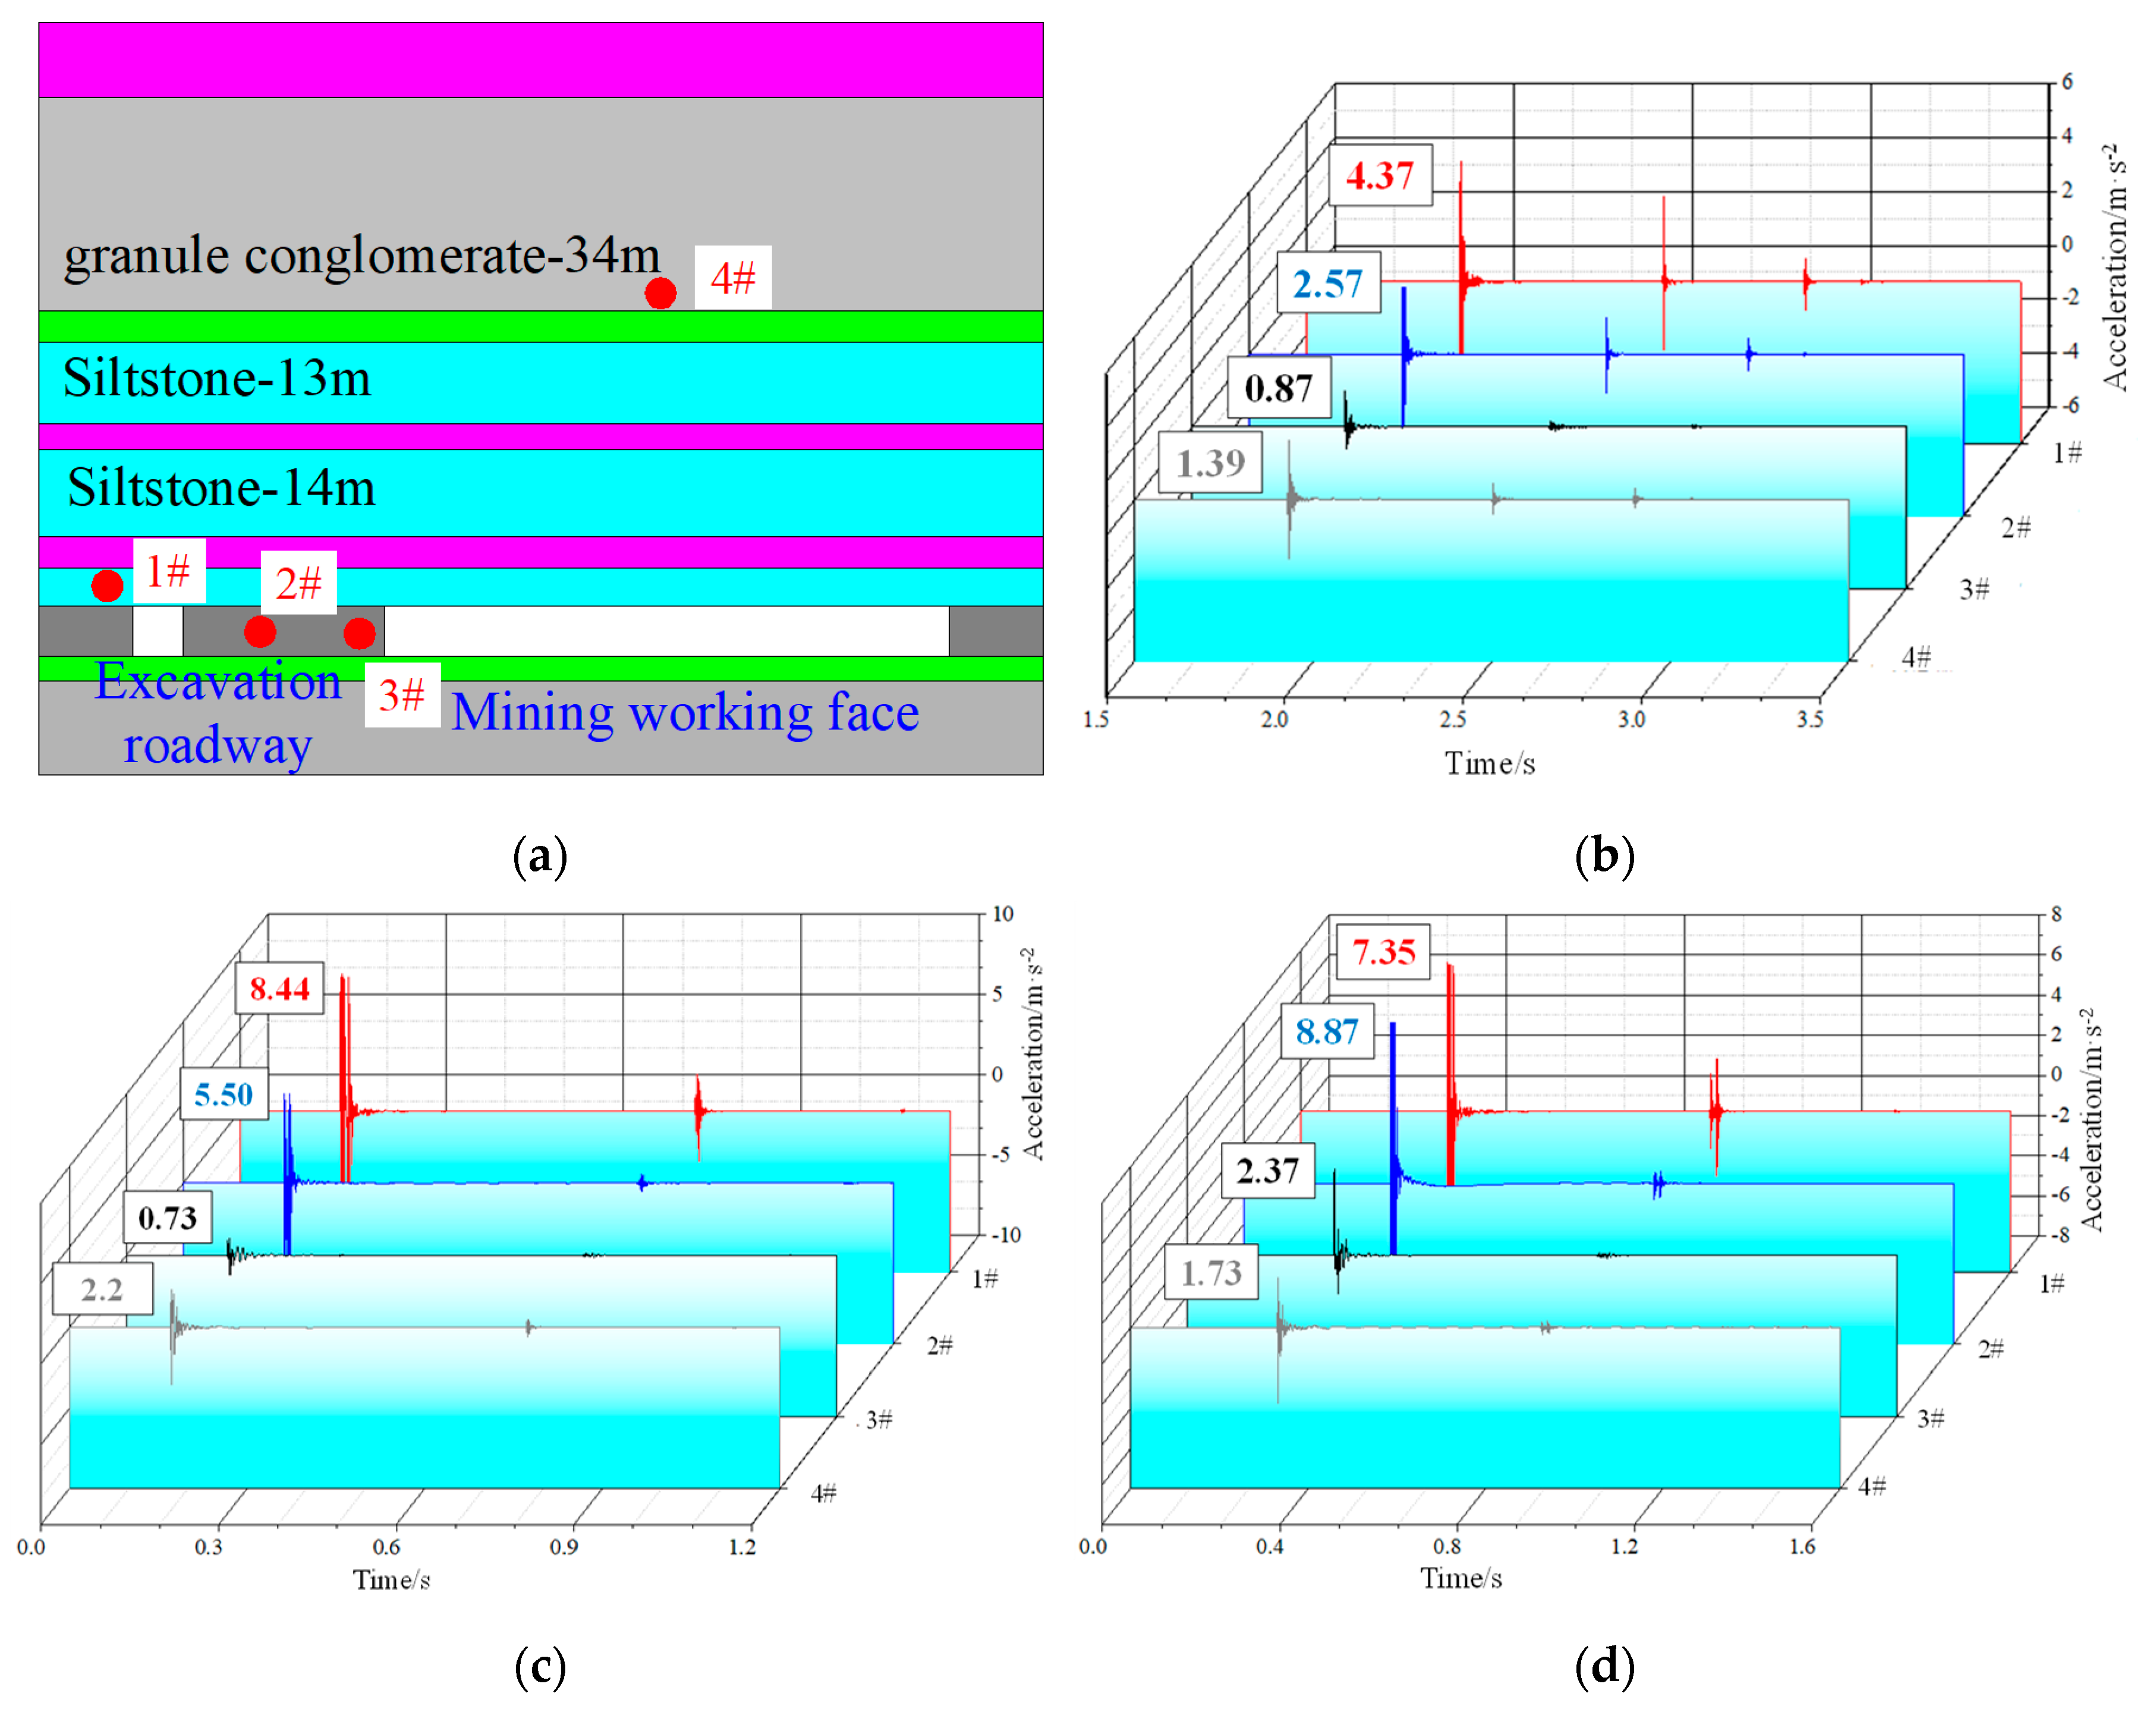
3.2.2. Dynamic Response Characteristics of Disturbed Surrounding Rock under Impact Dynamic Load

Many field engineering cases show that the disturbance induced by mining in the opposite direction is an impact phenomenon with typical dynamic failure characteristics. To capture the dynamic response characteristics of disturbed surrounding rock under the impact dynamic load, four measuring points are arranged on the surface of the model, representing the near driving face, the inside of the central coal pillar disturbed by mining in the opposite direction, the near stopping face, and the overlying high roof area. The particle motion acceleration velocity and displacement parameters of roadway surrounding rock under impact dynamic load are monitored. The acceleration dynamic response characteristics of coal and rock mass at measurement points in different regions are shown in Figure 5b–h.
As can be seen from the figure, the acceleration response characteristics of measurement points in different regions show a relatively consistent rule under the impact dynamic load: after the impact dynamic load, the peak acceleration decreases exponentially, with a short duration and fast signal attenuation, which is similar to the phenomenon of “one main shock–multiple aftershocks” of an earthquake, indicating that the impact dynamic load can induce the dynamic fracture of the disturbed coal rock mass.
Taking Figure 5b as an example, when the pendulum height is 0.1 m and the corresponding input dynamic load size is 3.27 × 10⁵ J, the peak acceleration of the 1# sensor closest to the focal point is the largest, which is 4.37 m/s2. The peak acceleration of the distant 2# sensor is 2.57 m/s2. The peak acceleration of the 3# sensor located around the stope face is 0.87 m/s2. The peak acceleration of the 4# sensor farthest from the source is 1.39 m/s2. It is shown that the dynamic response intensity of each region of the model is not only affected by the distance of vibration wave propagation but also related to the spatial location of mining disturbance, which can be mainly reflected as the following: (1) After the pendulum falls, the left side of the model is directly disturbed by the dynamic load of the impact. The dynamic load energy directly acts on the left side of the heading face. The acceleration duration is short and the attenuation is relatively fast. (2) Measuring point 2# is located at the back wave side. After the incident vibration wave, it first passes through the free space of the heading face and acts on the point after transmission and reflection on the roadway surface many times. Its energy attenuates slightly, so the acceleration of measuring point 2# is slightly lower than that of measuring point 1#. (3) The measuring point No. 3 is located in the advanced position of the working face. Because it is in the plastic zone of surrounding rock affected by mining, the coal rock mass is relatively broken, so the ability to absorb incident waves is greatly reduced, and its peak acceleration is the minimum. (4) Measuring point No. 4 is located on the top roof of the key layer above the stope working face. Although it is the furthest away from the source and its energy is low after attenuation, its peak acceleration is higher than measuring point No. 3 because the key rock layer is relatively dense and no significant rupture occurs. Therefore, the response rules of peak acceleration in different regions are as follows: driving face > central coal pillar > upper strata of stoping face > near the stoping face. (5) As shown in Figure 5e–h, when the pendulum height is greater than 0.7 m, the tail wave of the acceleration signal is relatively developed, especially at measuring points 1# and 2#, indicating that macro-cracks have appeared inside the model under dynamic load at this time, which interferes with the propagation of dynamic load vibration waves.

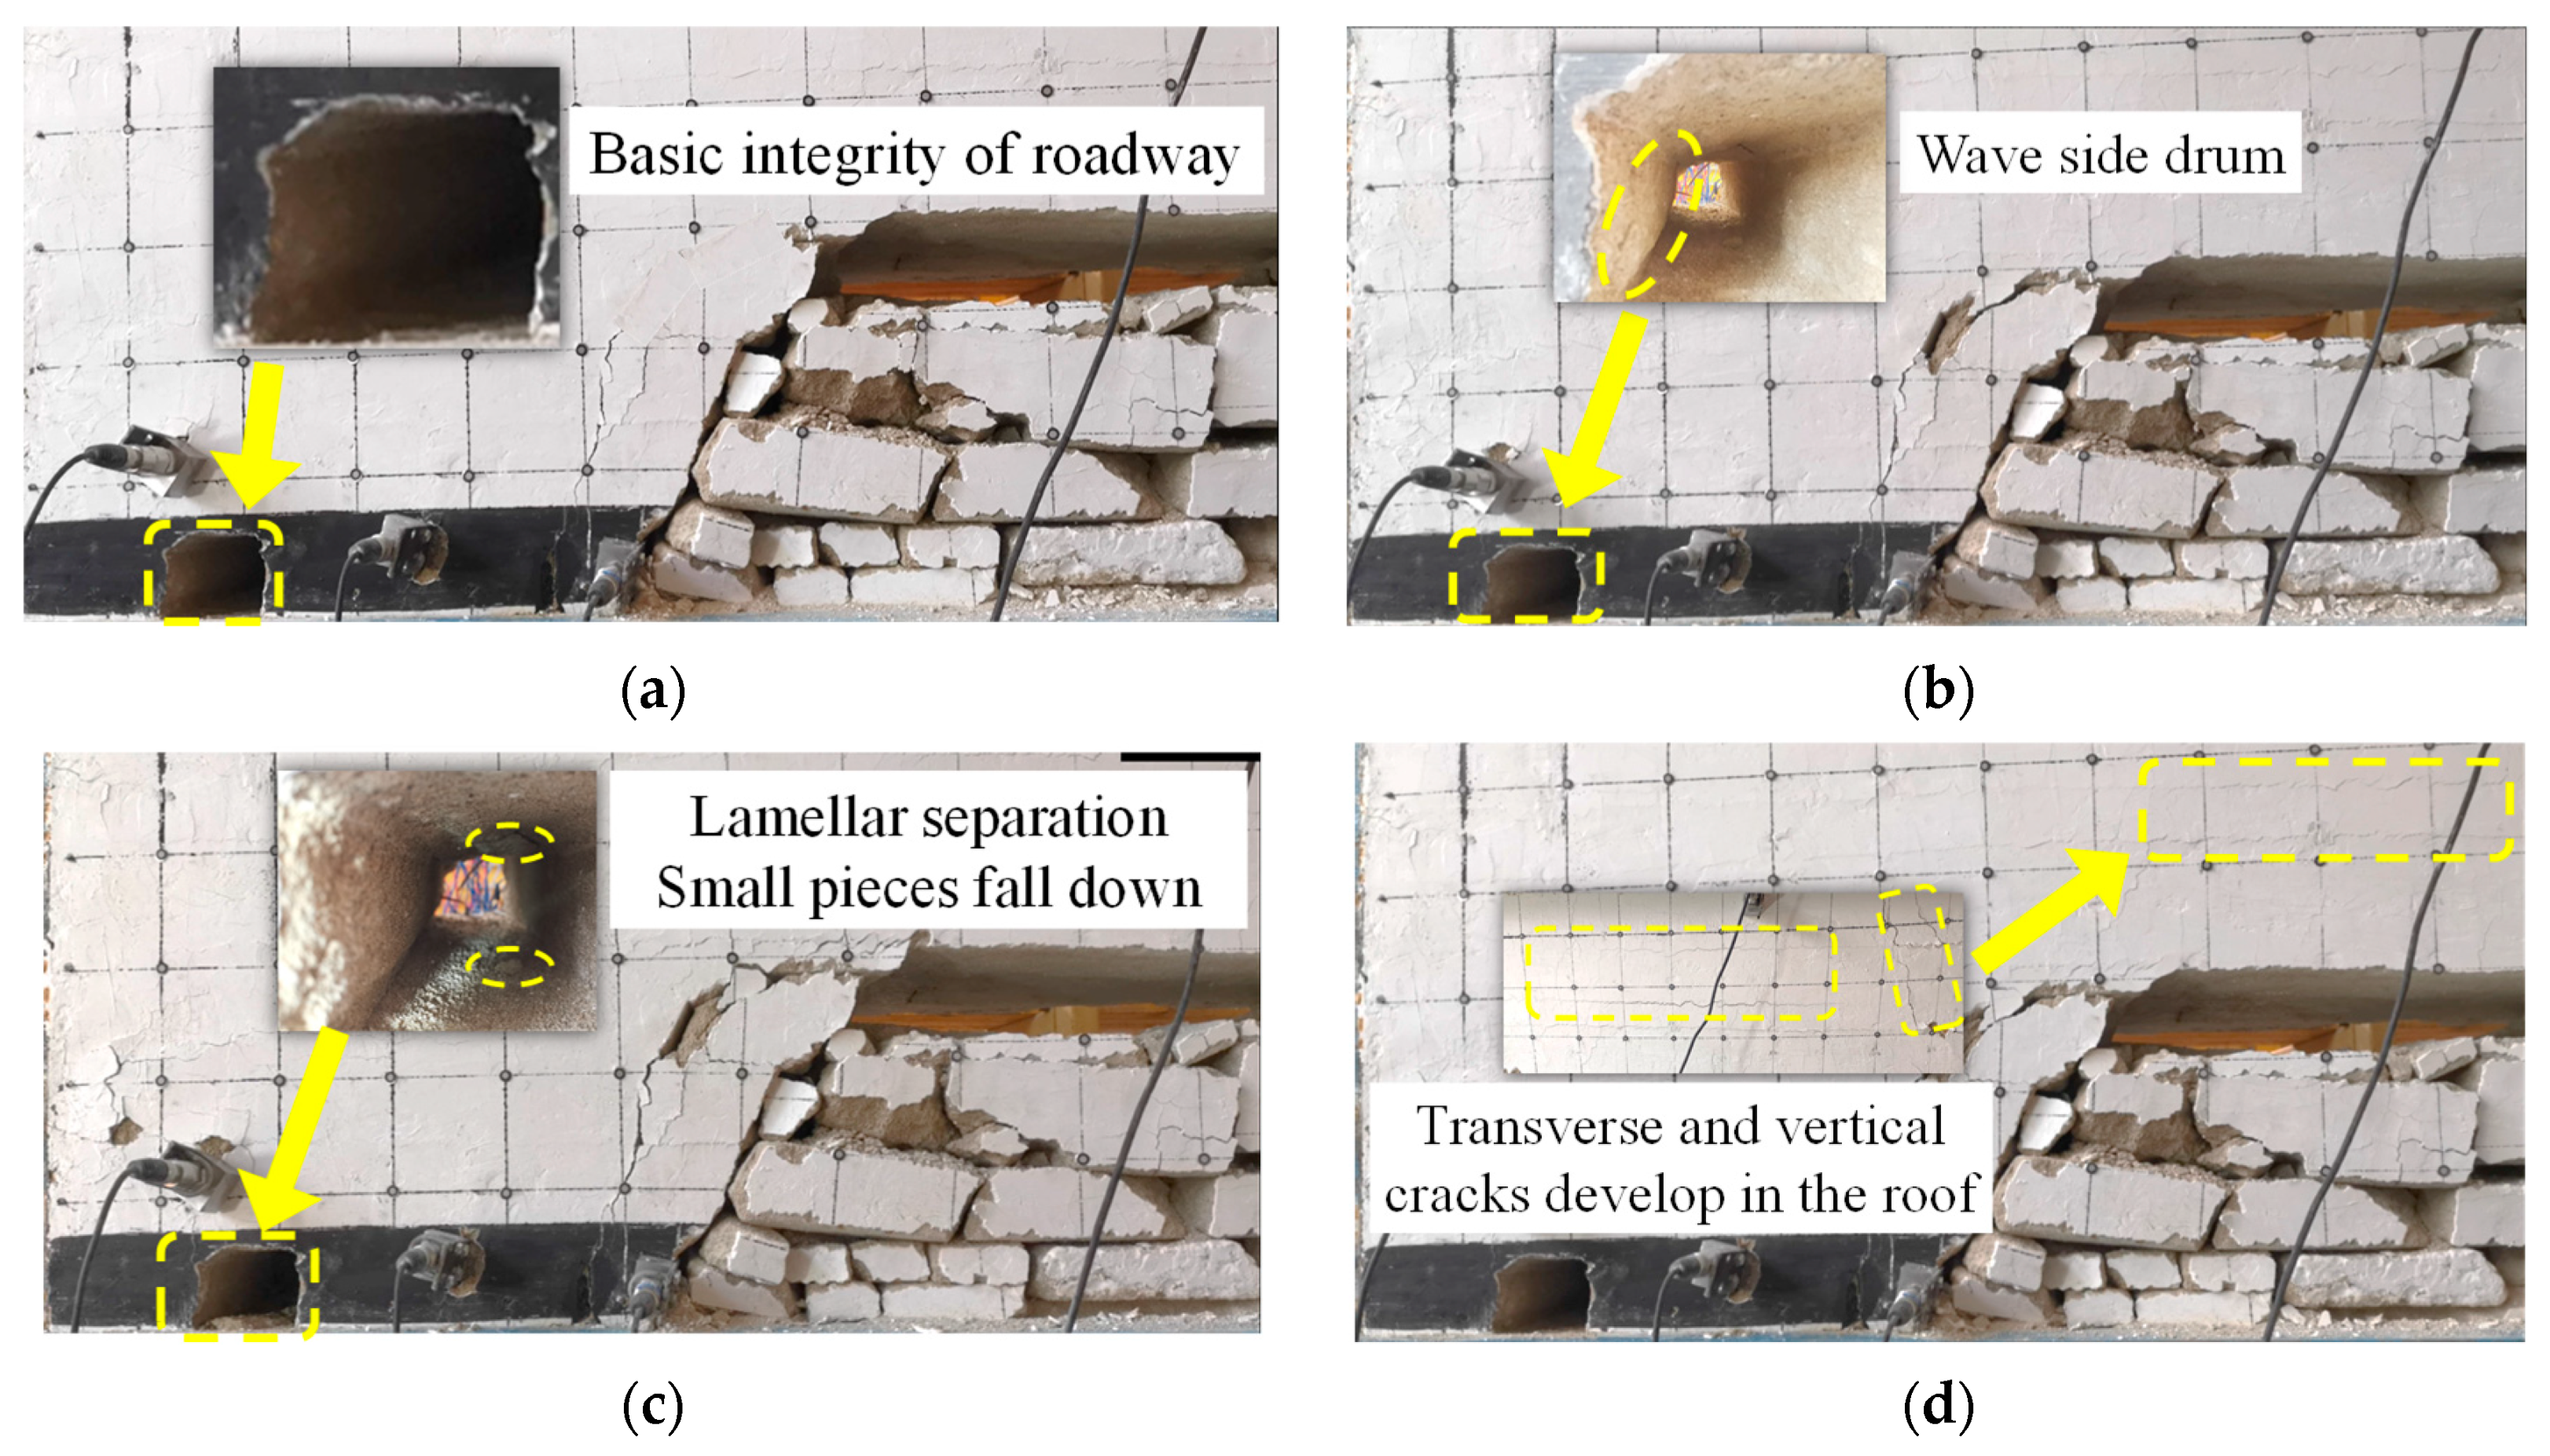
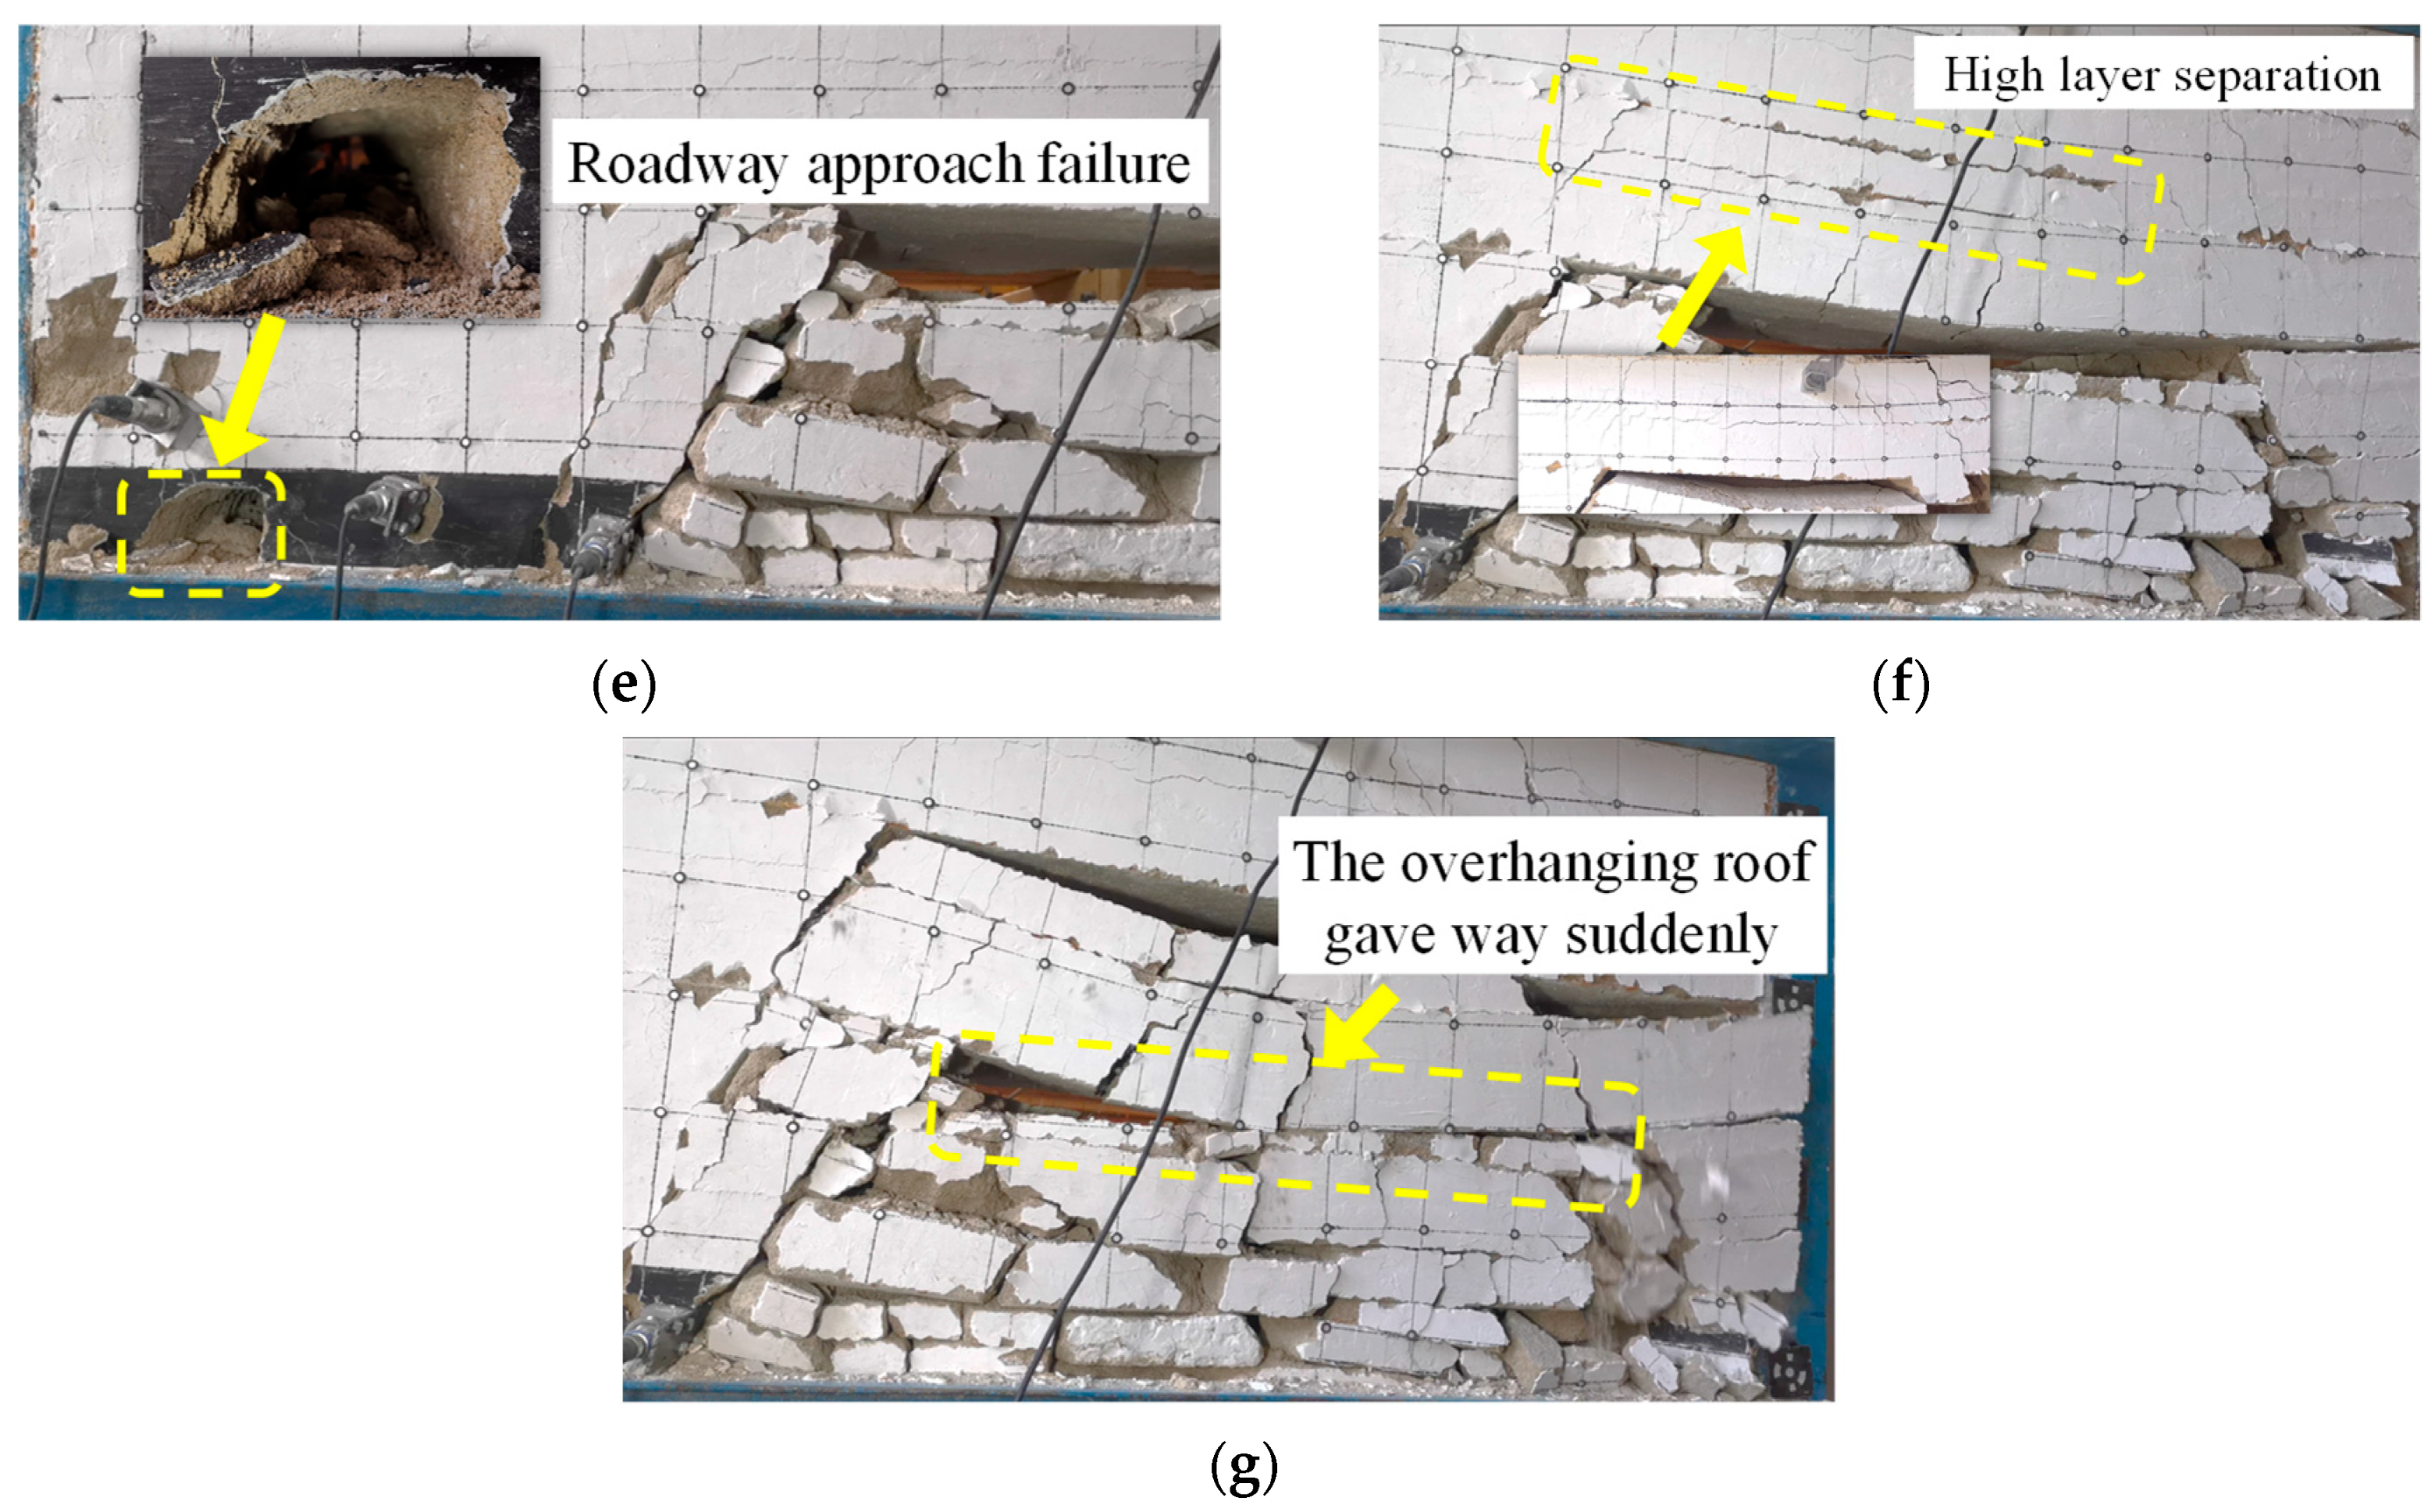
3.3. Mechanism of Progress Damage of Surrounding Rock during Mining Excavation Disturbance

Figure 6 shows the progressive failure process of roadway rock disturbed by moving in the opposite direction under impact dynamic load. It can be seen from the figure that the dynamic failure characteristics of the heading face and stopping face are different under the action of different pendulum heights.
As shown in Figure 6a, in the early stage of dynamic impact loading, the heading face is only affected by the advanced mining abutment pressure of the working face facing the opposite direction. Due to the low input dynamic load energy, the heading face hardly deforms and maintains a relatively complete state. When the pendulum height continues to rise to 0.3 m, the input energy is 9.82 × 10⁵ J, and the bulge begins to appear on the left side of the roadway near the source, while there is almost no deformation on the right side. When the pendulum height is 0.5 m, the roof of the heading face has lamellar separation, accompanied by the fall of small blocks, which indicates that the heading face is affected by the impact dynamic load. When the pendulum height is 0.7 m, several parallel cracks appear along the strata interface at the middle roof surface of the stope face, accompanied by a vertical crack at a 45° tilt on the right side. As shown in Figure 6e, when the pendulum height is 0.9 m, the roadway on the heading face is seriously damaged, and the debris rushed out from the left side and roof almost fills half of the free space of the roadway, and the roadway on the heading face is close to failure. As shown in Figure 6f, when the pendulum height is 1.1 m, two longitudinal parallel cracks appear in the middle of the middle strata at the hanging roof of the goaf, and the impact dynamic load aggravates the roof fracture of the working face. As shown in Figure 6g, when the pendulum height is 1.3 m and the input impact dynamic load energy is 5.24 × 10⁶ J, the final suspension roof collapses in a large range instantly, and the stope working face is also completely destabilized and destroyed.

4. Conclusions

In this paper, a self-developed combined dynamic and dynamic load similar simulation experiment platform is used to study the evolution characteristics of force and energy and the progressive damage mechanism during the process of mining and excavation disturbance and analyze the disturbance-induced thrust-induced process of roadway surrounding rock under the influence of mining and excavation. The conclusions are as follows:
  • The evolution law of rock force and energy and the migration characteristics of overburdened rock in the process of excavation is revealed. Under the action of dynamic and static stress in the mining face, the stress evolution process of surrounding rock along with mining can be roughly divided into three stages: the rapid rise and slight decrease in the early stage, continuous increase to the peak in the middle stage and then step-like decline, and slow rise in the late stage;
  • The stress distribution characteristics of disturbed surrounding rock under impact dynamic load with different strengths are analyzed. The oncoming side of the roadway is greatly affected by the impact of dynamic load disturbance, and the energy of the vibration wave at the back side is absorbed after transmission attenuation, and the disturbance influence is reduced. The measured critical induced thrusting energy of the driving face is 2.29 × 10⁶ J, while the measured critical induced thrusting energy of the mining face is 5.24 × 10⁶ J, indicating that the disturbance effect of the same external dynamic load on the stability of surrounding rock in the driving face is significantly stronger than that of the mining face;
  • The dynamic response characteristics of parameters such as acceleration of roadway surrounding rock in different regions are compared and analyzed. The left side of the heading face is closest to the source, the acceleration duration is short and the attenuation is relatively fast, and it is also the area prone to the earliest impact failure among the disturbance objects facing the mining. When the pendulum height is greater than 0.9 m, the roadway begins to appear in a progressive damage trend and the plastic damage degree of the roadway surrounding rock increases until it becomes completely unstable. The impact risk of the central roadway is the highest under the superimposed influence of the static mining stress and the input dynamic stress of the opposite mining face.

Author Contributions

Conceptualization, J.B.; project administration, L.D. and X.L.; writing, J.B. and X.M.; investigation, F.L. and Z.H. All authors have read and agreed to the published version of the manuscript.

Funding

This research was carried out with the funded projects: National Natural Science Foundation of China (Grant No. 52227901, 51934007) and National Key Research and Development Program of China (Grant No. 2022YFC3004603). The first author also acknowledges the Postgraduate Research & Practice Innovation Program of Jiangsu Province (KYCX21_2342).

Institutional Review Board Statement

Not applicable.

Informed Consent Statement

Not applicable.

Data Availability Statement

The authors confirm that the data supporting the findings of this study are available within the article.

Acknowledgments

We appreciate the support from the State Key Laboratory of Coal Resources and Safe Mining.

Conflicts of Interest

The authors declare no conflict of interest.

References

  1. Dou, L.M.; He, J.; Cao, A.Y.; Gong, S.Y.; Cai, W. Rock burst prevention methods based on theory of dynamic and static combined load induced in coal mine. J. China Coal Soc. 2015, 40, 1469–1476. [Google Scholar]
  2. Cai, M. Principles of rock support in burst-prone ground. Tunn. Undergr. Space Technol. 2013, 36, 46–56. [Google Scholar] [CrossRef]
  3. Qi, Q.X.; Li, Y.Z.; Zhao, S.K.; Zhang, N.B.; Zheng, W.Y.; Li, H.T.; Li, H.Y. Seventy years development of coal mine rockburst in china: Establishment and consideration of theory and technology system. Coal Sci. Technol. 2019, 47, 1–40. [Google Scholar]
  4. Kaiser, P.K.; Cai, M. Design of rock support system under rockburst condition. J. Rock Mech. Geotech. Eng. 2012, 4, 215–227. [Google Scholar] [CrossRef] [Green Version]
  5. Fujii, Y.; Ishijima, Y.; Deguchi, G. Prediction of coal face rockbursts and microseismicity in deep longwall coal mining. Int. J. Rock Mech. Min. 1997, 34, 85–96. [Google Scholar] [CrossRef]
  6. Cai, W.; Bai, X.X.; Si, G.Y.; Cao, W.Z.; Gong, S.Y.; Dou, L.M. A Monitoring Investigation into Rock Burst Mechanism Based on the Coupled Theory of Static and Dynamic Stresses. Rock Mech. Rock Eng. 2020, 53, 5451–5471. [Google Scholar] [CrossRef]
  7. Bai, J.Z.; Dou, L.M.; Cai, W.; Gong, S.Y.; Shen, W.; Tian, X.Y.; Ma, H.J. An integration method of bursting strain energy and seismic velocity tomography for coal burst hazard assessment. Lithosphere 2022, 2022, 2070540. [Google Scholar] [CrossRef]
  8. Manouchehrian, A.; Cai, M. Numerical modeling of rockburst near fault zones in deep tunnels. Tunn. Undergr. Space Technol. 2018, 80, 164–180. [Google Scholar] [CrossRef]
  9. Małkowski, P.; Juszyński, D. Roof fall hazard assessment with the use of artificial neural network. Int. J. Rock Mech. Min. 2021, 143, 104701. [Google Scholar] [CrossRef]
  10. Bai, J.Z.; Dou, L.M.; Małkowski, P.; Zhou, K.Y.; Chai, Y.J. Mechanical properties and damage behavior of rock-coal-rock combined samples under coupled static and dynamic loads. Geofluids 2021, 2021, 3181697. [Google Scholar] [CrossRef]
  11. Ji, H.G.; Ma, H.S.; Wang, J.A.; Zhang, Y.H.; Cao, H. Mining disturbance effect and mining arrangements analysis of near-fault mining in high tectonic stress region. Saf. Sci. 2012, 50, 649–654. [Google Scholar] [CrossRef]
  12. Cai, M.F.; Ji, H.G.; Wang, J.A. Study of the time-space-strength relation for mining seismicity at Laohutai Coal Mine and its prediction. Int. J. Rock Mech. Min. 2005, 42, 145–151. [Google Scholar] [CrossRef]
  13. Li, T.; Zhang, J.W.; Lv, Y.G.; Zhou, P.; Qiao, Z.D.; Chen, S.H. Relationship between mining and mining-induced seismicity. J. China Coal Soc. 2011, 36, 2127–2132. [Google Scholar]
  14. Nikadat, N.; Fatehi, M.; Abdollahipour, A. Numerical modelling of stress analysis around rectangular tunnels with large discontinuities (fault) by a hybridized indirect BEM. J. Cent. South Univ. 2015, 22, 4291–4299. [Google Scholar] [CrossRef]
  15. Hu, Y.W. Experimental Investigation into Stress-Acoustic-Deformation Evolution of Fault Activation Process under Coal Mining-Induced Stress Paths; China University of Mining and Technology: Xuzhou, China, 2020. [Google Scholar]
  16. Han, C.L.; Zhang, N.; Xue, J.H.; Kan, J.G.; Zhao, Y.M. Multiple and long-term disturbance of gob-side entry retaining by grouped roof collapse and an innovative adaptive technology. Rock Mech. Rock Eng. 2019, 52, 2761–2773. [Google Scholar] [CrossRef]
  17. Peng, Y.J.; Li, Q.F. Floor failure and roadway deformation induced by contiguous coal seams mining at Huopu Mine. Arab. J. Geosci. 2020, 13, 601. [Google Scholar] [CrossRef]
  18. Guo, P.H.; Li, J.Z.; Hao, X.Q.; Cui, H.; Tian, L.H.; Xie, W.H.; Chu, J.Q. Influence of Mine Earthquake Disturbance on the Principal Stress of the Main Roadway near the Goaf and Its Prevention and Control Measures. Geofluids 2021, 1968846, 2021. [Google Scholar] [CrossRef]
  19. Liu, S.G.; Bai, J.B.; Wang, X.Y.; Wang, G.H.; Wu, B.W.; Li, Y.H.; Zhao, J.X. Study on the stability of coal pillars under the disturbance of repeated mining in a double-roadway layout system. Front. Earth Sci. 2021, 9, 754747. [Google Scholar] [CrossRef]
  20. Qi, F.Z.; Yang, D.W.; Zhang, Y.G.; Hao, Y.X. Analysis of failure mechanism of roadway surrounding rock under thick coal seam strong mining disturbance. Shock Vib. 2021, 2021, 9940667. [Google Scholar] [CrossRef]
  21. Su, R.H.; Shen, H.S. Physical characteristics of section coal and rock pillars under roof shock disturbances from goaf. Front. Phys. 2020, 8, 223. [Google Scholar] [CrossRef]
  22. Wang, S.C.; Dou, L.M.; Wang, Z.Y.; Bai, J.Z.; Chai, Y.J. Mechanism of coal bursts induced by horizontal section mining of steeply inclined coal seams and application of microseismic multiparameter monitoring in early warning. Adv. Civ. Eng. 2020, 2020, 1048624. [Google Scholar] [CrossRef]
  23. Wang, G.F.; Gong, S.Y.; Li, Z.L.; Dou, L.M.; Cai, W.; Mao, Y. Evolution of stress concentration and energy release before rock bursts: Two case studies from Xingan coal mine, Hegang, China. Rock Mech. Rock Eng. 2016, 49, 3393–3401. [Google Scholar] [CrossRef]
Figure 1. Structure size of similar model test.
Applsci 13 07759 g001
Figure 2. Stress evolution characteristics of measuring points in the process of mining and excavation disturbance: (a) 1#, 2#; (b) 5#, 7#-10#; (c) 11#, 14#; (d) 26#, 27#; (e) 29#, 31#; (f) 34#, 35#, 39#, 40#.
Applsci 13 07759 g002aApplsci 13 07759 g002b
Figure 3. Deformation characteristics of overburden in the process of mining and excavation disturbance: (a) displacement marker survey lines; (b) mining 10 m; (c) mining 30 m; (d) mining 50 m; (e) mining 70 m; (f) mining 90 m.
Applsci 13 07759 g003
Figure 4. Stress response characteristics of disturbed surrounding rock under impact dynamic load: (a) 1#; (b) 3#; (c) 5#, 9#; (d) 12#; (e) 26#, 29#; (f) 37#, 39#.
Applsci 13 07759 g004aApplsci 13 07759 g004b
Figure 5. Dynamic response characteristics of disturbed surrounding rock under impact dynamic load: (a) measuring points; (b) 0.1 m; (c) 0.3 m; (d) 0.5 m; (e) 0.7 m; (f) 0.9 m; (g) 1.1 m; (h) 1.3 m.
Applsci 13 07759 g005aApplsci 13 07759 g005b
Figure 6. Progressive failure process of roadway surrounding rock disturbed by mining: (a) 0.1 m; (b) 0.3 m; (c) 0.5 m; (d) 0.7 m; (e) 0.9 m; (f) 1.1 m; (g) 1.3 m.
Applsci 13 07759 g006aApplsci 13 07759 g006b
Table 1. The similarity model uses the main technical parameters.
Major VariableFroude Proportionality CoefficientNumerical ValueMajor VariableFroude Proportionality CoefficientNumerical Value
Model length l 100Poisson ratio μ = 1 1
Material density ρ 1.67Frictional angle φ = 1 1
Acceleration a = 1 1Speed v = l 10
Time t = l 10Volume weight γ = ρ 1.67
Stress σ = ρ l 167Energy E 1.67 × 10⁴
Table 2. Pendulum lifting height and simulated impact dynamic load energy.
Test NumberPendulum Lifting Height/mPendulum Angle/°Simulate Dynamic Load Energy/JTest NumberPendulum Lifting Height/mPendulum Angle/°Simulate Dynamic Load Energy/J
10.125.93.27 × 10590.984.32.95 × 106
20.236.86.55 × 105101.0903.27 × 106
30.345.69.82 × 105111.195.63.60 × 106
40.453.11.31 × 106121.2101.13.93 × 106
50.560.01.64 × 106131.3106.54.26 × 106
60.666.41.96 × 106141.4111.84.58 × 106
70.772.52.29 × 106151.5117.04.91 × 106
80.878.52.62 × 106161.6122.15.24 × 106
Disclaimer/Publisher’s Note: The statements, opinions and data contained in all publications are solely those of the individual author(s) and contributor(s) and not of MDPI and/or the editor(s). MDPI and/or the editor(s) disclaim responsibility for any injury to people or property resulting from any ideas, methods, instructions or products referred to in the content.

