Article

Detection of Elbow OCD in the Ultrasound Image by Artificial Intelligence Using YOLOv8

1
Department of Orthopaedic Surgery, Kobe University Graduate School of Medicine, 7-5-1 Kusunoki-cho, Chuou-ku, Kobe City 650-0017, Hyogo, Japan
2
School of Medicine, Kobe University, 7-5-1 Kusunoki-cho, Chuou-ku, Kobe City 650-0017, Hyogo, Japan
*
Author to whom correspondence should be addressed.
Appl. Sci. 2023, 13(13), 7623; https://doi.org/10.3390/app13137623
Submission received: 2 May 2023 / Revised: 23 June 2023 / Accepted: 26 June 2023 / Published: 28 June 2023
(This article belongs to the Special Issue Artificial Intelligence (AI) in Healthcare)

Abstract

:
Background: Screening for elbow osteochondritis dissecans (OCD) using ultrasound (US) is essential for early detection and successful conservative treatment. The aim of the study is to determine the diagnostic accuracy of YOLOv8, a deep-learning-based artificial intelligence model, for US images of OCD or normal elbow-joint images. Methods: A total of 2430 images were used. Using the YOLOv8 model, image classification and object detection were performed to recognize OCD lesions or standard views of normal elbow joints. Results: In the binary classification of normal and OCD lesions, the values from the confusion matrix were the following: Accuracy = 0.998, Recall = 0.9975, Precision = 1.000, and F-measure = 0.9987. The mean average precision (mAP) comparing the bounding box detected by the trained model with the true-label bounding box was 0.994 in the YOLOv8n model and 0.995 in the YOLOv8m model. Conclusions: The YOLOv8 model was trained for image classification and object detection of standard views of elbow joints and OCD lesions. Both tasks were able to be achieved with high accuracy and may be useful for mass screening at medical check-ups for baseball elbow.
Keywords:
OCD; ultrasound; YOLO

1. Introduction

Osteochondritis dissecans (OCD) of the distal humerus is a significant cause of throwing elbow disorders in youth baseball players [1,2]. The incidence of OCD ranges from 0.3% to 3.4%, with the most common age of onset being 10 to 12 years. Baseball pitching can produce excessive stress on the anterior part of the capitellum, where most OCD lesions in throwing athletes are found. Mechanical conditions may play a role in elbow OCD, and bone bruises may be a precursor to an OCD lesion [3]. In the early stages of OCD, symptoms are infrequent, and conservative treatment is usually effective. However, as the disease progresses, patients may experience elbow pain and twitching, necessitating prolonged sports cessation. In some cases, surgical intervention, such as the removal of free bone fragments or osteochondral grafting, may be required to prevent future osteoarthritis. According to the systematic review from Sayani et al. in 2021, nonoperative treatment was similar in outcomes to surgical treatment for low-grade lesions, whereas surgical treatment was superior for higher-grade lesions. There was no significant difference in the magnitude of improvement or overall scores according to the type of surgery for stable or unstable lesions [4]. Therefore, early detection of OCD is critical for successful conservative treatment. Imaging techniques such as radiography, computed tomography (CT), magnetic resonance imaging (MRI), and ultrasound (US) are used to detect OCD. The age of diagnosis for capitellar OCD varies, and the appearance of the lesion depends on its stage. Careful evaluation using radiography, CT, MRI, and US is important for choosing the appropriate treatment. In recent years, improvements in US spatial resolution have enabled more detailed cross-sectional imaging of OCD in the elbow joint, even in asymptomatic patients [5]. US imaging is a rapid, inexpensive, and non-invasive tool that can evaluate both dominant and non-dominant elbows. In 2018, Yoshizuka et al. reported the high accuracy of US imaging for OCD diagnosis [6]. The study compared the diagnostic accuracies of US and magnetic MRI with intraoperative OCD fragment-stability findings. They found that US was a useful tool for evaluating fragment instability in OCD and achieved superior accuracy compared with MRI criteria (96% vs. 73%). US screening for OCD is essential for early detection and successful conservative treatment. Group examinations such as the “Medical Checkup for Baseball Elbow” have been conducted nationwide for the early detection of OCD. In 2016, Iwame et al. reported that about 30% of youth baseball players had episodes of elbow pain and 4% of young baseball players had an abnormal finding at an initial ultrasonography screening [7]. In 2022, Ikeda et al. reported a study of car-mounted mobile MRI for the on-field screening of OCD in young baseball players. Mobile MRI had a higher sensitivity than the US and could detect OCD from early stages to healing [8]. However, not all baseball teams have access to mobile MRI, and screening by US is currently more practical. Group examination of several teams at sports fields can lead to the detection of OCD in its early stages, when symptoms have not yet appeared, and can help to educate players, instructors, and parents. However, there are limitations to the diagnosis of OCD by US images, including operator dependency, the need for training, and interobserver variability in obtaining standardized measurements [5].
In recent years, artificial intelligence (AI), particularly deep learning (DL), has shown promise in addressing the limitations of US imaging. Convolutional neural networks (CNNs) have been widely studied for image analysis tasks, including medical image analysis [9]. DL has also been applied to US imaging studies, where it has shown promise in US imaging for musculoskeletal diseases. In particular, DL has been reported to accurately predict carpal tunnel syndrome by detecting image features in US images without measuring the median nerve cross-sectional area. The diagnostic accuracy was calculated from the confusion matrix obtained and showed high accuracy [10]. DL was also used on ultrasound images of Palmer 1B triangular fibrocartilage complex (TFCC) injuries. Classification of US images of injured TFCCs showed high accuracy comparable to MRI [11]. In these reports, AI models were trained using high-quality images called “standard views”, which are suitable for US diagnosis. However, in clinical practice, it is often difficult for inexperienced clinicians to obtain a standard view. By applying DL to US imaging, inexperienced US examiners can receive instant feedback on scanned tissue identification, obtaining a good “standard view” and enabling faster and more standardized measurements. In this study, we focused on the YOLO model, a commonly utilized object-detection AI model. YOLO stands for “You Only Look Once” and came from a report on object detection by Joseph Redmon [12]. YOLO processes the entire image in one shot, simultaneously estimating object class and location for fast and accurate real-time object detection. Redmon has since released improved versions such as YOLOv2 and YOLOv3 to achieve even higher accuracy, and speed-improved versions have been released [13]. More recently, other researchers have released a series of improved versions, including YOLOX and YOLOv5. Several studies have utilized YOLO for medical image analysis. In 2021, Aly et al. developed a computer-aided diagnostic system for breast cancer detection and classification [14]. The system detected masses on full-field digital mammograms with an average accuracy of 94.2% and accurately classified masses as benign or malignant with an accuracy of 84.6%. A transformer-based YOLO segmentation model for breast cancer mass detection and segmentation was reported in digital mammograms. The model achieved a 95.7% true positive rate and a 65.0% mean average accuracy in mass detection [15]. In 2022, Li et al. developed a YOLO deep-learning model for the detection and classification of primary bone tumors in full-field radiographs [16]. The model accurately detected bone lesions and classified radiographs into normal, benign, intermediate, and malignant types with an accuracy of 86.36% and 85.37% on internal and external validation sets, respectively. These studies demonstrate the potential of YOLO as an effective tool for medical image analysis to provide an accurate and efficient diagnosis with limited human intervention. In this study, we used the YOLOv8 model announced by Ultralytics (Los Angels, CA, USA) in 2023. The YOLOv8 model is the latest model of YOLO that combines high speed and high accuracy. For the object detection task, we compared the YOLOv8 model with the previous model, YOLOv5, which is published by the same company.
We hypothesized that AI technology could support technically inexperienced US examiners and be useful for “Medical Checkup for Baseball Elbow”. In this study, we focused on the YOLO8 model, which is extremely fast and highly accurate. This model can perform image classification, object detection, and image segmentation tasks. We constructed an AI model based on images collected during a baseball-elbow checkup. The first aim of the study is to determine the diagnostic accuracy of YOLOv8 for US image classification of OCD or normal elbow-joint images—what we call “standard view”. The second aim is to assess the diagnostic accuracy of object detection in OCD examples and in standard views of the elbow joints.

2. Materials and Methods

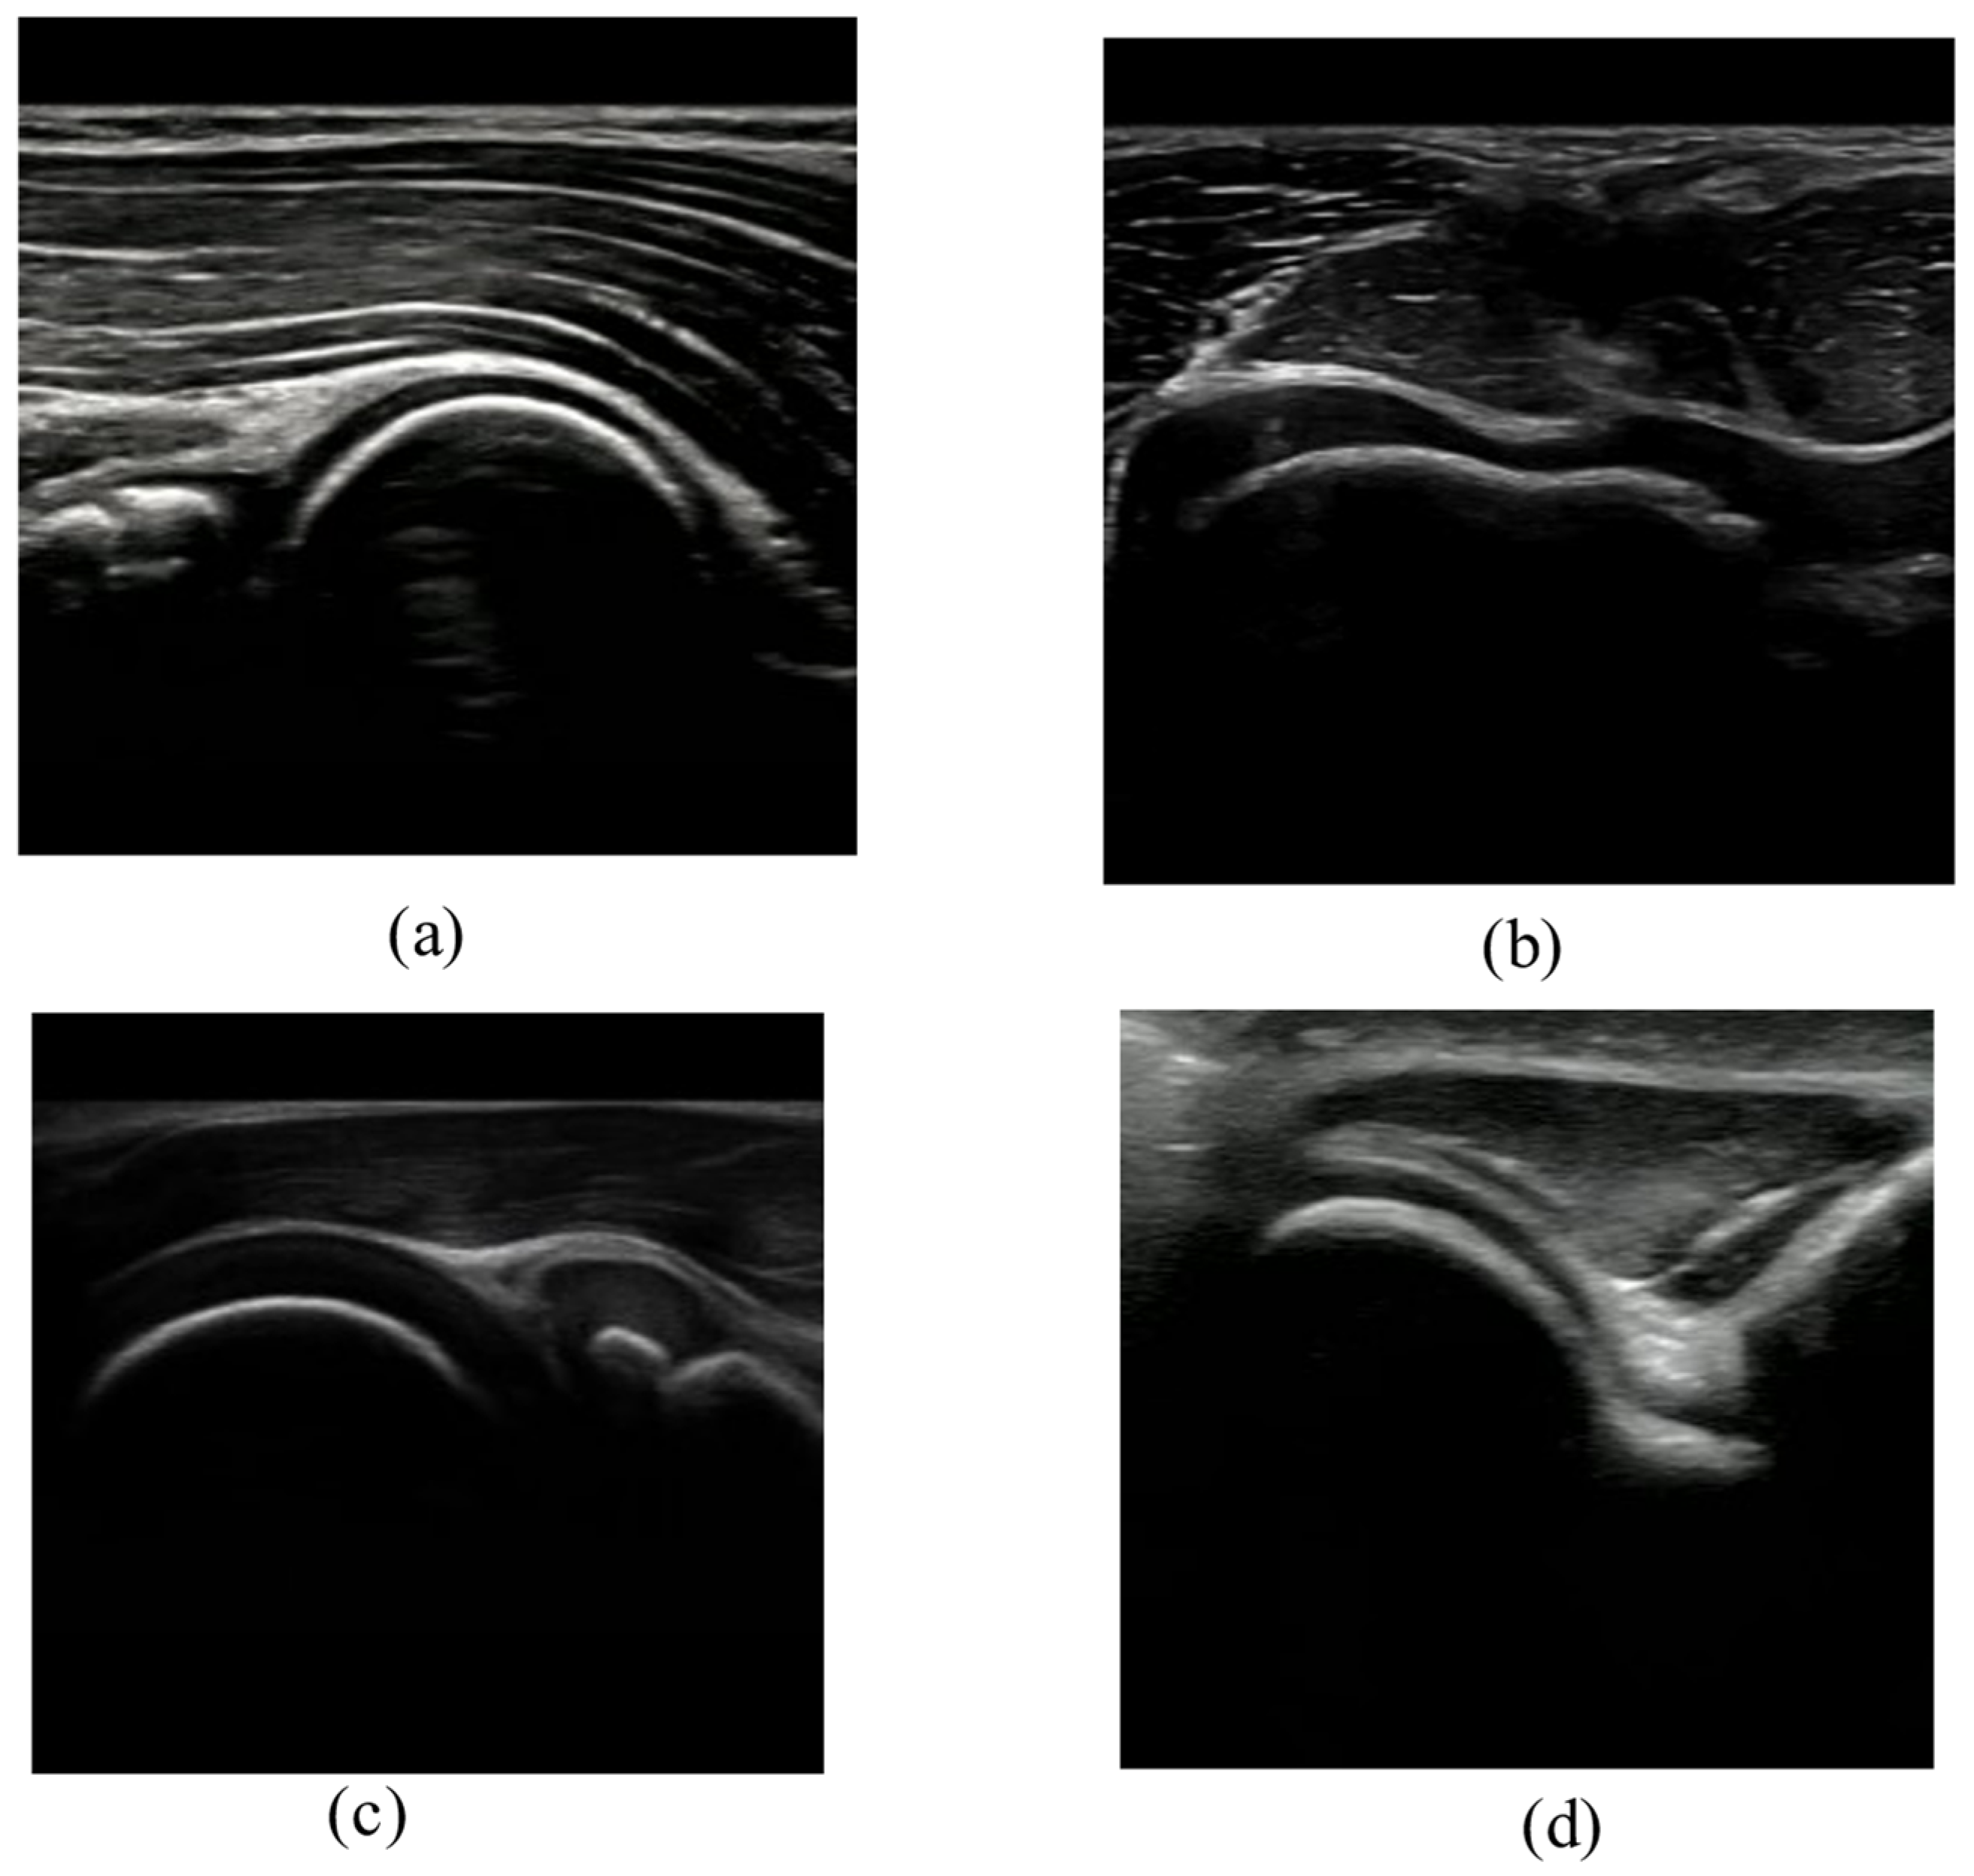
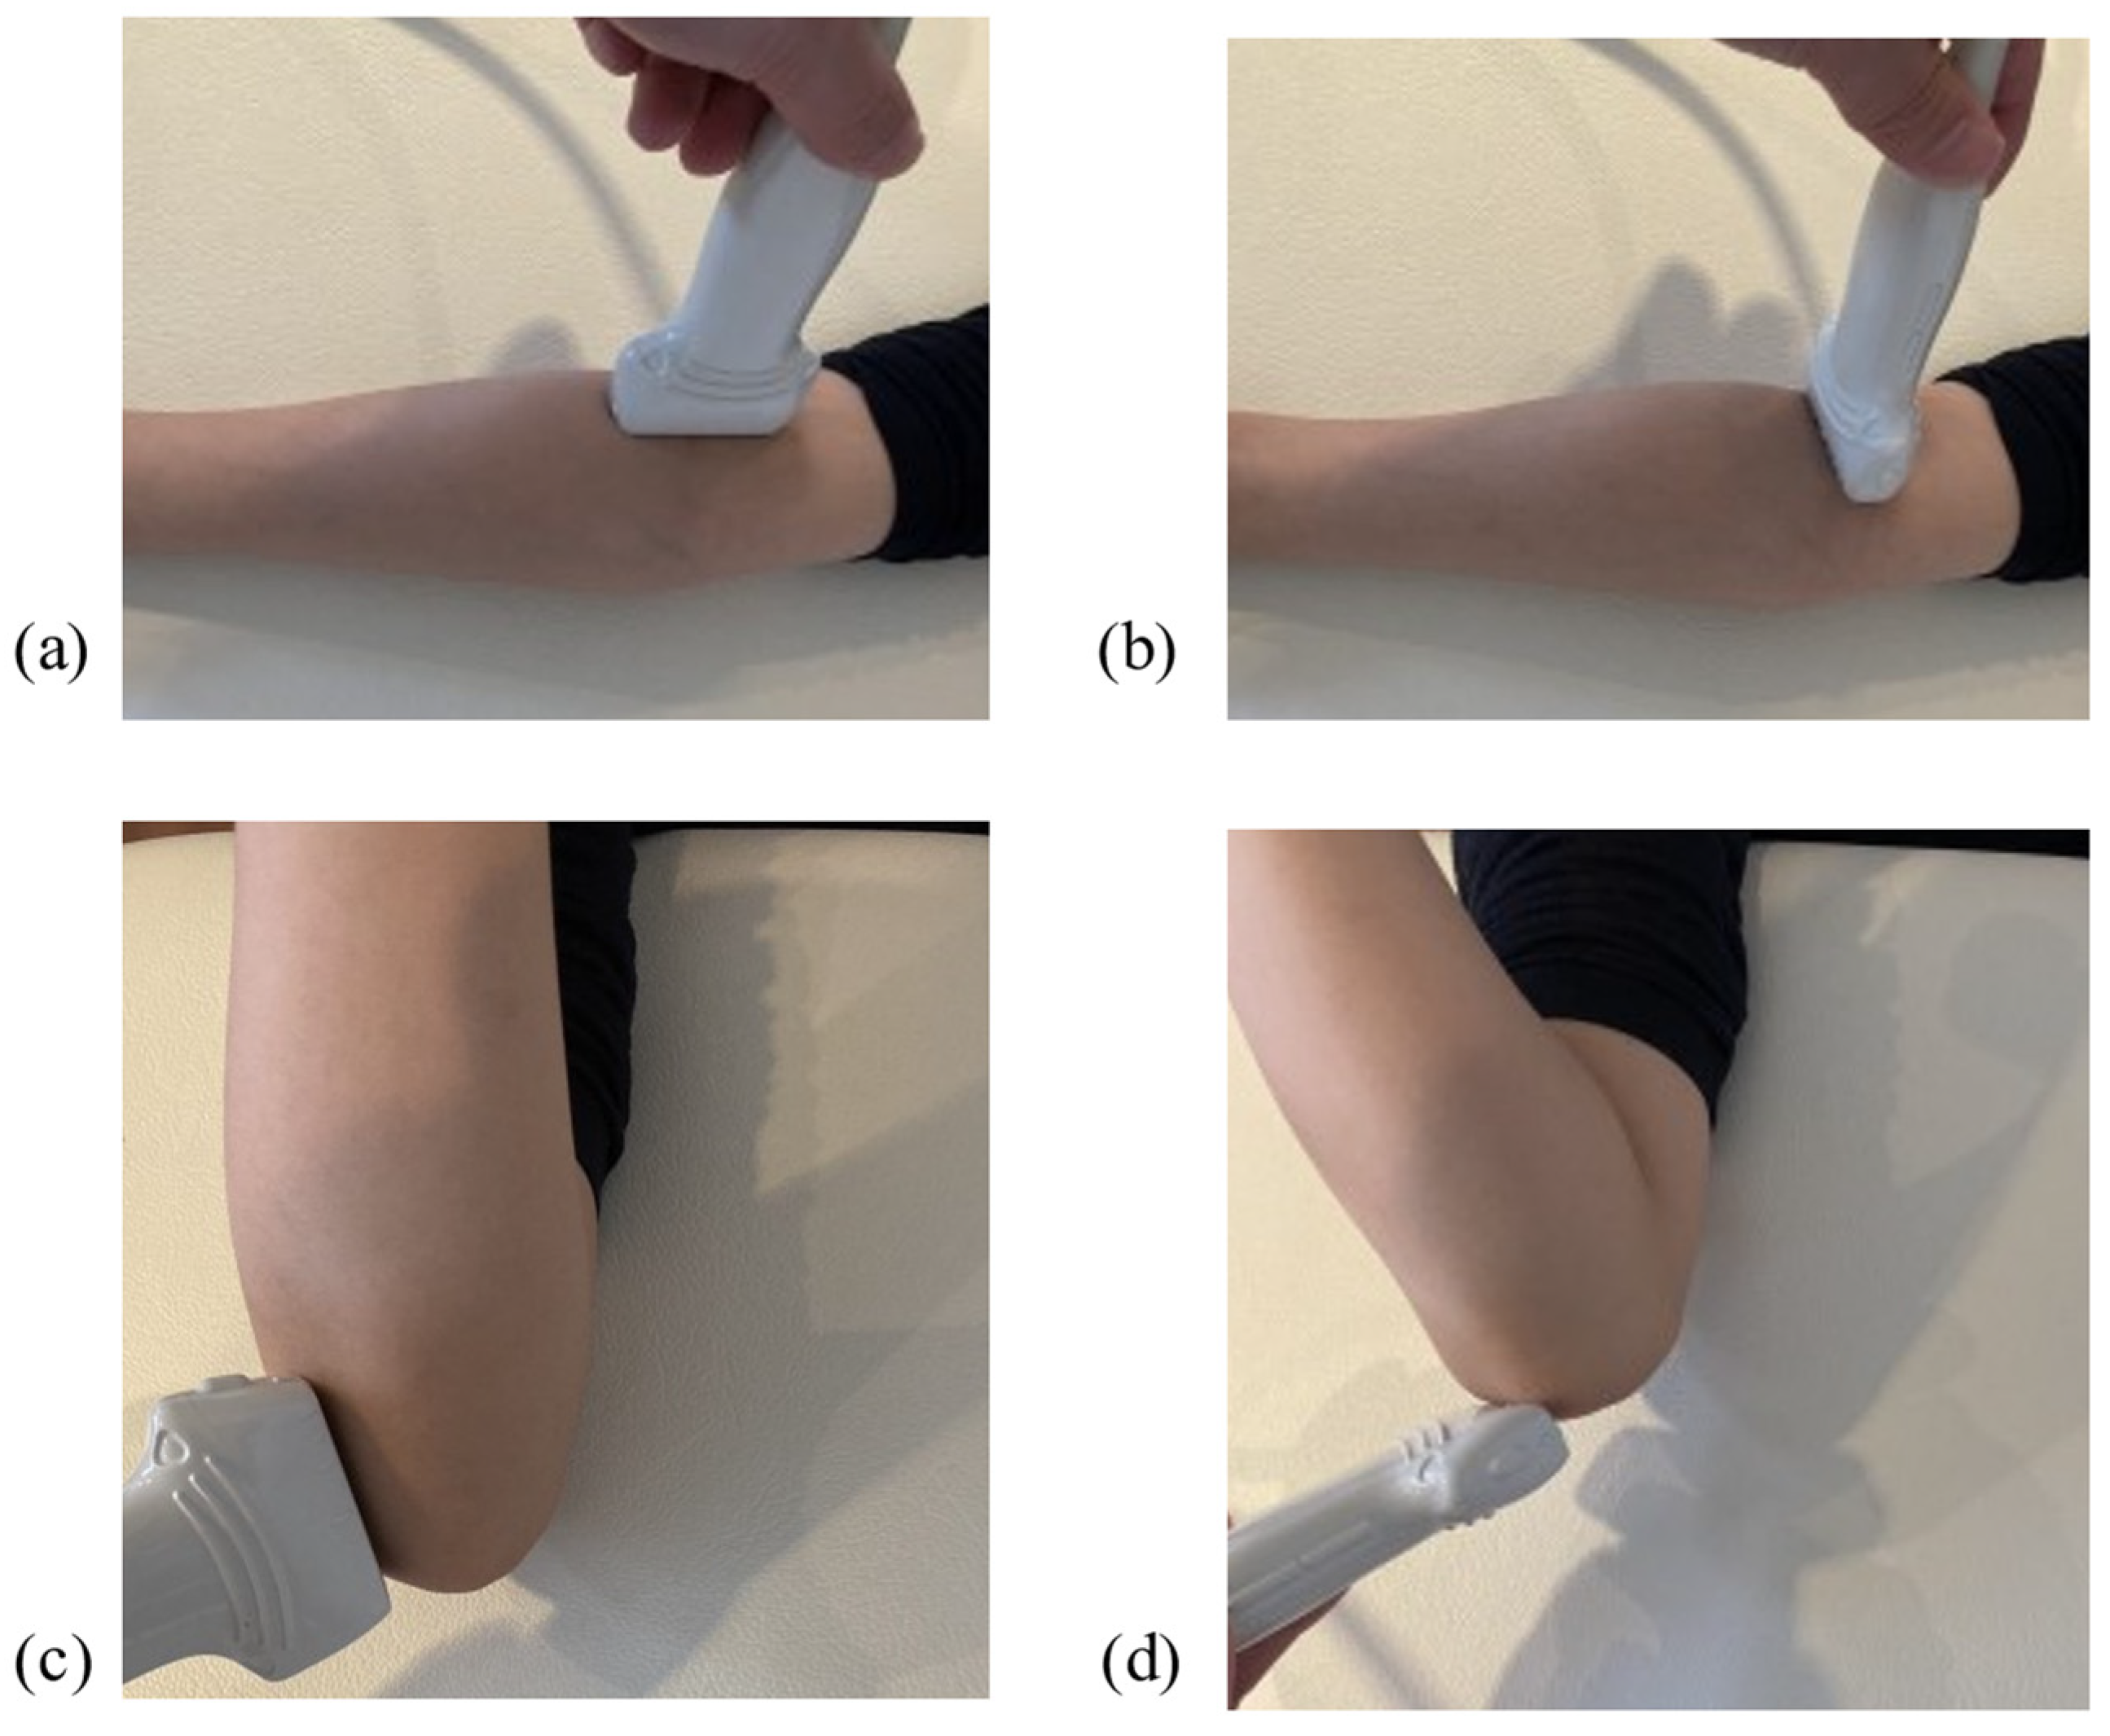
2.1. Data Collection

A total of 44 cases included those who were found to have OCD at medical checkups and those who were treated for OCD at the authors’ institution. Normal data were obtained from US images of the contralateral elbow joint or from cases in which no abnormalities were found at the medical checkup. Movies were obtained from four directions: anterior short (AS) axis and anterior long (AL) axis in elbow extension, and posterior short (PS) axis and posterior long (PL) axis in elbow maximum flexion (Figure 1). The movie was recorded at 30 frames per second while the 15 or 18 MHz liner US probe (Arietta prologue, FUJIFILM, Tokyo, Japan) was placed in the anterior or posterior center of the elbow-joint surface to delineate the standard view. To increase image variation, the probe was slowly tilted and slid against the surface of the elbow joint while capturing the movies. A total of 2430 images were generated from the movies by cropping the region of interest and capturing the images from the movies. A breakdown of the dataset is shown in Table 1. Using this dataset, we trained the YOLOv8 model to perform two tasks: image classification and object detection. The images were resized into 640 × 640 and augmented using Albumentations (version 1.0.3), which is a Python library for image augmentation. The parameters for image augmentation were the following: Blur (probability of applying the transform; p = 0.01), MedianBlur (p = 0.01), ToGray (p = 0.01), Contrast Limited Adaptive Histogram Equalization (p = 0.01), RandomBrightnessContrast (p = 0.01), RandomGamma (p = 0.01), and ImageCompression (p = 0.01).
The first task was to classify images with OCD lesions. Two classification tasks were used in the classification task. The first classification task was a two-class classification into “with OCD” and “without OCD”. The second classification task was to classify images with a normal elbow joint (standard view). This was a multi-class classification of four standard views: AS axis, AL axis, PS axis, and PL axis from the obtained image dataset. The definition of each class is as follows: AS—region showing the humeral trochlea and capitellum; AL—region showing the round shape of the humeral capitellum and radial head; PS view—area showing the outline of the ulnar olecranon and humeral capitellum; PL view—area showing the round shape of humeral capitellum and radial head; OCD—the irregular surface of the cartilage and the interruption or double line of the subchondral bone line which has high echogenicity (Figure 2 and Figure 3).
The second task was an object detection task. The annotation tool LabelImg (ver. 1.8.1) was used for labeling the US image. Annotation was performed manually by one orthopedic surgeon skilled in US examinations. Bounding boxes were set up for a total of five classes of regions to detect standard views of the elbow joint and OCD lesions.

2.2. Model Training

2.2.1. Image Classification Task

Two tasks were performed: a binary classification to classify normal and OCD images and a task to classify normal elbow-joint images into 4 classes. Of several pre-trained YOLOv8 models, the lightest model, YOLOv8n-cls (parameter size 2.7 M), was used. Transfer learning was performed on OCD data using YOLOv8n-cls pre-trained weight data. The software and computer used for training were as follows: Ultralytics YOLOv8.0.58, Python-3.9.13, PyTorch-1.13.1 GPU, and NVIDIA GeForce RTX 3050 laptop GPU. The training parameters were as follows: optimizer = SGD; initial learning ratio = 0.01; momentum = 0.937; epochs = 50. Of the total US image data, 60% was randomly assigned as training data, 20% as validation data, and the remaining 20% as test data. The performance of the trained model was evaluated using the test dataset, and accuracy, precision, recall, and F-measure were calculated from the confusion matrix. The area under the receiver-operating characteristic (ROC) curve (AUC) was also calculated to evaluate the accuracy of the model.

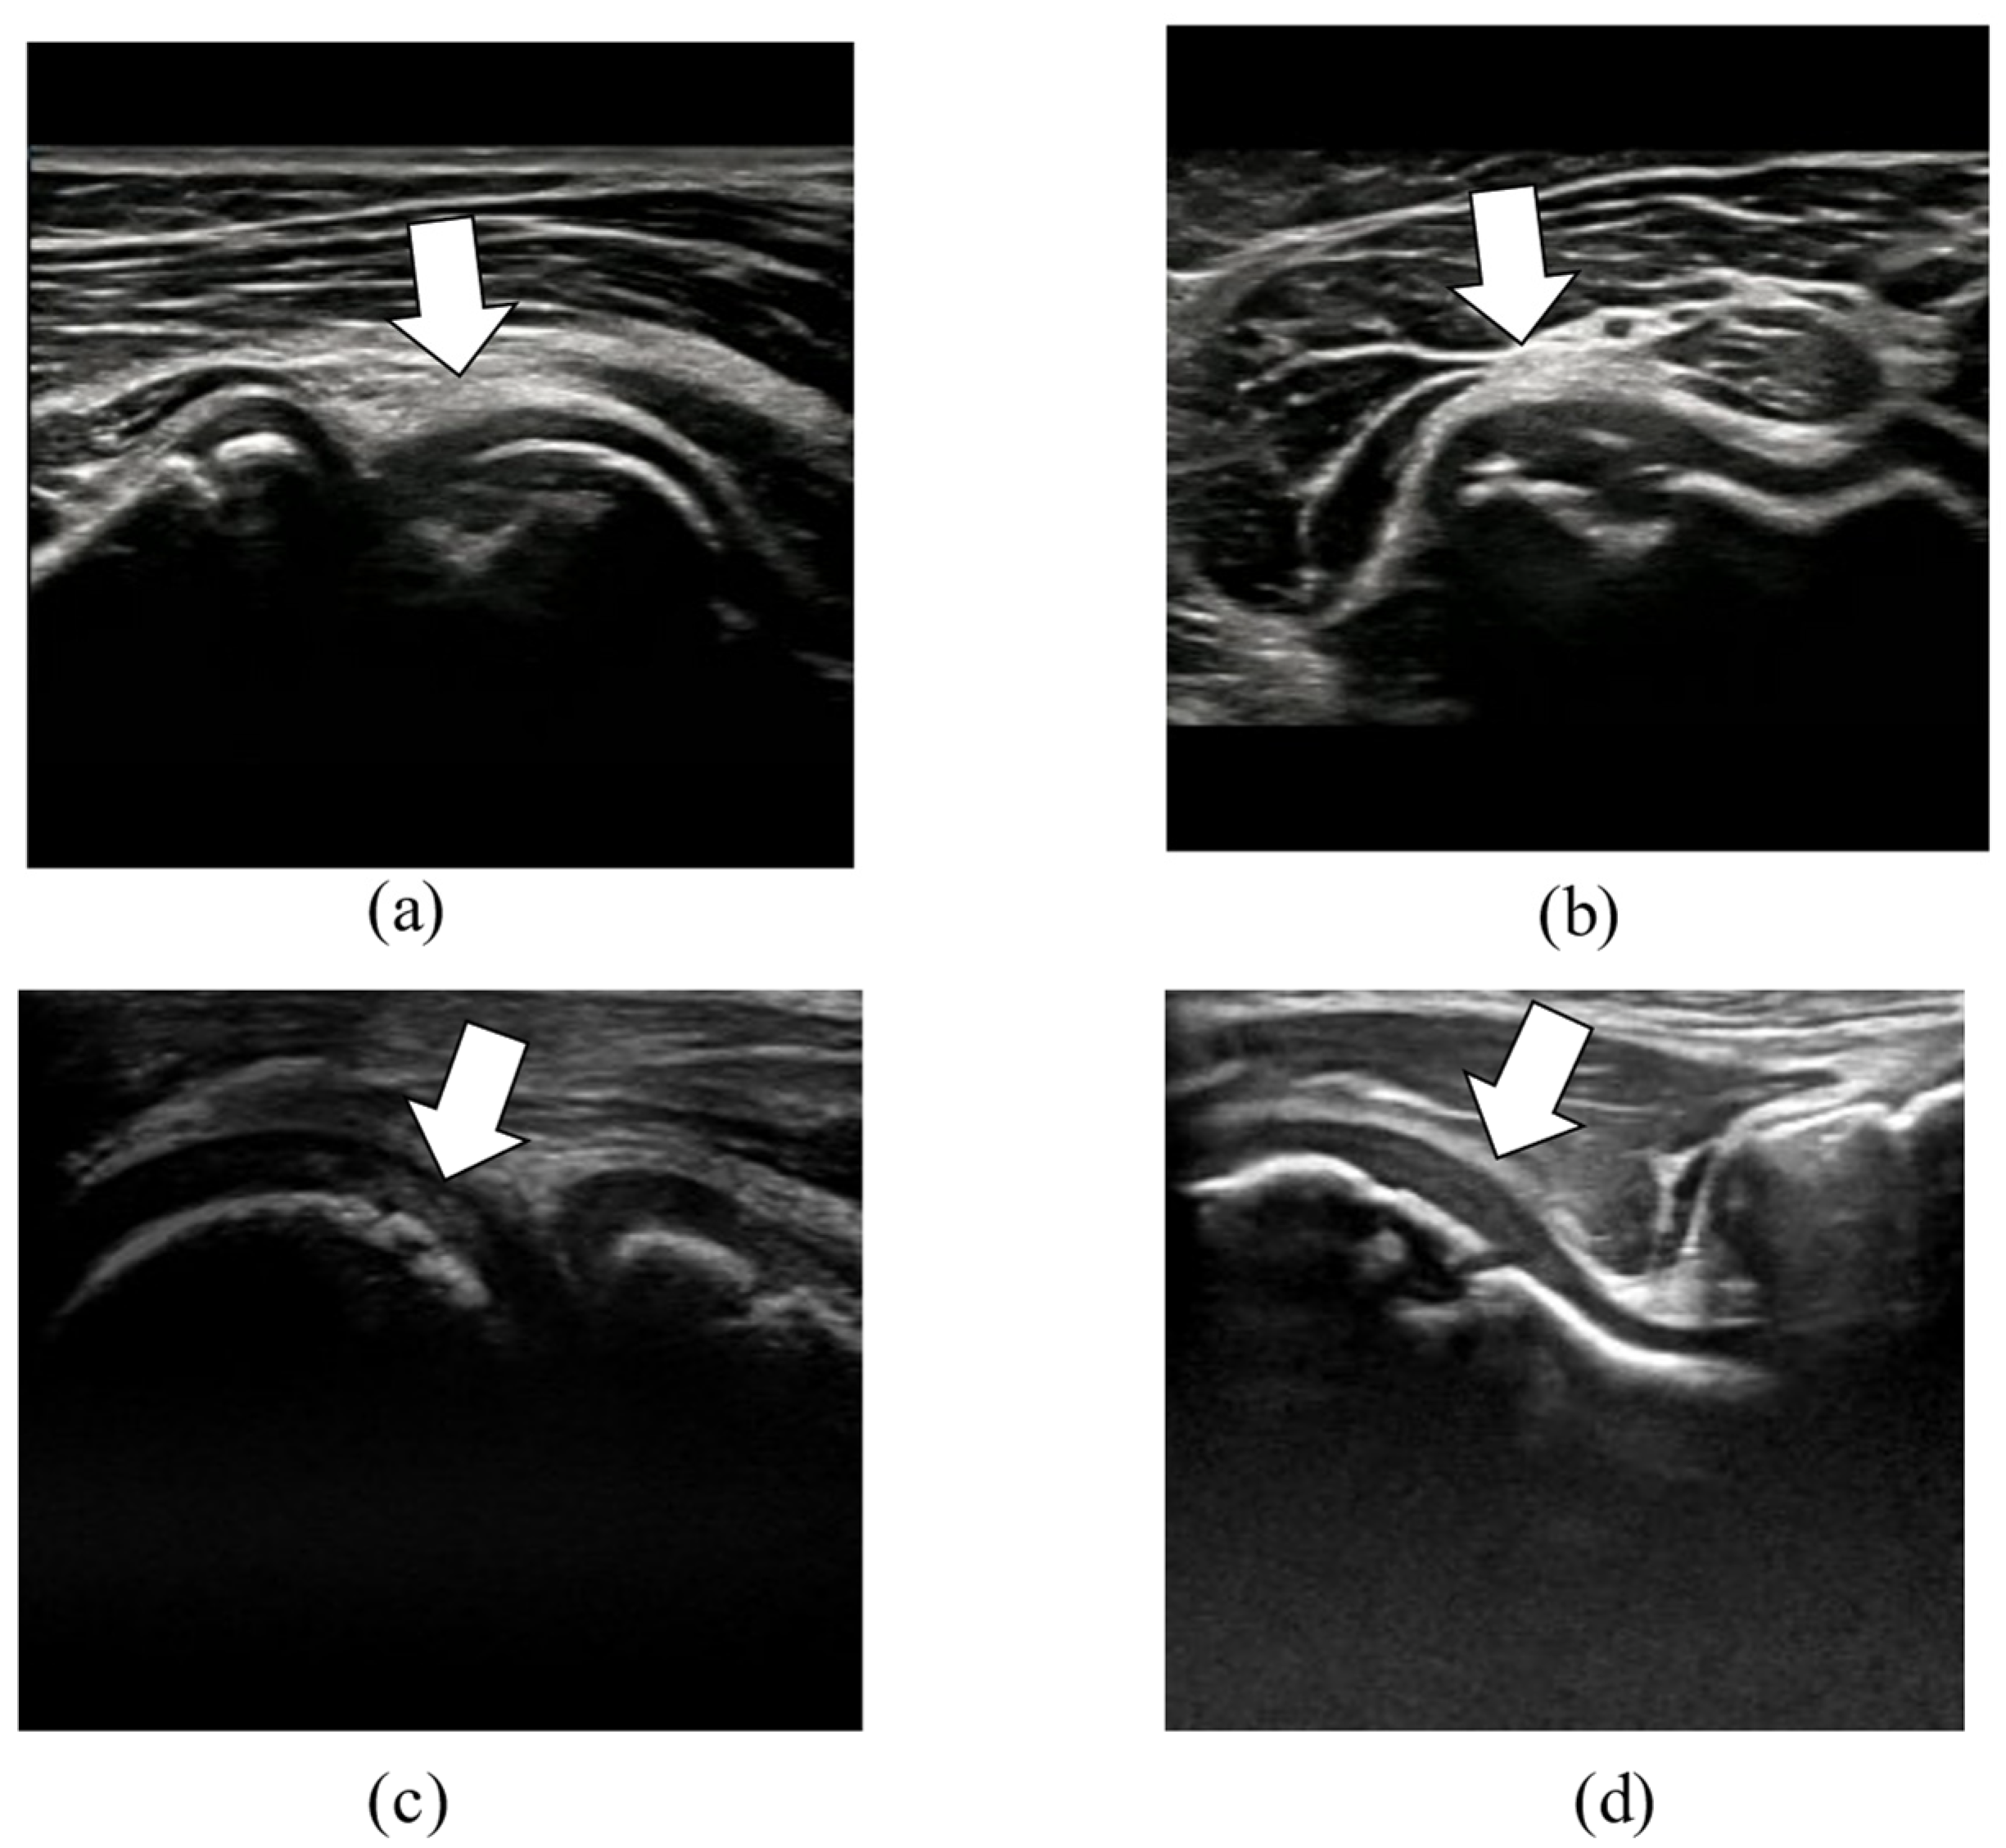
2.2.2. Object Detection Task

The YOLOv8n model, which has the fewest parameters (parameter size 3.0 M) among the pre-trained models in YOLOv8, and the YOLOv8m model, which has a moderate number of parameters (parameter size 25.8 M), were selected as object detection models. These models were compared with YOLOv5, a previous-generation model presented by the same group. For YOLOv5 models, the YOLOv5n model (parameter size 1.8 M) and the YOLOv5m model (parameter size 20.8 M) were used. US images and bounding-box label information were used as input data, and transfer learning was performed using the pre-trained weights of YOLOv8. Five classes (AL, AS, PL, PS, and OCD) of object detection tasks were performed. To evaluate the detection accuracy of the trained models, we checked the mean average precision (mAP), the Precision–Recall curve, and the F-measure Confidence curve, which are widely used evaluation metrics in object detection tasks. The term mAP (0.5) is the mAP calculated at an intersection over the Union (IoU) threshold of 0.5, while mAP (0.5–0.95) is the average of the mAP calculated at multiple IoU thresholds ranging from 0.5 to 0.95 with a step size of 0.05. The Precision–Recall curve is a curve with Recall as the X-axis and Precision as the Y-axis; Precision indicates the ratio of correct bounding boxes detected, while Recall indicates the ratio of bounding boxes that should be detected.
We also checked the computational speed of the model on the computer in terms of inference time per image and the number of floating-point operations per second (FLOPs) that the computer can perform. In addition, a graphical user-interface (GUI) application was created on a local personal computer using the YOLOv8 and YOLOv5 environments, and its performance was evaluated by connecting the computer to a US imaging system.

3. Results

3.1. Image Classification

The confusion matrix for the binary classification of normal and OCD lesions is shown in Table 2. The calculated values from the confusion matrix were the following: Accuracy = 0.998, Recall = 0.9975, Precision = 1.000, and F-measure = 0.9987. The AUC calculated from the ROC curve was 1.000.
Table 3 shows the confusion matrix of the multiclass classification that classifies the standard view of the elbow joint in the anterior long axis (AL), anterior short axis (AS), posterior long axis (PL), and posterior short axis (PS) of the elbow joint. The calculated values from the confusion matrix were the following: Accuracy = 0.988, mean Recall = 0.990, mean Precision = 0.991, and mean F-measure = 0.990. The AUC calculated from the ROC curve was 1.000 for all classes.

3.2. Object Detection

The mAPs, speeds, and FLOPs of the models trained in this study are shown in Table 4. The detection accuracy comparing the bounding box detected by the trained model with the true-label bounding box annotated by the physician was 0.994 for mAP (50) and 0.787 for mAP (50–95) for the YOLOv8n model and 0.995 for mAP (50) and 0.782 for mAP (50–95) for the YOLOv8m model. The inference speed and FLOPs per image were 2.9 ms and 8.2 GFLOPs for the YOLOv8n model and 13.7 ms and 79.1 GFLOPs for the YOLOv8m model. The mAP (50), mAP (50–95), speed, and FLOPS were 0.998, 0.666, 8.2, and 4.1 for the YOLOv5n model and 0.993, 0.714, 12.4.47.9 for the YOLOv5m model, respectively. The YOLOv8 model outperformed the YOLOv5 model in both detection accuracies. The Precision–Recall curves and F-measure Confidence curves are shown in Figure 3. The F-measure Confidence curve can visualize the Confidence that optimizes Precision and Recall. Normally, a higher Confidence is considered better. In this study, the optimal value of F-measure Confidence was 0.701 for the YOLOv8n model and 0.781 for the YOLOv8m model. The larger the AUC of the Precision–Recall curve, the better-performing the machine-learning model is. In this study, the AUC of the Precision–Recall curve for the YOLOv8n model was 0.994 and 0.995 for the YOLOv8m model (Figure 4).
An example of detection performed on a video of an actual OCD case and the appearance of the GUI application are shown. By using the object detection model, it was possible to detect standard views and OCD areas with high accuracy (Figure 5).

4. Discussion

In the examination of baseball elbow, the detection rate of abnormalities has been reported in several studies. The definition of abnormal findings is described in a previous report [17]. An irregularity, a break in the continuity of the high echogenic line of subchondral bone, or a double line of the subchondral bone of the capitellum were determined to be abnormal findings. A positive finding was declared when the aforementioned abnormalities were observed on the throwing side. In 2018, Maruyama et al. reported a 1–3% detection rate in elementary through to high-school students [18]. Another report showed that 4% of children in medical checkups for baseball elbow showed abnormalities on an US and, among them, 50% showed abnormal findings upon X-ray examination [19]. In 2017, Otoshi et al. reported the frequency of elbow OCD by baseball position. Among a total of 4249 participants, the overall prevalence of capitellar OCD diagnosed by US imaging was 2.2% (93 participants). As for playing positions, catchers had the highest prevalence of OCD (3.4%), followed by pitchers (2.5%). The prevalence for infielders and outfielders was 2.2% and 1.8%, respectively. There was no significant difference in the incidence of OCD by position [20]. These are the reports from a facility that performs frequent baseball-elbow examinations and has an expert in US examination. On the other hand, inexperienced US examiners may have difficulty detecting the standard view of elbow joints. Therefore, we hypothesized that AI technology could assist technically inexperienced examiners by helping with the detection of standard views, which could be useful for mass examination.
Two tasks were performed in this study: image classification and object detection. First, we employed an image classification task using a standard view that accurately depicts the elbow joint. OCD lesions exhibit characteristic US images with features such as subchondral bone irregularities or double lines, which can be easily recognized. The AI model used in this study was also able to classify the image with OCD lesions with high accuracy. Moreover, the model was able to classify the standard view of the elbow joint with high accuracy. The result indicates that the trained AI model can detect standard views of normal elbow joints and OCD lesions. Second, we used an object detection task. Several YOLO models were trained to detect the standard view of the elbow joint and OCD lesions in the object detection task. The YOLOv8n model showed an mAP (50) of 0.991 and an mAP (50–95) of 0.784, while the YOLOv8m model showed an mAP (50) of 0.991 and an mAP (50–95) of 0.784. In the YOLOv5 model, the mAP (50) and mAP (50–95) were 0.998 and 0.666 for the YOLOv5n model, respectively, and 0.993 and 0.714 for the YOLOv5m model, respectively. The mAP values for the YOLOv8 models were higher than those for the YOLOv5 models. In general, a machine-learning model with good performance does not over-detect, even if the IOU threshold is reduced, and Precision remains high. The area under the Precision–Recall curve is sufficiently large for the model used in this study, indicating that the trained model showed good performance.
The F-measure Confidence curve allows visualization of the thresholds that optimize Precision and Recall. In this study, the optimal value of F-measure Confidence was 0.701 for the YOLOv8n model and 0.781 for the YOLOv8m model, with higher confidence for the YOLOv8m model. Therefore, the YOLOv8m model is considered more suitable if the computer’s computational speed is fast enough. On the other hand, the inference speed and FLOPs per image were 2.9 ms and 8.2 GFLOPs for the YOLOv8n model and 13.7 ms and 79.1 GFLOPs for the YOLOv8m model. These results suggest that both models are capable of real-time detection, but YOLOv8n is more suitable when the computer’s computational speed is not sufficient.
These results suggest that AI technology can assist inexperienced examiners and contribute to the accurate detection of abnormalities in the examination of baseball elbow.
In a prior investigation, we performed a binary classification task using images with OCD or images without OCD [21]. Images were captured from only two views, the anterior long and posterior long axes. Three DL models were compared, with accuracies of 0.818 in ResNet50, 0.841 in MobileNet_v2, and 0.872 in EfficientNet. In the present study, the accuracy of binary classification was 0.998 in the YOLOv8n-cls model, which is higher compared with the previous report. An object detection task was also performed in the prior report using the YOLOv2 model for OCD lesions. The YOLOv2 model successfully detected OCD with an average precision of 0.83 in the object detection task. However, when the YOLOv2 model was used to detect OCD lesions in the sports field, it showed a high false-positive rate due to its response to subcutaneous and muscle tissue when the standard view was not depicted. Therefore, it was considered necessary for inexperienced examiners to first visualize the standard view of the elbow joint. By detecting the anterior long axis, anterior short axis, posterior long axis, posterior short axis, and OCD region of the elbow joint by the AI model, inexperienced examiners could easily detect standard views and lesion areas. In the present study using the YOLOv8 model, the mAP (50) was 0.994 for the YOLOv8n model and 0.995 for the YOLOv8m model in the four standard views of the elbow joint and in the detection of OCD lesions. The mAP (50) was 0.998 for the YOLOv5n model and 0.993 for the YOLOv5m model. Although the dataset used in this study was slightly larger than those in previous studies, the model performance was better than in the previous report. Our results showed that the model could accurately detect both standard views of elbow joints and OCD lesions. Furthermore, visualization of the standard view prevents the false detection of OCD in extra-articular tissues such as subcutaneous tissue.
Medical AI requires that the basis for the model’s decisions be understandable to humans, called eXplainable AI (XAI). XAI has become an increasingly important field of research in recent years, and it promotes the formulation of explainability methods and provides a rationale that allows users to comprehend the results generated by AI systems. In the field of XAI for image data, overlaying image features such as GradientCAM and occlusion sensitivity as a heatmap is a common method. Our previous reports have shown that OCD lesion classification models capture features such as subchondral bone discontinuity and judge the lesions in a manner similar to human judgment [21]. Although occlusion sensitivity is an effective visualization tool due to its high spatial resolution and heat map accuracy, the computational complexity can cause issues with real-time display. To address this, we used a “two-shot” detection model that detects the standard view of elbow joints and OCD lesions. This method prevents false positives and can be easily reproduced by inexperienced examiners.
Finally, we developed a GUI application running in a Python environment and connected it to a commercial laptop computer (Asus, ROG Zephyrus G14, CPU AMD ryzen7, GPU NVIDIA RTX3050) that was integrated with the US imaging system. The system operated at approximately 15 frames per second, making it suitable for real-time detection in medical examinations.
There are several limitations to this study. The number of US data images is about 2000 from 40 cases, but we believe that more is needed in terms of the number of cases. In particular, since the dataset presented here is data from a single institution, it will be necessary to integrate data from other institutions in the future. Secondly, the videos were captured by multiple experts, but the labeling was conducted by a single orthopedic surgeon who is skilled in AI research. This may have caused overfitting of the AI model. Therefore, labeling of the various types of images by multiple experts may be necessary to improve the generalization performance of the AI model. In addition, the accuracy of the actual medical checkups has not been verified, and future examinations are needed to verify the accuracy of the data.

5. Conclusions

The YOLOv8 model was trained for image classification and object detection of standard views of the elbow joints and OCD lesions. Both tasks were able to be achieved with high accuracy and may be useful for the future mass-screening at medical check-ups for baseball elbow.

Author Contributions

Conceptualization, A.I. and Y.M.; Methodology, A.I.; Software, A.I. and S.F.; Validation, H.N., S.M., S.T. (Shuya Tanaka), T.F., T.K., M.K., S.T. (Shunsaku Takigami) and Y.E.; Formal Analysis, A.I. and S.F.; Investigation, A.I.; Resources, H.N., S.M., S.T. (Shuya Tanaka), T.F., T.K., M.K., S.T. (Shunsaku Takigami) and Y.E.; Writing—Original Draft Preparation, A.I.; Writing—Review and Editing, A.I. and Y.M.; Visualization, S.F.; Supervision, Y.M.; Project Administration, R.K. All authors have read and agreed to the published version of the manuscript.

Funding

This research received funding from KAKENHI no. 22K09399.

Institutional Review Board Statement

The study was conducted according to the guidelines of the Declaration of Helsinki and approved by the Ethics Committee of Kobe University Graduate School of Medicine (No. B21009; 21 April 2021).

Informed Consent Statement

Informed consent was obtained from all subjects involved in the study.

Data Availability Statement

The data presented in this study are available upon request from the corresponding author. The data are not publicly available because of confidentiality concerns.

Conflicts of Interest

The authors declare no conflict of interest.

References

  1. Kida, Y.; Morihara, T.; Kotoura, Y.; Hojo, T.; Tachiiri, H.; Sukenari, T.; Iwata, Y.; Furukawa, R.; Oda, R.; Arai, Y.; et al. Prevalence and Clinical Characteristics of Osteochondritis Dissecans of the Humeral Capitellum Among Adolescent Baseball Players. Am. J. Sports Med. 2014, 42, 1963–1971. [Google Scholar] [CrossRef] [PubMed]
  2. Matsuura, T.; Suzue, N.; Iwame, T.; Nishio, S.; Sairyo, K. Prevalence of Osteochondritis Dissecans of the Capitellum in Young Baseball Players: Results Based on Ultrasonographic Findings. Orthop. J. Sports Med. 2014, 2, 2325967114545298. [Google Scholar] [CrossRef] [PubMed]
  3. Bruns, J.; Werner, M.; Habermann, C.R. Osteochondritis Dissecans of Smaller Joints: The Elbow. Cartilage 2021, 12, 407–417. [Google Scholar] [CrossRef] [PubMed]
  4. Sayani, J.; Plotkin, T.; Burchette, D.T.; Phadnis, J. Treatment Strategies and Outcomes for Osteochondritis Dissecans of the Capi-tellum. Am. J. Sports Med. 2021, 49, 4018–4029. [Google Scholar] [CrossRef] [PubMed]
  5. Matsuura, T.; Iwame, T.; Iwase, J.; Sairyo, K. Osteochondritis Dissecans of the Capitellum: Review of the Literature. J. Med. Investig. 2020, 67, 217–221. [Google Scholar] [CrossRef] [PubMed]
  6. Yoshizuka, M.; Sunagawa, T.; Nakashima, Y.; Shinomiya, R.; Masuda, T.; Makitsubo, M.; Adachi, N. Comparison of sonography and MRI in the evaluation of stability of capitellar osteochondritis dissecans. J. Clin. Ultrasound 2018, 46, 247–252. [Google Scholar] [CrossRef] [PubMed] [Green Version]
  7. Iwame, T.; Matsuura, T.; Suzue, N.; Kashiwaguchi, S.; Iwase, T.; Fukuta, S.; Hamada, D.; Goto, T.; Tsutsui, T.; Wada, K.; et al. Outcome of an elbow check-up system for child and adolescent baseball players. J. Med. Investig. 2016, 63, 171–174. [Google Scholar] [CrossRef] [PubMed] [Green Version]
  8. Ikeda, K.; Okamoto, Y.; Ogawa, T.; Terada, Y.; Kajiwara, M.; Miyasaka, T.; Michinobu, R.; Hara, Y.; Yoshii, Y.; Nakajima, T.; et al. Use of a Small Car-Mounted Magnetic Resonance Imaging System for On-Field Screening for Osteochondritis Dissecans of the Humeral Capitellum. Diagnostics 2022, 12, 2551. [Google Scholar] [CrossRef] [PubMed]
  9. Potocnik, J.; Foley, S.; Thomas, E. Current and potential applications of artificial intelligence in medical imaging practice: A nar-rative review. J. Med. Imaging Radiat. Sci. 2023, 54, 376–385. [Google Scholar] [CrossRef] [PubMed]
  10. Shinohara, I.; Inui, A.; Mifune, Y.; Nishimoto, H.; Yamaura, K.; Mukohara, S.; Yoshikawa, T.; Kato, T.; Furukawa, T.; Hoshino, Y.; et al. Using deep learning for ultrasound images to diagnose carpal tunnel syndrome with high accuracy. Ultrasound Med. Biol. 2022, 48, 2052–2059. [Google Scholar] [CrossRef] [PubMed]
  11. Shinohara, I.; Inui, A.; Mifune, Y.; Nishimoto, H.; Mukohara, S.; Yoshikawa, T.; Kuroda, R. Ultrasound With Artificial Intelligence Models Predicted Palmer 1B Triangular Fibrocar-tilage Complex Injuries. Arthroscopy 2022, 38, 2417–2424. [Google Scholar] [CrossRef] [PubMed]
  12. Redmon, J.; Divvala, S.; Girshick, R.; Farhadi, A. You Only Look Once: Unified, Real-Time Object Detection. In Proceedings of the 2016 IEEE Conference on Computer Vision and Pattern Recognition (CVPR), Las Vegas, NV, USA, 27–30 June 2016; pp. 779–788. [Google Scholar] [CrossRef] [Green Version]
  13. Redmon, J.; Farhadi, A. YOLO9000: Better, Faster, Stronger. In Proceedings of the IEEE Conference on Computer Vision and Pattern Recognition (Cvpr 2017), Honolulu, HI, USA, 21–26 July 2017; pp. 6517–6525. [Google Scholar]
  14. Aly, G.H.; Marey, M.; El-Sayed, S.A.; Tolba, M.F. YOLO Based Breast Masses Detection and Classification in Full-Field Digital Mammograms. Comput. Methods Programs Biomed. 2021, 200, 105823. [Google Scholar] [CrossRef] [PubMed]
  15. Su, Y.; Liu, Q.; Xie, W.; Hu, P. YOLO-LOGO: A transformer-based YOLO segmentation model for breast mass detection and seg-mentation in digital mammograms. Comput. Methods Programs. Biomed. 2022, 221, 106903. [Google Scholar] [CrossRef] [PubMed]
  16. Li, J.; Li, S.; Li, X.; Miao, S.; Dong, C.; Gao, C.; Liu, X.; Hao, D.; Xu, W.; Huang, M.; et al. Primary bone tumor detection and classification in full-field bone radiographs via YOLO deep learning model. Eur. Radiol. 2022, 33, 4237–4248. [Google Scholar] [CrossRef] [PubMed]
  17. Sakata, J.; Ishikawa, H.; Inoue, R.; Urata, D.; Ohinata, J.; Kimoto, T.; Yamamoto, N. Physical functions, to be or not to be a risk factor for osteochondritis dissecans of the humeral capitellum? JSES Int. 2022, 6, 1072–1077. [Google Scholar] [CrossRef] [PubMed]
  18. Maruyama, M.; Takahara, M.; Satake, H. Diagnosis and treatment of osteochondritis dissecans of the humeral capitellum. J. Orthop. Sci. 2018, 23, 213–219. [Google Scholar] [CrossRef] [PubMed]
  19. Matsuura, T.; Iwame, T.; Suzue, N.; Takao, S.; Nishio, S.; Arisawa, K.; Sairyo, K. Cumulative Incidence of Osteochondritis Dissecans of the Capitellum in Preadolescent Baseball Players. Arthroscopy 2019, 35, 60–66. [Google Scholar] [CrossRef] [PubMed]
  20. Otoshi, K.; Kikuchi, S.; Kato, K.; Sato, R.; Igari, T.; Kaga, T.; Konno, S. Age-Specific Prevalence and Clinical Characteristics of Humeral Medial Epicondyle Apophysitis and Osteochondritis Dissecans: Ultrasonographic Assessment of 4249 Players. Orthop. J. Sports Med. 2017, 5, 2325967117707703. [Google Scholar] [CrossRef] [PubMed]
  21. Shinohara, I.; Yoshikawa, T.; Inui, A.; Mifune, Y.; Nishimoto, H.; Mukohara, S.; Kato, T.; Furukawa, T.; Tanaka, S.; Kusunose, M.; et al. Degree of Accuracy with Which Deep Learning for Ultrasound Images Identifies Osteochondritis Dissecans of the Humeral Capitellum. Am. J. Sports Med. 2023, 51, 358–366. [Google Scholar] [CrossRef] [PubMed]
Figure 1. Elbow position during US image data collection: (a) anterior long view; (b) anterior short view; (c) posterior long view; (d) posterior short view.
Applsci 13 07623 g001
Figure 2. Representative data of the standard view of a normal US image: (a) anterior long view; (b) anterior short view; (c) posterior long view; (d) posterior short view.
Applsci 13 07623 g002
Figure 3. Representative data of the standard view of an OCD US image. The arrow indicates the OCD lesion. (a) Anterior long view. (b) Anterior short view. (c) Posterior long view. (d) Posterior short view.
Applsci 13 07623 g003
Figure 4. F-measure Confidence curve and Precision–Recall curve (a) F-measure Confidence curve of YOLOv8n. (b) F-measure Confidence curve for YOLOv8m. (c) Precision–Recall curve for YOLOv8n. (d) Precision–Recall curve for YOLOv8m.
Applsci 13 07623 g004
Figure 5. (a) Detection of the anterior long view of the elbow joint and OCD lesion. (b) Screenshot of the GUI application designed for “Medical checkup for baseball elbow”.
Applsci 13 07623 g005
Table 1. Breakdown of elbow US image dataset.
NormalOCDTotal
Anterior long439270709
Anterior short278256534
Posterior long425362787
Posterior short200200400
Total134210882430
Table 2. Confusion matrix of binary classification.
Predicted Label
NormalOCD
True LabelNormal4770
OCD1393
Table 3. Confusion matrix of multiclass classification to classify the standard view of the elbow joint.
Predicted Label
ALASPLPS
True LabelAL137060
AS010900
PL001580
PS00080
AL: anterior long, AS: anterior short, PL: posterior long, PS: posterior short.
Table 4. Size of parameters and Performance scores of two object detection models.
ModelParameters (M)mAP(50)mAP(50–95)Speed
(ms/pic)
FLOPs
(G)
YOLOv8n3.00.9940.7872.98.2
YOLOv8m25.80.9950.78213.779.1
YOLOv5n1.80.9880.6668.24.1
YOLOv5m20.80.9930.71412.447.9
Disclaimer/Publisher’s Note: The statements, opinions and data contained in all publications are solely those of the individual author(s) and contributor(s) and not of MDPI and/or the editor(s). MDPI and/or the editor(s) disclaim responsibility for any injury to people or property resulting from any ideas, methods, instructions or products referred to in the content.

