Article

Optimization of Vehicle Powertrain Mounting System Based on Generalized Inverse Cascade Method under Uncertainty

1
School of Intelligent Manufacturing and Automotive, Chongqing Technology and Business Institute, Chongqing 401520, China
2
School of Mechanical Engineering, Southwest Jiaotong University, Chengdu 610031, China
3
National Laboratory for Rail Transportation, Southwest Jiaotong University, Chengdu 610031, China
*
Authors to whom correspondence should be addressed.
Appl. Sci. 2023, 13(13), 7615; https://doi.org/10.3390/app13137615
Submission received: 19 May 2023 / Revised: 20 June 2023 / Accepted: 21 June 2023 / Published: 28 June 2023
(This article belongs to the Special Issue Recent Advances in Autonomous Systems and Robotics)

Abstract

:
This paper presents a summary of the optimization design process for a multi-objective, two-level engineering problem, utilizing the generalized inverse cascade method under uncertainty. The primary objective is to enhance the vibration isolation performance of a mounting system, considering the influence of uncertain factors on its stiffness. The focus is on determining the value range of the design variables at the bottom layer, ensuring that the design goal is met with a specified confidence level. To illustrate the application of this methodology, the optimization design of a powertrain mount is used as a case study. A data-driven approach is adopted, establishing a quantitative mapping relationship between mount stiffness, force transmission rate, modal decoupling rate, and other design indicators. This is achieved through the development of a CRBM-DBN approximate model, which combines Conditional Restricted Boltzmann Machines (CRBMs) and a Deep Belief Network (DBN). Additionally, an intelligent optimization algorithm and interval search technology are employed to determine the optimal design interval for the mount stiffness. Simulation and experimental verification are conducted using selected parameter combinations. The results demonstrate notable improvements in the vibration isolation performance, modal decoupling rate, and vehicle NVH performance when compared to the original state. These findings provide valuable insights for the interval optimization design of similar multi-objective, as well as two-level engineering problems, serving as useful references for future research and applications.

1. Introduction

The optimization of the powertrain mount design holds significant engineering importance, as these mounts play a crucial role in reducing vibration and noise in both conventional fuel vehicles and electric vehicles, thereby directly impacting the NVH (Noise, Vibration, Harshness) performance experienced by vehicle users [1,2].
Previous studies on powertrain mount optimization have encompassed diverse methodologies. Wang Yanan et al. [3] introduced the concept of generalized force transmissibility (GFT) and the summation of GFT integrals as appropriate indicators for assessing the vibration isolation performance of powertrain mounting systems. Their proposed design optimization methodology incorporated multiple design variables, rigid-body modal frequency constraints, and the objective of minimizing the sum of GFT integrals. Shangguan Wenbin et al. [4] presented a design rationale and computational approach for determining the stiffness and damping of a powertrain mounting system by considering the reduction in vehicle vibration and noise attributed to the mounts. Sun Qi et al. [5] developed a dynamic model of a powertrain mounting system to investigate the multi-dimensional coupling vibration characteristics. They computed the natural frequencies with six degrees of freedom and validated the decoupling conditions of the most significant vibration modes through the design and verification of a powertrain mounting system for a heavy truck. These studies primarily treated relevant parameters as deterministic values, yielding fixed, single values for optimization outcomes [6,7,8,9,10,11,12]. However, during the mount manufacturing process, various factors can influence the actual stiffness of a mount, deviating from its theoretical design value. Neglecting the concept of uncertainty in optimization design can impede the attainment of the desired vibration isolation performance. Consequently, the research literature has witnessed an upsurge in studies focused on the optimization of mounting systems under conditions of uncertainty.
One prevalent approach in mount optimization under conditions of uncertainty is robust design, which relies on a probabilistic model that considers the variation in mounting system stiffness with parameters exhibiting specific distribution characteristics. Monte Carlo methods are frequently employed to evaluate the robustness of the system response [13,14]. For example, Shi Peicheng et al. [15] developed a six-degree-of-freedom dynamics model for the powertrain mount system of vehicles, and they utilized the Monte Carlo method to analyze the system’s robustness. Their investigation focused on the effects of design value variations on the objective function. Similarly, Zheng Guangze et al. [16] established a dynamic analysis model for the powertrain mount system of engines. They employed Latin hypercube sampling to fit a RSM approximation model and applied a multi-island genetic algorithm for optimization, aiming to identify the optimal solution with constraints and analyze its robustness. Other approaches, such as 6σ theory and genetic algorithms, have also been employed for robustness optimization design, as demonstrated by Wu Jian et al. in their study on decoupling design, which is based on torque roll axis decoupling theory [17,18,19]. Fu-Long Xin et al. [20] proposed a robust multi-objective optimization scheme for powertrain mount systems in electric vehicles, utilizing genetic algorithms for global optimization and Latin hypercube sampling to achieve optimal robustness of dynamic reaction force.
Another category of optimization design under uncertainty involves non-probabilistic models, such as interval models, fuzzy models, and evidence–theoretic models. These models are particularly valuable when the available stiffness sample data of a mounting system is insufficient or unreliable. For instance, C. Li et al. [21] proposed a robust design method that employed interval analysis and Particle Swarm Optimization (PSO) to optimize a Powertrain Mounting System (PMS). This approach effectively enhanced the decoupling ratio while satisfying the imposed constraints. Bohao Cai treated the uncertain parameters of a powertrain mounting system as interval variables and developed the Chebyshev vertex method, which offers an efficient technique for rapidly computing the lower and upper bounds of natural frequencies and decoupling ratios [22]. Other works based on interval analysis methods, such as those presented in [23,24], have calculated the variation in inherent frequency and decoupling rate of powertrain mounting systems when mount stiffness fluctuates within an interval range. These studies have demonstrated more robust results compared to certainty optimization calculations. Lü Hui et al. [25] combined evidence theory and the regression method to propose a robust design approach for optimizing the reliability of powertrain mounting systems. Their method accounts for inaccurate parameter information and integrates robustness and reliability objectives.
In some cases, certain parts of the system possess sufficient parameter information, while others have limited data availability. This scenario necessitates the use of hybrid models that incorporate both probabilistic and non-probabilistic elements. Lü Hui et al. [26] addressed the inherent characteristic response of a powertrain mounting system by employing an interval stochastic hybrid model. This model was utilized to establish optimization objectives and reliability constraints for robust system optimization design.
However, irrespective of whether, based on probabilistic, non-probabilistic, or hybrid models, the optimization methods employed under these uncertainties all share a common objective. The general approach involves assessing the variation in the objective function when the range of suspension stiffness fluctuation is known, allowing for a comprehensive evaluation of the objective function’s robustness to stiffness changes. This solution approach exemplifies the progression from the underlying parameters towards the objective function.
In the context of engine mount design, it is crucial to account for the influence of diverse uncertain factors on stiffness during manufacturing and usage. Therefore, it becomes essential to establish a quantitative mapping relationship between the underlying design variables and the objective function, ensuring a comprehensive consideration of these factors. By adopting a reverse thinking perspective, the challenge lies in determining the appropriate range of stiffness values in each direction of the mounting system, satisfying the design requirements for force transfer rate and main mode decoupling rate with a certain level of probability. Furthermore, while meeting the target performance, it is desirable to have a broader range of suspension stiffness values.
To address these challenges, we propose a novel approach, called the generalized inverse cascade method. This method offers a specific application process that involves pre-setting the objective function requirements and establishing a quantitative mapping relationship between the underlying design variables and the upper objective function. Efficient and intelligent search techniques are then employed to determine the optimal value interval for each underlying parameter. Importantly, any combination of parameters within this interval guarantees that the objective function meets the desired confidence requirements. The solving process of this method essentially entails a reverse inference from the objective function to the underlying parameters.
The key advantage of the generalized inverse cascade method is its ability to provide designers with an optimal parameter interval for the underlying design variables, while also offering insights into the probability of the objective function, meeting the design requirements within this interval. This method proves to be highly suitable for both single-objective and multi-objective optimization problems encountered in multi-level systems. In this paper, we delve into a detailed exploration of how the generalized inverse cascade method can be effectively applied to solve the optimal value interval of powertrain mounts under uncertain conditions. By studying this specific case, we aim to provide a comprehensive understanding of the method’s practical implementation and its potential for enhancing the optimization of powertrain mount design.

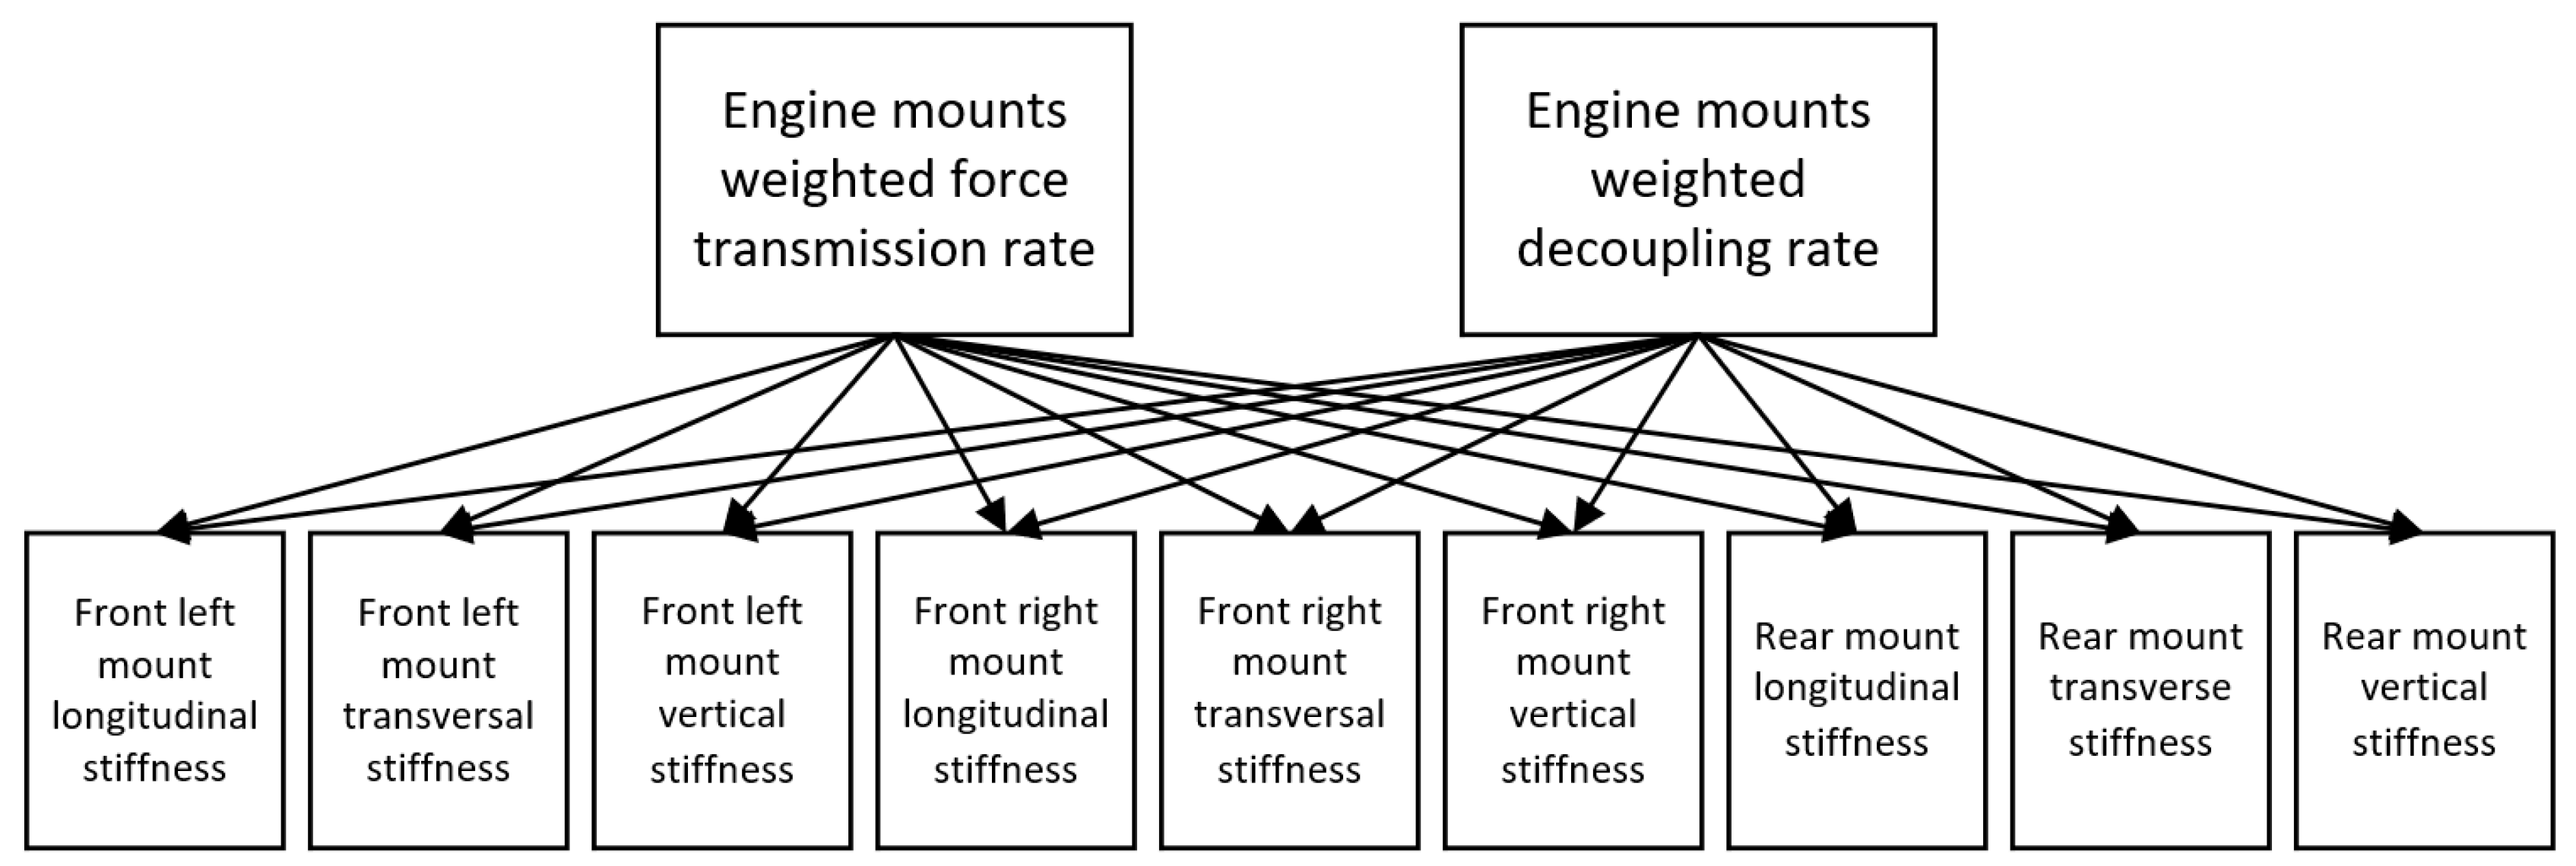
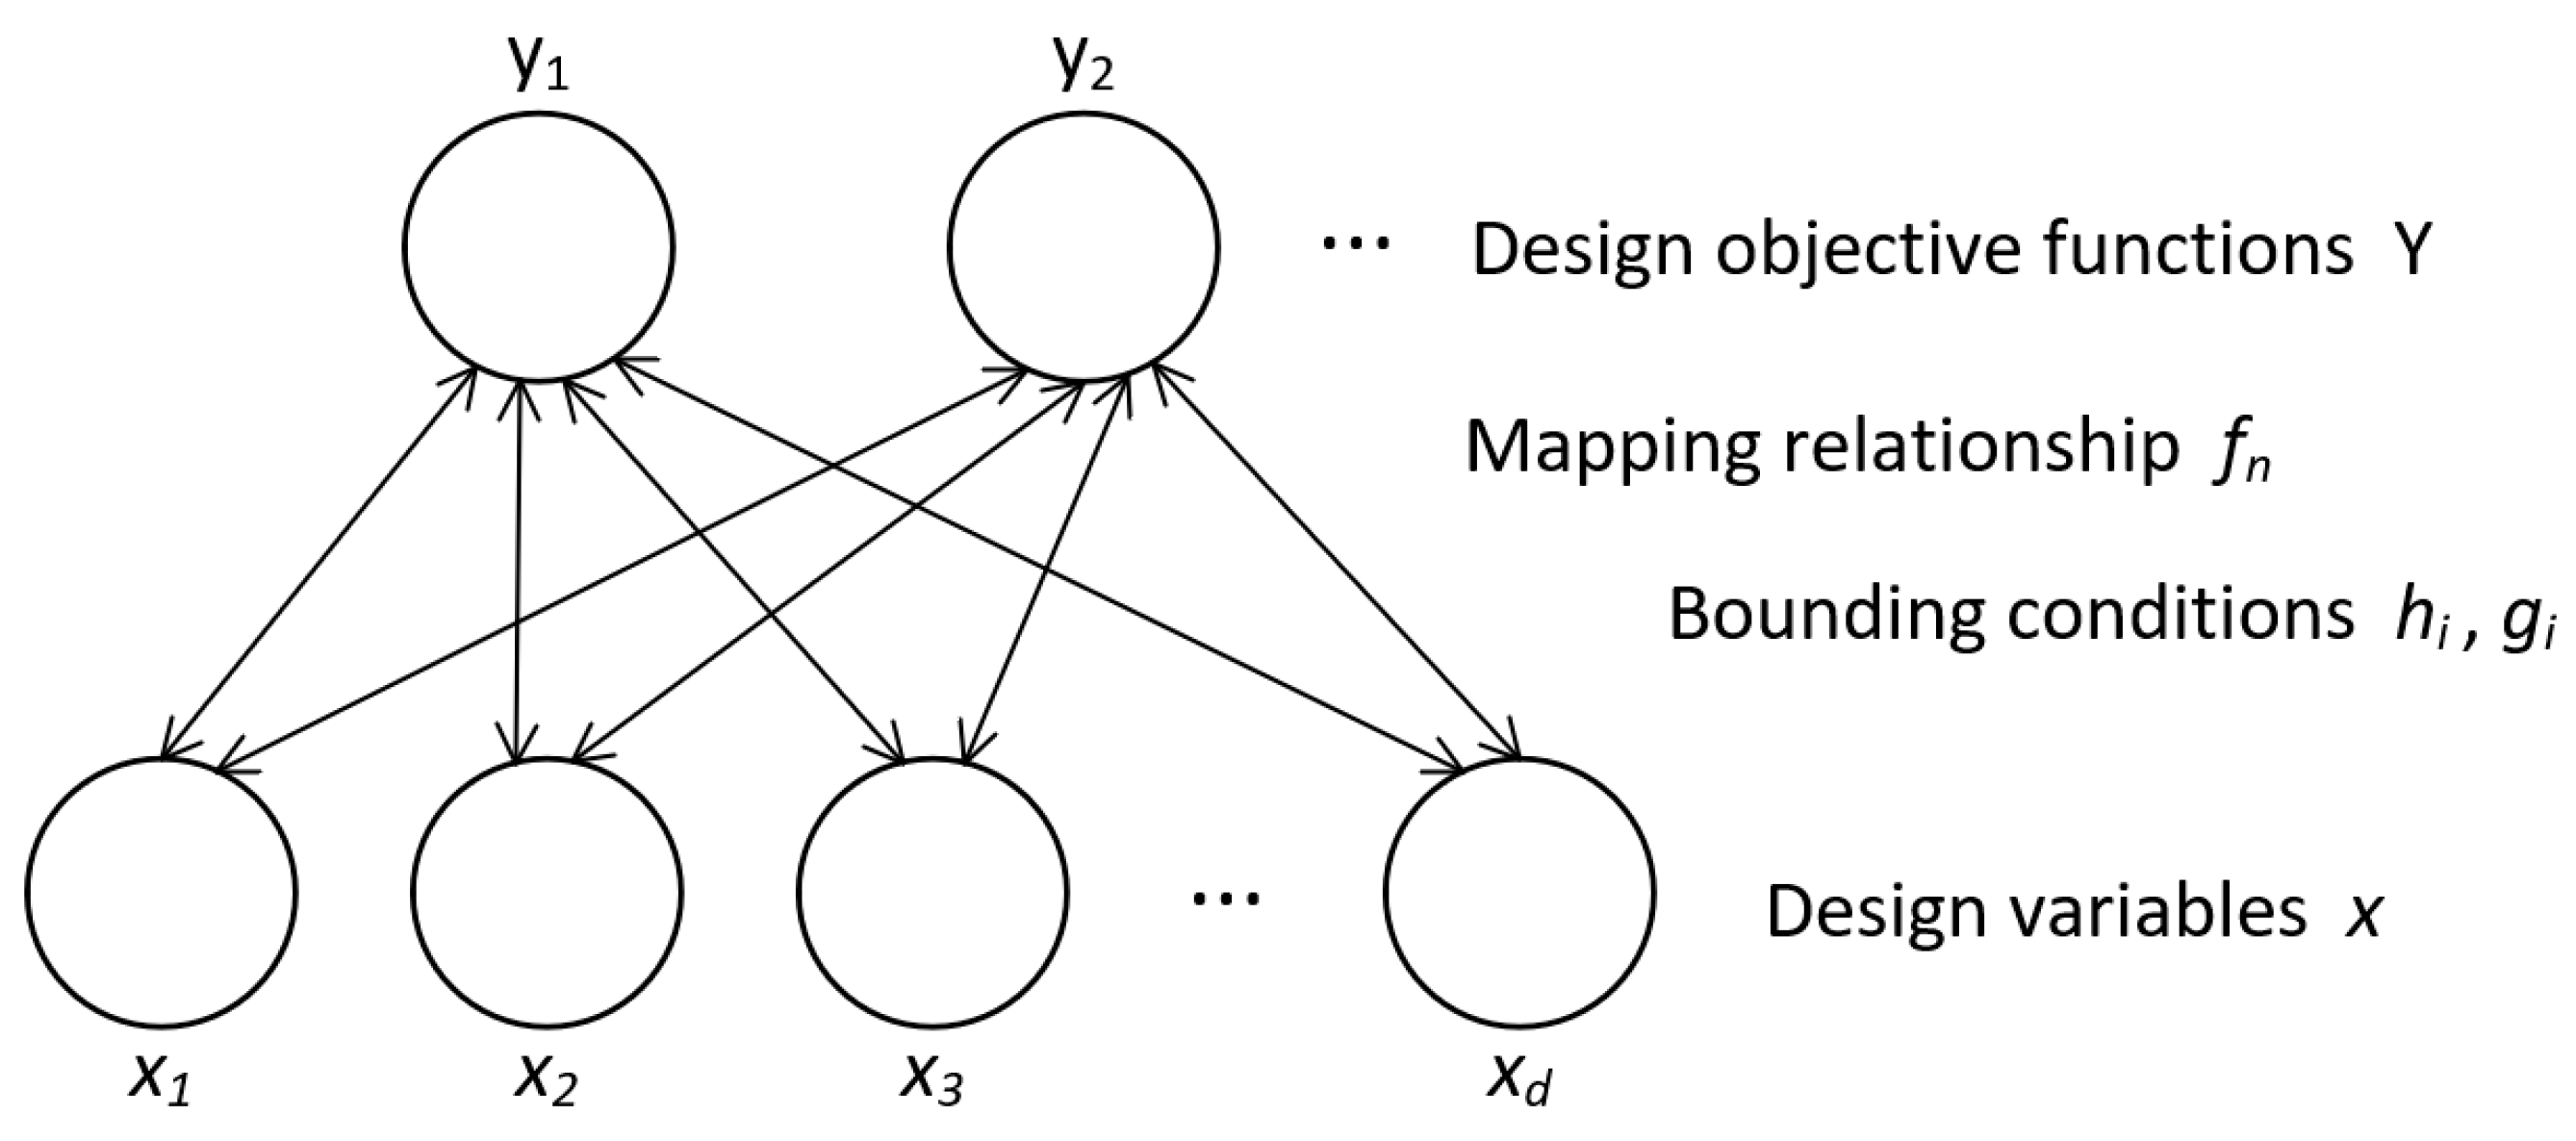
2. Multi-Objective Two-Level Model Construction

The performance of the mount is influenced by various factors, including geometric parameters, stiffness, damping, and others. However, in the context of robust design for mounting systems, the optimization focus is typically placed on the main stiffness values in each direction of the mount, as they are more readily adjustable. In the case of powertrain mounts, both three-point and four-point configurations are commonly employed. In this study, we specifically consider the three-point mounting system as an example, and its optimization design is formulated as a two-objective, two-level problem, as depicted in Figure 1.
The optimization design of the powertrain mounting system can be abstracted as a multi-objective, two-level optimization problem, and the model decomposition diagram and the formula are shown in Figure 2 and Equation (1).
{ meet opt   f n ( x ) ( L b n , U b n ) s . t .       h i ( x ) = 0 , i = 1 , 2 , , I                 g j ( x ) 0 , j = 1 , 2 , , J                 n = 0 , i = 1 , 2 , , N
where; the design variable x = [x1, x2, x3, …, xd]T is a vector in the d-dimensional Euclidean space Rd; fn(x) is the objective function, where N is the number of objective functions; hi(x) = 0, gi(x) ≤ 0 is the boundary condition; and Lbn, UBn are the boundary conditions to be satisfied by the objective function.

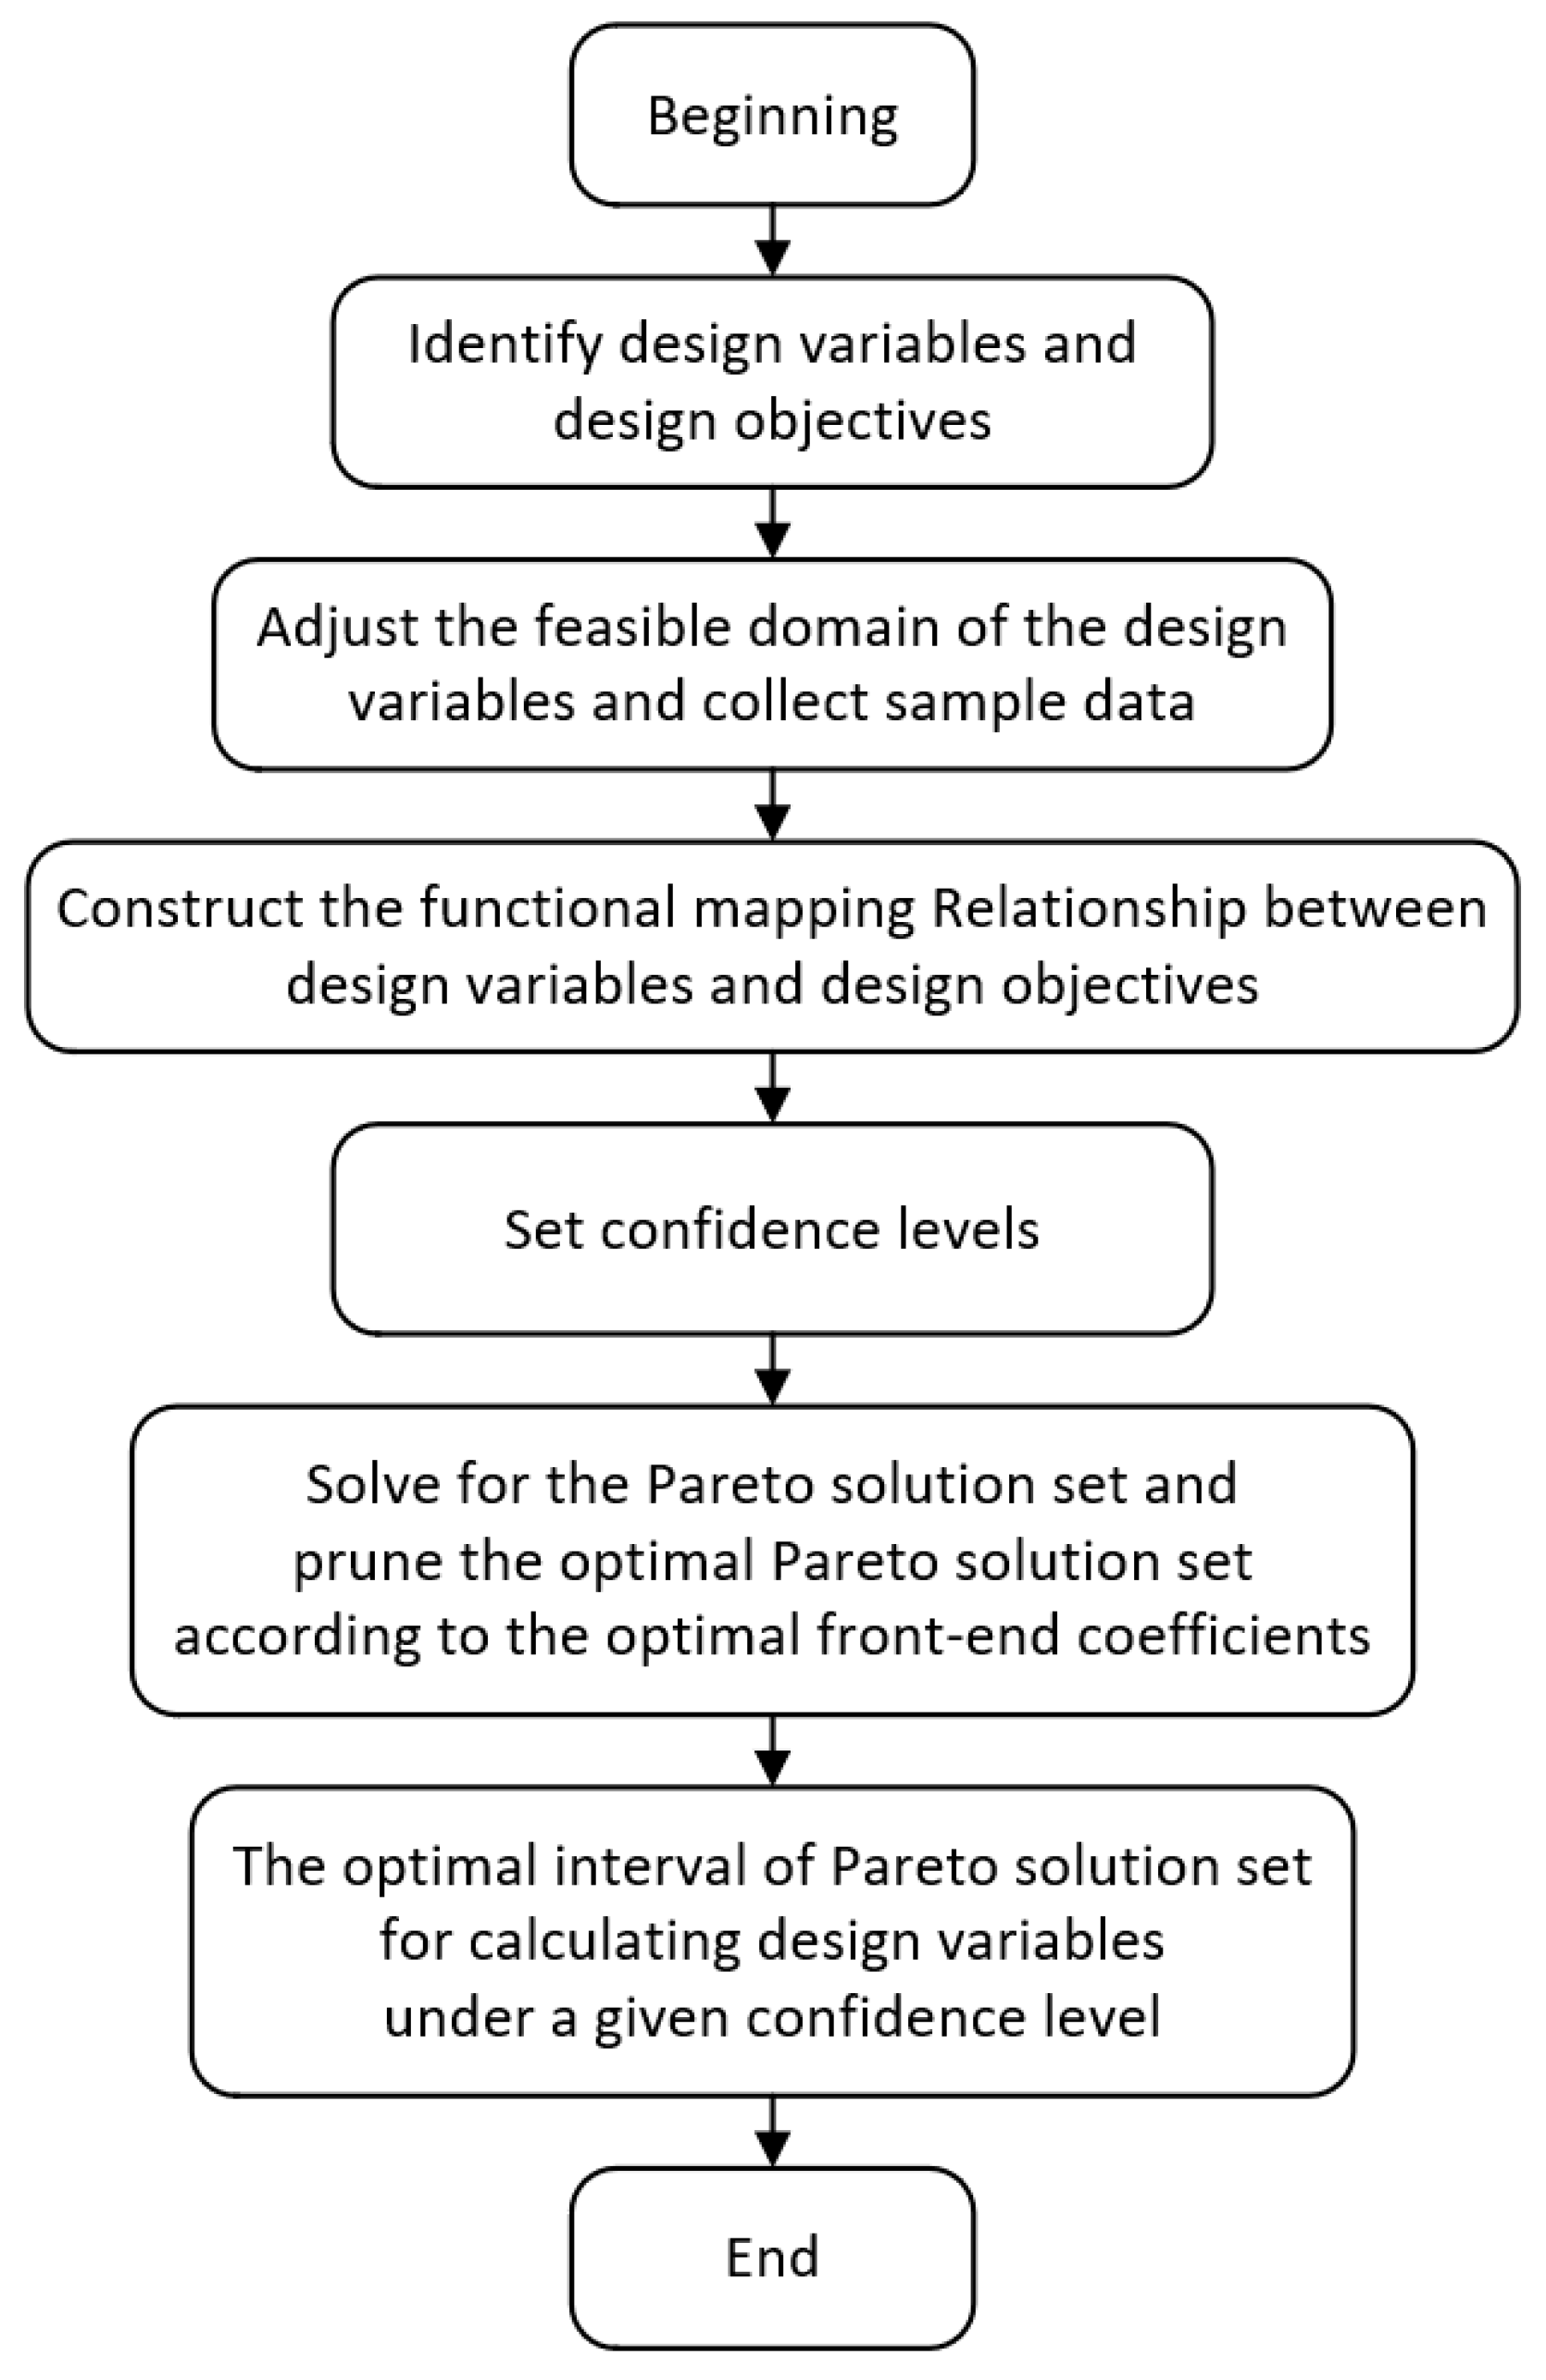
3. Introduction to the Generalized Inverse Cascade Method

The construction of a multi-level objective system depends on the values of the parameters at each level, and errors accumulate in the process of extrapolating the bottom parameters upwards, which makes it difficult to quantify the “quantitative causality” between the values of the bottom parameters and the performance of the total objective at the top level. To this end, the generalized inverse cascade method is introduced, i.e., based on the mapping relationship between the underlying parameters and the objective function. An efficiently intelligent search technique is applied to obtain the optimal value interval for each underlying parameter. Any combination of the parameters in the sought interval can reach the total objective with the desired probability [27]. The multi-objective, two-level model optimization design process under uncertainty is shown in Figure 3.
The following steps outline the procedure:
Step 1: Identify the design variables and design objectives.
Step 2: Adjust the feasible domain of the design variables and collect multiple sets of sample data through simulations or tests using experimental design techniques.
Step 3: Utilize the sample data to construct a functional mapping relationship, namely, an approximate model, which is between the design variables and the design objectives. This step establishes a foundation for subsequent optimization design efforts.
Step 4: Specify the desired confidence level, which determines the range of values for the design variables and the probability of meeting the objective function requirements.
Step 5: Employ methods, such as NSGA-II, M0O-PSO, PE, and others, to solve and refine the solution set for the multi-objective optimization problem.
Step 6: Apply the interval search strategy to calculate the optimal interval for the design variables at the specified confidence level.
The interval search strategy depicted in Figure 4 is a key component of our methodology. It aims to expand and contract the range of exploration, which is based on the optimal solution obtained through the intelligent algorithm. This initial phase involves a broader exploration to encompass a wider range of potential values. Subsequently, as the approximate range is narrowed down, a refinement process takes place until the predefined confidence level threshold is met [28]. This figure is followed by the pseudocode for each step (the Algorithm 1—generalized inverse cascade method).
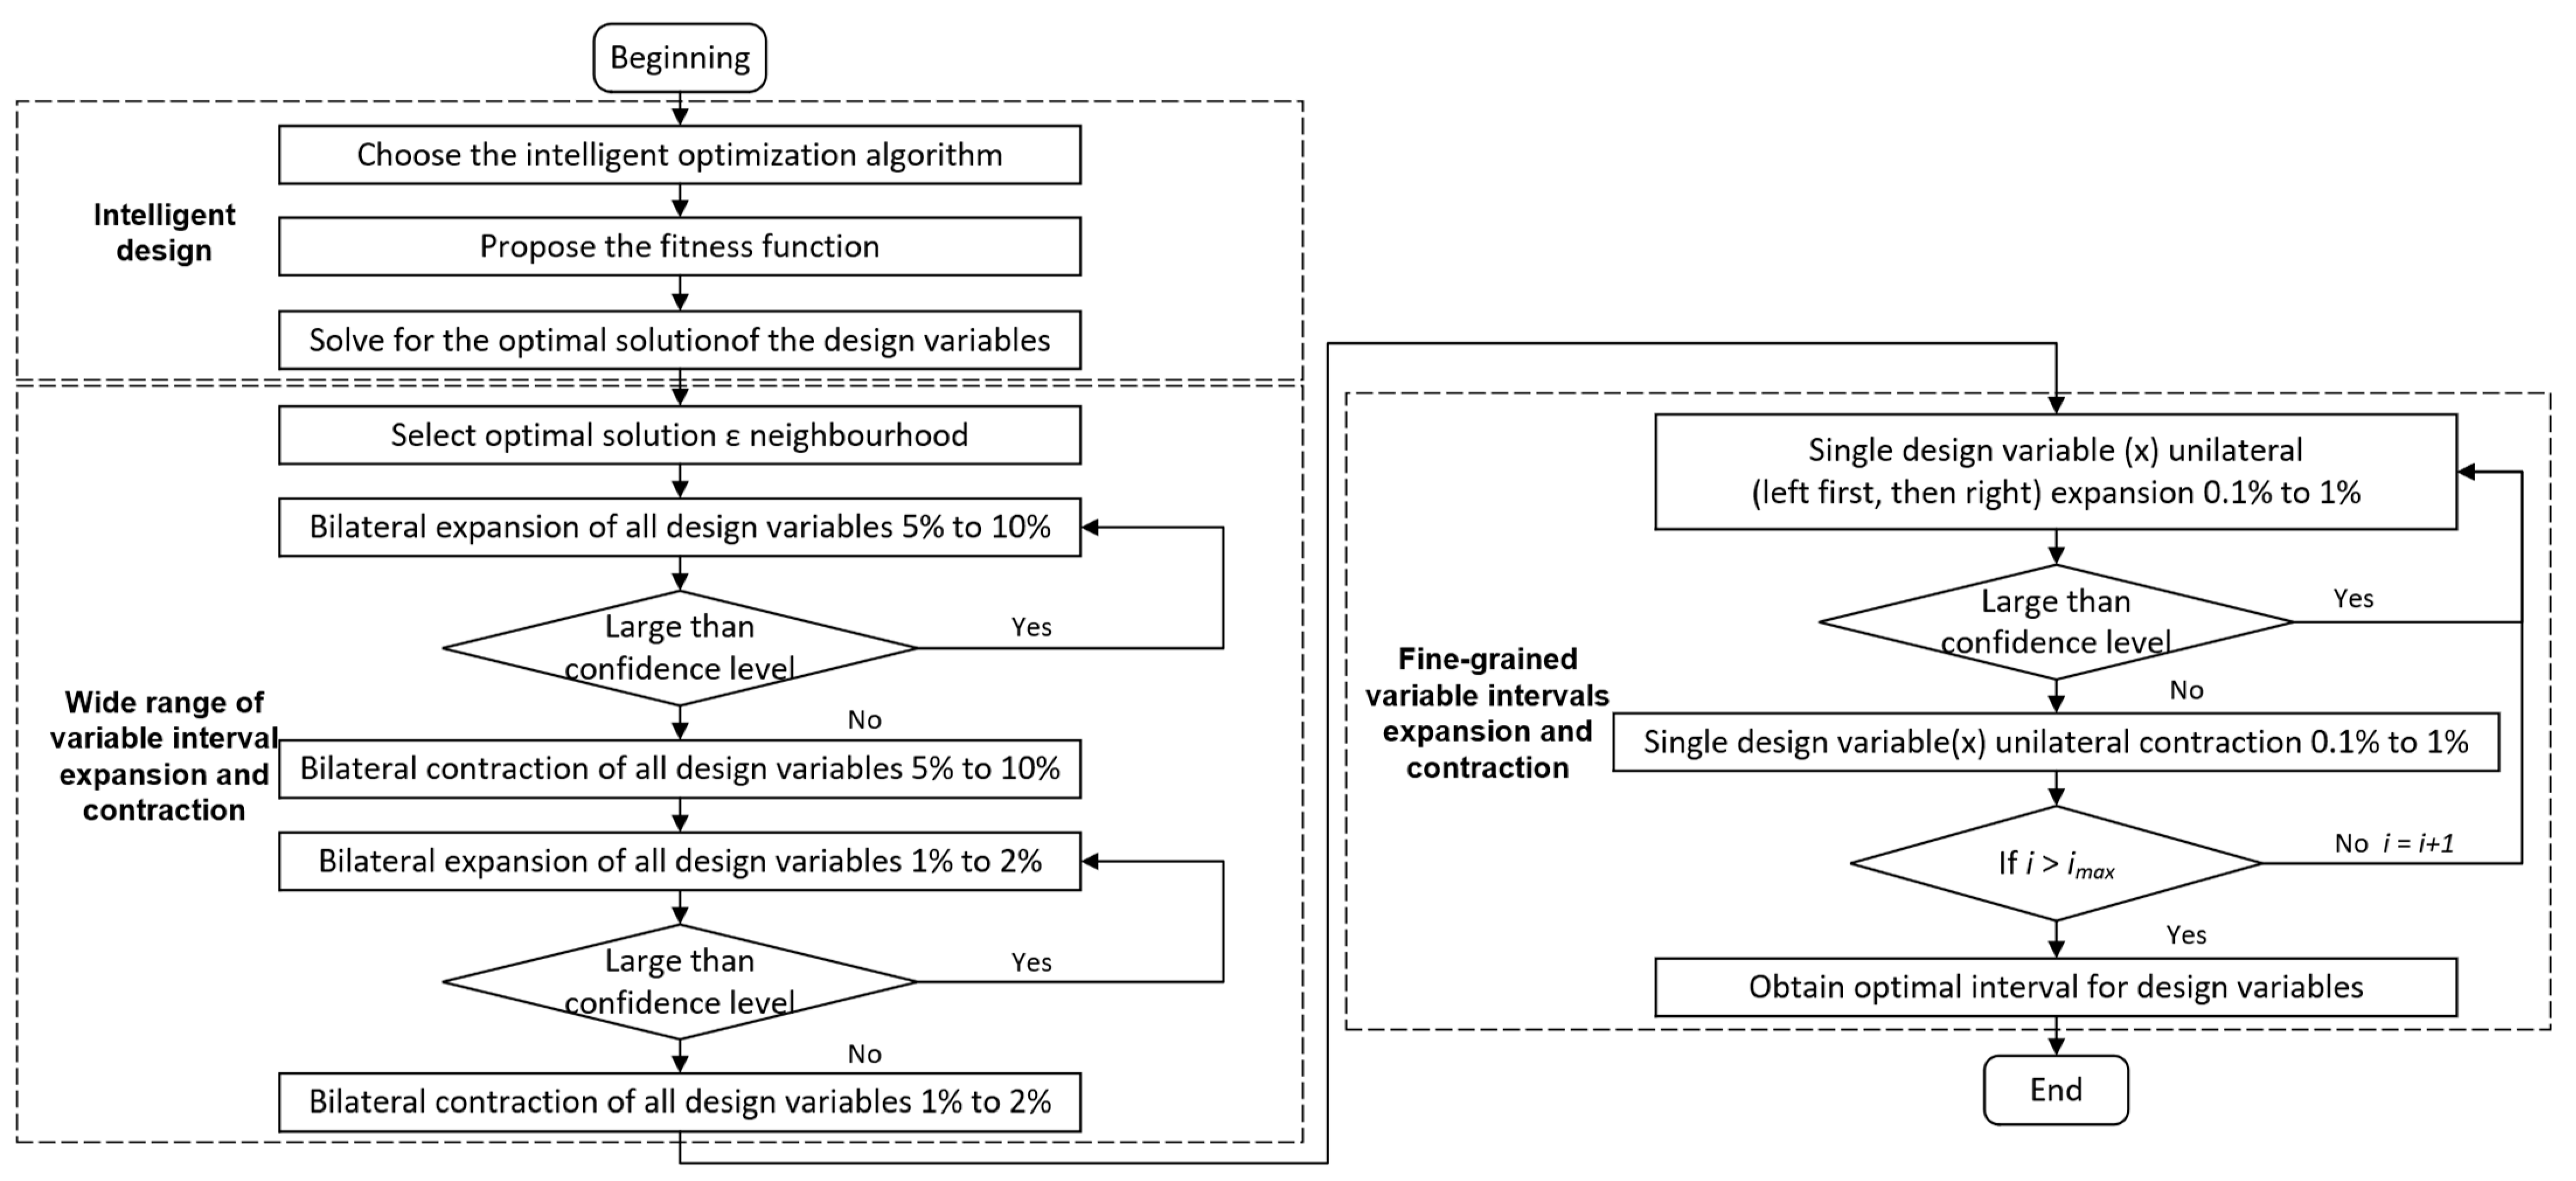
Algorithm 1: generalized inverse cascade method
Input: initial interval of design variables xi,1: =(ai,1, bi,1), mapping relationship fn between design variables x and design objectives Y, confidence threshold H0
Ouput: optimal interval of design variables (ai,3, bi,3)
1. Adjust the design variable feasible domain xi,2: =(ai,2, bi,2).
2. Calculate the optimal solution xi,opt for the design variables according to the intelligent optimization algorithm.
3. (ai,3, bi,3): =(xi,opt − ε, xi,opt + ε)//choose the optimal solution neighbourhood (ai,3, bi,3): =(xi,opt − ε, xi,opt + ε)
4. While Hc > H0, do
5.       ai,3: =ai,3 × (90% to 95%)//Reduce the left-hand side of all design variables by 5% to 10%.
6.      bi,3: =bi,3 × (105% to 110%)//Increase the right-hand side of all design variables by 5% to 10%.
7.      Calculate Hc from fn.
8.   end while
9.   ai,3: =ai,3 × (105% to 110%)//Increase the left-hand side of all design variables by 5% to 10%.
10. bi,3: =bi,3 × (90% to 95%)//Reduce the right-hand side of all design variables by 5% to 10%.
11. While Hc > H0, do
12.      ai,3: =ai,3 × (98% to 99%)//Reduce the left-hand side of all design variables by 1% to 2%.
13.      bi,3: =bi,3 × (101% to 102%)//Increase the right-hand side of all design variables by 1% to 2%.
14.      Calculate Hc from fn
15. end while
16. ai,3: =ai,3 × (101% to 102%)//Increase the left-hand side of all design variables by 1% to 2%.
17. bi,3: =bi,3 × (98% to 99%)//Reduce the right-hand side of all design variables by 1% to 2%.
18. for i: =1 to imax do//from the 1st design variable to the imax design variable
19. While Hc > H0, do
20.      ai,3: =ai,3 × (99% to 99.9%)//0.1% to 1% reduction in the left-hand side of the ith design variable
21. Calculate Hc from fn
22.   end while
23.   ai,3: =ai,3 × (100.1% to 101%)//0.1% to 1% increase in the left-hand side of the ith design variable
24.   While Hc >H0, do
25.      bi,3: =bi,3 × (100.1% to 101%)//0.1% to 1% increase in the right-hand side of the ith design variable
26.      Calculate Hc from fn
27.   end while
28.   bi,3: =bi,3 × (99% to 99.9%)//0.1% to 1% reduce in the right-hand side of the ith design variable
29. end for
30. Return (ai,3, bi,3)
31. End the generalized inverse cascade method.

4. Example

The model presented in this case is a front-engine, rear-wheel drive SUV equipped with the powertrain of a four-cylinder engine. The engine is mated to a three-point mounting system with a front left mount, a front right mount, and a rear mount, as shown in Figure 5. This paper focuses on optimizing the stiffness of mounts by simplifying each mount to three mutually perpendicular springs. The active end of the spring is connected to the powertrain, and the passive end is connected to the body.

4.1. Identify Design Objectives and Design Variables

According to the mounting system vibration isolation hierarchical decomposition system shown in Figure 1, the weighted force transmission rate that measures the vibration isolation performance of the mount, and the weighted decoupling rate that characterizes the degree of energy decoupling in each direction, are used as design objectives, and the stiffness values of mounts in the X-, Y-, and Z-directions are used as design variables. The force transmission rate of mount is defined as the ratio of the support reaction force at each mount to the acceleration at the center of mass of the powertrain. This is calculated by Equation (2):
T i , j = F i , j R M S f ( a j )
where; Ti,j is the transmission rate of the ith (i = 1,2,3) mount in direction j (vehicle coordinate system X, Y, Z), and the unit is N·s2/m; Fj is the support reaction force in direction j (X-, Y-, and Z-directions) at the ith mount, and the unit is N; aj is the vibration acceleration in direction j at the center of mass of the powertrain system, and the unit is m/s2; and RMSf represents the effective value of the vibration acceleration in the frequency range f, and the unit is m/s2.
The mount-weighted force transmission rate is a combination of the force transmission rates in each of the three directions, according to a certain weight. Considering the higher vibration in the Z-direction, the weight is higher. Based on engineering experience, the weight coefficients of the three mounts in the vehicle coordinate system’s X-, Y-, and Z-directions are 0.065, 0.065, and 0.2, respectively. Therefore, the mount weighted force transmission rate and the decoupling rate can be calculated by Equations (3) and (4):
T = i = 1 3 0.065 T i , X + 0.065 T i , Y + 0.2 T i , Z
D R = i = 1 6 k i D R i
where; DR represents the weighted decoupling rate; DRi represents the primary decoupling rate of the ith order rigid body mode; and ki is the corresponding weight coefficient. Since the unbalanced force in the Z-direction of the vehicle coordinate system is the largest source of excitation for the engine, the torque fluctuation around the X axis is also relatively large when the engine is placed longitudinally. In order to consider that the decoupling rates of the two main directions can be increased more, the weight coefficients of these two directions can be set higher, the weight coefficient of the Z-direction is set to 0.35, the weight coefficient around the X axis is set to 0.25, and the weight coefficients of the other four are each taken as 0.1.
For different vehicles, the fluctuations in the stiffness of each mount have their variation pattern. Although the initial interval of the mount stiffness is different for each vehicle, the idea of applying the algorithm is the same. The stiffness of the three powertrain mounts in three directions is chosen as the design variable. Combined with engineering experience, the initial value interval is obtained by increasing and decreasing the original stiffness value by 30%. The ranges for each variable are shown in Table 1.

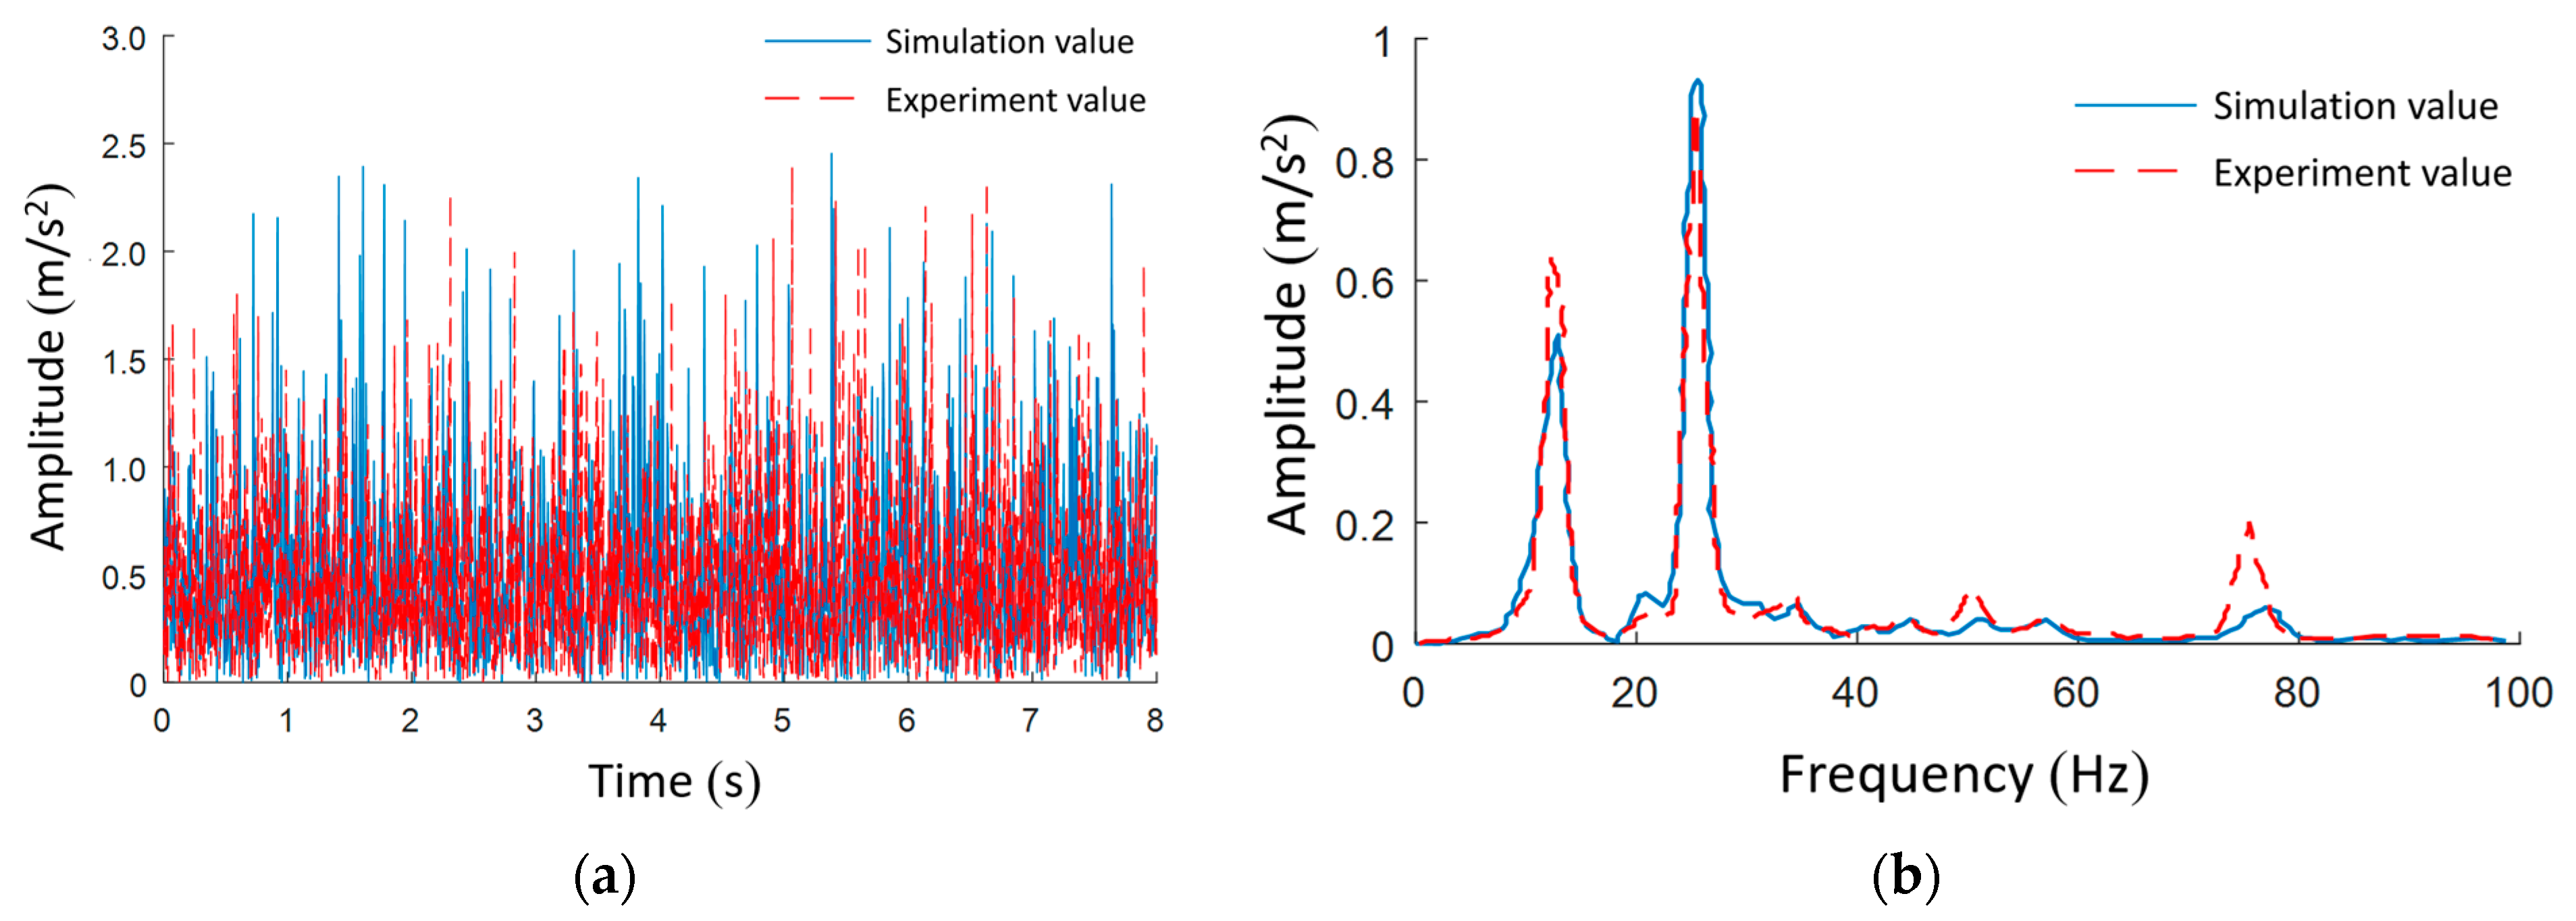
4.2. A Platform for Acquiring Basic Sample Data

According to the structure and working principle of the mounting system, the ADAMS simulation model of the mounting system was established. The cylinder pressure of the idle condition, provided by the engine manufacturer, is used as the driving force for the engine crankshaft. It is applied to each of the four pistons with a phase difference of 180° to simulate the idle condition. The simulation step is set to 0.005 s, and the simulation time is 8 s. The time and frequency domain vibration acceleration signals of powertrain in the Z-direction of the vehicle coordinate system are simulated at idle conditions. In order to verify the accuracy of simulation model, the vibration data of engine is obtained at idle conditions under the actual vehicle condition. The comparison of the time and frequency domains in Figure 6 shows that the simulation of the engine vibration acceleration in the Z-direction at idle condition is in good agreement with the test results, and the sample data can be obtained based on this simulation model.
In order to make the sample data selection more scientific and representative, 60 sets of sample data were extracted by applying the Latin hypercube test design in the initial range of nine mount stiffness values, as shown in Table 2.

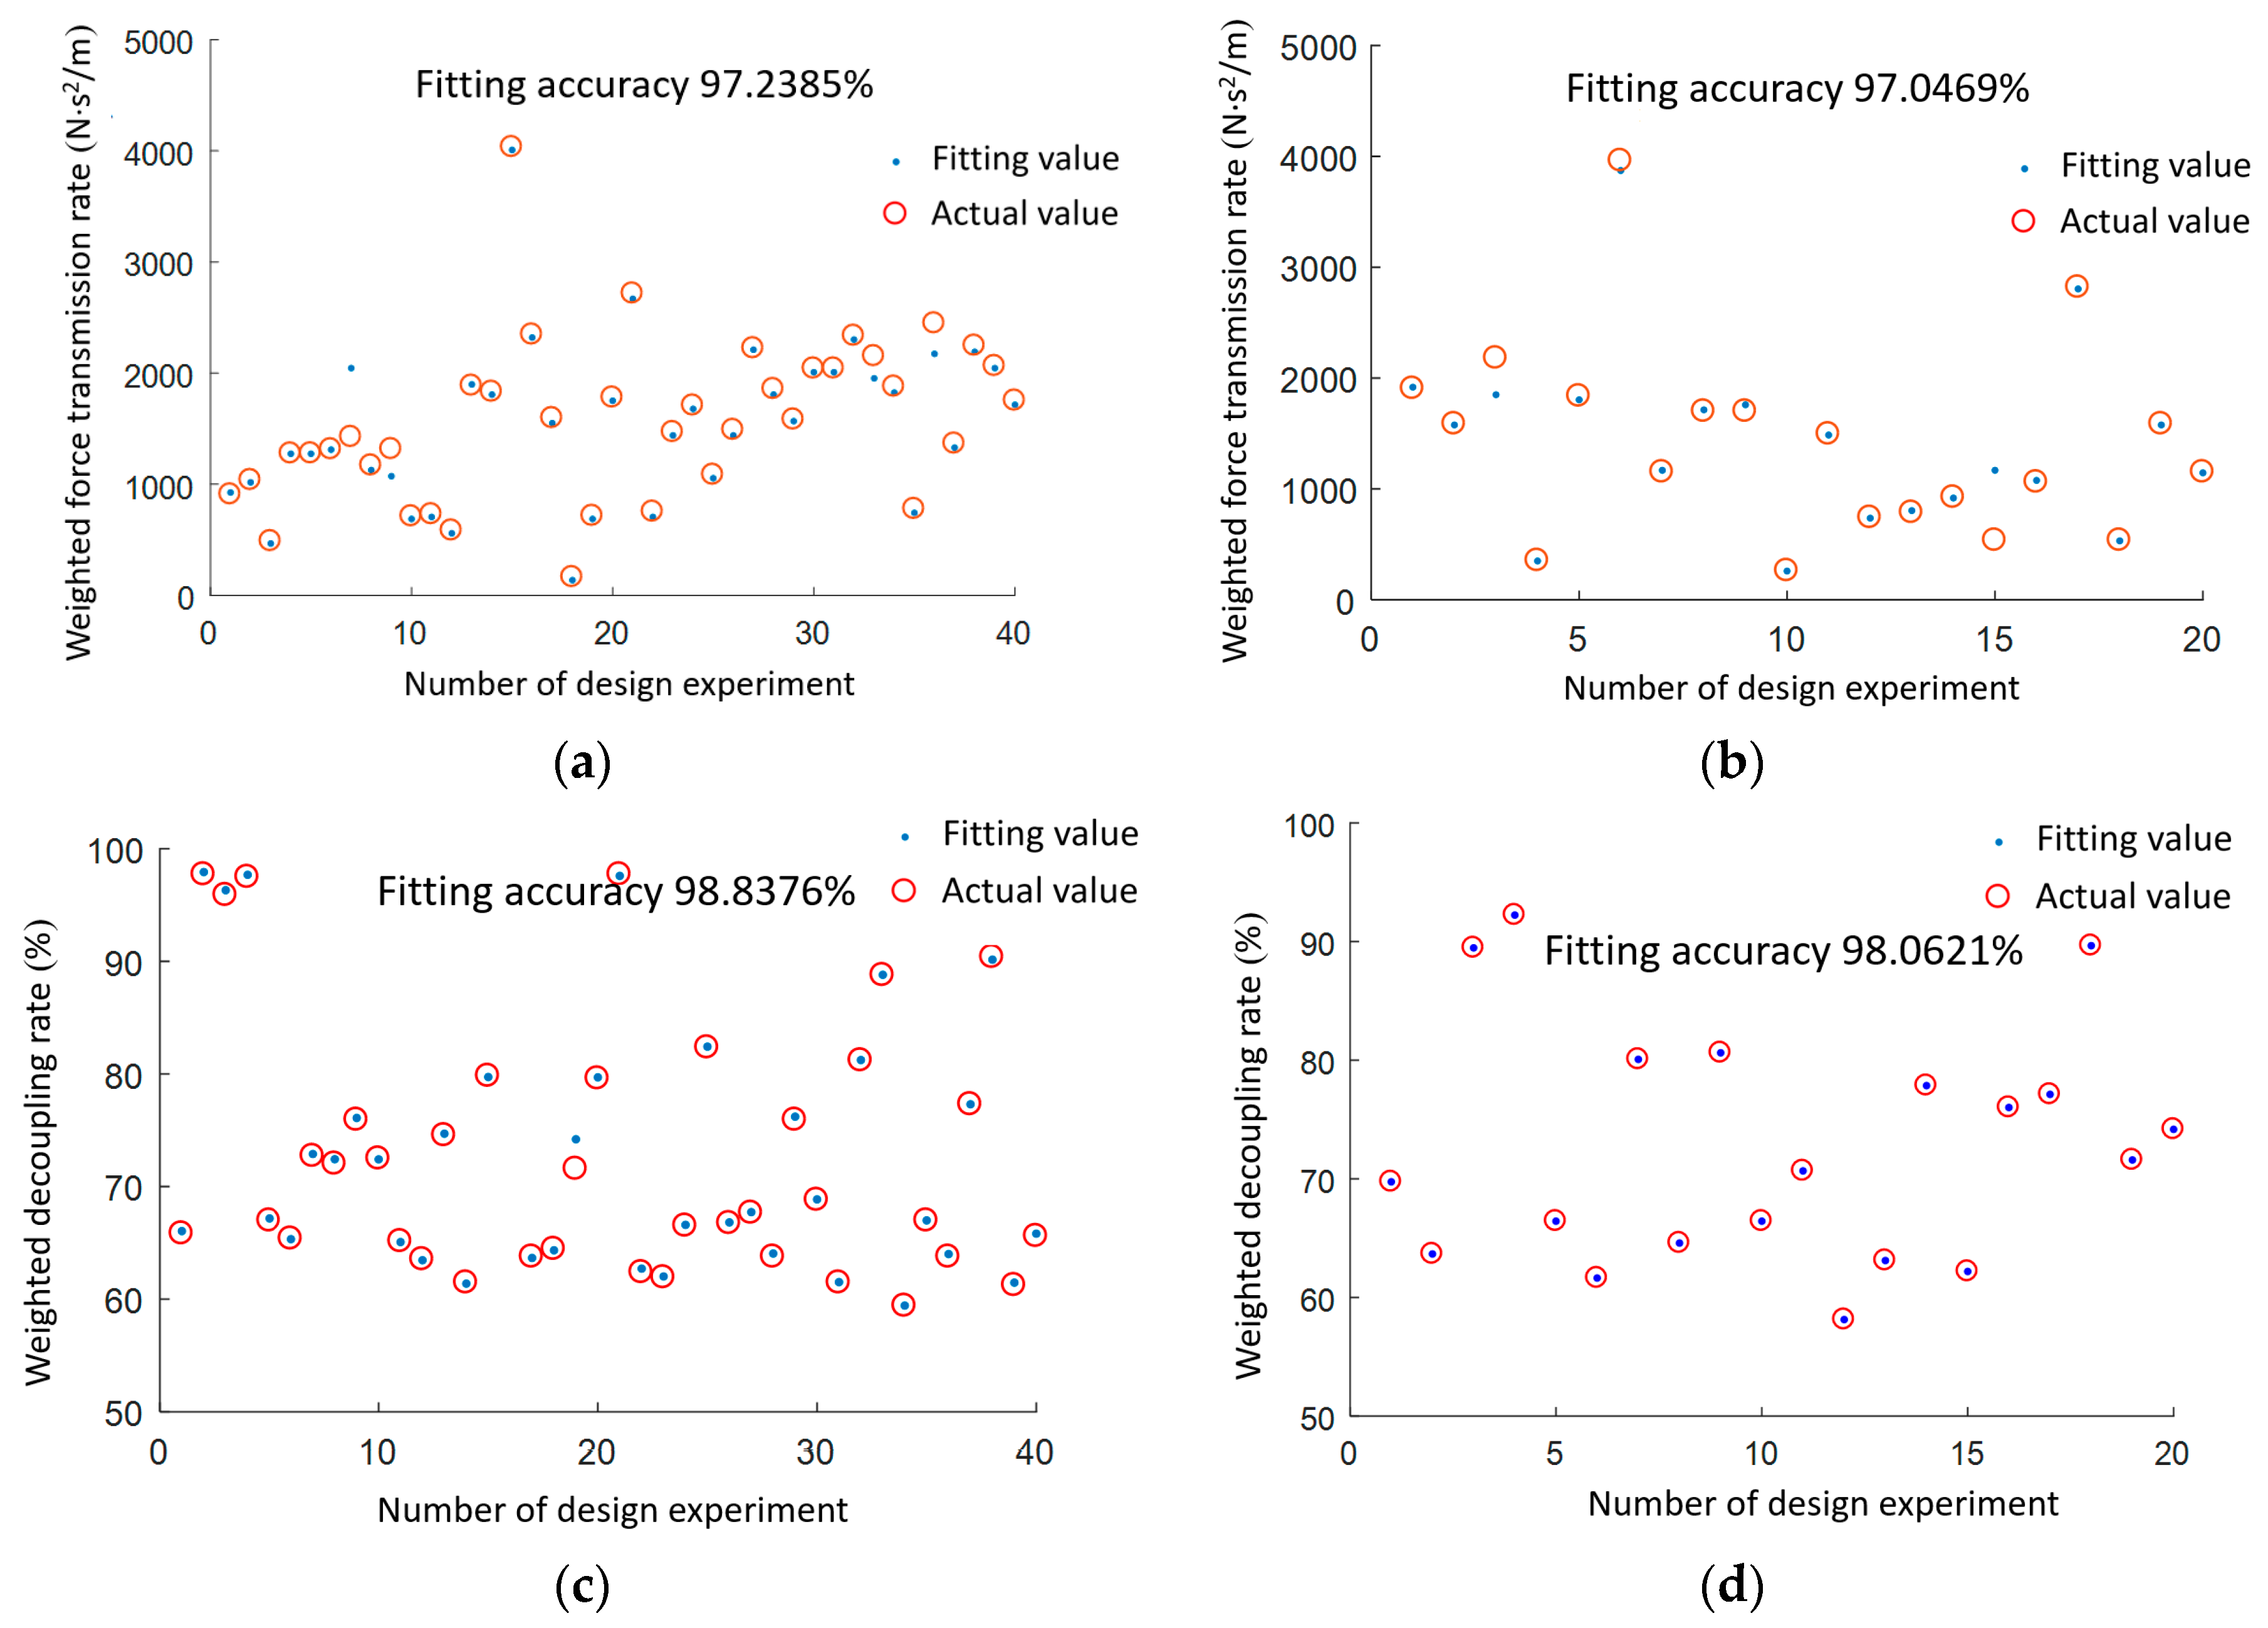
4.3. The Mapping Function for Design Variables and Design Objectives

In order to calculate the optimal intervals of the underlying design variables, it is necessary to construct corresponding approximate models to replace the ADAMS simulation model for the search calculation. In this paper, a CRBM-DBN approximation model, combining Conditional Restricted Boltzmann Machines (CRBM), which have strong non-linear capability, as well as the Deep Belief Network (DBN), are selected to implement the calculation of the weighted force transmission rate and the weighted decoupling rate [28]. Forty data sets from Table 2 were selected for training, and the remaining 20 were selected for testing. A comparison of the fitted values of the approximation model with the actual values (ADAMS simulation values) in Figure 7 shows that the CRBM-DBN approximation model is fitted with high accuracy and can be used as the basis for the next step of the optimization search solution for this mapping model.

4.4. Optimal Intervals for Design Variables Based on Generalized Inverse Calculation Solving

Based on the performance orientation of this case vehicle, the weighted force transmission rate should be less than 1400 N·s2/m, and the weighted decoupling rate should be greater than 80% (the design requirements for these two objectives can vary for different vehicle performance preferences). In order to ensure that any combination of the design variables in the value interval can make the objective function meet the design requirements, a confidence level of 100% and a Pareto coefficient of 0.02 are set. Table 3 and Table 4 show the Pareto optimal solution set #1 and the Pareto optimal solution set #2 for each design variable, which are solved by applying the generalized inverse cascade method, respectively.
Theoretically, any combination of stiffness interval values can make the objective functions meet the design requirements of vibration isolation rate and the decoupling rate. However, it is impossible to exhaust all combinations for verification. A representative combination of stiffness values (as shown in Table 5) is selected and substituted into the ADAMS simulation model to calculate the force transmission rates and the decoupling rates. The results are shown in Table 6 and Table 7.
As can be seen from Table 6, the force transmission rate in all directions and the weighted force transmission rates of the mounting system have been reduced after the optimized design. The weighted force transmission rates for different stiffness values meet the target requirement of 100% less than 1400 N·s2/m, which improves the vibration isolation performance of the powertrain mounting system.
As shown in Table 7, the decoupling degree of the main vibration modes for the first six orders of rigid body modes is enhanced compared to the original state. The weighted decoupling rates for all four combinations of stiffness values are above 80%, which meets the target requirement of a 100% confidence level and reduces the coupled vibration of the mounting system to a greater extent than the original weighted decoupling rate of 72.26%. The comparison from Table 6 and Table 7 shows that typical combinations of parameters within the mount stiffness intervals, which are based on the generalized inverse cascade method, resulting in a significant increase in the vibration isolation performance and modal decoupling of the mount. In fact, the combination of values of each design variable in either Pareto optimal solution set #1 or Pareto optimal solution set #2 allows the system to meet the requirements of vibration isolation and modal decoupling. Compared to a single fixed value, allowing values to be taken within the desired range is beneficial for reducing design and manufacturing difficulties, and this can more fully accommodate the impact of related uncertainty factors during design, manufacturing, and use, enhancing the robustness of the mounting system.

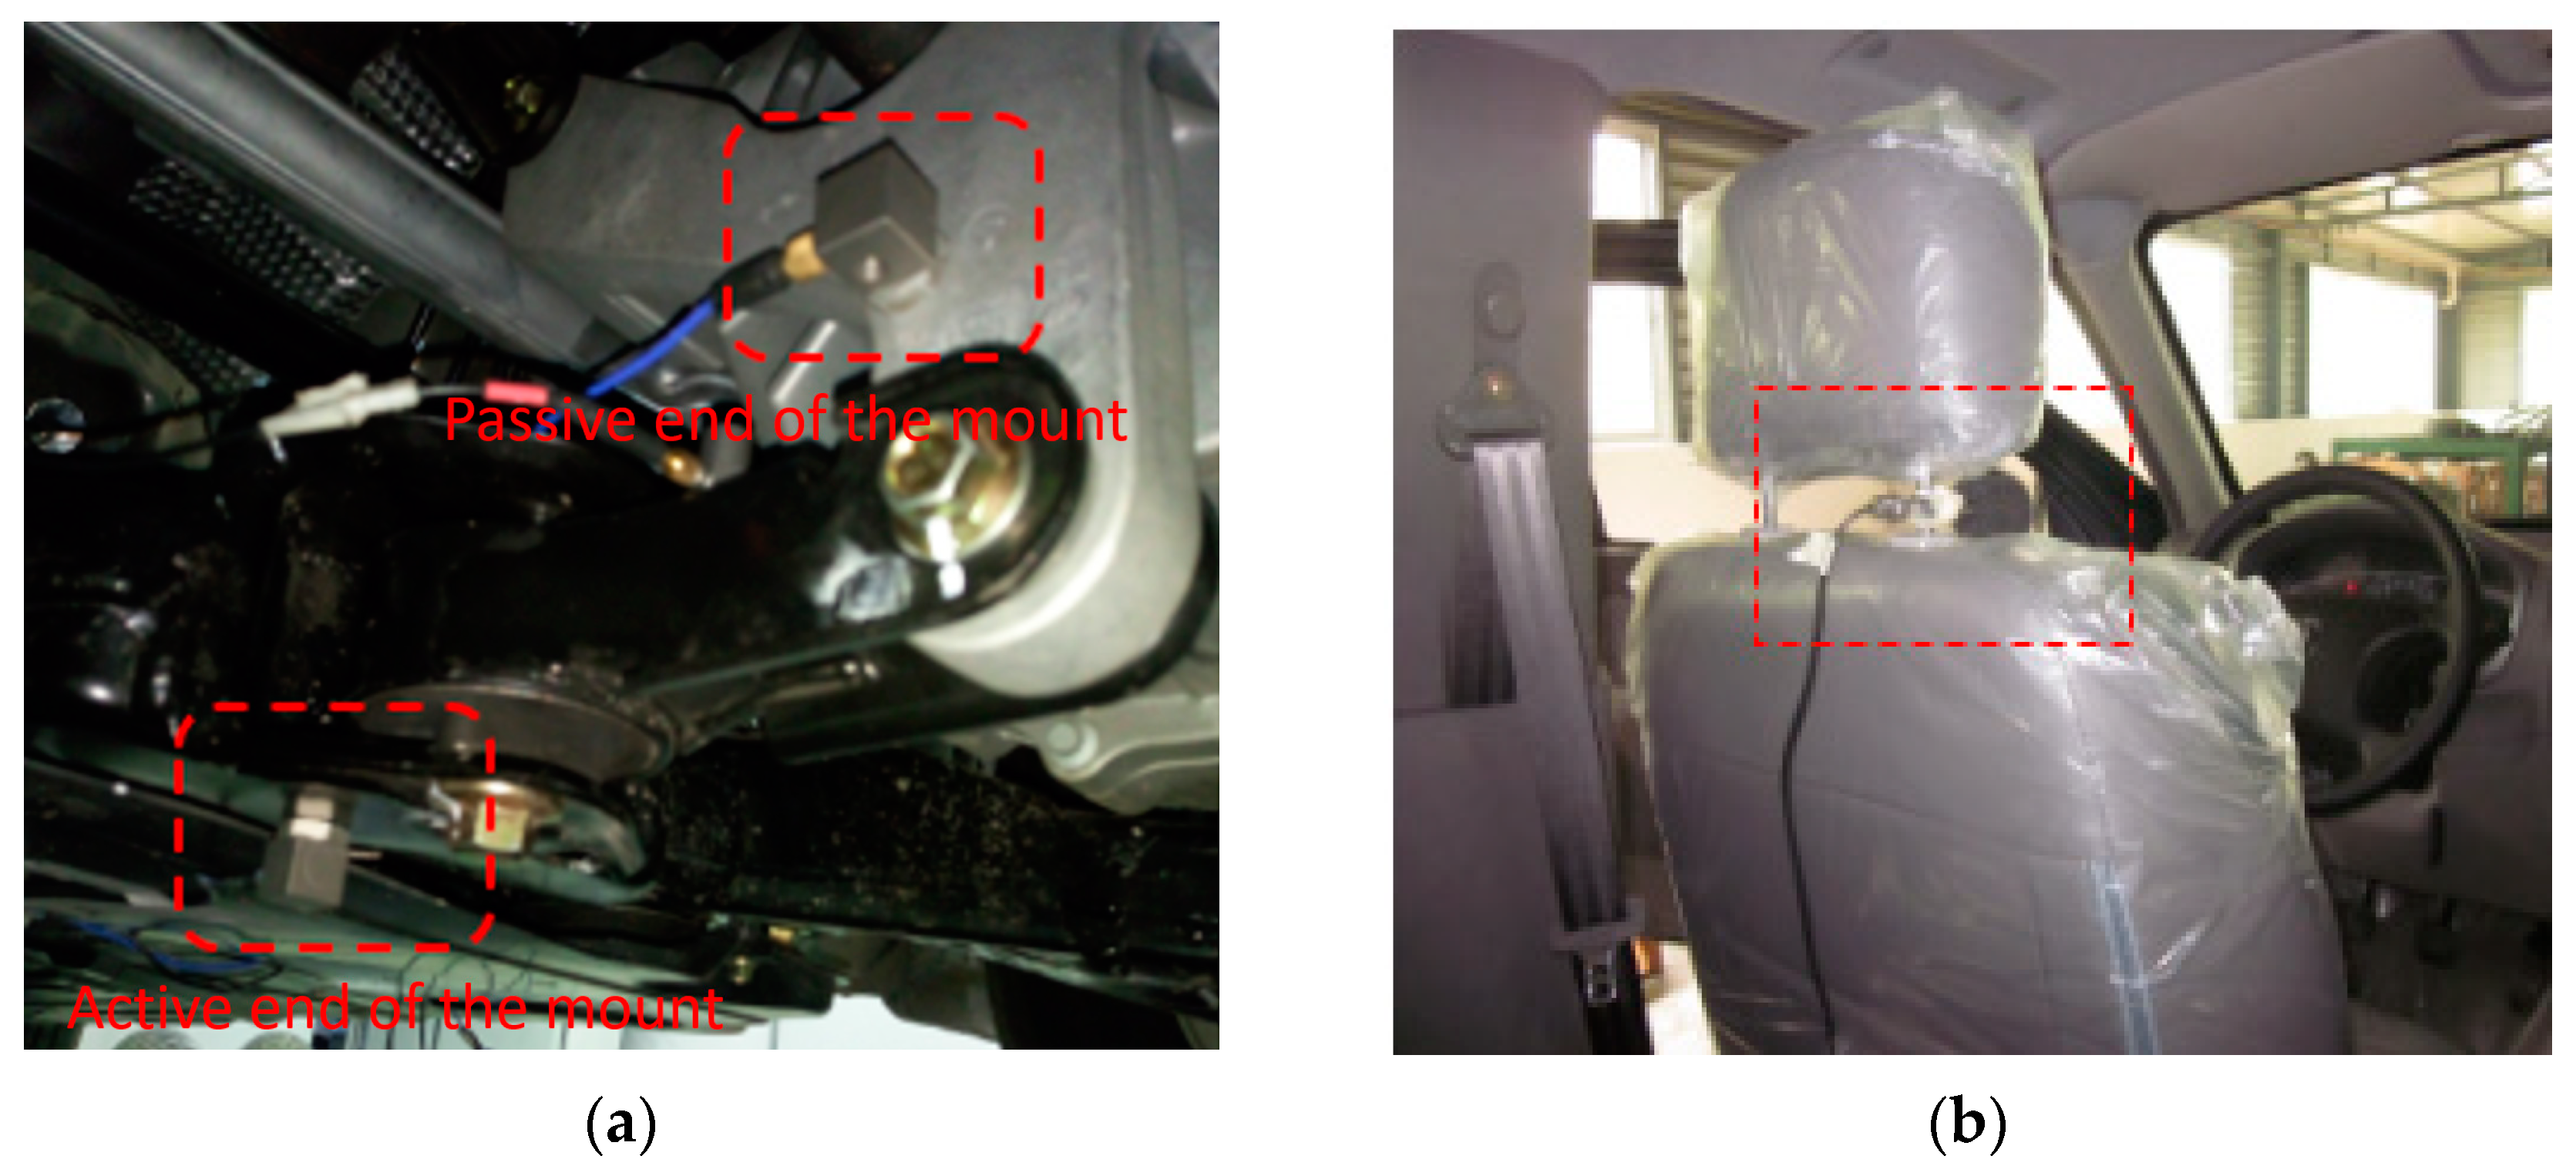
5. Experimental Verification
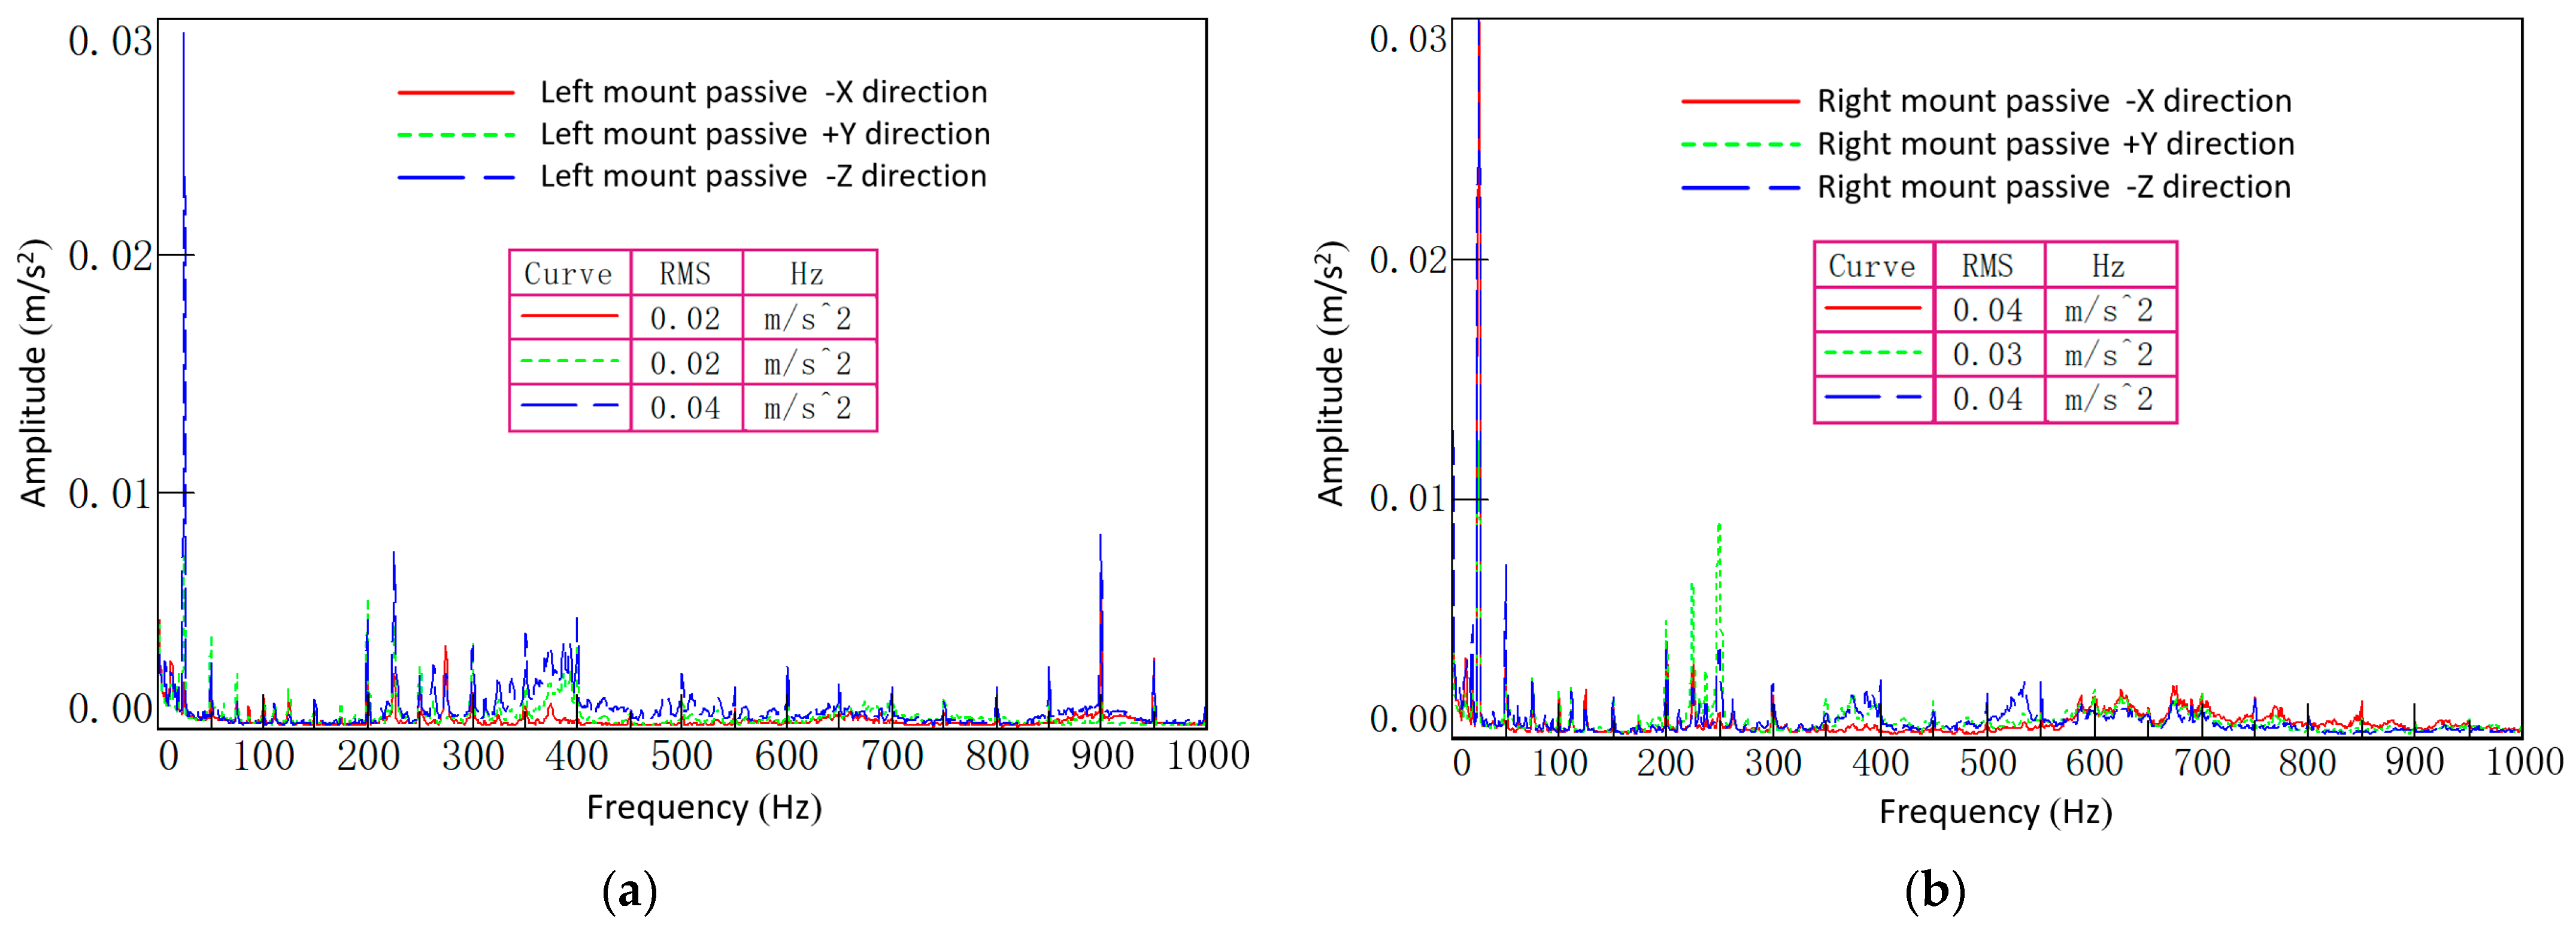
In order to further verify the effect of the improvement scheme through experiments, mount samples were manufactured according to the median value of Pareto optimal solution set #1 in Table 7. Although the previous optimization objectives were weighted force transmission rate and weighted decoupling rate, considering the inconvenience of measuring the force and decoupling rate in actual testing, the mount vibration isolation rate was used for evaluation [29,30]. The mount vibration isolation rate is calculated by Equation (5):
η = 20 lg | a a | | a p |
where; aa is the RMS value of the vibration acceleration at the active end of the mount (powertrain end); and ap is the RMS value of the vibration acceleration at the passive end of the mount (body end).
Figure 8a shows how the acceleration sensors were installed when testing the mount vibration isolation rates. However, improving the mount vibration isolation rate is not the ultimate goal. For this reason, two typical operating conditions, idle air conditioning off and third gear full throttle acceleration, were selected for the whole vehicle NVH performance evaluation. For the measurement of in-vehicle noise, the location point of the driver’s right ear is common in the Chinese automotive industry. The pressure sensor installation is shown in Figure 8b.

5.1. Idle Condition

Table 8 shows the comparison of the vibration isolation rates of the three mounts before and after optimization in the idle condition (air conditioning off). It can be seen that the vibration isolation rates have increased significantly after optimization.
Although the vibration isolation rates of the three mounts in some directions are not greater than 20 dB, as desired by the industry after optimization, the state of the system can be judged in conjunction with the vibration of the passive end of the mount. Generally speaking, in the state of idle air conditioning being off, the vibration of the passive end of the mounts less than or equal to 0.05 m/s2 meets the design requirements. From the vibration amplitude of the passive end of the three mounts shown in Figure 9, the vibration of the passive end of all three mounts meets the design requirements.
At the same time, it is more important to judge the vibration perception of the driver from the perspective of the whole vehicle, such as the vibration of the driver’s seat rail and the steering wheel. The optimized three-dimensional vibration of the seat rail and the steering wheel in the vehicle is shown in Figure 10. The RMS acceleration values in the X-, Y-, and Z-directions were also calculated and compared with the limit values [31], as shown in Table 9. The vibration of the driver’s seat rail and steering wheel at idle condition with the air conditioning off are below the corresponding limits.

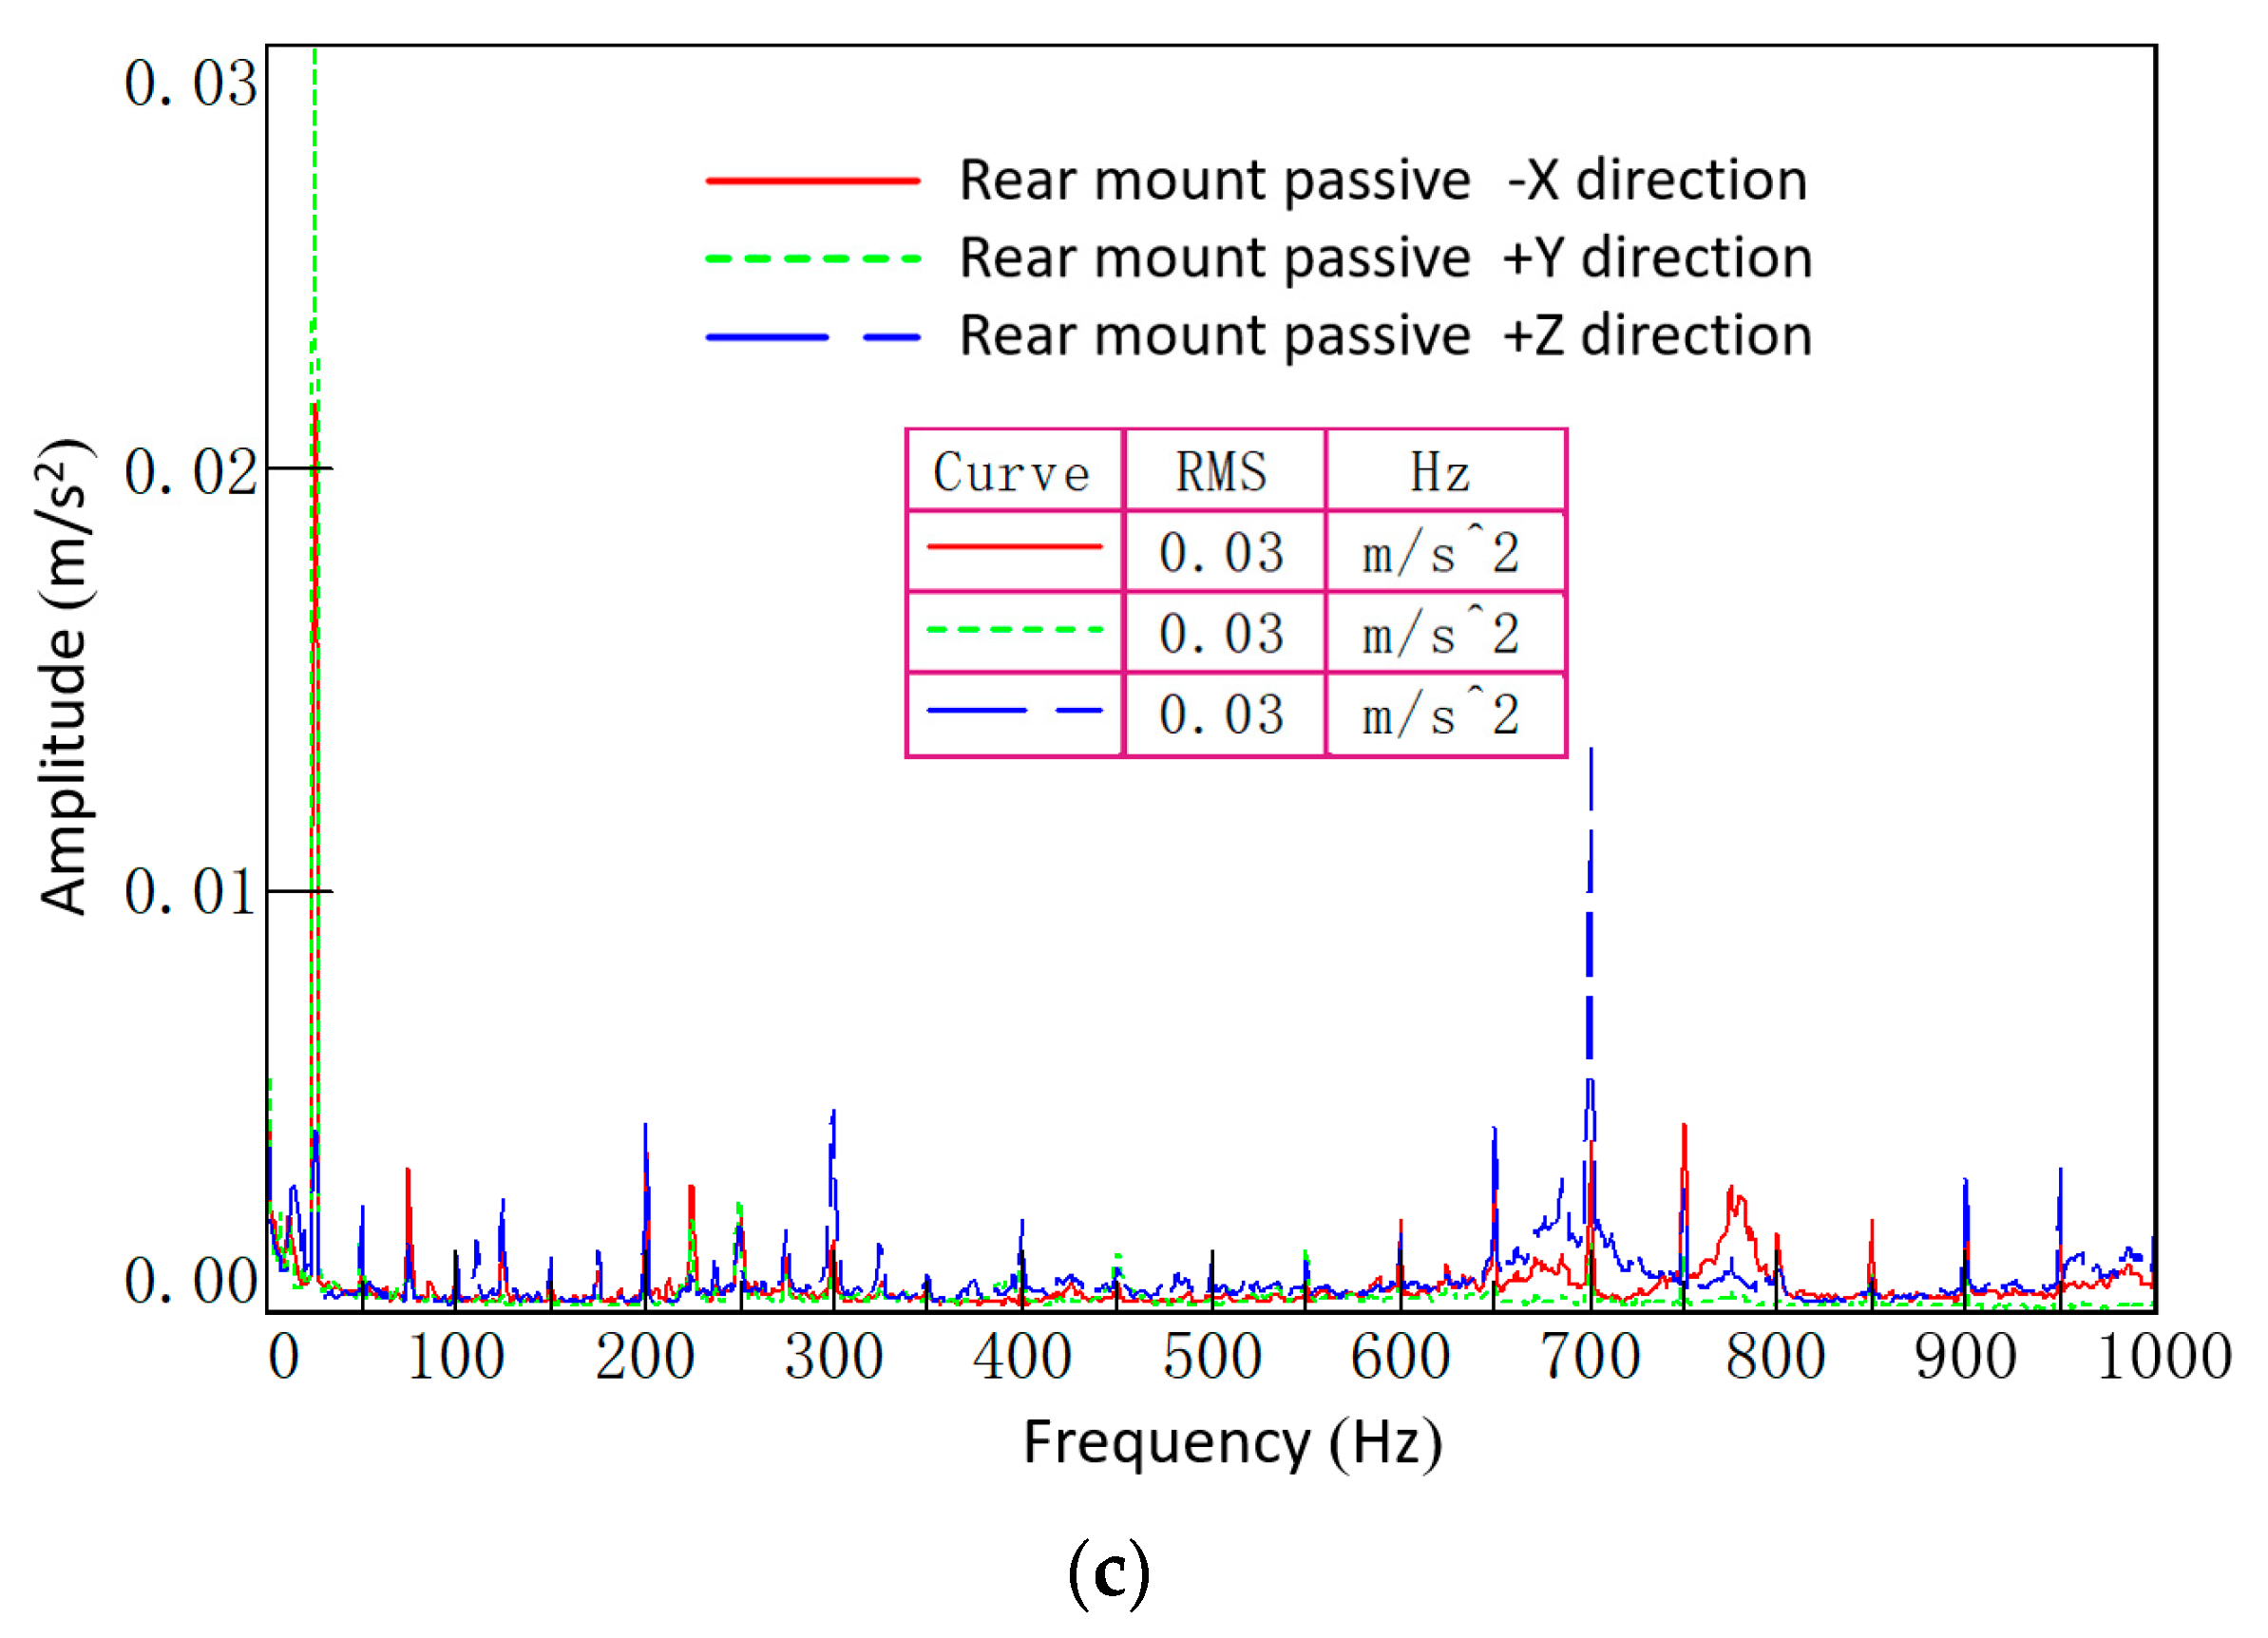
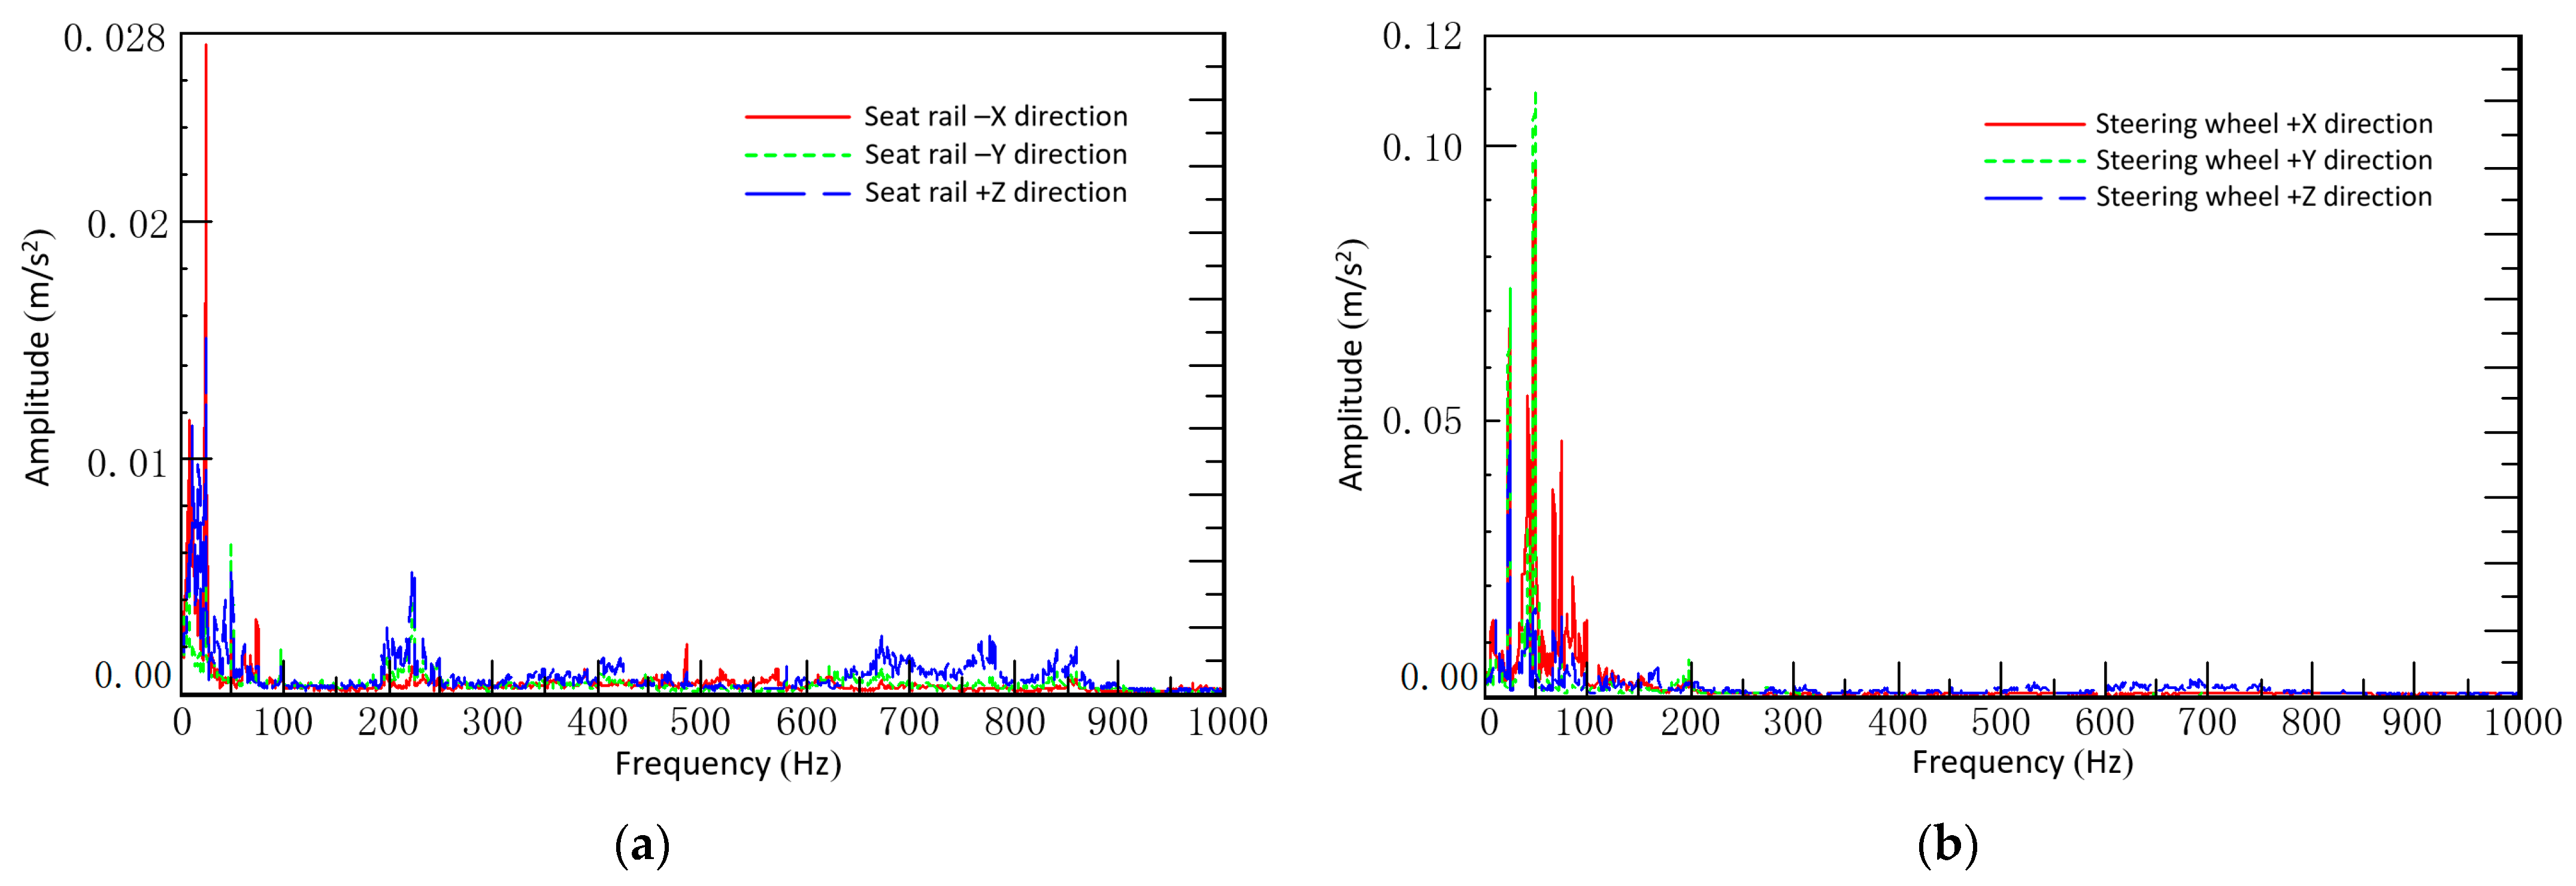
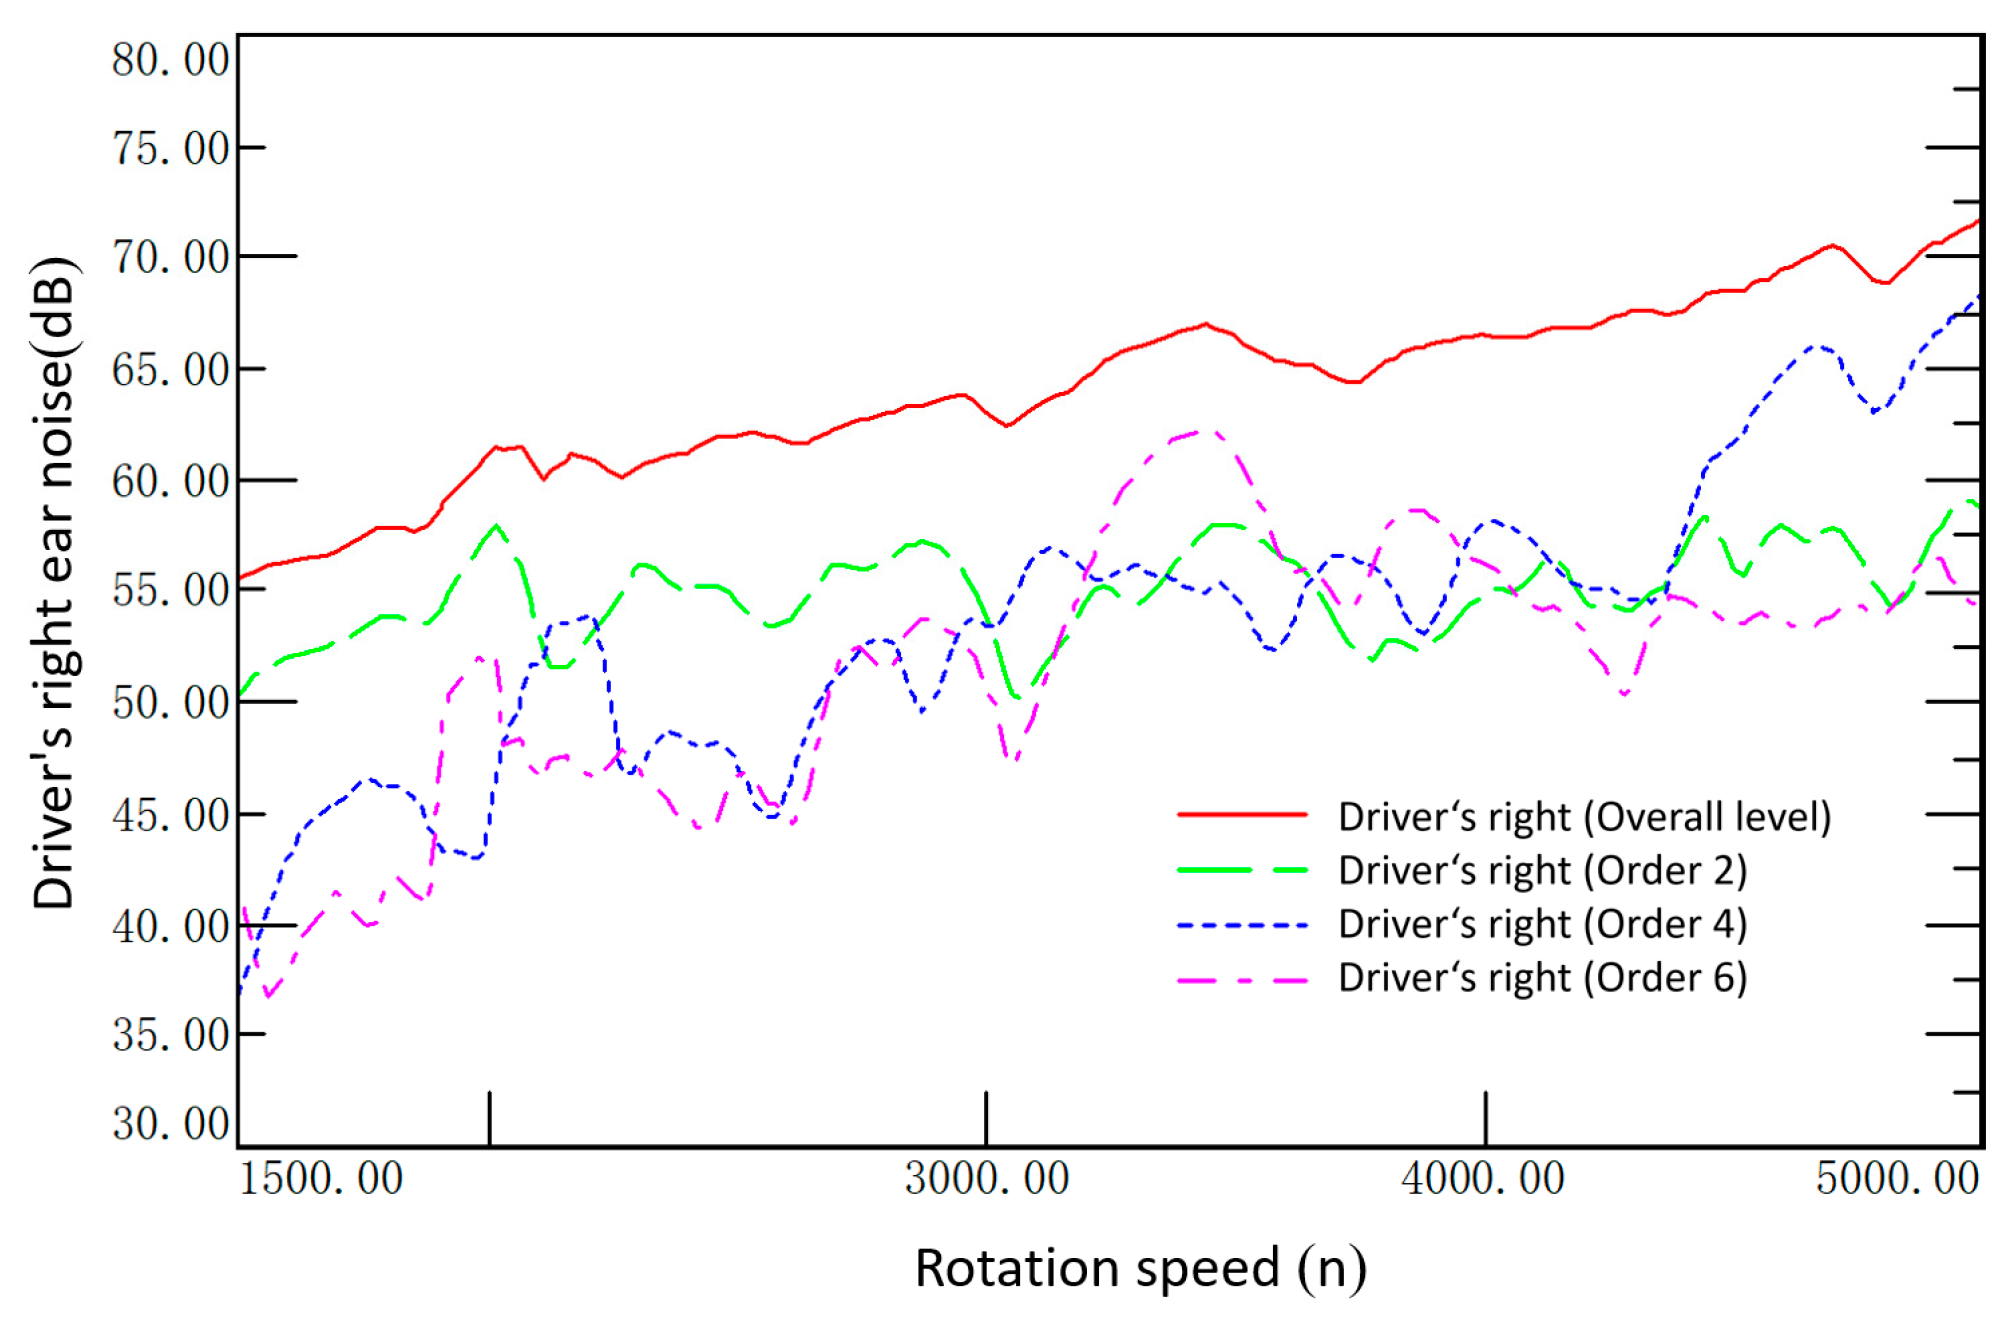
5.2. Third Gear Full Throttle Acceleration Condition

Figure 11 show a comparison of the vibration isolation rates in the Z-direction of the three mounts. It is clear from the test data that the vibration isolation rates have all improved after optimization.
The acceleration condition also requires a focus on the interior noise level in the vehicle. Figure 12 shows the noise level in the driver’s right ear. From the test results, the linearity of the overall level noise is good, with all speed ranges below the 70 dB(A) limit and no significant peaks in the main noise orders. The NVH performance of the car is subjectively good under both idling and accelerating conditions, and the sound quality inside the car is good. The uncertainty optimization, based on the generalized inverse cascade method, is effective.

6. Conclusions

Firstly, the research focused on a specific type of powertrain mounting system. To generate reliable data, a total of sixty sets of sample data were obtained through a combination of a high-precision ADAMS simulation model and the implementation of a design of experiments. Subsequently, a mapping relationship between the stiffness variables and the force transmission rate and decoupling rate, referred to as the CRBM-DBN approximation model, was established. The optimal intervals for the mounting stiffness were then determined using the generalized inverse cascade method. As a result, the optimized mounting exhibited a substantial reduction in weighted force transmission rate and a notable improvement in the weighted modal decoupling rate.
Secondly, for the purpose of CAE verification, four sets of parameter combinations were selected based on the optimization solution intervals, which were derived from the generalized inverse cascade method. Additionally, one set of parameter combination samples was validated through NVH testing of the entire vehicle. It is important to note that all optimized interval combinations successfully met the initial target requirements. When aiming to achieve higher requirements with a greater probability, narrower intervals for the underlying design variables are desired, and vice versa. In the provided example, the target requirements for weighted force transmission rate and weighted decoupling rate were set at a moderate level, thus resulting in relatively wide intervals for the stiffness values.
Thirdly, practical engineering problems often involve specific trade-offs, including cost considerations. The integration of engineering constraints into the optimization algorithm, without compromising search efficiency, warrants further investigation in future research endeavors.

Author Contributions

Y.S., writing—review and editing; H.W., writing—original draft preparation; J.Z., data collection; Y.W., visualization; H.H., methodology, funding acquisition. All authors have read and agreed to the published version of the manuscript.

Funding

This research was funded by: the Natural Science Foundation of Chongqing, grant number cstc2021jcyj-msxmX1020; the SWJTU Science and Technology Innovation Project, grant number 2682022CX008; and the Natural Science Foundation of Sichuan Province, grant number 2022NSFSC1892.

Data Availability Statement

Not applicable.

Conflicts of Interest

The authors declare no conflict of interest.

References

  1. Huang, H.; Huang, X.; Ding, W.; Zhang, S.; Pang, J. Optimization of electric vehicle sound package based on LSTM with an adaptive learning rate forest and multiple-level multiple-object method. Mech. Syst. Signal Process. 2023, 187, 109932. [Google Scholar] [CrossRef]
  2. Chang, L.; Jiang, A.; Rao, M.; Ma, F.; Huang, H.; Zhu, Z.; Hu, Y. Progress of low-frequency sound absorption research utilizing intelligent materials and acoustic metamaterials. RSC Adv. 2021, 11, 37784–37800. [Google Scholar] [CrossRef] [PubMed]
  3. Wang, Y.; Lu, Z. Optimal Design Method of Power-train Mounting System for Generalized Force Transmissibility Reduction. J. Mech. Eng. 2011, 47, 52–58. [Google Scholar] [CrossRef]
  4. Shangguan, W.; Liu, X.; Lv, Z. Design Method of Automotive Powertrain Mounting System Based on Vibration and Noise Limitations of Vehicle Level. Mech. Syst. Signal Process. 2016, 76–77, 677–695. [Google Scholar] [CrossRef]
  5. Huang, X.; Huang, H.; Wu, J.; Yang, M.; Ding, W. Sound quality prediction and improving of vehicle interior noise based on deep Convolutional neural networks. Expert Syst. Appl. 2020, 160, 113657. [Google Scholar] [CrossRef]
  6. Sun, Q.; Liu, S.; Niu, N. A Decoupling Method of Powertrain Mounting Systems and Vibration Characteristics Analysis of Complex Flexible Foundations. J. Vib. Shock 2019, 38, 258–263. [Google Scholar] [CrossRef]
  7. Huang, H.; Lim, T.C.; Wu, J.; Ding, W.; Pang, J. Multitarget prediction and optimization of pure electric vehicle tire/road airborne noise sound quality based on a knowledge-and data-driven method. Mech. Syst. Signal Process. 2023, 197, 110361. [Google Scholar] [CrossRef]
  8. Huang, H.; Huang, X.; Ding, W.; Yang, M.; Yu, X.; Pang, J. Vehicle vibro-acoustical comfort optimization using a multi-objective interval analysis method. Expert Syst. Appl. 2023, 213, 119001. [Google Scholar] [CrossRef]
  9. Zhou, M.; Hou, Z. Optimization on Engine Mounting Based on Genetic Algorithm. Automob. Technol. 2006, 9, 13–16. [Google Scholar]
  10. Zhou, G.; Jiang, W.; Wu, H. Optimal design of engine mount system by minimizing the total force transmission. J. Vib. Shock 2008, 27, 56–58. [Google Scholar] [CrossRef]
  11. Tong, W.; Chen, J.; Song, X. Multi-objective optimization of engine mounting system based on ADAMS. Automot. Eng. 2011, 33, 971–975. [Google Scholar] [CrossRef]
  12. Pan, G.; Fu, B.; Wang, G. Optimization design of a powertrain mount-system based on the TPA and genetic algorithm. J. Vib. Shock 2021, 40, 279–286. [Google Scholar] [CrossRef]
  13. Chen, J.; Xu, C. Optimization Design and Reliability Analysis of Engine Mount System. Automot. Eng. 2009, 31, 234–238. [Google Scholar] [CrossRef]
  14. Zhang, D.; Zhang, X.; Li, Y. Optimization of engine mounting system based on Pareto clustering immune evolutionary algorithm and robustness analysis. J. Hefei Univ. Technol. (Nat. Sci.) 2012, 35, 1589–1593. [Google Scholar]
  15. Shi, P.; Chen, W.; Gao, L. Robustness Design of Powertrain Mount System Based on Monte Carlo Method. Automot. Eng. 2010, 32, 707–711. [Google Scholar] [CrossRef]
  16. Zheng, G.; Dong, Z.; Hao, T. Stiffness optimization and robustness analysis of the mount system based on the RSM model. J. Mach. Des. 2020, 37, 71–77. [Google Scholar] [CrossRef]
  17. Wu, J.; Liu, X.; Shan, Y. Robustness Optimization of Engine Mounting System Based on Six Sigma and Torque Roll Axis Decoupling Method. Proc. Inst. Mech. Eng. Part D J. Automob. Eng. 2019, 233, 1047–1060. [Google Scholar] [CrossRef]
  18. Chen, J.; Liu, C.; Yang, Z. Robust optimization design of engine mounting system based on Six Sigma method. J. Hefei Univ. Technol. (Nat. Sci.) 2017, 40, 1469–1473. [Google Scholar]
  19. Huang, H.B.; Wu, J.H.; Huang, X.R.; Yang, M.L.; Ding, W.P. A generalized inverse cascade method to identify and optimize vehicle interior noise sources. J. Sound Vib. 2020, 467, 115062. [Google Scholar] [CrossRef]
  20. Xin, F.; Qian, L.; Du, H. Multi-Objective Robust Optimization Design for Powertrain Mount System of Electric Vehicles. J. Low Freq. Noise Vib. Act. Control 2017, 36, 243–260. [Google Scholar] [CrossRef]
  21. Li, C.; Cong, Z.Z.; Bao, J.D. Robust Optimization of Powertrain Mounting System Based on Interval Analysis. In Proceedings of the Fifth Asia International Symposium on Mechatroni (AISM 2015), Guilin, China, 7–10 October 2015; pp. 1–4. [Google Scholar] [CrossRef]
  22. Cai, B.; Shangguan, W.B.; Lü, H. An Efficient Analysis and Optimization Method for Powertrain Mounting Systems Involving Interval Uncertainty. Proc. Inst. Mech. Eng. Part D J. Automob. Eng. 2020, 234, 1318–1329. [Google Scholar] [CrossRef]
  23. Chen, J.; Li, S.; Liu, C.; Deng, Z.; Shu, H. Robustness Optimization of Powertrain Mounting Systems Based on Chebyshev Interval Method. China Mech. Eng. 2018, 29, 314–319. [Google Scholar]
  24. Xie, Z.; Yu, D.; Li, R. Robust Optimization Design of Engine Mount Systems Based on Interval Analysis. Automot. Eng. 2014, 36, 1503–1507+1527. [Google Scholar] [CrossRef]
  25. Lü, H.; Mao, H.; Huang, X. An Effective Approach for Reliability-Based Robust Design Optimization of Uncertain Powertrain Mounting Systems Involving Imprecise Information. Eng. Comput. 2021, 38, 1193–1214. [Google Scholar] [CrossRef]
  26. Lü, H.; Zheng, Z.; Huang, X. A Methodology for Design Optimization of Powertrain Mounting Systems Involving Hybrid Interval-Random Uncertainties. Struct. Multidiscip. Optim. 2021, 63, 1265–1285. [Google Scholar] [CrossRef]
  27. Xing, T. Vehicle Suspension K&C Characteristic Analysis and Its EDBS Implementation. Master’s Thesis, Southwest Jiaotong University, Chengdu, China, 2015. [Google Scholar]
  28. Huang, H.; Huang, X.; Ding, W.; Yang, M.; Fan, D.; Pang, J. Uncertainty optimization of pure electric vehicle interior tire/road noise comfort based on data-driven. Mech. Syst. Signal Process. 2022, 165, 108300. [Google Scholar] [CrossRef]
  29. Zhuang, C.; Wen, H.; Ni, X.; Zhang, D.; Bao, Y.; Huang, H. Optimization of Cab Vibration Comfort for Construction Machinery Based on Multi-Target Regression Forests. Machines 2022, 10, 1148. [Google Scholar] [CrossRef]
  30. Cheng, L.; Wen, H.; Ni, X.; Zhuang, C.; Zhang, W.; Huang, H. Optimization Study on the Comfort of Human-Seat Coupling System in the Cab of Construction Machinery. Machines 2023, 11, 30. [Google Scholar] [CrossRef]
  31. Luo, J. Simulation Analysis and Optimization Study of a Vehicle Powertrain Mounting System. Master’s Thesis, South China University of Technology, Guangzhou, China, 2021. [Google Scholar]
Figure 1. A schematic diagram of the hierarchical decomposition model of the mounting system.
Applsci 13 07615 g001
Figure 2. A schematic diagram of the multi-objective two-level decomposition model.
Applsci 13 07615 g002
Figure 3. The multi-objective two-level optimization model design process under uncertainty.
Applsci 13 07615 g003
Figure 4. The search strategy for optimally designed variable interval.
Applsci 13 07615 g004
Figure 5. The schematic diagram of the mounting system connections.
Applsci 13 07615 g005
Figure 6. Comparison of experimental and simulational Z-directional vibration of the engine (vehicle coordinate system): (a) time domain comparison; (b) frequency domain comparison.
Applsci 13 07615 g006
Figure 7. A comparison of the CRBM-DBN mapping model fitting values with the actual values: (a) the training set for weighted force transmission rate; (b) the testing set for the weighted force transmission rate; (c) the training set for the weighted decoupling rate; (d) the testing set for the weighted decoupling rate.
Applsci 13 07615 g007
Figure 8. Diagram of the sensor installation position: (a) the acceleration sensors on the active and passive ends of the mount; (b) the driver’s right ear sound pressure sensor.
Applsci 13 07615 g008
Figure 9. Optimized vibration of the passive end: (a) front-left mount; (b) front right-mount; (c) rear mount.
Applsci 13 07615 g009aApplsci 13 07615 g009b
Figure 10. Vibration test results at idle condition (air-conditioning is off): (a) the driver’s seat rail position; (b) the steering wheel position.
Applsci 13 07615 g010
Figure 11. Comparison of vibration isolations rate before and after optimization: (a) front-left mount Z-direction; (b) front-right mount Z-direction; (c) rear mount Z-direction.
Applsci 13 07615 g011
Figure 12. The optimized driver’s right ear noise state (third gear full throttle acceleration).
Applsci 13 07615 g012
Table 1. The variation ranges in the mount stiffnesses.
Mount DirectionMount Stiffness (N/mm)
Front left longitudinal mount (X-direction)28 ≤ SFL,X ≤ 52
Front left transversal mount (Y-direction)35 ≤ SFL,Y ≤ 65
Front left vertical mount (Z-direction)210 ≤ SFL,Z ≤ 390
Front right longitudinal mount (X-direction)28 ≤ SFR,X ≤ 52
Front right transversal mount (Y-direction)35 ≤ SFR,Y ≤ 65
Front right vertical mount (Z-direction)210 ≤ SFR,Z ≤ 390
Rear longitudinal mount (X-direction)36.4 ≤ SRR,X ≤ 67.6
Rear transversal mount (Y-direction)117.6 ≤ SRR,Y ≤ 218.4
Rear vertical mount (Z-direction)176.4 ≤ SRR,Z ≤ 327.6
Table 2. The sample stiffness values for the mounting system.
SampleSFL,X
(N/mm)
SFL,Y
(N/mm)
SFL,Z
(N/mm)
SFR,X
(N/mm)
SFR,Y
(N/mm)
SFR,Z
(N/mm)
SRR,X
(N/mm)
SRR,Y
(N/mm)
SRR,Z
(N/mm)
1484135844.162.726053.7126224
228.34936432.847.537853.3160306
5937.753.23285137.636062.4178298
605261.23143460.432351138293
Table 3. Design variable optimal intervals—Pareto optimal solution set #1.
Design VariableLower Limit of
the Optimization Interval
(N/mm)
Upper Limit of
the Optimization Interval
(N/mm)
SFL,X2838
SFL,Y3649
SFL,Z233271
SFR,X2835
SFR,Y3548
SFR,Z229282
SRR,X5162
SRR,Y172207
SRR,Z178327
Table 4. Design variable optimal intervals—Pareto optimal solution set #2.
Design VariableLower Limit of
the Optimization Interval
(N/mm)
Upper Limit of
the Optimization Interval
(N/mm)
SFL,X2836
SFL,Y3951
SFL,Z256311
SFR,X2841
SFR,Y4050
SFR,Z265304
SRR,X5766
SRR,Y203213
SRR,Z199325
Table 5. Verification of the mount stiffness values.
Mount
Direction
Mount Element Stiffness Value (N/mm)
Original
Stiffness Value
Median Value
of Pareto Optimal Solution Set #1
Median Value
of Pareto Optimal Solution Set #2
Minimum Value
of Pareto Optimal
Solution Set #1
Maximum Value
of Pareto Optimal
Solution Set #1
SFL,X4033322838
SFL,Y5042.5453649
SFL,Z300252283.5233271
SFR,X4031.534.52835
SFR,Y5041.5453548
SFR,Z300255.5284.5229282
SRR,X5256.561.55162
SRR,Y168189.5208172207
SRR,Z252252.5262178327
Table 6. Force transmission rates for the different mount stiffness values.
Mount
Direction
Force Transmission Rate (N·s2/m)
Original
Stiffness Value
Median Value
of Pareto Optimal
Solution Set #1
Median Value
of Pareto Optimal
Solution Set #2
Minimum Value
of Pareto Optimal
Solution Set #1
Maximum Value
of Pareto Optimal
Solution Set #1
SFL,X700599638615668
SFL,Y45603872405340963989
SFL,Z956860816890877
SFR,X14001182122612071266
SFR,Y46064179411041974050
SFR,Z923825807807798
SRR,X12001004112811201156
SRR,Y800716681696749
SRR,Z736618695688638
Weighted force
transmission rate
13851212123312531235
Table 7. Decoupling rates of the main vibration modes for the different mount stiffness values.
Mount
Direction
Decoupling Rate of Main Vibration Mode (%)
Original
Stiffness
Value
Median Value
of Pareto Optimal Solution Set #1
Median Value
of Pareto Optimal Solution Set #2
Minimum Value
of Pareto Optimal
Solution Set #1
Maximum Value
of Pareto Optimal Solution Set #1
X70.7183.2879.7680.2281.46
Y74.5181.7583.6880.1178.60
Z84.4391.9190.9086.0889.46
θx76.8083.0580.6388.5777.69
θy72.2779.4581.4677.0086.42
θz63.0683.7078.5481.1179.58
Weighted
decoupling rate
72.2683.3182.2081.5080.91
Table 8. Comparison of the vibration isolation rate at idle condition (air-conditioning off) before and after optimization.
Mount
Direction
Vibration Isolation Rate
before Optimization (dB)
Vibration Isolation Rate
after Optimization (dB)
SFL,X22.7226.83
SFL,Y15.1518.24
SFL,Z23.3424.50
SFR,X20.4520.51
SFR,Y14.8417.62
SFR,Z23.7524.67
SRR,X20.3822.75
SRR,Y24.7223.42
SRR,Z23.8926.53
Table 9. Optimized vibration acceleration of the driver’s seat rail and the steering wheel (idle air-conditioning is off).
PositionX-Direction (m/s2)Y-Direction (m/s2)Z-Direction (m/s2)RSS Test Value (m/s2)RSS Limit Value (m/s2)
Seat rail0.02610.01340.02540.0390.05
Steering wheel0.10.10.05320.150.5
RSS is the root mean square value of three-dimensional vibration acceleration.
Disclaimer/Publisher’s Note: The statements, opinions and data contained in all publications are solely those of the individual author(s) and contributor(s) and not of MDPI and/or the editor(s). MDPI and/or the editor(s) disclaim responsibility for any injury to people or property resulting from any ideas, methods, instructions or products referred to in the content.

