Article

Calibration and Multiple Reliability Assessments of a Scrum Machine Instrumented to Measure Force

by
Eric Alexander Martin
1,*,
Steven B. Kim
2 and
George K. Beckham
1
1
Kinesiology Department, California State University Monterey Bay, Seaside, CA 93933, USA
2
Department of Mathematics and Statistics, California State University Monterey Bay, Seaside, CA 93933, USA
*
Author to whom correspondence should be addressed.
Appl. Sci. 2023, 13(13), 7581; https://doi.org/10.3390/app13137581
Submission received: 27 April 2023 / Revised: 21 June 2023 / Accepted: 23 June 2023 / Published: 27 June 2023

Abstract

:

Featured Application

This research establishes the excellent reliability of S-type load cells used in instrumenting a scrum machine both after an extended (7 h) run time and over 6 months of use. Furthermore, we show excellent inter-trial reliability in human use. Researchers or coaches wishing to build a similar instrumented scrum machine could use these results as a benchmark and basis of comparison for their own machine.

Abstract

Coaches need reliable methods of quantifying rugby union scrum force performance in order to make data-driven decisions. The purpose of this study is to present the reliability of a replicable instrumented scrum machine. We performed 3 phases of deadweight calibration on 8 S-type load cells; during deadweight calibration, each load cell was loaded with ~20–200 kg. Phase 1 compared power sources (wall outlet vs. portable power station). Phase 2 tested the inter-session reliability of the load cells after 15, 30, 45, 60, and 420 min of run time. Phase 3 tested between-session reliability, comparing days 0, 1, 7, and 180. We also performed a phase of inter-trial reliability when humans pushed on the fully instrumented scrum machine. Fourteen collegiate rugby players performed four warm-up trials and then five 100%-effort trials; peak and average voltage during the push were compared between the 100%-effort trials. For all phases, statistical analyses show near-perfect reliability. Therefore, we conclude that our novel instrumented scrum machine is ready for in vivo data collection; other coaches or researchers could duplicate our methods to create their own reliable instrumented scrum machine.

1. Introduction

In the sport of rugby union, when play is stopped because of a dead-ball infraction, it is then restarted using a scrum. In the version of rugby union with 15 players per side (hereafter just “rugby”), 8 players from each team bind together to form a forward scrum pack. The two opposing scrum packs then bind against each other and contest for possession of the ball, which is rolled into the space between the two scrum packs [1]. If one scrum pack can produce more force than the other scrum pack, it may be able to push the opposing scrum pack backward and away from the ball, thus gaining possession of the ball [2,3]. Thus, the scrum is a tactically important part of the game, because winning ball possession in the scrum determines which team possesses the ball and can make offensive progress toward scoring.
Around 2013, World Rugby, the governing body of rugby union, commissioned research into the impact forces of scrum engagement [4,5,6,7]. Following Preatoni and colleagues’ research [4,5,6,7], World Rugby changed the laws (i.e., rules) of the sport to minimize scrum impact forces, with the goal of decreasing injury rates. As a consequence of the rule changes, the scrum tends to last longer (from only about 3 s on average to closer to 8 s) [2,3]. This provides more opportunity for scrum packs to contest for the ball; knowing the force development characteristics of their scrum pack could help coaches make tactical, training, and player-selection decisions on the basis of empirical data and experimentation. Two recent systematic reviews both highlighted the lack of research about scrum performance and the need for more data about the forces generated in the scrum and the force–time curves associated with scrummaging, especially during the sustained push phase where players contest for the ball [2,3]. Currently, there are several tactical decisions made by coaches in the scrums, such as using tight or loose binds, whether to try to wheel (i.e., attempt to rotate the whole scrum), and how much the flankers or #8 player should push versus being loosely bound and ready to disengage to make the tackle or support the ball carrier; however, none of these tactical decisions is informed by data. The primary reason why these decisions have to be made in the absence of data is the lack of equipment available to measure scrum forces.
In athletic fitness testing, coaches typically use free weights or force plates to assess the strength of their athletes. While force plates provide a high level of detail about the force-generating capabilities of athletes, and many are now portable, such as the Bertec Jump force plate (Bertec Corporation, Columbus, OH, USA), they are designed for testing the strength of a single athlete in a generally vertical position, which is not very specific to the scrum. Therefore, a device with similar capabilities to a force plate but that enables athletes to mimic the rugby scrum position is needed—hence, instrumented scrum machines. There are very few commercially available apparatuses that can measure the force generated in a scrum, and the only ones the authors are aware of are made by Predator and range from £4200 for an individual ergometer to £7100 for an indoor ergometer that can accommodate a whole pack to £12,200 for a fully instrumented scrum machine [8,9]. In the last 30 years, a few apparatuses have been built by researchers to measure scrum force for research purposes, though many of those have been limited to a single player at a time. In many of the research studies that did find a method of measuring whole-pack scrum force, the equipment used would not be practical for normal training purposes (for example, du Toit et al., [10], mounted a set of pads on a wall and used a force plate at the players’ feet to capture force). In addition to equipment limitations, a major gap in the research is the lack of reliability testing in scrum force production; in a systematic literature review [3], only one study was found that performed any kind of reliability testing, and that was as a small pilot prior to their main study [11].
Reliability is a crucial component of any fitness test that indicates how well a test produces the same result under similar conditions [12]. While testing force production in a scrum machine is still rare, especially outside of research, and is in a nascent stage of research [2,3], we can look to similar strength tests for guidance. Pushing against a scrum machine for testing force production has been, in the prior literature and in the presented studies below, an isometric force production task [2,3]. Thus, the two previously used tests that are the most similar to testing are an isometric squat (highly biomechanically specific to a scrum) and, to a slightly lesser extent, the isometric midthigh pull [13,14,15]. Brady and colleagues [13] published a review summarizing the reliability of both the isometric midthigh pull and the isometric squat; they summarized that the isometric midthigh pull demonstrates good within- and between-session reliability, as indicated by intraclass correlation coefficients (ICC) ≥ 0.92, for peak force among well-trained athletes in a wide variety of sports (the reviewed samples mostly consisted of Division 1 American collegiate-level athletes). Additionally, the reported coefficient of variation (CV) among the studies reviewed was under 4.3%. Using the criteria that Brady et al. [13] cited from Hopkins [12], ICCs > 0.9 and CVs < 15% indicate high reliability; therefore, Brady et al. [13] concluded that the isometric midthigh pull is a reliable measure of force production. Similarly, the review concluded that the isometric squat is a reliable measure of force production, summarizing that studies reported ICCs ≥ 0.97 for peak force. One important note Brady et al. [13] made, which is similar to the recent reviews of scrum force production [2,3], was that there is a lack of reliability research among female participants, and therefore the high reliability may not be generalizable to this segment of the population. Nevertheless, this prior research led us to the expectation that, in the human live trials (the final phase of the presented research), participants’ results would demonstrate high within-session reliability.
To address the identified gap in research and practice, we instrumented a commercially available scrum machine that would be in the price range of most rugby clubs so that our methods are replicable not only for other researchers but also for coaches. As with any novel machine, one of the first steps is to test it for multiple aspects of reliability. Ergo, the purposes of this article are as follows:
  • Present the basic assembly of our instrumented scrum machine to facilitate replication by other researchers and coaches;
  • Present our calibration procedures for replication;
  • Present the reliability of our machine, as no novel instrument can be deemed worthwhile without at least basic reliability.
To accomplish these purposes, we present the results of our multi-phase testing process.

2. Materials and Methods and Results

Because we are presenting the results of multiple phases of research, with each phase informing the next, we present the methods, results, and basic conclusions of each phase together, with a final summary discussion and conclusion at the end but no separate results section. To enhance transparency, we have provided all data sets from this research as a Supplementary Materials.

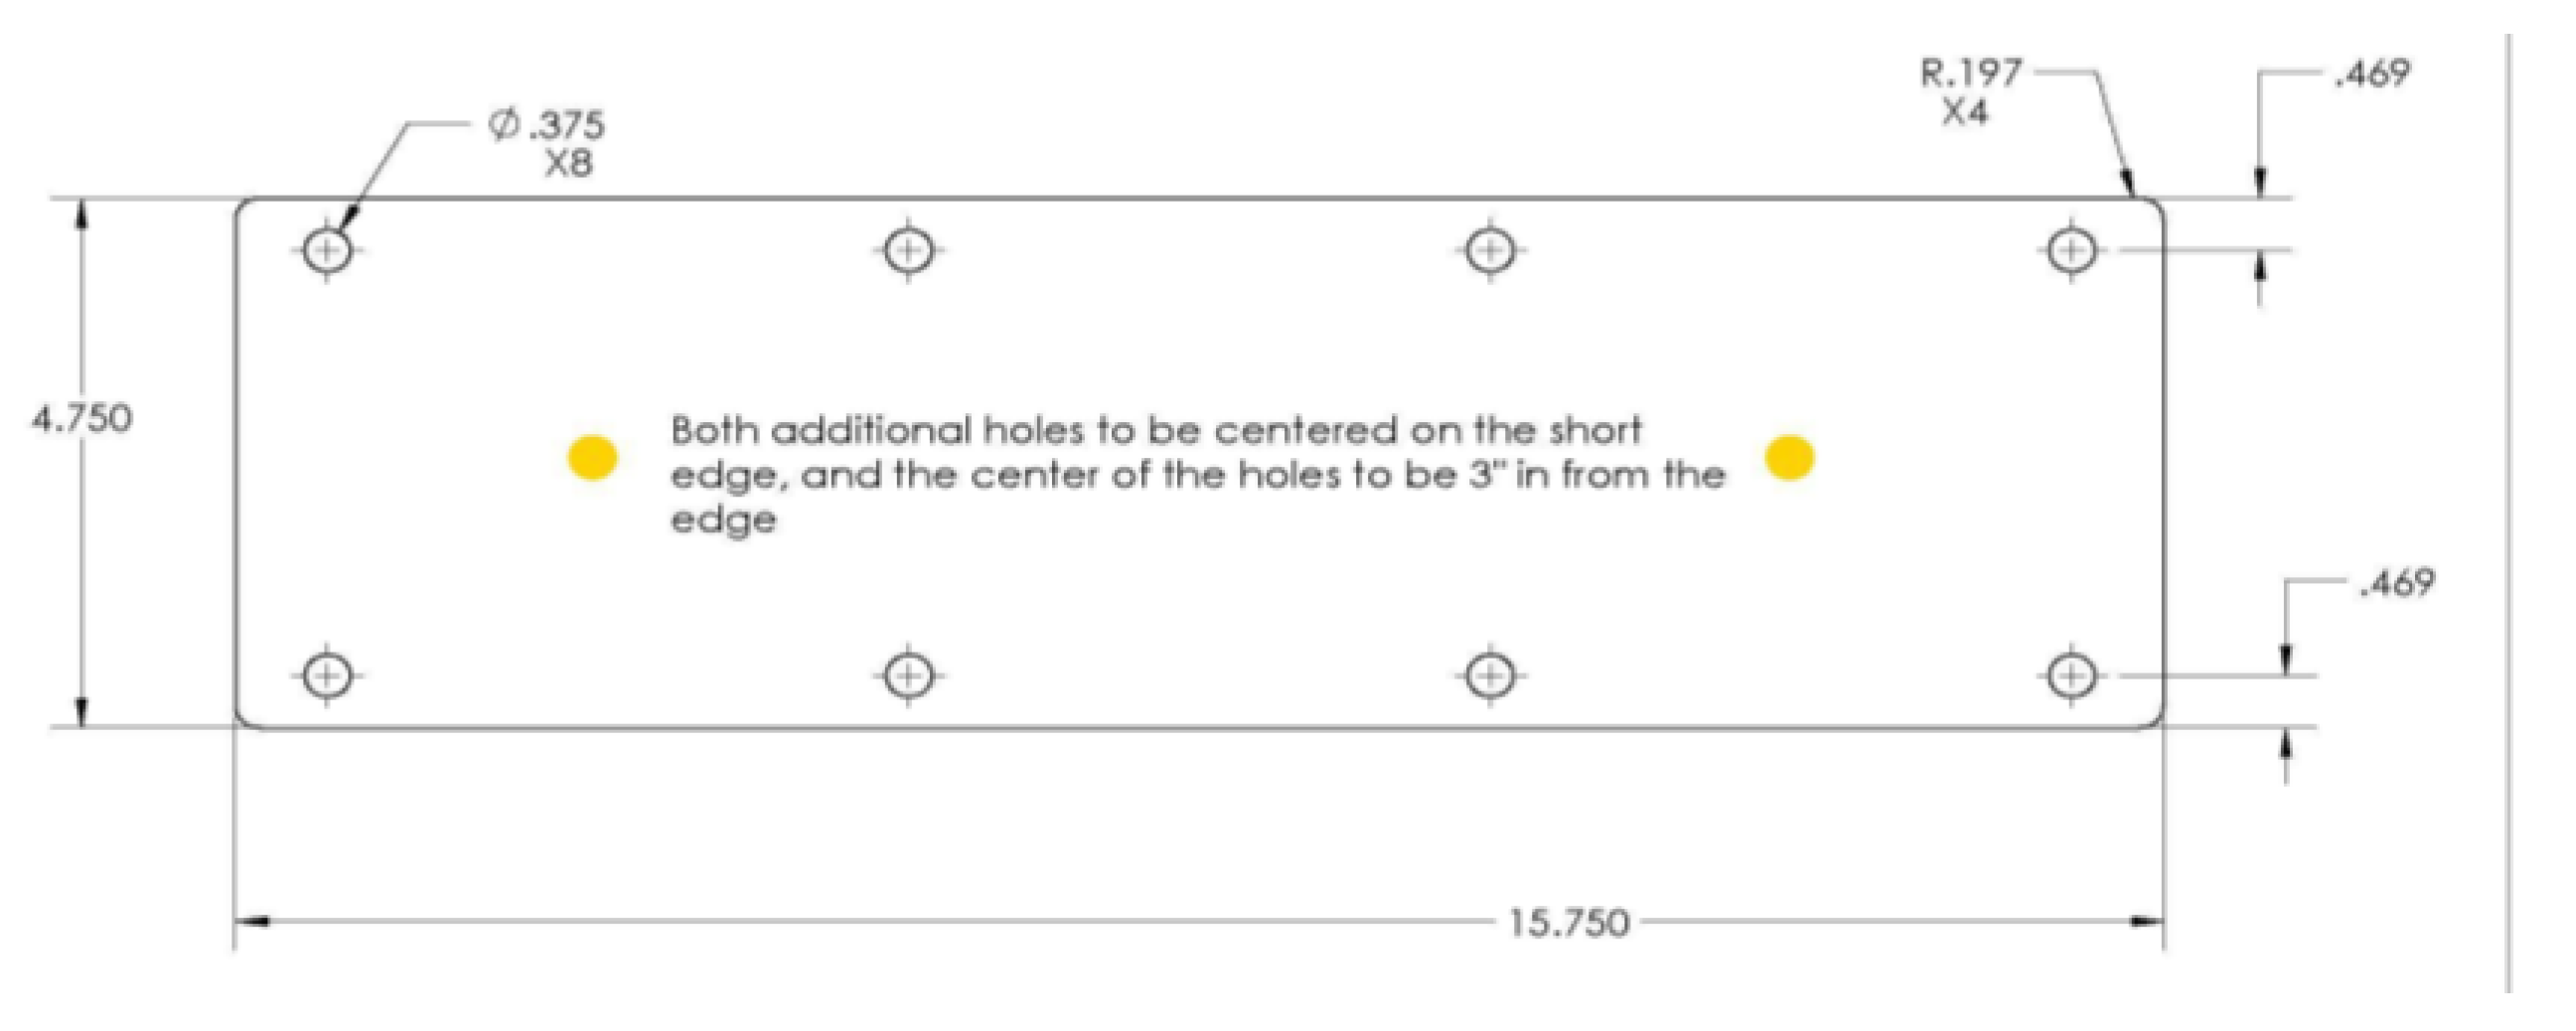
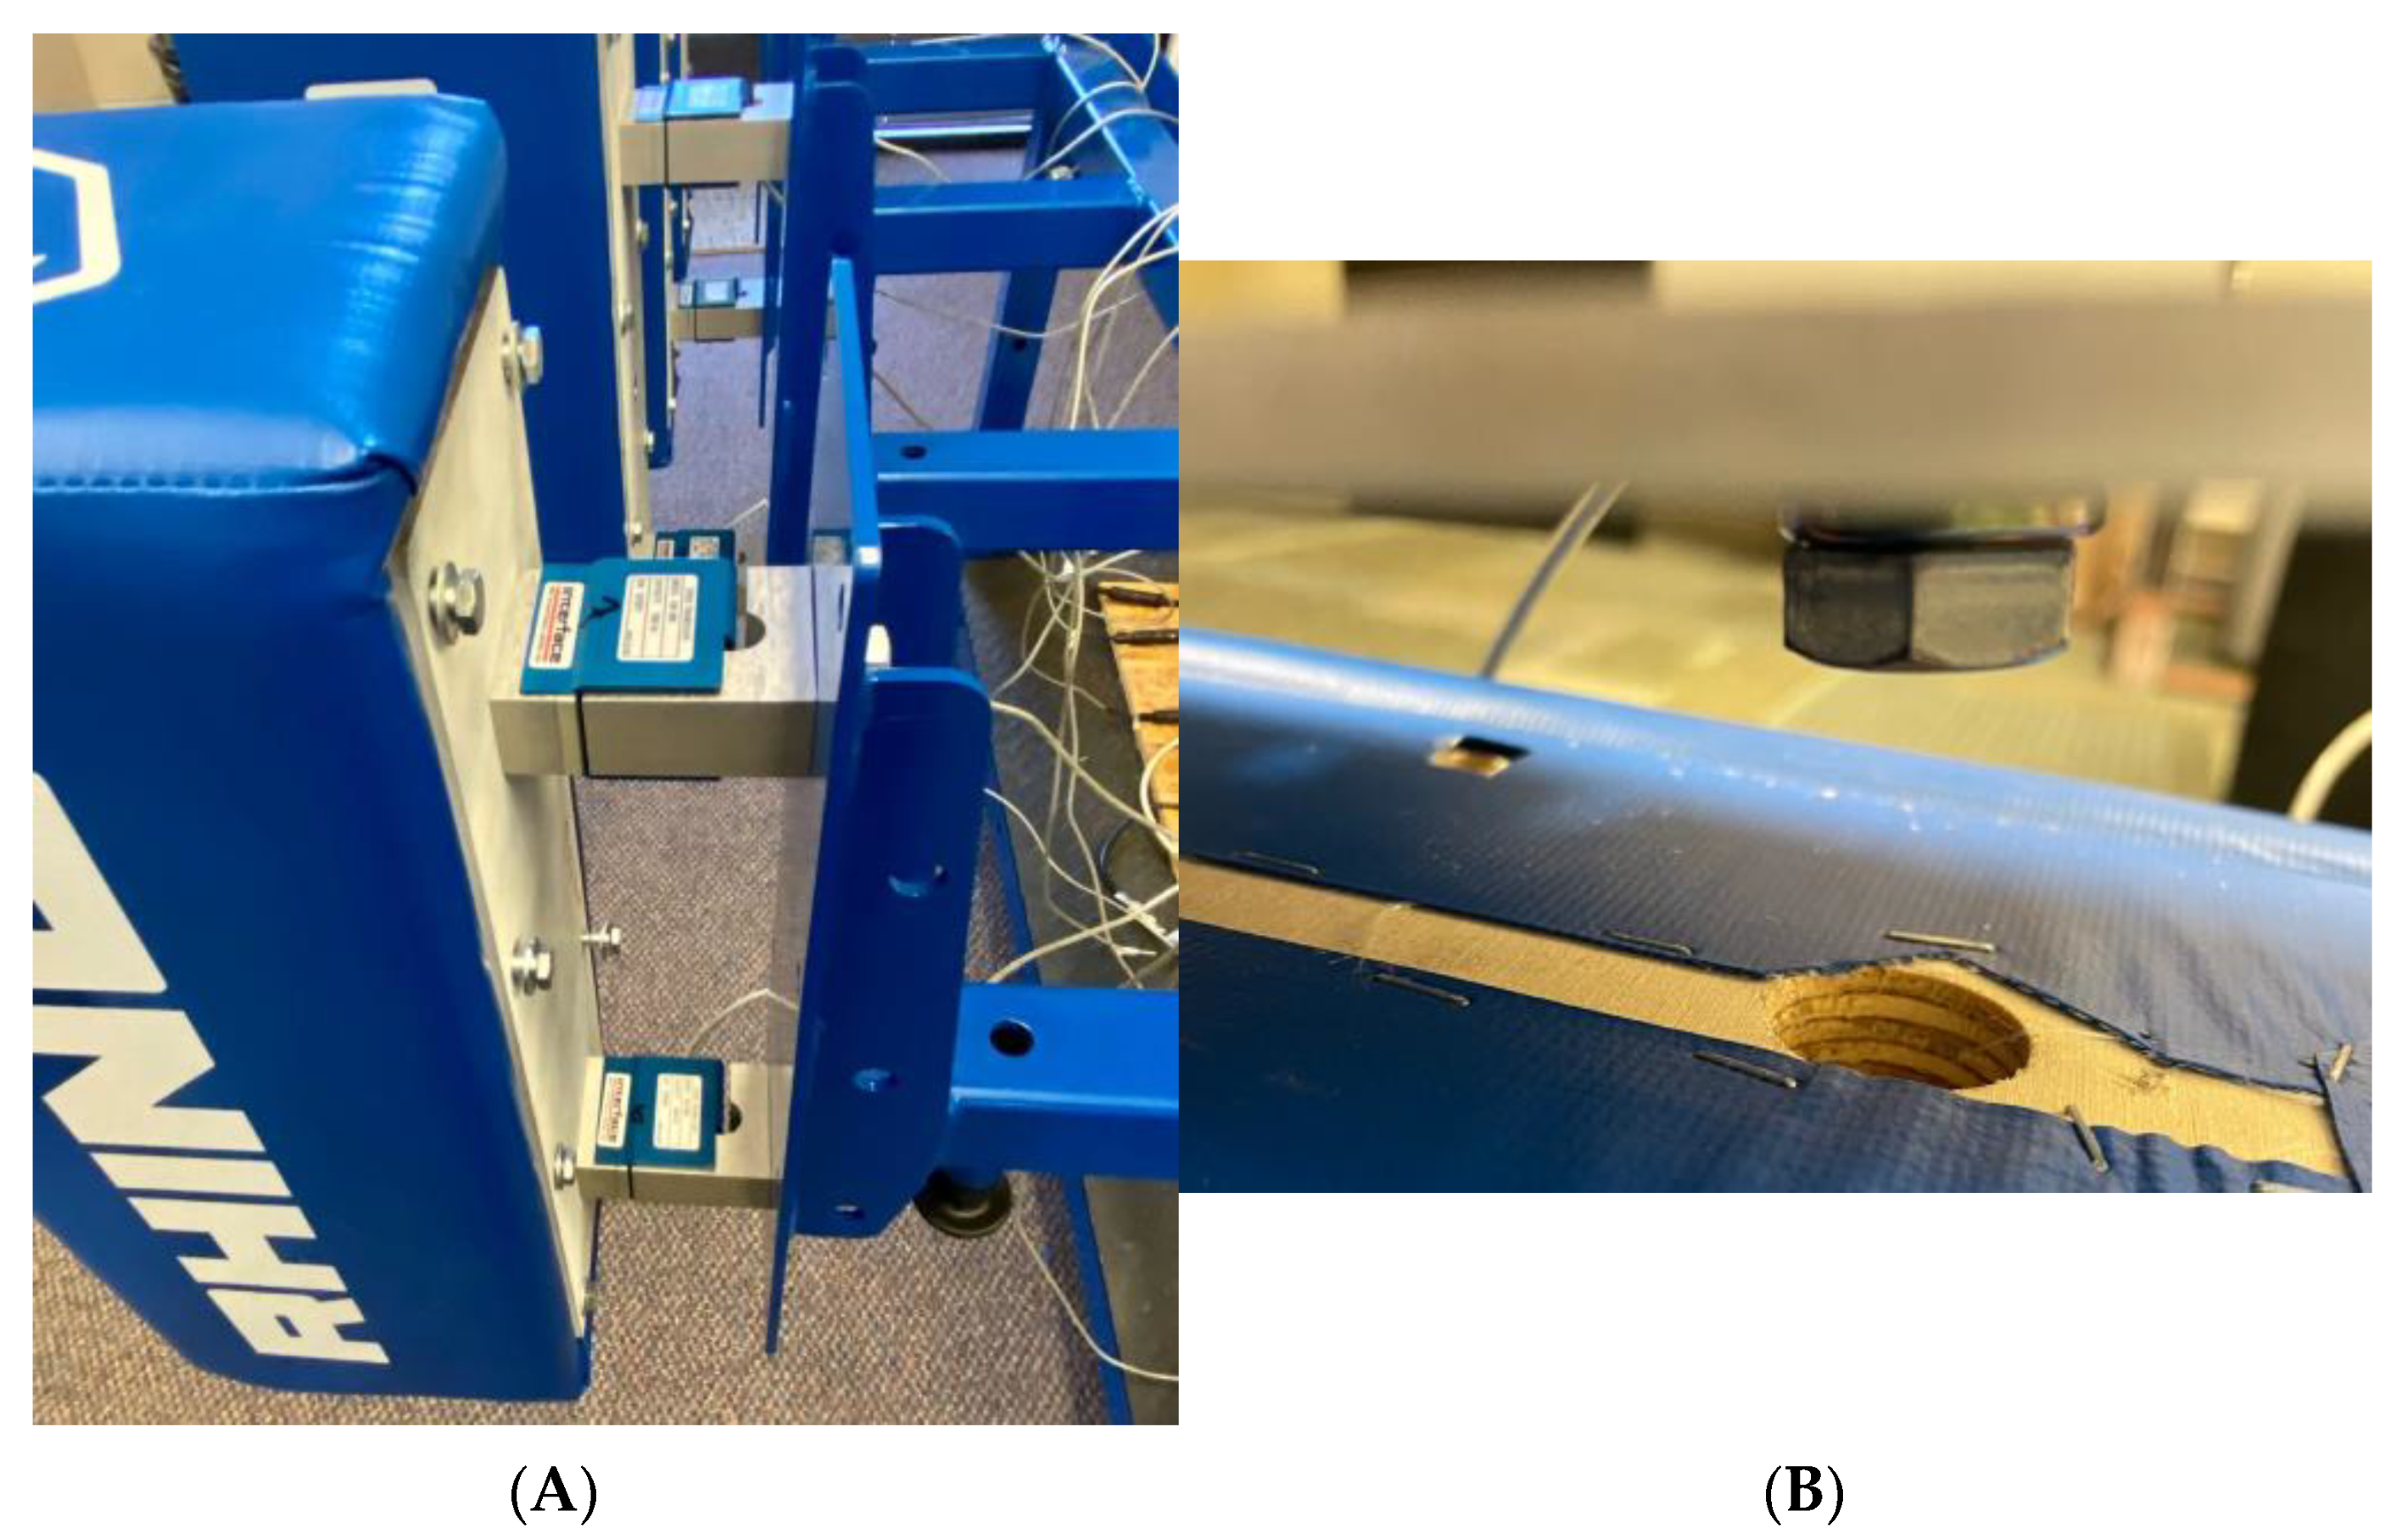
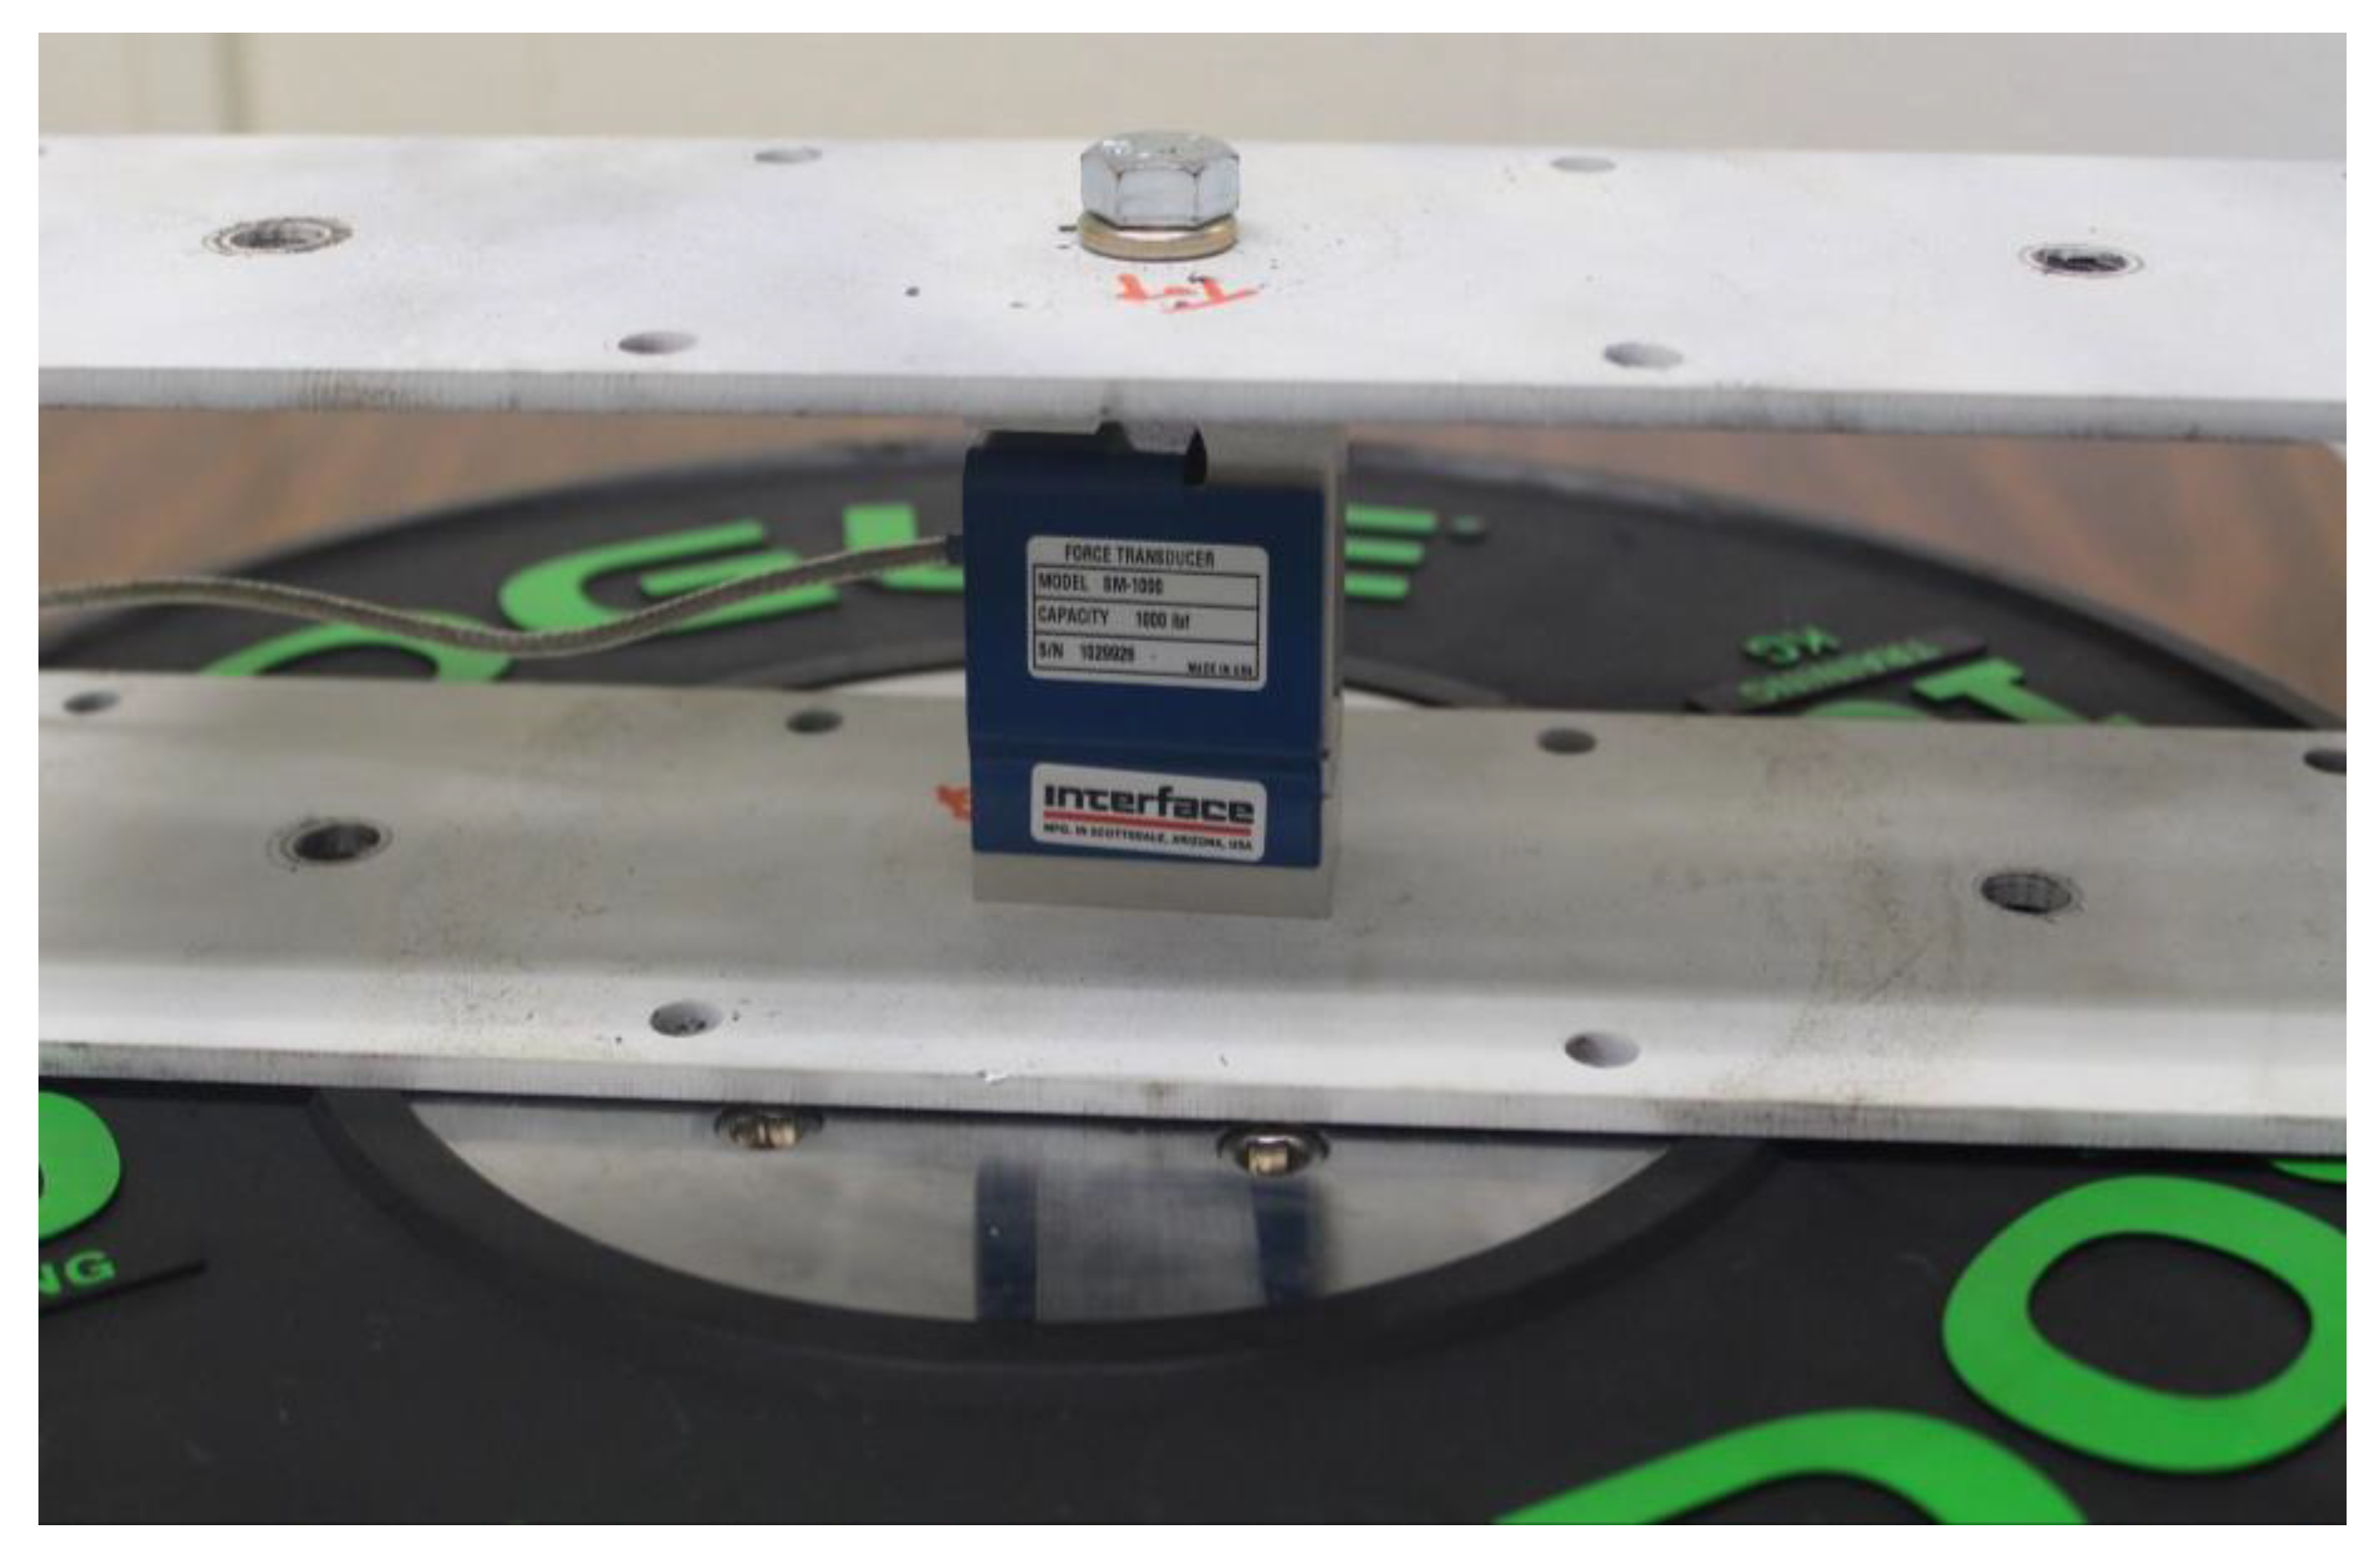
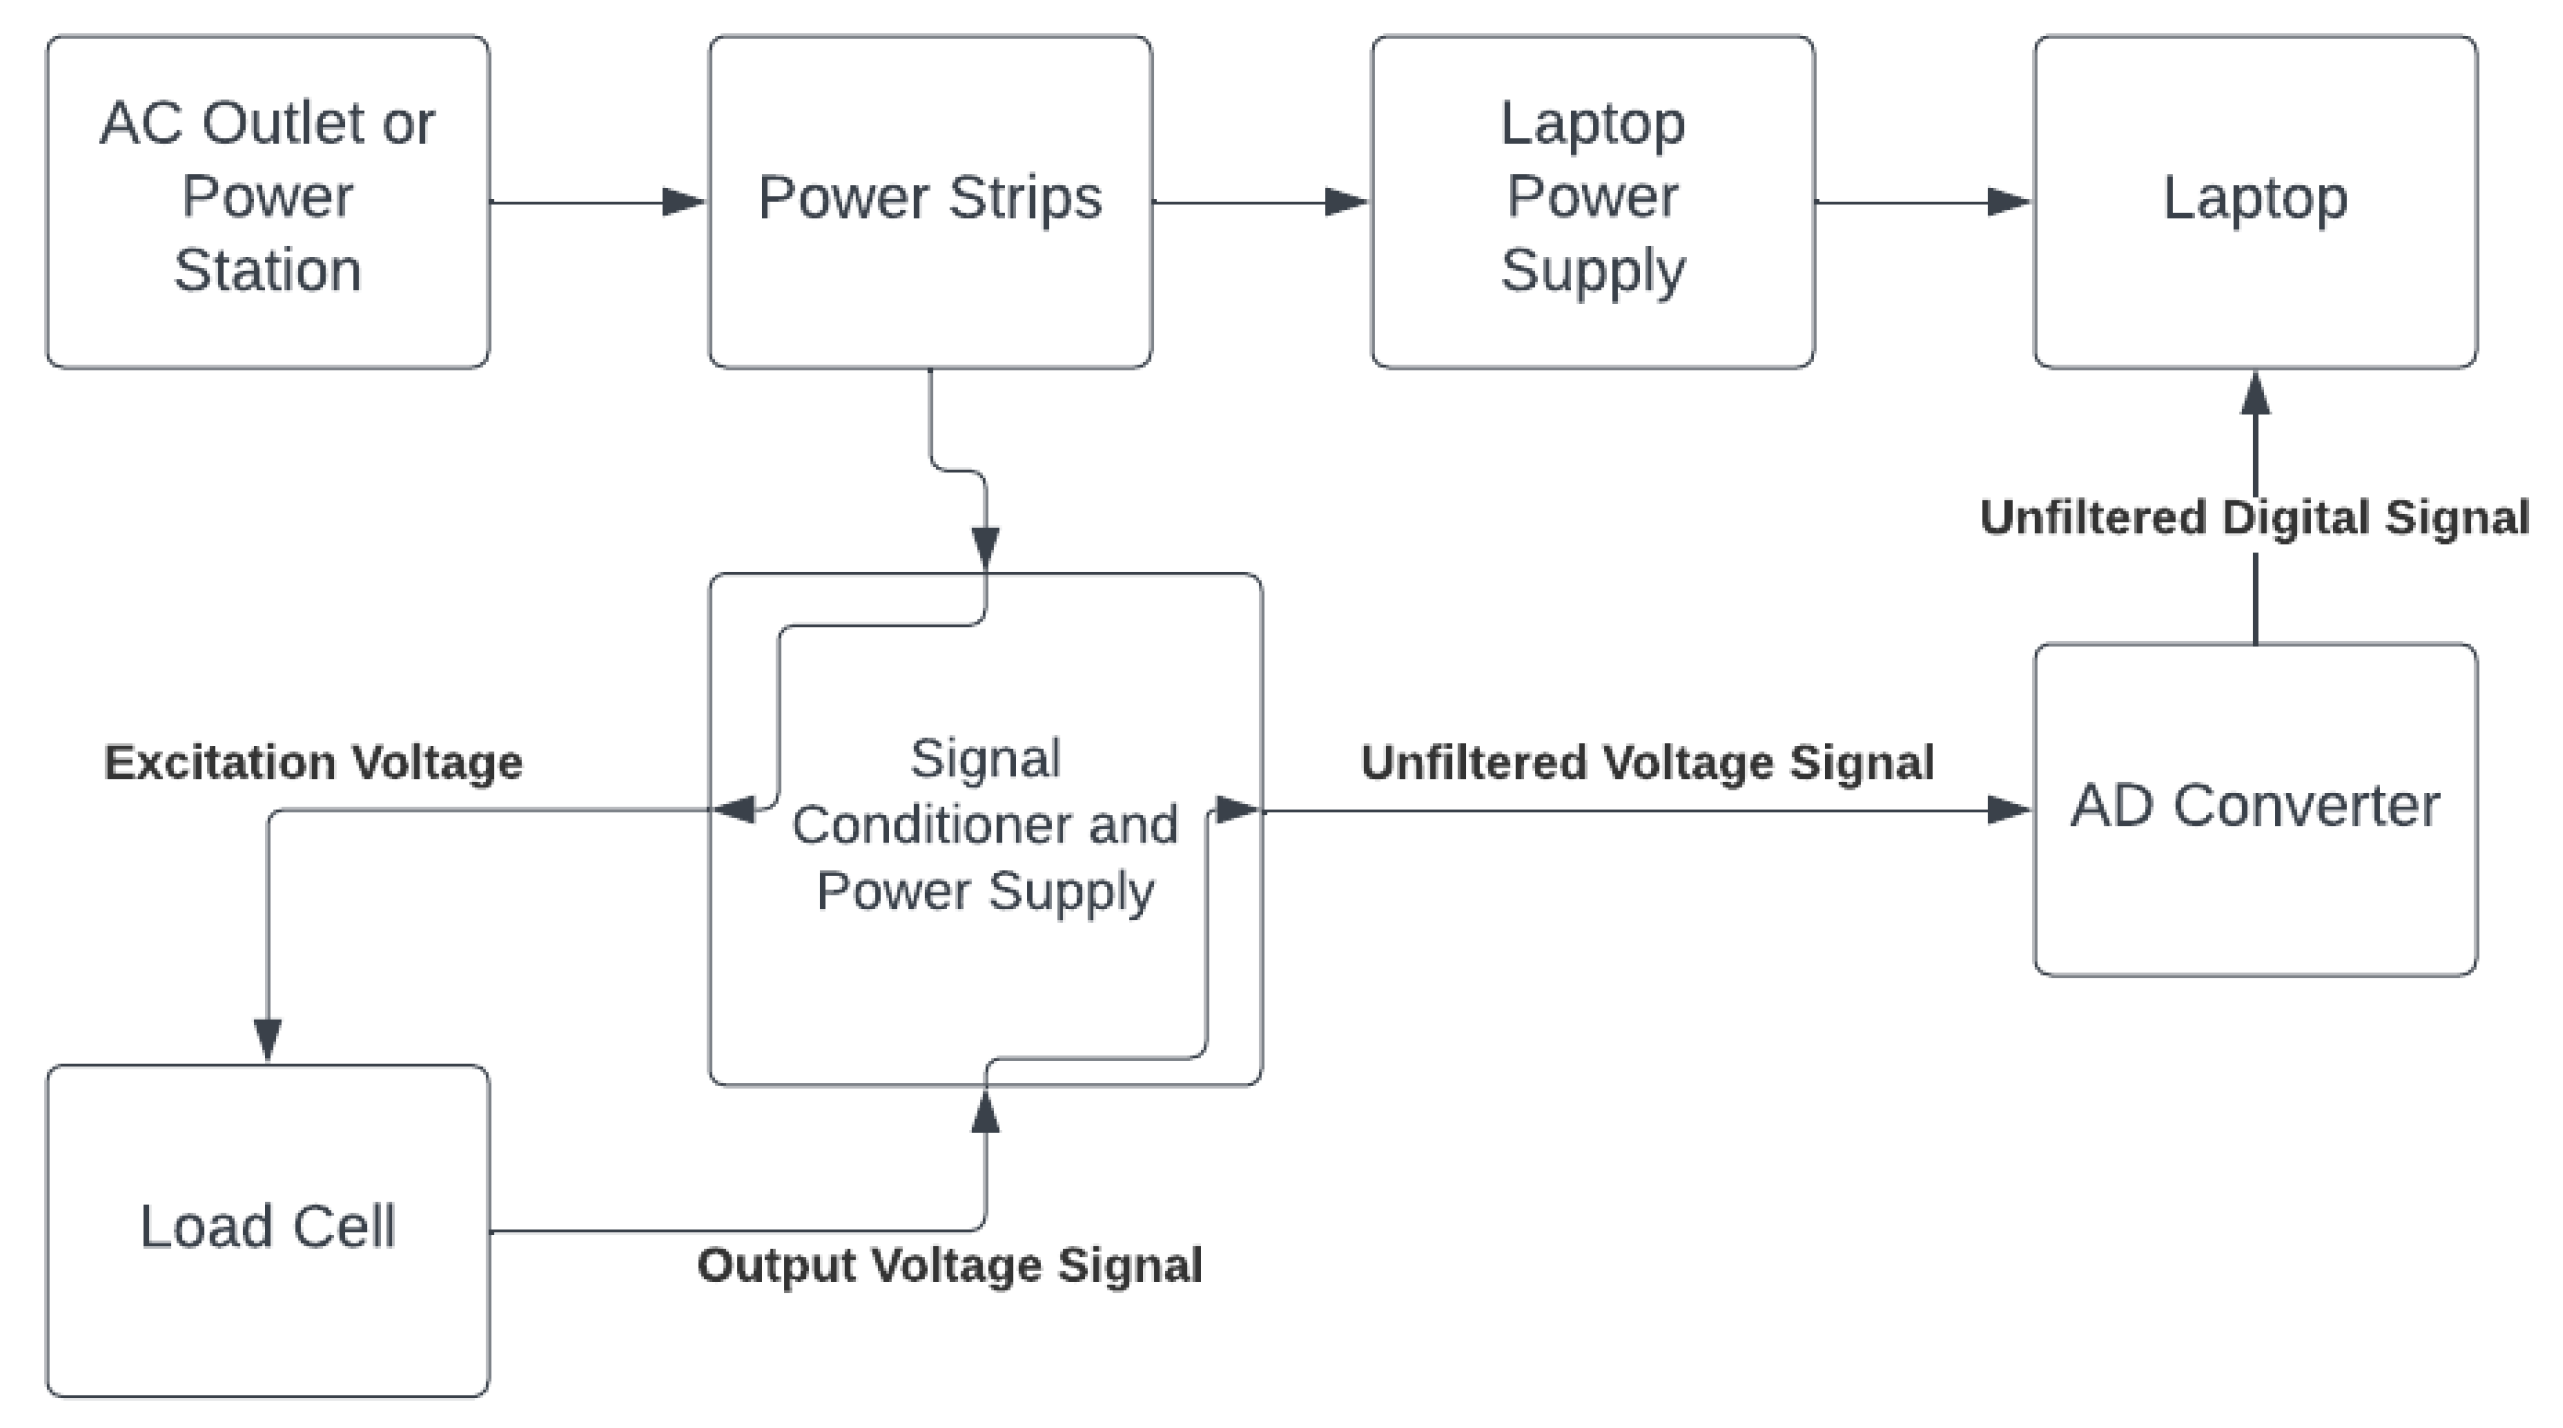
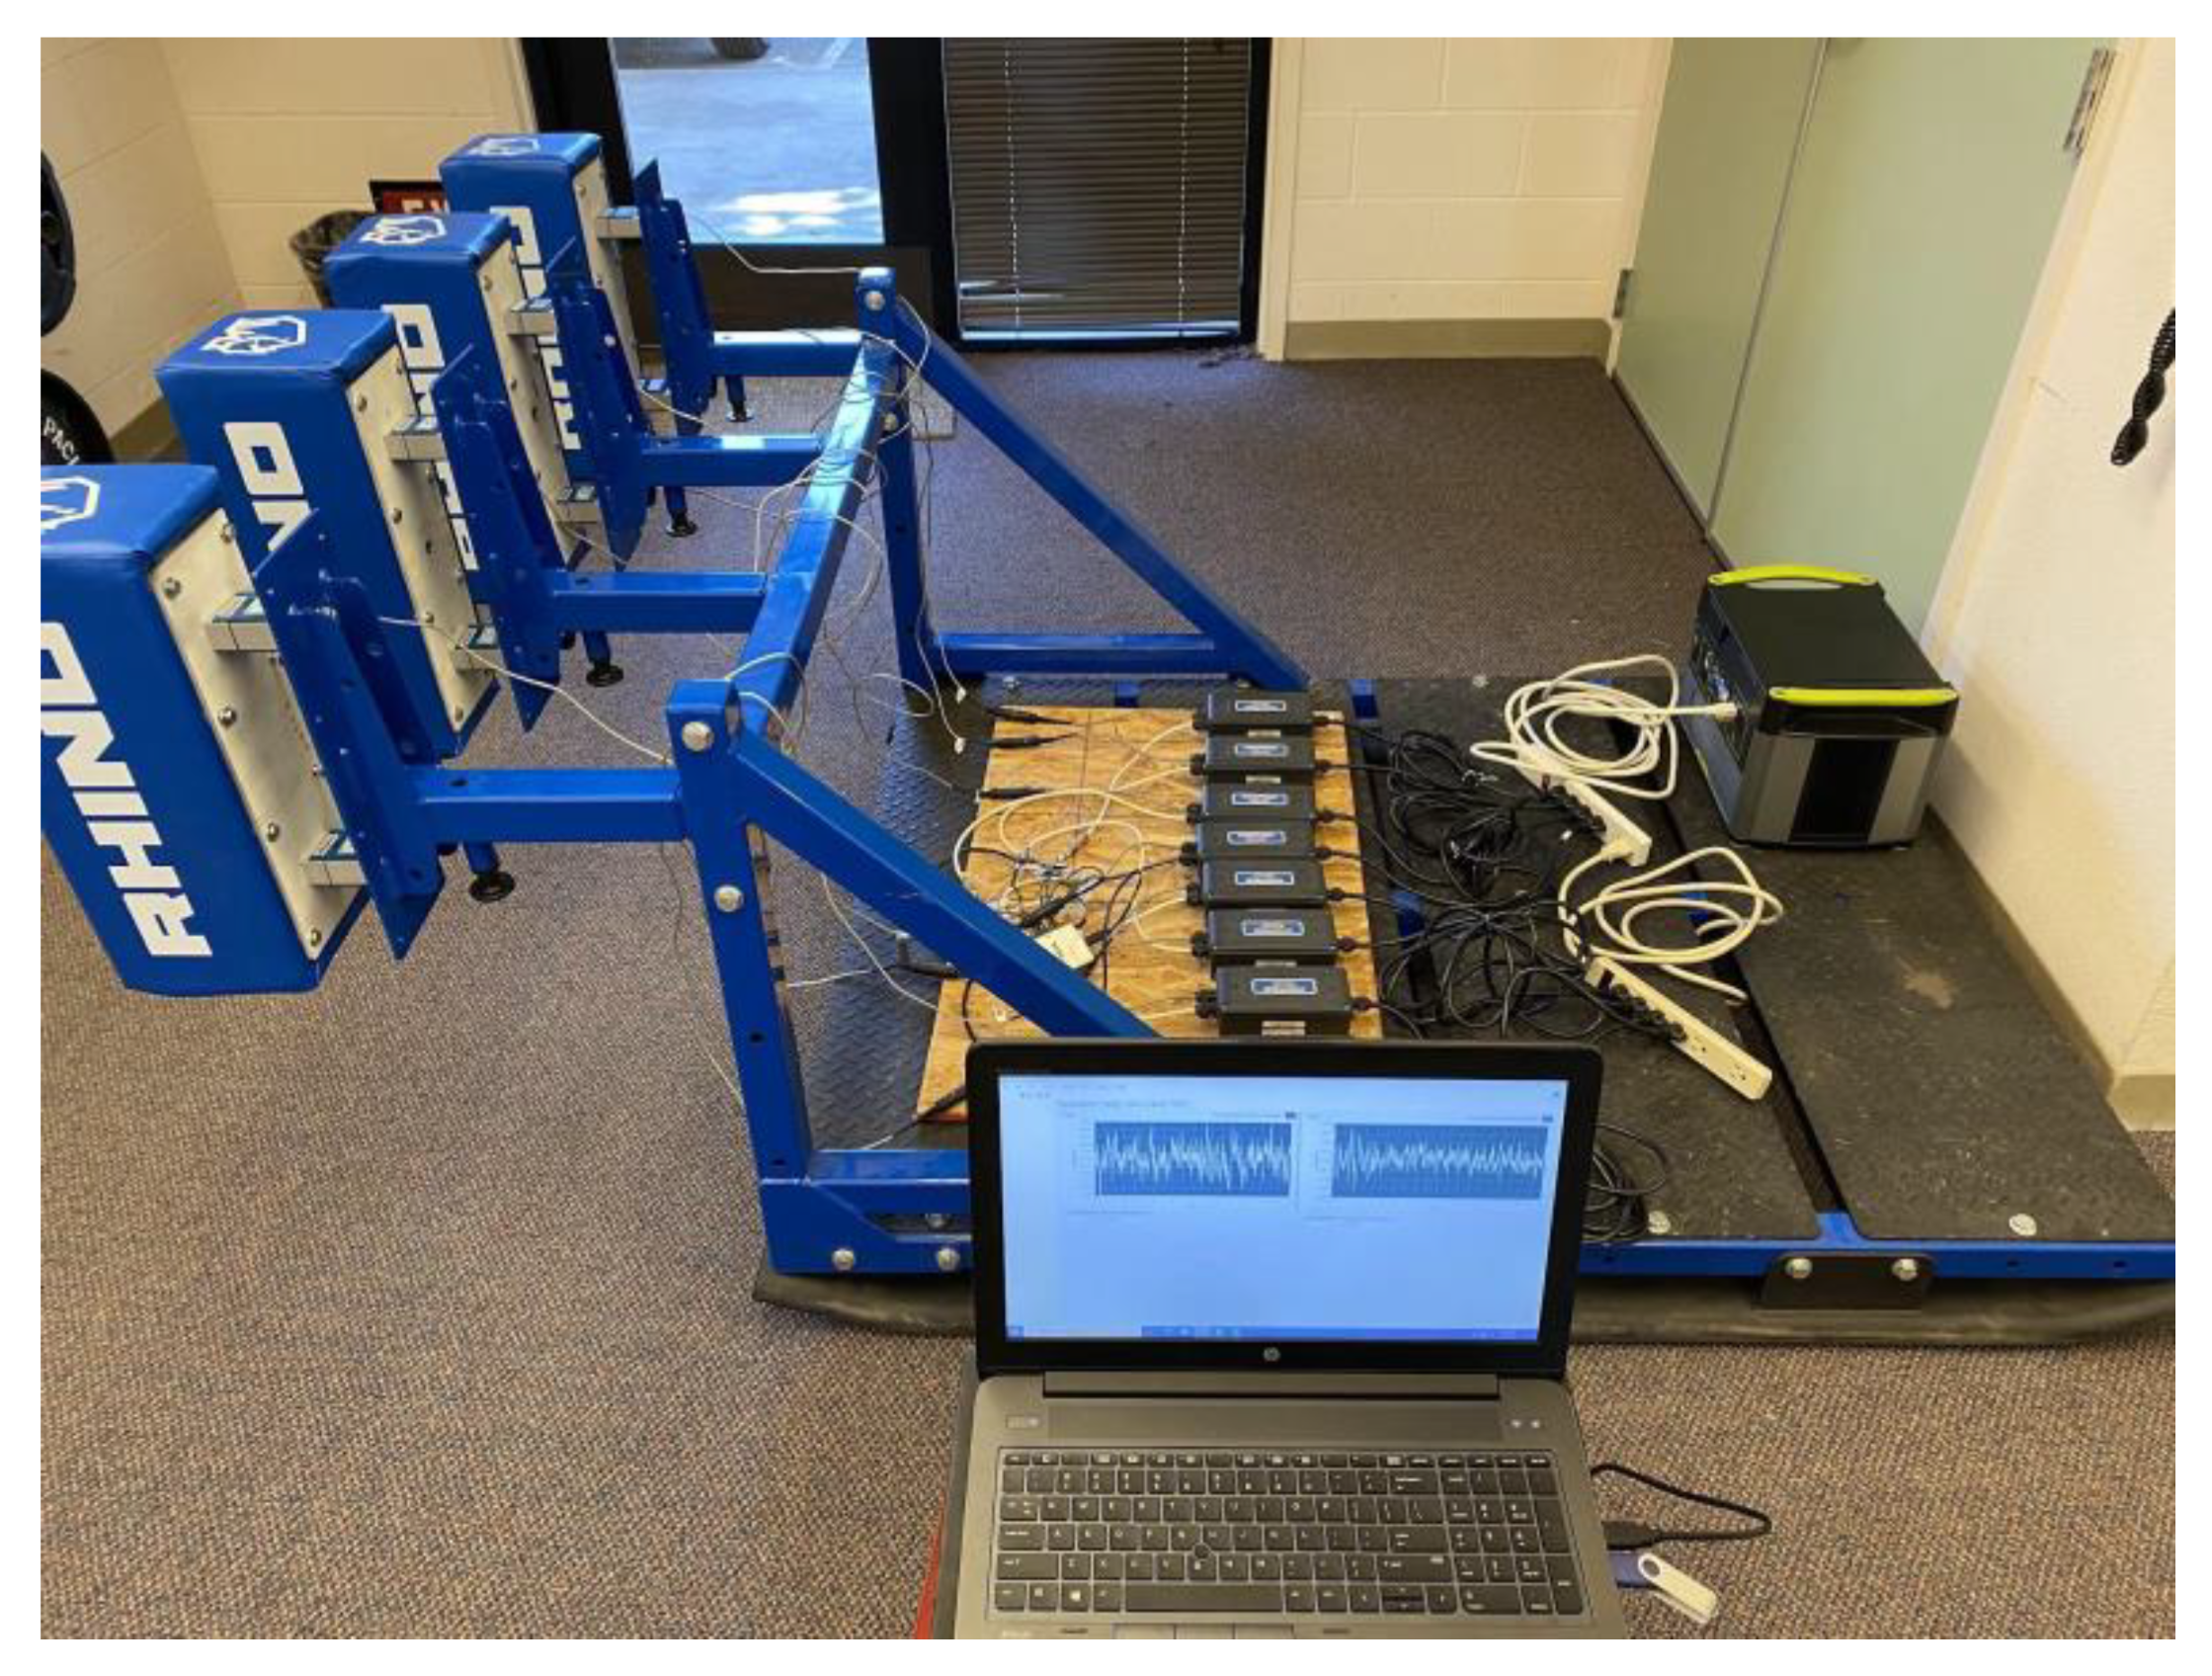
2.1. Instrumenting the Scrum Machine

We purchased a Rhino Raider scrum machine (Legend Fitness, Knoxville, TN, USA). This machine was chosen for its relatively cheap cost, ease of use, and most importantly for instrumentation purposes, its use of a static arm for the pads to mount onto. The static arm ensures that when a player pushes against the pads, the load cells receive all the compression forces; other scrum machines, which have dynamic pad arms that give with variable tension, may better mimic a realistic scrum for training purposes but are not suitable for capturing force data. To instrument the machine, we purchased 8 S-type load cells with 1000 lbf capacity (SM-1000, Interface, Scottsdale, AZ, USA), as well as 8 SGA AC/DC powered signal conditioners (configured for −5 volt at full compressive load; Model SGA, Interface, Scottsdale, AZ, USA) and an analog-to-digital signal converter (hereafter “ADC”; 12 bit ADC; Model USB-6008, National Instruments Corporation, Austin, TX, USA). We contracted a machine shop to manufacture 4 4.67 mm (3/16-inch) steel plates (Figure 1) that replicated the connection of each scrum machine pad arm to the pad, with the addition of 2 extra holes drilled in for the bolts to pass through to connect 2 S-type load cells to each of the pads (Figure 2). An additional 14.29 mm (9/16-inch) hole was drilled into the center of 2 of the steel plates so that it could act as a flat platform for the later calibration of each load cell.

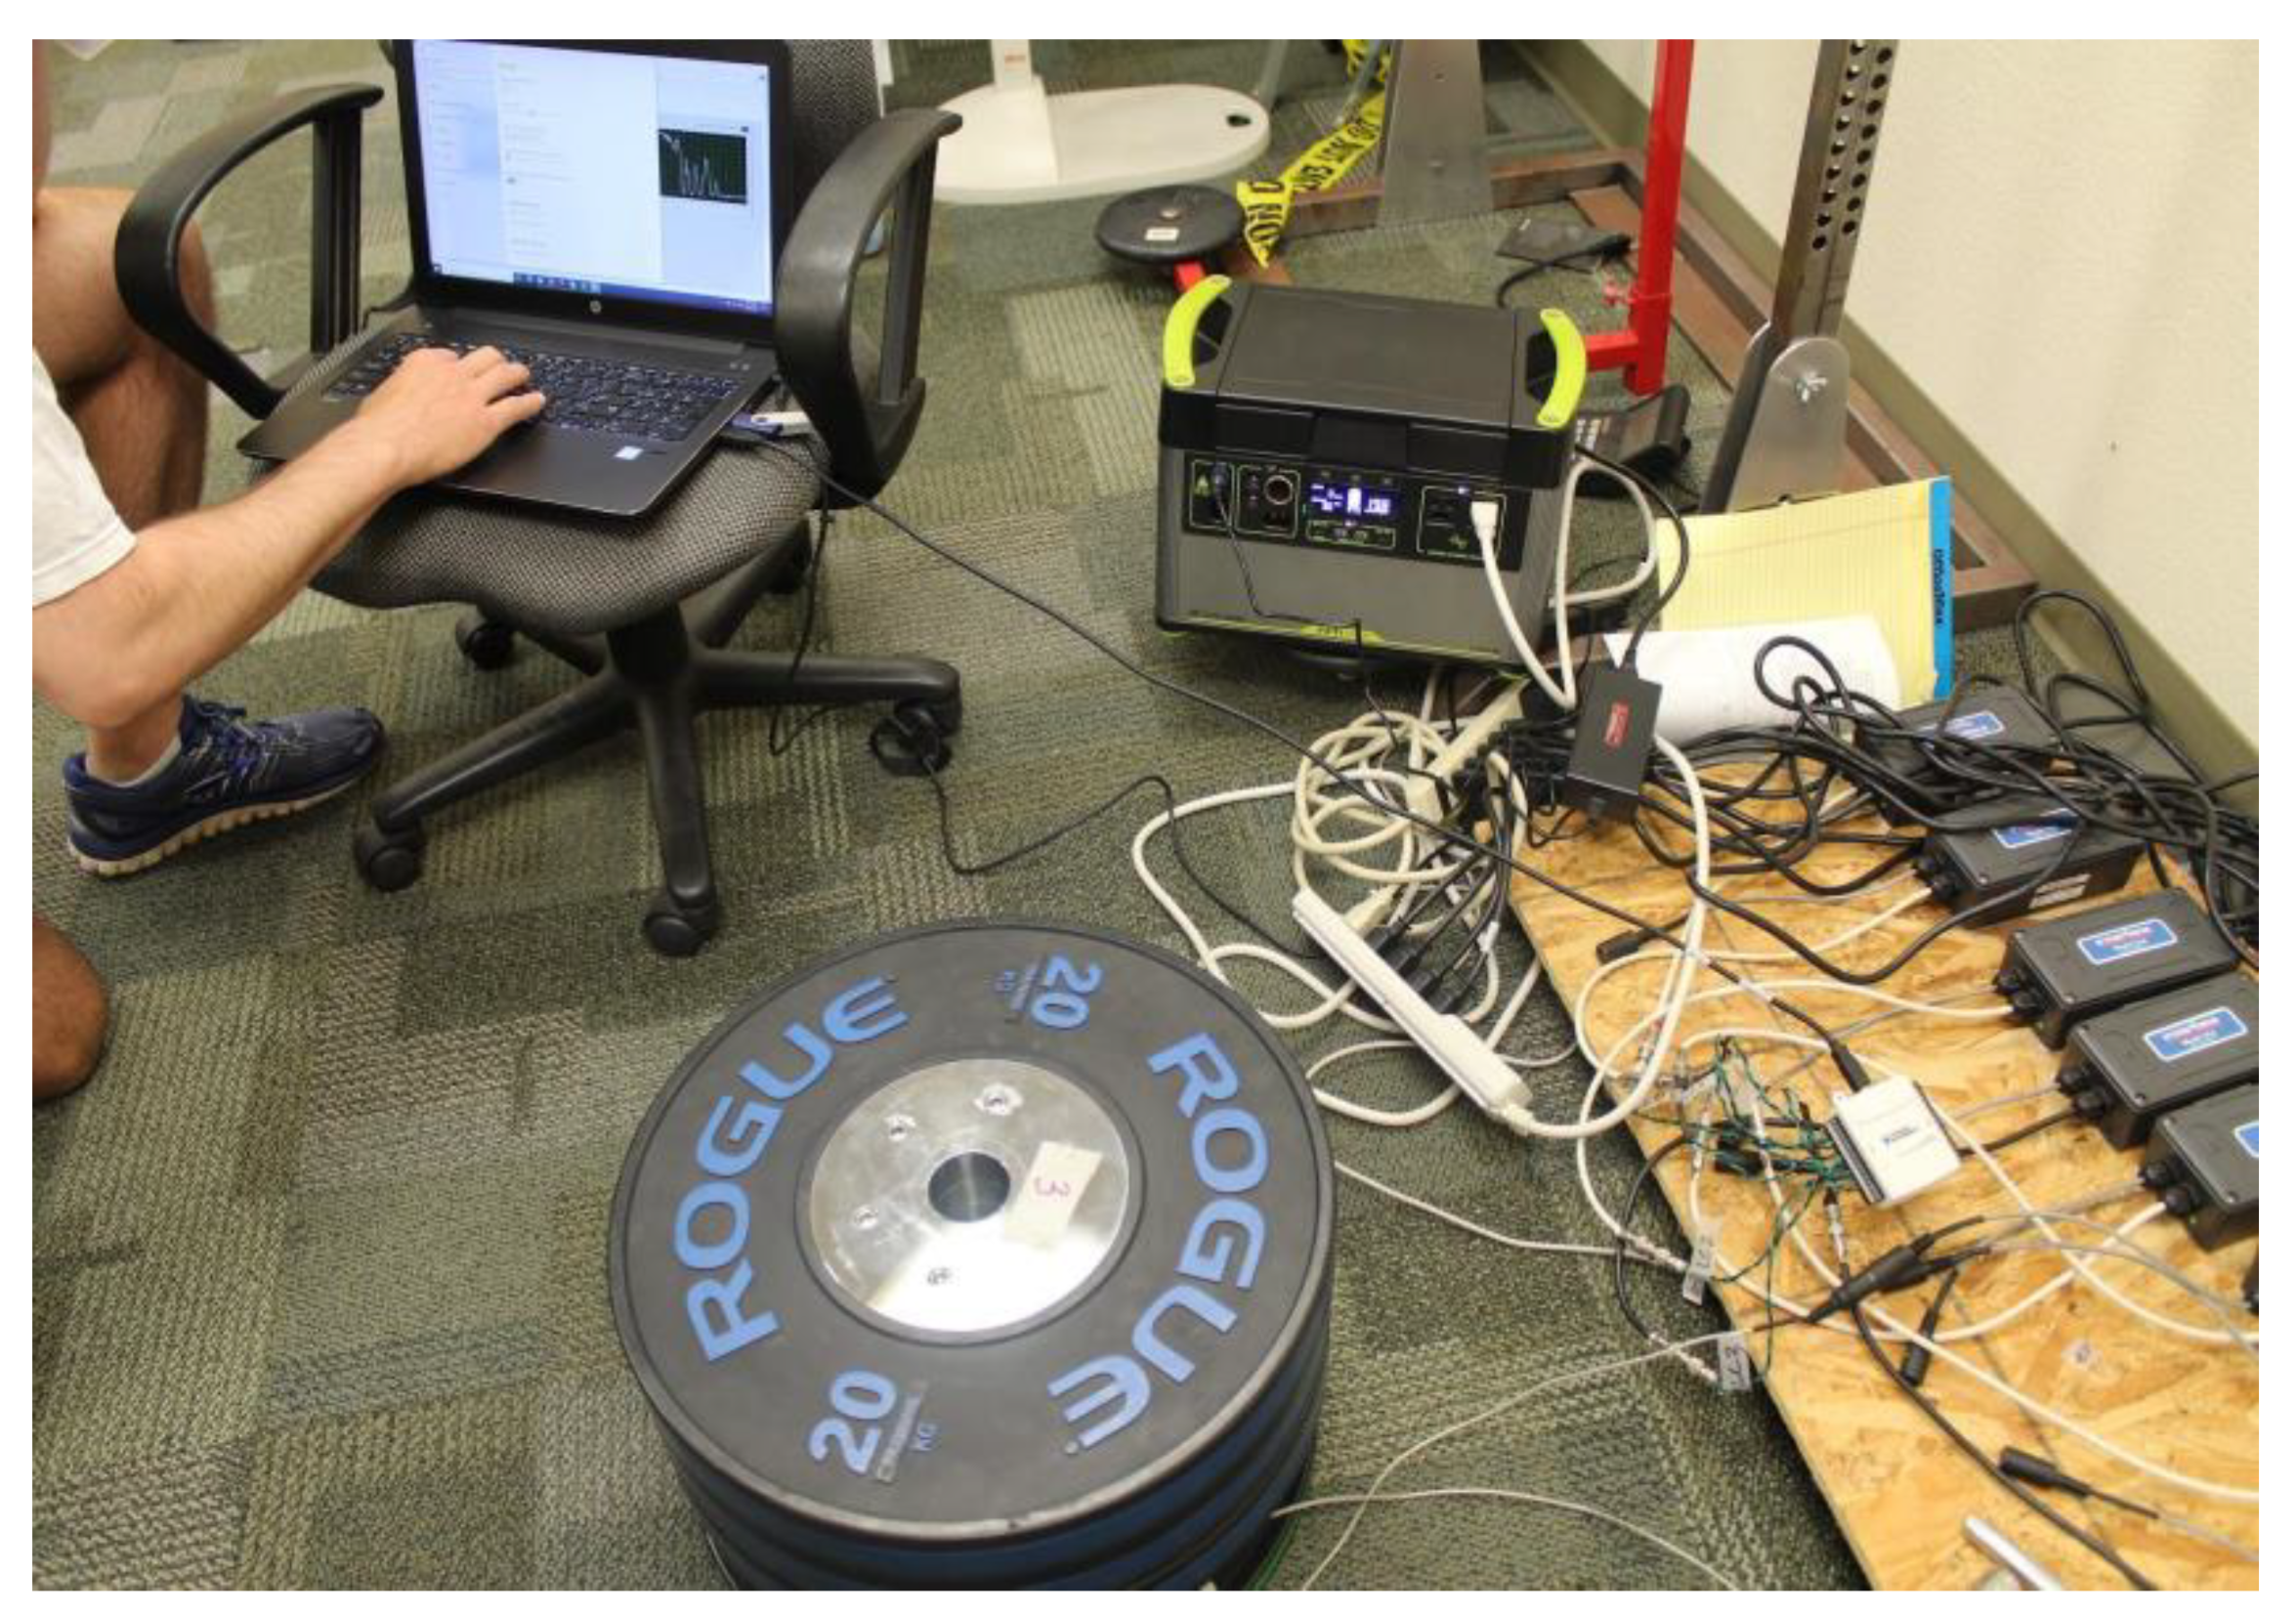
2.2. Deadweight Calibrations

2.2.1. General Calibration Procedures

Digital measurement devices merely output voltage; thus, calibration procedures must be performed to determine the relationship between output voltage and the measure of interest. In this case, the relationship between load applied to a load cell and output voltage was determined using progressively heavier loads that capture at least the range of loads expected in testing (termed “deadweight calibration”). The added loads and output voltages were then used to create a linear calibration equation to convert the measured voltage to force (in newtons (N)) created by the applied load during normal use.
Calibration equations are used under the critical assumption that the load–voltage relationship remains the same from the time of calibration to testing. Changes in the load–voltage relationship create error by decreasing the accuracy with which a previous calibration equation estimates load. Therefore, we used repeated deadweight calibrations under different conditions to detect the influence of these conditions on the load–voltage relationship.
For all calibration procedures, we used 10 weight plates weighing approximately 20 kg each. The weight plates were numbered to ensure that each was loaded in the same order every time deadweight calibration was performed throughout the study. Prior to calibration of the load cell, we weighed each weight plate on a Bertec Jump force plate (Bertec Corporation, Columbus, OH, USA) to determine the exact mass of each weight plate; each weight plate was labeled for future consistent use and its exact mass recorded. This created our independent variable used throughout the calibration phases of external load.
For each S-type load-cell calibration in every phase, we followed these procedures: bolt 1 of the aforementioned steel plates to the bottom and 1 to the top of each load cell (the steel plates used were labeled and used for all calibrations), then place on top of a 10 kg weight plate so that the bottom bolt sit through the hole in the 10 kg weight plate, thus creating a stable and level platform for the deadweight calibrations (Figure 3). Turn all components of the load cell and computer on and let run for the warm-up time specified in each phase of testing (this is described in detail within each phase). After the allotted warm-up time, place each of the 20 kg weight plates on top in turn in order of their number labels. After placement of each weight plate, wait for at least 20 s for the reading to stabilize (software outputted a 20 s running average of instantaneous volts as the average voltage reading, hereafter referred to as the “voltage”), then record the voltage at that load. Repeat until all 10 weight plates are stacked on top (Figure 4). Unfiltered voltage values were obtained using a custom software program [16] written in Labview (National Instruments Corporation, Austin, TX, USA). The final block diagram that represents all the components of our instrumented scrum machine is presented in Figure 5.
During deadweight calibrations, we used a Perception II weather station (Davis Instruments Corporation, Hayward, CA, USA) to measure temperature, humidity, and barometric pressure in the laboratory. In each phase of research, calibrations were performed at the same time of day to increase the probability of similar environmental conditions. All testing was completed under consistent ambient conditions (~21 °C, 55% humidity). Environmental conditions were found to have no influence on the relationship between load and voltage and so are not reported in the manuscript. Analysis of potential sources of error (e.g., measurement of load cell/ADC temperature, analysis of noise frequencies) was not conducted as a part of this study. Our goal was to identify the presence of error, and identification of the error itself could be completed in follow-up work should meaningful error be detected. However, we acknowledge that environmental conditions, especially sun exposure, could influence the validity and reliability of the equipment in field testing and advise monitoring and controlling these conditions as much as possible (for example, by using a tent or other device to keep direct sunlight off the load cells).

2.2.2. Phase 1: Effect of Power Source on Load–Voltage Relationship

To make our instrumented scrum machine viable for use in real-world conditions, we needed to find a way to move it out of the laboratory and onto the rugby field, where AC power sources are often not available. Therefore, we purchased a Yeti 1500X Portable Power Station, a high-capacity lithium-ion battery and inverter unit (henceforth “power station”; Goal Zero, Bluffdale, UT, USA). This power station provides a 120V AC output plug. We were concerned that with the extended run time, as the battery of the power station reduced, the reliability of our load–voltage relationship might be threatened because of factors such as reduction in output voltage with lowered battery charge or increased temperature of the power station and/or other equipment from the extended run time. In addition, each power source may introduce different noise, potentially influencing output voltages. Therefore, in phase 1, we calibrated 2 of our load cells after 15 min, 1 h, and 2 h of warm-up time with all the equipment plugged into the power station, and on a separate day, we repeated the procedure with all the equipment plugged into the wall outlet in our laboratory.
For the statistical analysis of phase 1, multiple linear regression models were used to estimate the influence of power source (power station vs. wall plug) on the load–voltage relationship:
voltage = β0 + β1·load + β2·(load cell) + β3·(power source) + β4·time + β5·(load × power source)
The regression parameter of interest was β5 for testing whether the load–voltage relationship depends on the power source. The regression analysis indicated that the main effect of power source is statistically significant (p = 0.003) but not the load × power source interaction effect (p = 0.085; i.e., the null hypothesis β5 = 0 cannot be rejected at significance level α = 0.05). On average, voltage values from the load cell were about 0.001 volts greater when the power station was used compared to when the wall plug was used. Time did not affect voltage in one tested load cell (i.e., no main effect of time (p = 0.73) or load × time interaction effect (p = 0.75)). In the second load cell, there was a significant load × time interaction effect (p = 0.0079). Despite the statistical significance, at ~200 kg (i.e., the maximum tested load), each minute of additional warm-up time after 15 min and up to 2 h changed the measured voltage by about −50 µV on average; this translates to approximately 0.04 N. This magnitude of difference is largely meaningless considering the size of the expected loads during scrum trials and the resolution of our AD converter and load-cell combination (smallest step ~1.2 mV or ~1.09 N).
Overall, this first phase indicated that while the power station may produce significantly different voltage outputs than the wall outlet (albeit negligible in practical magnitude), the load–voltage relationship was just as stable when using the power station as when using the wall outlet. Therefore, we concluded that the power station was suitable and reliable for use in future phases of the calibration as well as in human application. Additionally, this first phase indicated potential changes in the load–voltage relationship across warm-up times, though this difference was only seen in one of the two load cells and had a minimal magnitude. Therefore, it informed us that we would need to conduct more extensive testing of reliability across warm-up times in all our load cells, which led to the next phase of our calibration testing.

2.2.3. Phase 2: Effect of Extended Warm-Up Time on Load–Voltage Relationship

The second phase had two interrelated purposes: to determine how long we needed to warm up the load cells to achieve steady, reliable load–voltage relationships and if the load–voltage relationship would change after extended run time, as may happen in a long day of field data collection with one or more forward packs. Using the power station as the only power source, we calibrated each load cell after 15 min, 30 min, 45 min, 60 min, and 7 h of continuous run time.
For the statistical analysis of phase 2, linear regression models were used to examine the effects and interactions of time and individual load-cell differences on the load–voltage relationship. We started with the simple linear regression (disregarding the run time and individual load cells), voltage = β0 + β1 load, and then we considered both time and individual running cells using multiple linear regression to determine if these factors significantly impacted the load–voltage relationship.
The simple linear regression, voltage = β0 + β1 load, explains 98.86% of the variance in voltage. When both time and individual running cells were included in multiple linear regression, we could explain nearly all the variance in voltage (R2 = 0.9999867). Our final multiple linear regression model indicated a significant effect of individual load cells on the load–voltage relationship, creating two groupings: six of the load cells had very similar load–voltage relationships, and another pair had very similar load–voltage relationships (Figure 6). Additionally, 4 of the load cells exhibited no significant effect of time on their load–voltage relationship, indicating that after at least 15 min of run time, the load cells produce stable reliable load–voltage relationships, and this relationship does not change even with 7 h of run time. However, 2 load cells exhibited a significant difference in load–voltage relationship between the 15 min calibration and all other calibrations (p = 0.014 and 0.036, respectively), with no differences between the 30 min calibration and other calibrations; this indicates that after at least 30 min of run time, those 2 load cells produce a stable reliable load–voltage relationship which does not change with 7 h of run time. Similarly, 1 load cell showed significant differences until 60 min, and 1 load cell showed significant differences at all time points. However, the magnitude of difference in mean volts between any time points with any load cell was so small (the largest difference was 2.2 mV) as to be negligible in a practical sense. A difference of 2.2 mV indicates a difference of about 19 N; in the context of scrum packs producing forces ranging from 8000–16,000 N, 19 N is below the detectable variance, even when compounded across all 8 load cells. Even for individual player scrum trials, where the force magnitudes are lower (e.g., group average peak force of individuals in phase 3 was ~2096 N) and where this difference between device warm-up times represents a larger proportion of the measured forces, it is not a meaningful amount, particularly between longer warm-up times (e.g., 30 min versus 7 h). Warming up all load cells for at least 30 min should greatly minimize what is already a relatively small drift over time.
Considering the results of phase 2, we concluded that the load cells demonstrate acceptable reliability for later application of measuring forces generated by scrum packs. We determined that we would use 30 min of warm-up time as our standard operating procedure moving forward and that we could collect data continuously for up to 7 h without threat to the reliability of our results. In the next phase, we shifted from testing intra-session to between-session reliability.

2.2.4. Phase 3: Day-to-Day Reliability

The third phase tested inter-session reliability, with the goal of determining how often we would need to recalibrate the load cells during human data collection. We calibrated every load cell 1 day, 1 week, and 6 months apart. For all these calibration sessions, we used the power station and calibrated the load cells after 30 min of warm-up time.
For the statistical analysis of phase 3 (assessing between-session reliability), we used Bland–Altman analysis [17,18] for limits of agreement (LOA) as well as calculated an intraclass correlation coefficient (ICC). For the Bland–Altman analysis, we matched observed volts by load and individual load cells and paired days (days 0, 1, 7, and 180). A random-effects model was used to estimate the ICC. Using this model, we also estimated the percentage of variation in voltage explained by the load, individual load cells, and day (session). For this analysis, the performance package in statistical software R was applied [19,20].
According to the random-effects model, the resulting ICC is 0.998, and the model estimated that about 98.86% of the variation in voltage was due to the load, 0.98% due to the individual load cells, and 0% due to the day (session), and about 0.15% was unexplained.
For any paired days, there is no statistically significant difference in the average volt (i.e., no systematic bias, on average). The 95% LOA indicates that about 95% of the differences would be between −0.022 and 0.017 volts (days 1 vs. 0), and 95% LOAs for other paired days were shorter (Figure 7 and Table 1). There was a tendency that the absolute difference in volts was larger when the load was heavier, and among all day-to-day comparisons, the biggest absolute difference, observed between days 1 and 0, was 0.0546 volts, which was observed at load ~200 kg. Therefore, we conclude that the load cells have excellent inter-session reliability (practically negligible differences between days). In practical terms, these results indicate that our calibrations will hold steady for at least 6 months before we need to recalibrate all our equipment.
Phase 3 was the final phase of deadweight calibrations and reliability testing; in our last phase, we report on inter-trial reliability when human subjects pushed on the scrum machine.

2.3. Phase 4: Live Trials

In phase 4, we assessed the inter-trial reliability of humans performing individual scrums on our assembled instrumented scrum machine (Figure 8). This phase involving human subjects was conducted in accordance with the Declaration of Helsinki and approved by the Institutional Review Board (Committee for the Protection of Human Subjects) of California State University Monterey Bay (IRB protocol number 18-104). All participants signed informed consent prior to participation.

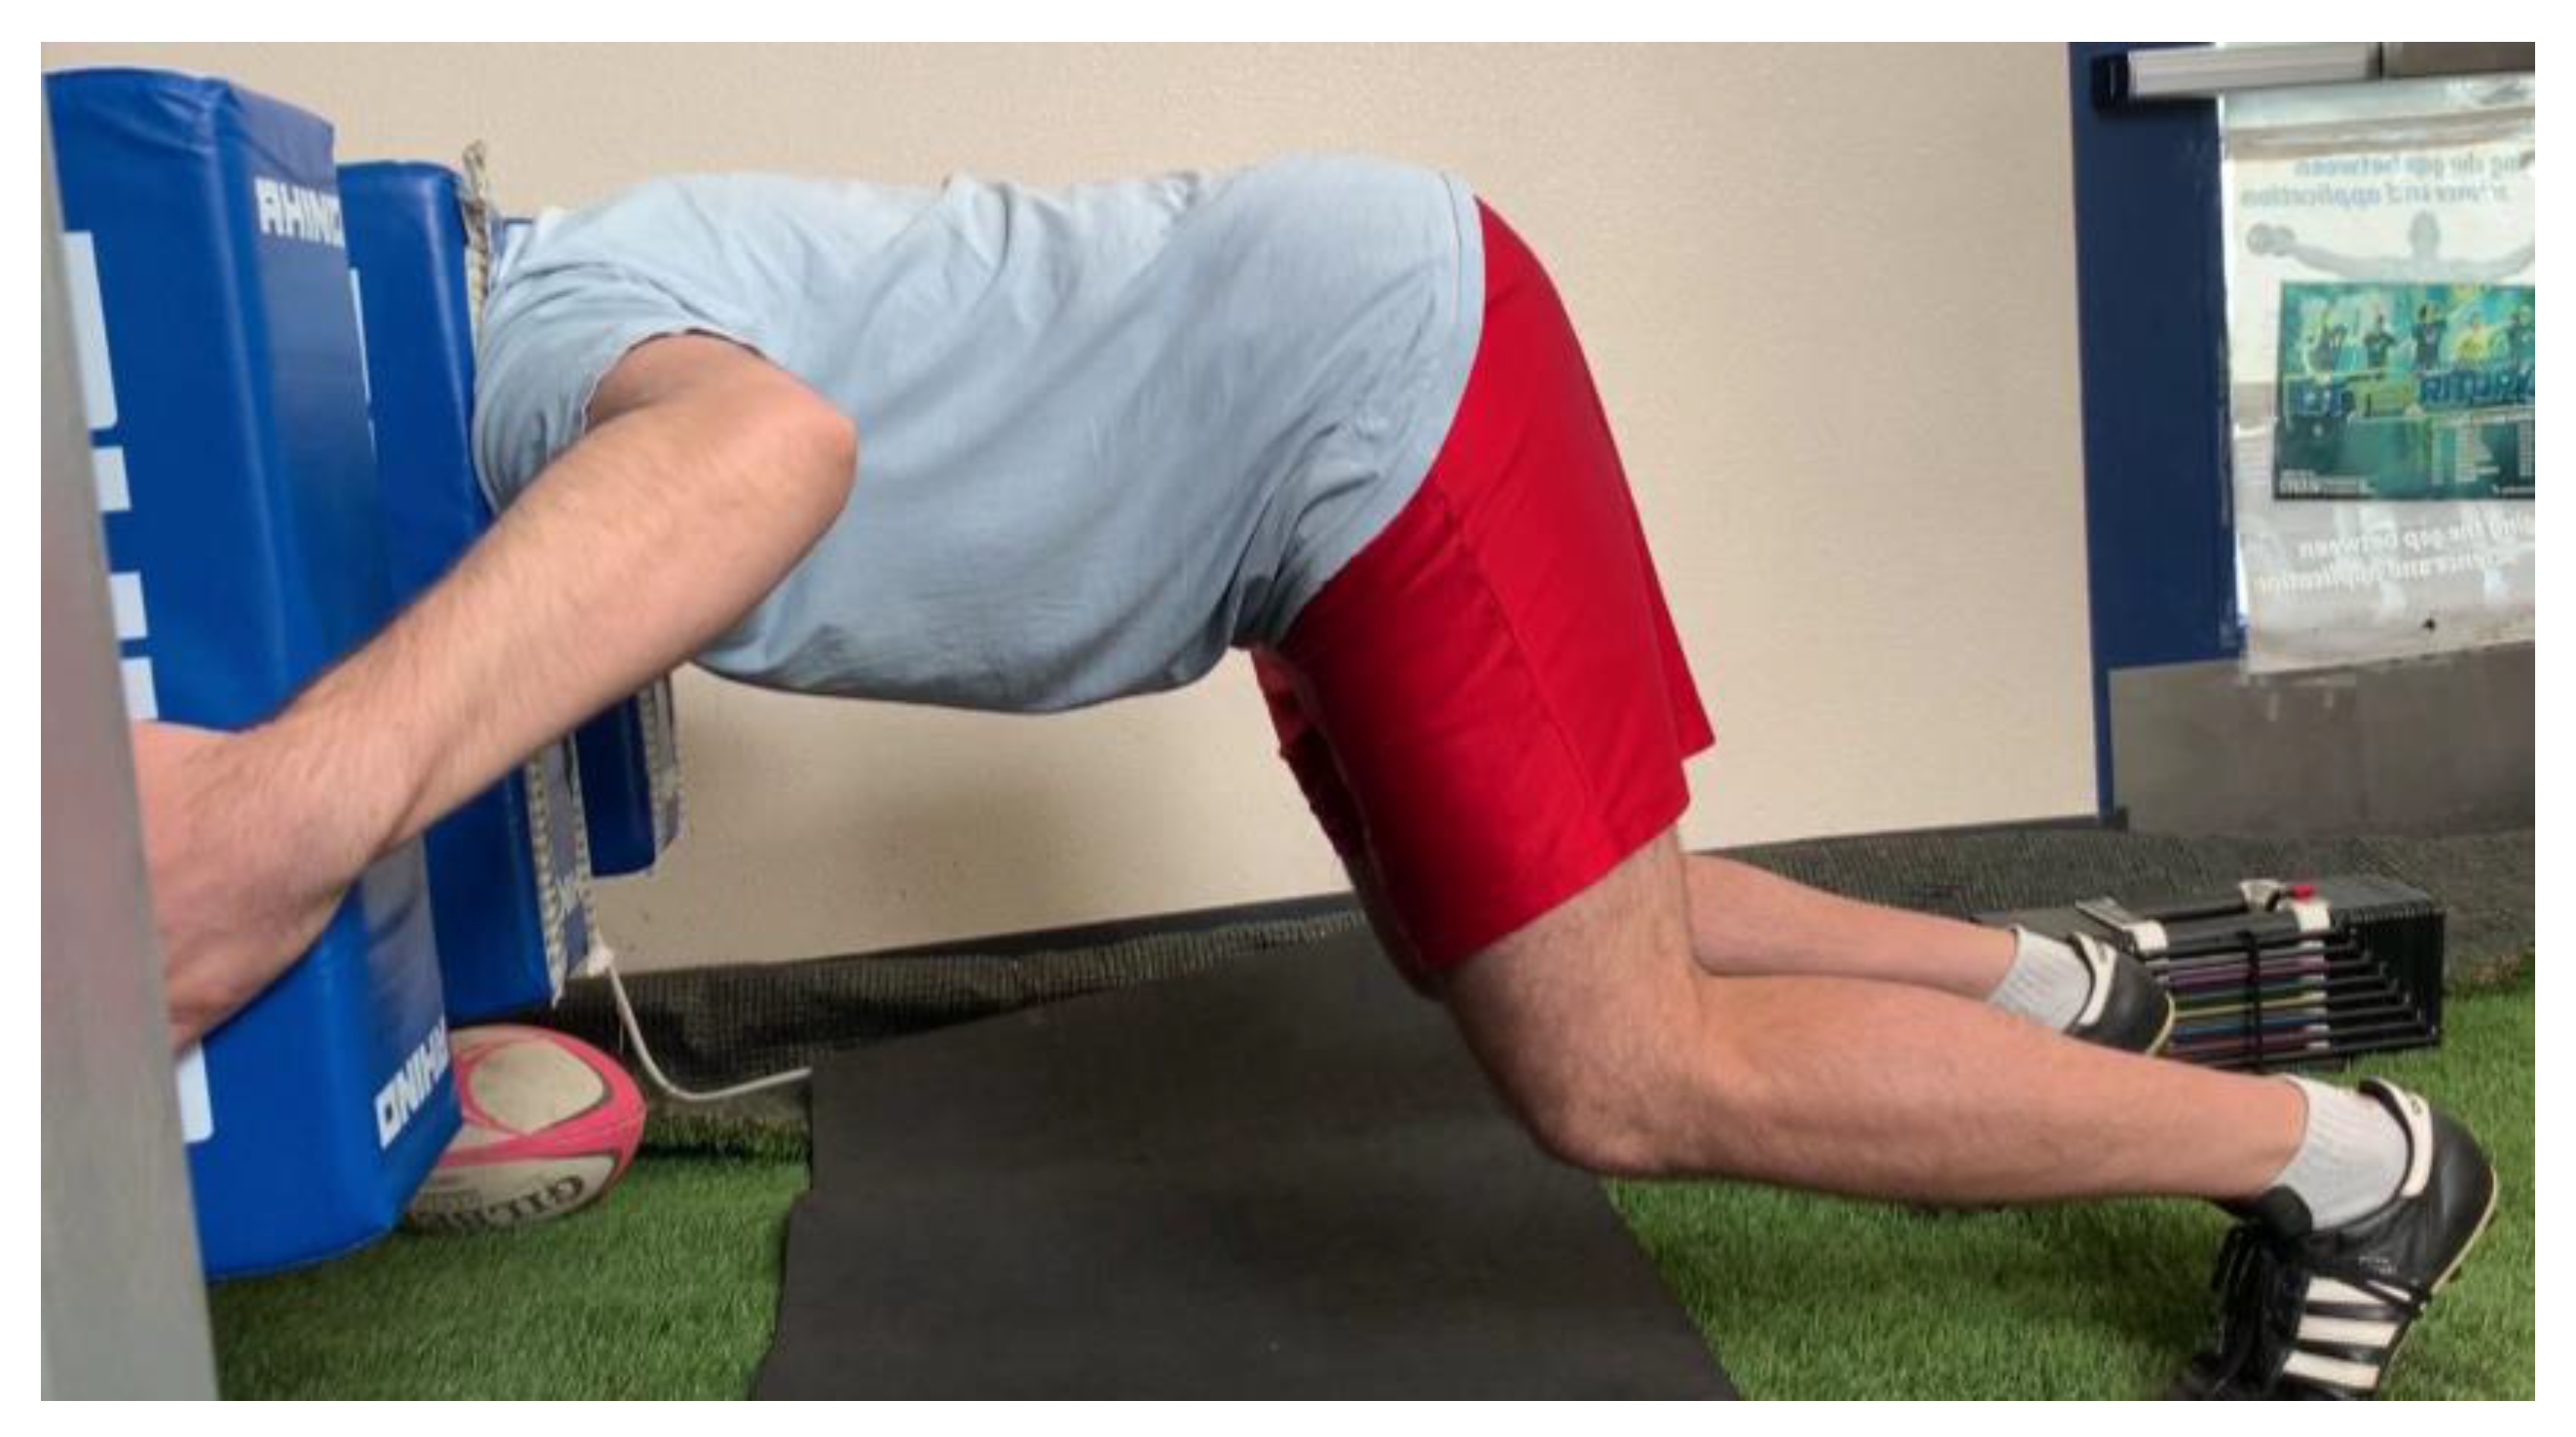
2.3.1. Individual Scrum Test Procedures

Participants were recruited from college and amateur men’s and women’s rugby clubs. The inclusion criteria were that athletes had to have played rugby for at least 3 months and performed structured resistance training for at least 3 months to help ensure general familiarity with the positions and actions required to perform the tests. Participants were excluded if they had suffered any upper- or lower-body injury that could have affected their performance on either test. Both backs and forwards were included, as the position of an individual scrum represents the same idealized body position all players would want to achieve during a ruck, maul, or tackle.
We marked the 2 pads that were used throughout the experiment with lines to indicate heights from the floor (the bottom of the pad started at 42 cm from the floor and the top of the pad ended at 89 cm from the floor). The scrum machine was set on top of a section of artificial turf we purchased, and the back edge was placed against the wall so that it could not move. We loaded over 250 kg in weight plates near the front of the sled and had research assistants stand on the sled to keep the sled from tilting up while the participants pushed. Because of the less-than-ideal traction of the artificial turf at maximal exertion, we slid a wood 2 × 4 under the turf to provide foot support for the participants’ cleats. A pair of 45.45 kg dumbbells were set behind the 2 × 4, over the turf, to hold it in place and keep it from sliding back.
Assessments were conducted through the off- and pre-season, but not during the competitive season, to reduce the interference due to fatigue on the athletes during testing. All assessments were conducted in a single session. Athletes reported to the Exercise Physiology lab with their cleats and the shoes they normally perform resistance training in. After providing informed consent and pre-assessment screening for injuries and experience, athletes had their height measured barefoot using a Seca 213 stadiometer (Seca, Chino, CA, USA). Next, body mass was measured using a Tanita BF-350 Total Body Composition Analyzer (Tanita Corporation, Tokyo, Japan). Then, the athletes put their cleats on and had their height measured in cleats for use in setting their scrum position. We calculated 40% of their height in cleats and marked the pads of the scrum machine at this height [21]. Athletes were positioned so their shoulders were aligned at this height marking. They then assumed a scrum position with their feet placed far enough back so that their knees were at a 120 ± 5-degree angle (confirmed by a goniometer) while keeping their spine visually parallel to the floor. This angle was chosen because it represents the body position for maximal force production in an individual scrum [21] and minimizes the forces that would be generated vertically against the pads (only forces aligned with the load-cell axis can be measured). To establish this position, the 2 × 4 underneath the turf was slid into place and secured with the pair of dumbbells. Athletes reassumed their position with the 2 × 4 setting their foot placement, and we used a goniometer to verify their knee angle (Figure 9).
Once all setup was complete, athletes underwent a standard warm-up. Over 10 m, athletes jogged, backpedaled, ran at 75% perceived effort, backpedaled, and performed high knees, walking lunges as a stretch, butt kickers, a walking hamstring stretch, side shuffle left, side shuffle right, walking side lunges as a stretch, and a walking glute stretch. After the general warm-up, athletes started the scrum-specific warm-up.
Athletes resumed their set position on the scrum machine. They were asked to place their hands on the outside pads (similar to binding onto other players in the scrum) and to not push or pull with their arms. They were instructed to push straight forward without recoiling or trying to push up (as some props do to try to lift the other prop) on the pads. Athletes performed 2 warm-up scrums at 50% of their perceived maximum effort, then 2 75%-effort trials, with 1 min of rest between warm-up trials. During the 2 75%-effort trials, knee and hip angles were verified. After 2 min of rest, participants performed 5 100%-effort trials. Five trials were chosen, as previous research indicates that athletes might encounter a fatigue effect after three to four repeated scrums [11,22], so we wanted to make sure to capture this possibility within our procedures. Participants were instructed to push as hard and as fast as they could. During these trials, they were provided vigorous verbal encouragement [23] and given 2 min of seated rest between trials. All warm-up and testing trials lasted 6 s. Once athletes were in position, they were counted in with a cadence of “3, 2, 1, push!”.

2.3.2. Data Processing and Statistical Analysis

Each pad had two load cells bolted to it, and each participant pushed on two pads (one for each shoulder), therefore four load cells were used in all trials. Voltages from each load cell were recorded using a custom Labview (National Instruments Corporation, Austin, TX, USA) program [16]; the voltage from each of the four load cells were summed in the data acquisition program to create a total voltage value. For each trial, we identified the peak voltage and the average voltage during the push as our dependent variables. The initiation and cessation of the push were determined visually; manual identification has been shown to be reliable in other multi-joint isometric tests [24].
Descriptive statistics were generated for participants’ age, sex, height, and body mass. For our dependent variables, peak voltage and average voltage, we used multiple methods to assess inter-trial reliability using a spreadsheet developed by Hopkins [25], which calculates Intraclass Correlation Coefficients (3,1), and examined the change in the means between trials. Following the recommendations, we report both the raw reliability statistics as well as the log-transformed outcomes in the next section.

2.3.3. Human Trial Results

Eight male and seven female athletes signed informed consent and participated in the research. One male’s data was removed from the dataset because of his inability to maintain a straight back and his consistent pushing up, which was against the instructions for the research and despite corrective feedback from the researchers. Additionally, four individual trials between three different individuals were removed as being invalid because of their not maintaining technique. On average, the 14 remaining participants were 20.9 ± 1.2 years old, stood 170.4 ± 8.2 cm, and weighed 81.9 ± 15.7 kg; they had played rugby for 2.1 ± 1.0 years and had an average of 5.9 ± 1.3 years of resistance training experience.
Peak voltage rose from a mean of 2.1 ± 0.6 volts in both trials 1 (n = 11) and 2 (n = 14) to 2.2 ± 0.7 volts in trials 3 and 4 (n = 14 for both) to 2.4 ± 0.9 volts in trial 5 (n = 13). The reliability analysis results for peak voltage are reported in Table 2. All analyses indicate a near-perfect reliability between trials for peak voltage.
Average voltage rose from a mean of 1.8 ± 0.6 volts in trial 1 and 1.8 ± 0.5 volts in both trials 2 and 3 to 1.9 ± 0.6 volts in trial 4 and 2.1 ± 0.7 volts in trial 5. The reliability analysis results for average voltage are reported in Table 3. All analyses indicate near-perfect reliability between trials.

3. Discussion

Overall, the results of all phases of the study support the reliability of our instrumented scrum machine. Deadweight calibrations revealed near-perfect reliability between sessions up to 6 months apart and indicated that most load cells were nearly perfectly reliable regardless of warm-up time beyond the initial 15 min. Statistically significant differences were found between load cells, with two load cells seeming to act similarly together and the other cells seeming to act similarly together. However, this is more an artifact of being overpowered in the statistical analysis (a wide range of tested loads during deadweight calibrations, with identical loads used in every calibration procedure, combined with a very small unexplained random error); the load cells are so highly sensitive (~1% of the total variation in volts), and each cell seemed to be reliable within itself, such that we were able to detect a difference (of about 0.18 N, or 0.018 kg) of a practically negligible magnitude. Even if this maximum error was compounded across all eight load cells, compared against just the combined baseline mass of a pack of forward players leaning on the scrum machine in preparation for pushing, the magnitude of the variance between and within load cells is negligible. However, to account for individual-cell differences in load cells that showed some variance, we conservatively decided on a 30 min warm-up period as sufficient for the whole machine during use in human trials.
Among the human participants, we were surprised to not find evidence of a learning effect in the first two to three maximal-effort trials. It is possible that in the four warm-up trials given, the participants had sufficiently familiarized themselves with the machine. The participants in this study had to have played rugby for at least 3 months, and on average most had played 2 years, so between their general familiarity with the scrum position and pushing in a horizontal contact position as well as having performed the warm-up trials, any learning effect may have been minimal and/or not captured in the 100%-effort trials for data collection. We also did not detect any fatigue effect after five trials. Following a systematic review of the literature, we found that taking at least 1 min of rest would provide enough recovery to avoid fatigue across 5 trials [3]; thus, by giving the participants 2 min of rest, we may have avoided causing fatigue that would limit peak or average performance during individual scrummaging.
Only one other study has reported on the calibration of a scrum ergometer [26]. Similarly to our study, that study used S-type load cells. However, Green and colleagues [26] constructed a frame that provided a square pad that the players put their heads through the middle of. Green and colleagues then placed one S-type load cell behind each corner of the square pad. Their design of their ergometer apparatus only allows for one player to be tested at a time, rather than the full team, as our design ultimately allows. In their deadweight calibration procedures, Green et al. [26] also found a 99.99% reliability in the load–voltage relationship. However, Green et al. [26] only provided two trials of human participants and did not report inter-trial reliability. Comparing our results against studies focused on fatigue during repeated scrum trials, we saw no evidence of fatigue across the five trials, whereas other studies found that players fatigued after three repetitions [11,22]. However, most of the prior studies used only 15–40 s of rest between trials. One study performed pilot testing among international-level French players and found good reliability (ICC = 0.8) across 3 trials separated by 6 min rest [11]. Therefore, we can conclude that when 2 or more minutes of rest is given between trials, peak and average performance will remain reliable for 3 to 5 trials, whereas with 40 s or less of rest, reliability could decrease after 2 or 3 trials as a result of fatigue. What has not yet been demonstrated in any research is the reliability of full-pack scrummaging. Furthermore, research needs to determine reliability for different playing levels—it seems logical that more advanced players may have better reliability than novice and younger players.
The strengths of this research include having multiple phases of testing, with the results of each stage directly informing the design and research questions of the next phase. Additionally, a strength was including both male and female rugby players in the human trials to make the results more generalizable across the sexes. There are three primary limitations to this set of studies. The first is the direction of loading in the deadweight calibration; load cells were calibrated with their compression axis pointed vertically in order to set the weight plates on top. However, for use on the scrum machine, the load cells will be mounted horizontally, and players can create shear forces, thus lessening the amount of force produced by the players that is captured by the load cells. Compounding this error in measurement in live trials is that the pads have to be used when the athletes push on the scrum machine, and the exact positioning of the athletes’ shoulders on the pads and the resultant deformation of the pad could create an unmeasurable amount of variance and impact the reliability of in vivo trials. Secondly, all data collection was conducted in a laboratory with consistent environmental conditions between tests. While this creates consistent conditions for comparison between trials, it does not necessarily represent the variable weather conditions that may occur when an instrumented scrum machine is used outside. The addition of environmental factors such as direct sunlight, greater ambient temperature, and humidity may affect the load–voltage relationship. While the manufacturer specifications of the load cells, power supply/signal conditioner, and ADC used in this study report maximum working environmental temperatures of 65 °C, 50 °C, and 55 °C, respectively, the influence of ambient temperature should still be tested in situ. In practice, all parts of the instrumentation should be shaded from sunlight and allowed airflow to minimize the temperature extremes of the instrumentation, particularly in warmer ambient conditions. The third limitation came unexpectedly during the human trials. We completed the testing in our laboratory to control environmental conditions; we purchased artificial turf so that the players could wear their cleats and hopefully have natural traction. Unfortunately, the traction of the artificial turf laid on top of the laboratory floor turned out to be poor, and we were forced to place a wooden plank that was 3.81 cm tall, 8.89 cm wide, and 1 m long underneath the turf to provide adequate coupling for the players. This created an unnatural environment, though other modifications were needed in many of the prior research projects studying scrum force that also created unnatural environments [2,3]. Lastly, the human trials were only conducted in amateur male and female university-level players, and the results may not be generalizable to other playing levels.

4. Conclusions

Our instrumented scrum machine showed near-perfect reliability in both deadweight calibrations and human performance trials. From our results, we conclude that our machine needs 30 min of warm-up time but can run for up to 7 h without any threats to validity. We also conclude that we do not need to recalibrate the machine during normal usage within a 6-month period. The maximum amount of time allowable between calibrations has not yet been determined.

Supplementary Materials

The following supporting information can be downloaded at: https://www.mdpi.com/article/10.3390/app13137581/s1, Data sets for all phases of research.

Author Contributions

Conceptualization, E.A.M. and G.K.B.; methodology, E.A.M., G.K.B. and S.B.K.; software, G.K.B.; validation, E.A.M., G.K.B. and S.B.K.; formal analysis, E.A.M., G.K.B. and S.B.K.; investigation, E.A.M. and G.K.B.; resources, E.A.M. and G.K.B.; data curation, E.A.M., G.K.B. and S.B.K.; writing—original draft preparation, E.A.M. and S.B.K.; writing—review and editing, E.A.M., G.K.B. and S.B.K.; visualization, E.A.M. and S.B.K.; supervision, E.A.M.; project administration, E.A.M.; funding acquisition, E.A.M. and G.K.B. All authors have read and agreed to the published version of the manuscript.

Funding

This research was funded by a Faculty Incentive Grant through the California State University, Monterey Bay Corporation, grant number FIG-000058, and a California State University Research, Scholarship, and Creative Activity Award Program, grant number RSCA-000091.

Institutional Review Board Statement

The study was conducted in accordance with the Declaration of Helsinki and approved by the Institutional Review Board (Committee for the Protection of Human Subjects) of California State University Monterey Bay (protocol code 18-104, approved 16 April 2018).

Informed Consent Statement

Informed consent was obtained from all subjects involved in the study.

Data Availability Statement

The data presented in this study are available in Supplementary File S1.

Acknowledgments

The authors would like to thank all the research assistants who helped with the different phases of this project, including Natalie Brown, Horacio Genis, Mikaela Kirkpatrick, Jherrica Phillips, and Suzanne Rendon.

Conflicts of Interest

The authors declare no conflict of interest. The funders had no role in the design of the study; in the collection, analyses, or interpretation of data; in the writing of the manuscript; or in the decision to publish the results.

References

  1. worldrugby.org Laws of the Game. World Rugby Laws. Available online: https://www.world.rugby/the-game/laws/law/19/ (accessed on 25 April 2023).
  2. Green, A.; Coopoo, Y.; Tee, J.C.; McKinon, W. A Review of the Biomechanical Determinants of Rugby Scrummaging Performance. S. Afr. J. Sport. Med. 2019, 31, 1–8. [Google Scholar] [CrossRef] [PubMed] [Green Version]
  3. Martin, E.; Beckham, G. Force Production during the Sustained Phase of Rugby Scrums: A Systematic Literature Review. BMC Sport. Sci. Med. Rehabil. 2020, 12, 33. [Google Scholar] [CrossRef] [PubMed]
  4. Preatoni, E.; Wallbaum, A.; Gathercole, N.; Coombes, S.; Stokes, K.A.; Trewartha, G. An Integrated Measurement System for Analysing Impact Biomechanics in the Rugby Scrum. Proc. Inst. Mech. Eng. Part P J. Sport. Eng. Technol. 2012, 226, 266–273. [Google Scholar] [CrossRef] [Green Version]
  5. Preatoni, E.; Stokes, K.A.; England, M.E.; Trewartha, G. The Influence of Playing Level on the Biomechanical Demands Experienced by Rugby Union Forwards during Machine Scrummaging: The Influence of Playing Level on Forces in Machine Scrummaging. Scand. J. Med. Sci. Sport. 2013, 23, e178–e184. [Google Scholar] [CrossRef] [PubMed] [Green Version]
  6. Preatoni, E.; Stokes, K.A.; England, M.E.; Trewartha, G. Engagement Techniques and Playing Level Impact the Biomechanical Demands on Rugby Forwards during Machine-Based Scrummaging. Br. J. Sport. Med. 2015, 49, 520–528. [Google Scholar] [CrossRef] [PubMed] [Green Version]
  7. Preatoni, E.; Cazzola, D.; Stokes, K.A.; England, M.; Trewartha, G. Pre-Binding Prior to Full Engagement Improves Loading Conditions for Front-Row Players in Contested Rugby Union Scrums: Engagement Protocols in Rugby Scrummaging. Scand. J. Med. Sci. Sport. 2016, 26, 1398–1407. [Google Scholar] [CrossRef] [PubMed]
  8. Indoor Rugby Scrum Training Machines, Indoor Rugby, Devon. Available online: https://www.rugbyscrummachines.co.uk/indoor-machines/ (accessed on 25 April 2023).
  9. Scrum Machines, Roller Machines and Ruck and Maul Training Aids. Available online: https://www.rugbyscrummachines.co.uk/roller-machines/ (accessed on 25 April 2023).
  10. du Toit, D.E.; Venter, D.J.L.; Buys, F.J.; Olivier, P.E. Kinetics of Rugby Union Scrumming in Under 19 Schoolboy Rugby Forwards. S. Afr. J. Res. Sport Phys. Educ. Recreat. 2004, 26, 33–50. [Google Scholar] [CrossRef]
  11. Lacome, M. Analyse de la Tâche et Physiologie Appliquée au Rugby: Étude de la Fatigue Associée à l’Exercice Maximal Isométrique Répété. Ph.D. Thesis, Université Claude Bernard, Lyon, France, 2013. [Google Scholar]
  12. Hopkins, W.G. Measures of Reliability in Sports Medicine and Science. Sport. Med. 2000, 30, 1–15. [Google Scholar] [CrossRef] [PubMed] [Green Version]
  13. Brady, C.J.; Harrison, A.J.; Comyns, T.M. A Review of the Reliability of Biomechanical Variables Produced during the Isometric Mid-Thigh Pull and Isometric Squat and the Reporting of Normative Data. Sport. Biomech. 2020, 19, 1–25. [Google Scholar] [CrossRef] [PubMed]
  14. Drake, D.; Kennedy, R.; Wallace, E. Familiarization, Validity and Smallest Detectable Difference of the Isometric Squat Test in Evaluating Maximal Strength. J. Sport. Sci. 2018, 36, 2087–2095. [Google Scholar] [CrossRef] [PubMed]
  15. Drake, D.; Kennedy, R.; Wallace, E. The Validity and Responsiveness of Isometric Lower Body Multi-Joint Tests of Muscular Strength: A Systematic Review. Sport. Med. Open 2017, 3, 23. [Google Scholar] [CrossRef] [PubMed] [Green Version]
  16. Beckham, G. ScrumCollection. 2023. Available online: https://github.com/excellentsport/ScrumCollection (accessed on 26 April 2023).
  17. Bland, J.M.; Altman, D.G. Statistical Methods for Assessing Agreement between Two Methods of Clinical Measurement. Lancet 1986, 327, 307–310. [Google Scholar] [CrossRef]
  18. Giavarina, D. Understanding Bland Altman Analysis. Biochem. Med. 2015, 25, 141–151. [Google Scholar] [CrossRef] [PubMed] [Green Version]
  19. Lüdecke, D.; Ben-Shachar, M.S.; Patil, I.; Waggoner, P.; Makowski, D. Performance: An R Package for Assessment, Comparison and Testing of Statistical Models. J. Open Source Softw. 2021, 6, 3139. [Google Scholar] [CrossRef]
  20. R Core Team. R: A Language and Environment for Statistical Computing; R Foundation for Statistical Computing: Vienna, Austria, 2021; Available online: https://www.R-project.org/ (accessed on 26 April 2023).
  21. Wu, W.-L.; Chang, J.-J.; Wu, J.-H.; Guo, L.-Y. An Investigation of Rugby Scrummaging Posture and Individual Maximum Pushing Force. J. Strength Cond. Res. 2006, 21, 251–258. [Google Scholar] [CrossRef] [PubMed]
  22. Morel, B.; Rouffet, D.M.; Bishop, D.J.; Rota, S.J.; Hautier, C.A. Fatigue Induced by Repeated Maximal Efforts Is Specific to the Rugby Task Performed. Int. J. Sport. Sci. Coach. 2015, 10, 11–20. [Google Scholar] [CrossRef]
  23. Rendos, N.K.; Harriell, K.; Qazi, S.; Regis, R.C.; Alipio, T.C.; Signorile, J.F. Variations in Verbal Encouragement Modify Isokinetic Performance. J. Strength Cond. Res. 2019, 33, 708–716. [Google Scholar] [CrossRef] [PubMed]
  24. Guppy, S.N.; Brady, C.J.; Kotani, Y.; Connolly, S.; Comfort, P.; Lake, J.P.; Haff, G.G. A Comparison of Manual and Automatic Force-Onset Identification Methodologies and Their Effect on Force-Time Characteristics in the Isometric Midthigh Pull. Sport. Biomech. 2021, 1–18. [Google Scholar] [CrossRef] [PubMed]
  25. Hopkins, W.G. Spreadsheets for Analysis of Validity and Reliability. Sportscience 2015, 19, 36–42. [Google Scholar]
  26. Green, A.; Kerr, S.; Dafkin, C.; McKinon, W. The Calibration and Application of an Individual Scrummaging Ergometer. Sports Eng. 2016, 19, 59–69. [Google Scholar] [CrossRef]
Figure 1. Schematic of steel plate to connect S-type load cells to scrum pads. All measurements in inches. Yellow holes are 14.29 mm (9/16 inch).
Applsci 13 07581 g001
Figure 2. (A) Whole instrumented pad mounted on sled. (B) We drilled a shallow recess into the wooden block of the pad to accommodate the bolt head.
Applsci 13 07581 g002
Figure 3. Load cell bolted between steel plates in preparation for calibration.
Applsci 13 07581 g003
Figure 4. Deadweight calibration with three of the weight plates on a load cell.
Applsci 13 07581 g004
Figure 5. Block diagram of instrumented scrum machine.
Applsci 13 07581 g005
Figure 6. Stability of load–voltage relationship within each load cell over 7 h of run time.
Applsci 13 07581 g006
Figure 7. Bland–Altman plots of day-to-day reliability.
Applsci 13 07581 g007
Figure 8. Fully instrumented scrum machine.
Applsci 13 07581 g008
Figure 9. Person in scrum position.
Applsci 13 07581 g009
Table 1. Bland–Altman analyses between all paired days among days 0, 1, 7, and 180.
ComparisonMean of
Difference (Volts)
SD of
Difference
95% CI for
Mean Difference
95% LOA for
Differences
Day 1 vs. day 0−0.0020.010(−0.004, 0.000)(−0.022, 0.017)
Day 7 vs. day 0−0.0010.003(−0.002, −0.001)(−0.006, 0.004)
Day 180 vs. day 0−0.0010.004(−0.002, 0.000)(−0.009, 0.008)
Day 7 vs. day 10.0010.008(−0.001, 0.003)(−0.015, 0.016)
Day 180 vs. day 10.0010.007(−0.000, 0.003)(−0.012, 0.015)
Day 180 vs. day 70.0010.003(−0.000, 0.001)(−0.005, 0.006)
Notes: SD = standard deviation; CI = confidence interval.
Table 2. Reliability Statistics for Peak Voltage in Human Individual Scrum Trials.
Trial 2–1Trial 3–2Trial 4–3Trial 5–4Average across
Trials
Raw valuesChange in mean (volts)
(90% CI)
0.01
(−0.09 to 0.12)
0.10
(−0.01 to 0.21)
0.04
(−0.10 to 0.17)
0.18
(0.05 to 0.32)
NA
Typical error (volts)
(90% CI)
0.14
(0.10 to 0.22)
0.17
(0.13 to 0.25)
0.20
(0.15 to 0.30)
0.20
(0.15 to 0.30)
0.18
(0.15 to 0.22)
ICC
(90% CI)
0.96
(0.89 to 0.98)
0.94
(0.86 to 0.98)
0.93
(0.83 to 0.97)
0.95
(0.87 to 0.98)
0.95
(0.90 to 0.98)
Log transformedChange in mean (%)
(90% CI)
0.2
(−5.2 to 6.0)
4.1
(−0.9 to 9.4)
1.9
(−4.0 to 8.1)
6.7
(0.6 to 13.2)
NA
Typical error as CV (%)
(90% CI)
7.5
(5.5 to 12.2)
7.6
(5.8 to 11.6)
9.3
(7.0 to 14.1)
8.8
(6.6 to 13.6)
8.4
(7.0 to 10.5)
ICC
(90% CI)
0.95
(0.87 to 0.98)
0.95
(0.88 to 0.98)
0.93
(0.84 to 0.97)
0.95
(0.87 to 0.98)
0.95
(0.90 to 0.98)
Table 3. Reliability Statistics for Average Voltage in Human Individual Scrum Trials.
Trial 2–1Trial 3–2Trial 4–3Trial 5–4Average across
Trials
Raw valuesChange in mean (volts)
(90% CI)
0.0
(−0.08 to 0.07)
0.05
(−0.06 to 0.15)
0.07
(−0.04 to 0.19)
0.22
(0.12 to 0.32)
NA
Typical error (volts)
(90% CI)
0.10
(0.07 to 0.16)
0.16
(0.12 to 0.23)
0.18
(0.13 to 0.26)
0.14
(0.11 to 0.22)
0.15
(0.13 to 0.19)
ICC
(90% CI)
0.97
(0.92 to 0.99)
0.92
(0.81 to 0.97)
0.91
(0.79 to 0.96)
0.96
(0.89 to 0.98)
0.94
(0.89 to 0.98)
Log transformedChange in mean (%)
(90% CI)
−0.3
(−5.4 to 5.0)
2.8
(−2.3 to 8.2)
3.6
(−2.1 to 9.7)
10.6
(6.0 to 15.4)
NA
Typical error as CV (%)
(90% CI)
7.0
(5.2 to 11.4)
7.9
(6.0 to 12.0)
8.9
(6.7 to 13.5)
6.2
(4.7 to 9.6)
7.6
(6.4 to 9.5)
ICC
(90% CI)
0.96
(0.88 to 0.99)
0.94
(0.86 to 0.98)
0.93
(0.82 to 0.97)
0.97
(0.92 to 0.99)
0.95
(0.91 to 0.98)
Disclaimer/Publisher’s Note: The statements, opinions and data contained in all publications are solely those of the individual author(s) and contributor(s) and not of MDPI and/or the editor(s). MDPI and/or the editor(s) disclaim responsibility for any injury to people or property resulting from any ideas, methods, instructions or products referred to in the content.

