1. Introduction
An electric power system (EPS) can be described as a network consisting of generation, transmission, and distribution systems. The main purpose of the EPS is to ensure efficient and reliable power supply for consumers. To achieve this goal, it is important to maintain the integrity and compatibility of the EPS elements, as well as to ensure the management, operation, and coordinated expansion of the generation capabilities, transmission network, and interconnections with other EPSs [
1,
2,
3,
4]. The sustainable functioning of an EPS requires the continuous development of the security and reliability of energy supply, availability and adequacy of energy resources, and efficient use of energy resources and energy consumption. There must be a coherent and sustainable development of the energy sector, along with a strategy to reduce the negative environmental impacts of energy activities as well as the protection of consumer rights and legitimate interests. A strategy for the use and development of local and renewable energy resources must also be included [
1,
2,
3,
4,
5,
6].
The EPS operator is responsible for planning and coordinating the topology of the electric power transmission network, and preventing and dealing with disturbances and accidents. The operator must also provide additional services necessary for the power system’s safe, reliable, and efficient operation, and also assure that the quality of transmitted electrical energy meets EU standards. In accordance with the EU Commission Regulation 2017/1485, all European EPSs collectively follow a methodology for coordinating the operational security analysis of the electrical grid. This methodology aims to standardize the analysis of the operation and security of the electrical grid in the synchronous area. Alongside this methodology, the capacity calculation provisions for each individual region must be followed by the regional security coordinators and the EPS capacity engineers [
7].
Reliability is the most important property of an EPS. It is ensured in two ways: by uninterrupted operation of the power system through real-time planning and control, and by a retrospective analysis of the equipment, electrical grid parameters and regimes, and corresponding long-term planning [
4,
5]. The stability of the EPS requires real-time management of the power balance and the quality of the power in the transmission network [
4,
5,
6]. To ensure the reliability of the EPS in real time, it is necessary to monitor and control the key parameters of the power system, coordinate operational switching in the transmission network, remotely control the network elements, coordinate actions with neighboring transmission-system operators, and implement preventive measures necessary for emergency response [
1,
2,
3,
4,
5,
6]. Long-term planning, related to EPS stability, as well as real-time management are very important for its reliability. This requires research into its capability withstand disturbances in particular operation modes.
This paper focuses on the research into the stability of EPS operation during its desynchronization, its operation in islanded mode and its synchronization. The operation of the 400–330–110 kV electricity transmission network, which consists of power plants, transformer substations, switchgears, overhead transmission, and cable lines, was analyzed. This was performed to determine capability of the transmission network to maintain reliability in the event of a system disturbance [
5,
6].
Numerical simulation software was used to analyze the behavior of the three EPSs in the event of a sudden and unexpected disconnection from the integrated and stable EPS. Guidelines are presented on the measures and actions to be taken to maintain stable parameters of an isolated EPS. The steps to be taken to stabilize the frequency of the EPS to a value of 50 ± 0.1 Hz are specified. Analysis was performed to determine in what range electrical parameters need to be maintained to prevent under-frequency load shedding (UFLS) in an isolated EPS. The frequency containment reserves (FCR) and frequency restoration reserves with automatic activation (aFRR) values of the isolated EPS were calculated and simulated. The potential of HVDC to stabilize and restore the parameters of an isolated EPS were investigated [
8,
9,
10,
11,
12,
13,
14,
15,
16].
The main objective of this study was to investigate all possible and available means to prevent the isolated EPS from shutting down or splitting into separate, non-synchronously operating parts with a load of a certain magnitude. This study aimed to demonstrate that with sufficient active power, inertia in reserve, and with the FCR function of the generators enabled, it is possible to maintain stable EPS parameters in the event of a sudden and unexpected system disturbance [
4,
5,
6,
17,
18,
19,
20].
Each and any isolated EPS must be prepared to independently ensure reliable energy sector operation very efficiently and cost-effectively. It needs to establish an internal, integrated market for the active power reserves of the isolated EPS that would stimulate competition among electrical energy producers which provide power reserve services. These reserves are to be used to compensate short-term power and energy shortages in the isolated EPS [
21,
22,
23,
24,
25].
The rest of the paper is organized as follows: the structure of the analyzed EPS and its operating conditions are presented in
Section 2,
Section 3 is intended for calculation of the EPS inertia and permissible power imbalance, the impact of EPS response on
k factor is analyzed in
Section 4, the identification of abrupt EPS isolation is discussed in
Section 5, the simulation results of EPS desynchronization and reaction of the isolated system to disturbances are presented in
Section 6, synchronization of the EPS with a synchronous area is discussed in
Section 7, the recommended sequence of actions after an abrupt and unexpected EPS disconnection is presented in
Section 8, the results of the research are summarized and discussed in
Section 9, and conclusions are presented in
Section 10.
2. Structure and Operating Conditions of an Isolated EPS
The analyzed isolated electrical power system consists of 330 kV open-type switchgear bus-bars and their switching devices; autotransformers, power transformers, and 330 kV open-type switchgear bus-bars, and HVDC converter stations connected to the 330 kV grid and 330 kV overhead lines.
EPS part No.1:
Generation: 1125 MW;
Generation (inc. HVDC) 1775 MW;
Consumption: 1630 MW;
HVDC1: 200 MW (from neighbor to EPS No.1), (nominal value of HVDC1 is 350 MVA);
HVDC2: 450 MW (from neighbor to EPS No.1), (nominal value of HVDC2 is 650 MVA);
Balance excess: +200 MW;
Exchange of electricity values are:
from EPS No.1 to EPS No.2 (200 MW);
from neighbor EPS to EPS No.1 (55 MW);
Generators active power generation of EPS No.1:
G1 TPP 80 MW (nominal value is 253 MVA), G2 TPP 270 MW (nominal value is 372 MVA), G3 TPP 80 MW (nominal value is 235 MVA), G4 TPP 165 MW (nominal value is 235 MVA), G5 TPP 80 MW (nominal value is 235 MVA), G6 TPP 150 MW (nominal value is 253 MVA);
Wind power 300 MW (nominal value is 425 MVA);
The 330 kV substations voltage level varies from 354 kV to 361 kV.
EPS part No.2:
Generation: 850 MW;
Consumption: 1100 MW;
Balance deficit: −250 MW;
Exchange of electricity values are:
from EPS No.1 to EPS No.2 (200 MW);
from EPS No.2 to EPS No.3 (0 MW);
from neighbor EPS to EPS No.2 (50 MW);
Generators active power generation of EPS No.2:
G7 TPP 270 MW (nominal value is 531 MVA), G8 HPP 90 MW (nominal value is 105 MVA), G9 HPP 90 MW (nominal value is 105 MVA), G10 HPP 90 MW (nominal value is 105 MVA), G11 HPP 50 MW (nominal value is 150 MVA), G12 HPP 50 MW (nominal value is 150 MVA), G13 HPP 55 MW (nominal value is 75 MVA), G14 HPP 55 MW (nominal value is 75 MVA);
Wind power 100 MW (nominal value is 210 MVA);
The 330 kV substations voltage level varies from 355 kV to 360 kV.
EPS part No.3:
Generation: 1000 MW;
Generation (inc. HVDC) 1400 MW;
Consumption: 1180 MW;
HVDC3: 600 MW (from neighbor to EPS No.3), (nominal value of HVDC3 is 700 MVA);
HVDC4: 200 MW (from EPS No.3 to neighbor), (nominal value of HVDC4 is 500 MVA);
Balance deficit: −220 MW;
Exchange of electricity values are:
from EPS No.2 to EPS No.3 (0 MW);
from neighbor EPS to EPS No.3 (220 MW);
Generators active power generation of EPS No.3:
G15 HPP 200 MW (nominal value is 248 MVA), G16 HPP 25 MW (nominal value is 29 MVA), G17 HPP 25 MW (nominal value is 29 MVA), G18 TPP 400 MW (nominal value is 524 MVA);
Wind power 350 MW (nominal value is 475 MVA);
330 kV substations voltage level varies from 356 kV to 360 kV.
The scheme of the isolated power system is presented in
Figure 1.
In numerical simulation it was assumed that operating conditions of the EPS are as follows:
The active power generated by the isolated system is 2975 MW of which 750 MW are from wind farm generation;
The isolated system’s total active capacity incl. HVDC is 4025 MW. Importing power is 1250 MW, exporting power is 200 MW in the course of electricity trading through HVDC connections with neighboring EPS;
The 330 kV voltage is controlled by shunt reactors (SHR). A highly effective way to control the voltage and increase the inertia of the system is to put hydro-generators into operation, which can operate in synchronous compensator mode. The units capable of operating in synchronous condenser (SC) mode: one each for EPS parts No.2 and No.3.
The isolated EPS is divided into three parts, which can also operate independently;
The isolated EPS is connected to neighboring EPSs via eleven OHLs and four HVDCs;
One of the HVDCs is of the BtB type;
The critical frequency value of the isolated EPS is 49.20 Hz, at which the UFLS is triggered;
The generators are operating with continuously activated FCR function: EPS No.1 and EPS No.2;
Isolated EPS normal voltage level 350–360 kV.
The frequency stability of the electric power system is closely related to the rotor angle stability. The analyzed case demands the evaluation of frequency changes during disturbances as it brings additional valuable information about possible activation of automatic under-frequency load shedding. Therefore, the obtained results of the system’s response to disturbances are presented in terms of frequency.
3. Calculation of System Inertia and Permissible Active Power Imbalance
Inertia can be defined as the resistance of a body having a certain mass to a change in its velocity and the direction of its velocity. The inertia of an EPS consists of all the rotating parts of the electrical equipment synchronously connected to it, such as synchronous generators and their turbines. The higher the mass of generators and turbines, the higher the inertia of the EPS. Due to the inertia of the EPS, when there is a shortage of power generation in the system, the frequency of the EPS changes not suddenly but gradually over time [
21,
22,
23,
24,
25]. This is because kinetic energy accumulated in the rotating mass is fed to the EPS in the form of electricity as it slows down. Kinetic energy of a rotating mass is described by the following equation
where
J is moment of inertia of generator and turbine, 𝜔
m is mechanical rotation speed of generator.
The additional electrical energy in the transmission system reduces the active power imbalance, which in turn slows down the frequency variation in the EPS. The higher inertia of the EPS, the slower frequency variation, which gives more additional time for the frequency regulators to start operating. The relationship between the power balance of the system and the generator rotation speed is described as follows [
26,
27]
where
is mechanical power of the generator, and
is load power.
The left-hand side of the equation is the derivative of the kinetic energy (
) of the turbine and generator. This energy is usually expressed in proportion to the generator’s rated power and is called the inertia constant
HG. The inertia constant indicates how long the generator can supply its rated power using only its available kinetic energy. The inertia constant is calculated as follows
where
is apparent nominal power of the generator.
Expressing Equation (2) in relative units (¯) and applying Equation (3) gives the following result:
Since the frequency is the same throughout the EPS, all individual generators can be described as a single generator (
) with a shared load (
):
where
Hsystem is inertia constant of the total EPS:
where 𝑆
system is total installed apparent power of the generators in the EPS.
To explore the effect of inertia on the frequency variation in the EPS, a digital simulation study was carried out where three generators with a generating capacity of 100 MW each were successively connected to the EPS. One generator has the FCR function switched on and the other two generators have the FCR function switched off. The EPS has an additional load of 10 MW connected.
The arrows in
Figure 3 show the trajectory of the EPS frequency variation when the FCR is not activated. The results show that the lower the rate of frequency variation in the EPS, the more generators in the system can contribute to the primary frequency regulation and further slow down the frequency drop in the EPS before the frequency reaches the emergency limit.
In this case, the EPS frequency deviation (Δf) is the same for both simulations and depends only on the available FCR reserve.
The total inertia of the EPS is equal to the sum of the inertia of all generators producing electricity in the isolated EPS. All generators or units operating in pump mode, and hydroelectric units operating in SC mode also contribute to the total EPS inertia. Renewable energy sources do not provide additional inertia to EPS [
21,
22,
23,
24,
25,
26,
27].
To maintain stable operating mode, the following requirements must be met:
In an isolated EPS, the maximum generation source should not exceed 300 MW;
In an isolated EPS, the emergency power control (EPC) function of the HVDC BtB converters must be enabled.
The amount of inertia required for the stable operation of an abruptly disconnected and isolated EPS is equal to 25 MWs for each 1 MW imbalance [
4,
5,
6,
22,
23,
24,
25]. This amount of inertia ensures that the frequency of the isolated EPS will not drop to the critical value of 49.20 Hz (see
Table 1).
Table 1 below gives an overview about needed levels of inertia in a power system during isolated operation. Concisely, according to precondition that rate of change of frequency (RoCoF) in power system during isolated operation should not be bigger than 1 Hz/s. It can be calculated that for each 1 MW of imbalance 25 MWs of inertia needs to be provided to the power system.
Based on the generator operating at its maximum capacity, the amount of inertia required for stable operation of an isolated EPS must be at least 15,300 MWs. The value of inertia constant for generators operating in an isolated EPS varies between 3.2 and 6. Inertia of the EPS part No.1 is shown in
Table 2.
Inertia of the EPS part No.2 is shown in
Table 3.
Inertia of the EPS part No.3 is shown in
Table 4.
Total inertia of the EPS is 17,078.5 MWs.
4. EPS Response to Different Values of the k Factor
Calculations of the k factor are required when:
The frequency of the EPS starts to fluctuate within a range of 0.2–0.25 Hz;
The insensitivity limits of the generators operating in the EPS are higher than 10 mHz;
Power plants operating within the EPS have a large active power reserve;
EPS is in a quasi-static state and its frequency varies within the range of 0.2–0.3 Hz. The calculation of the
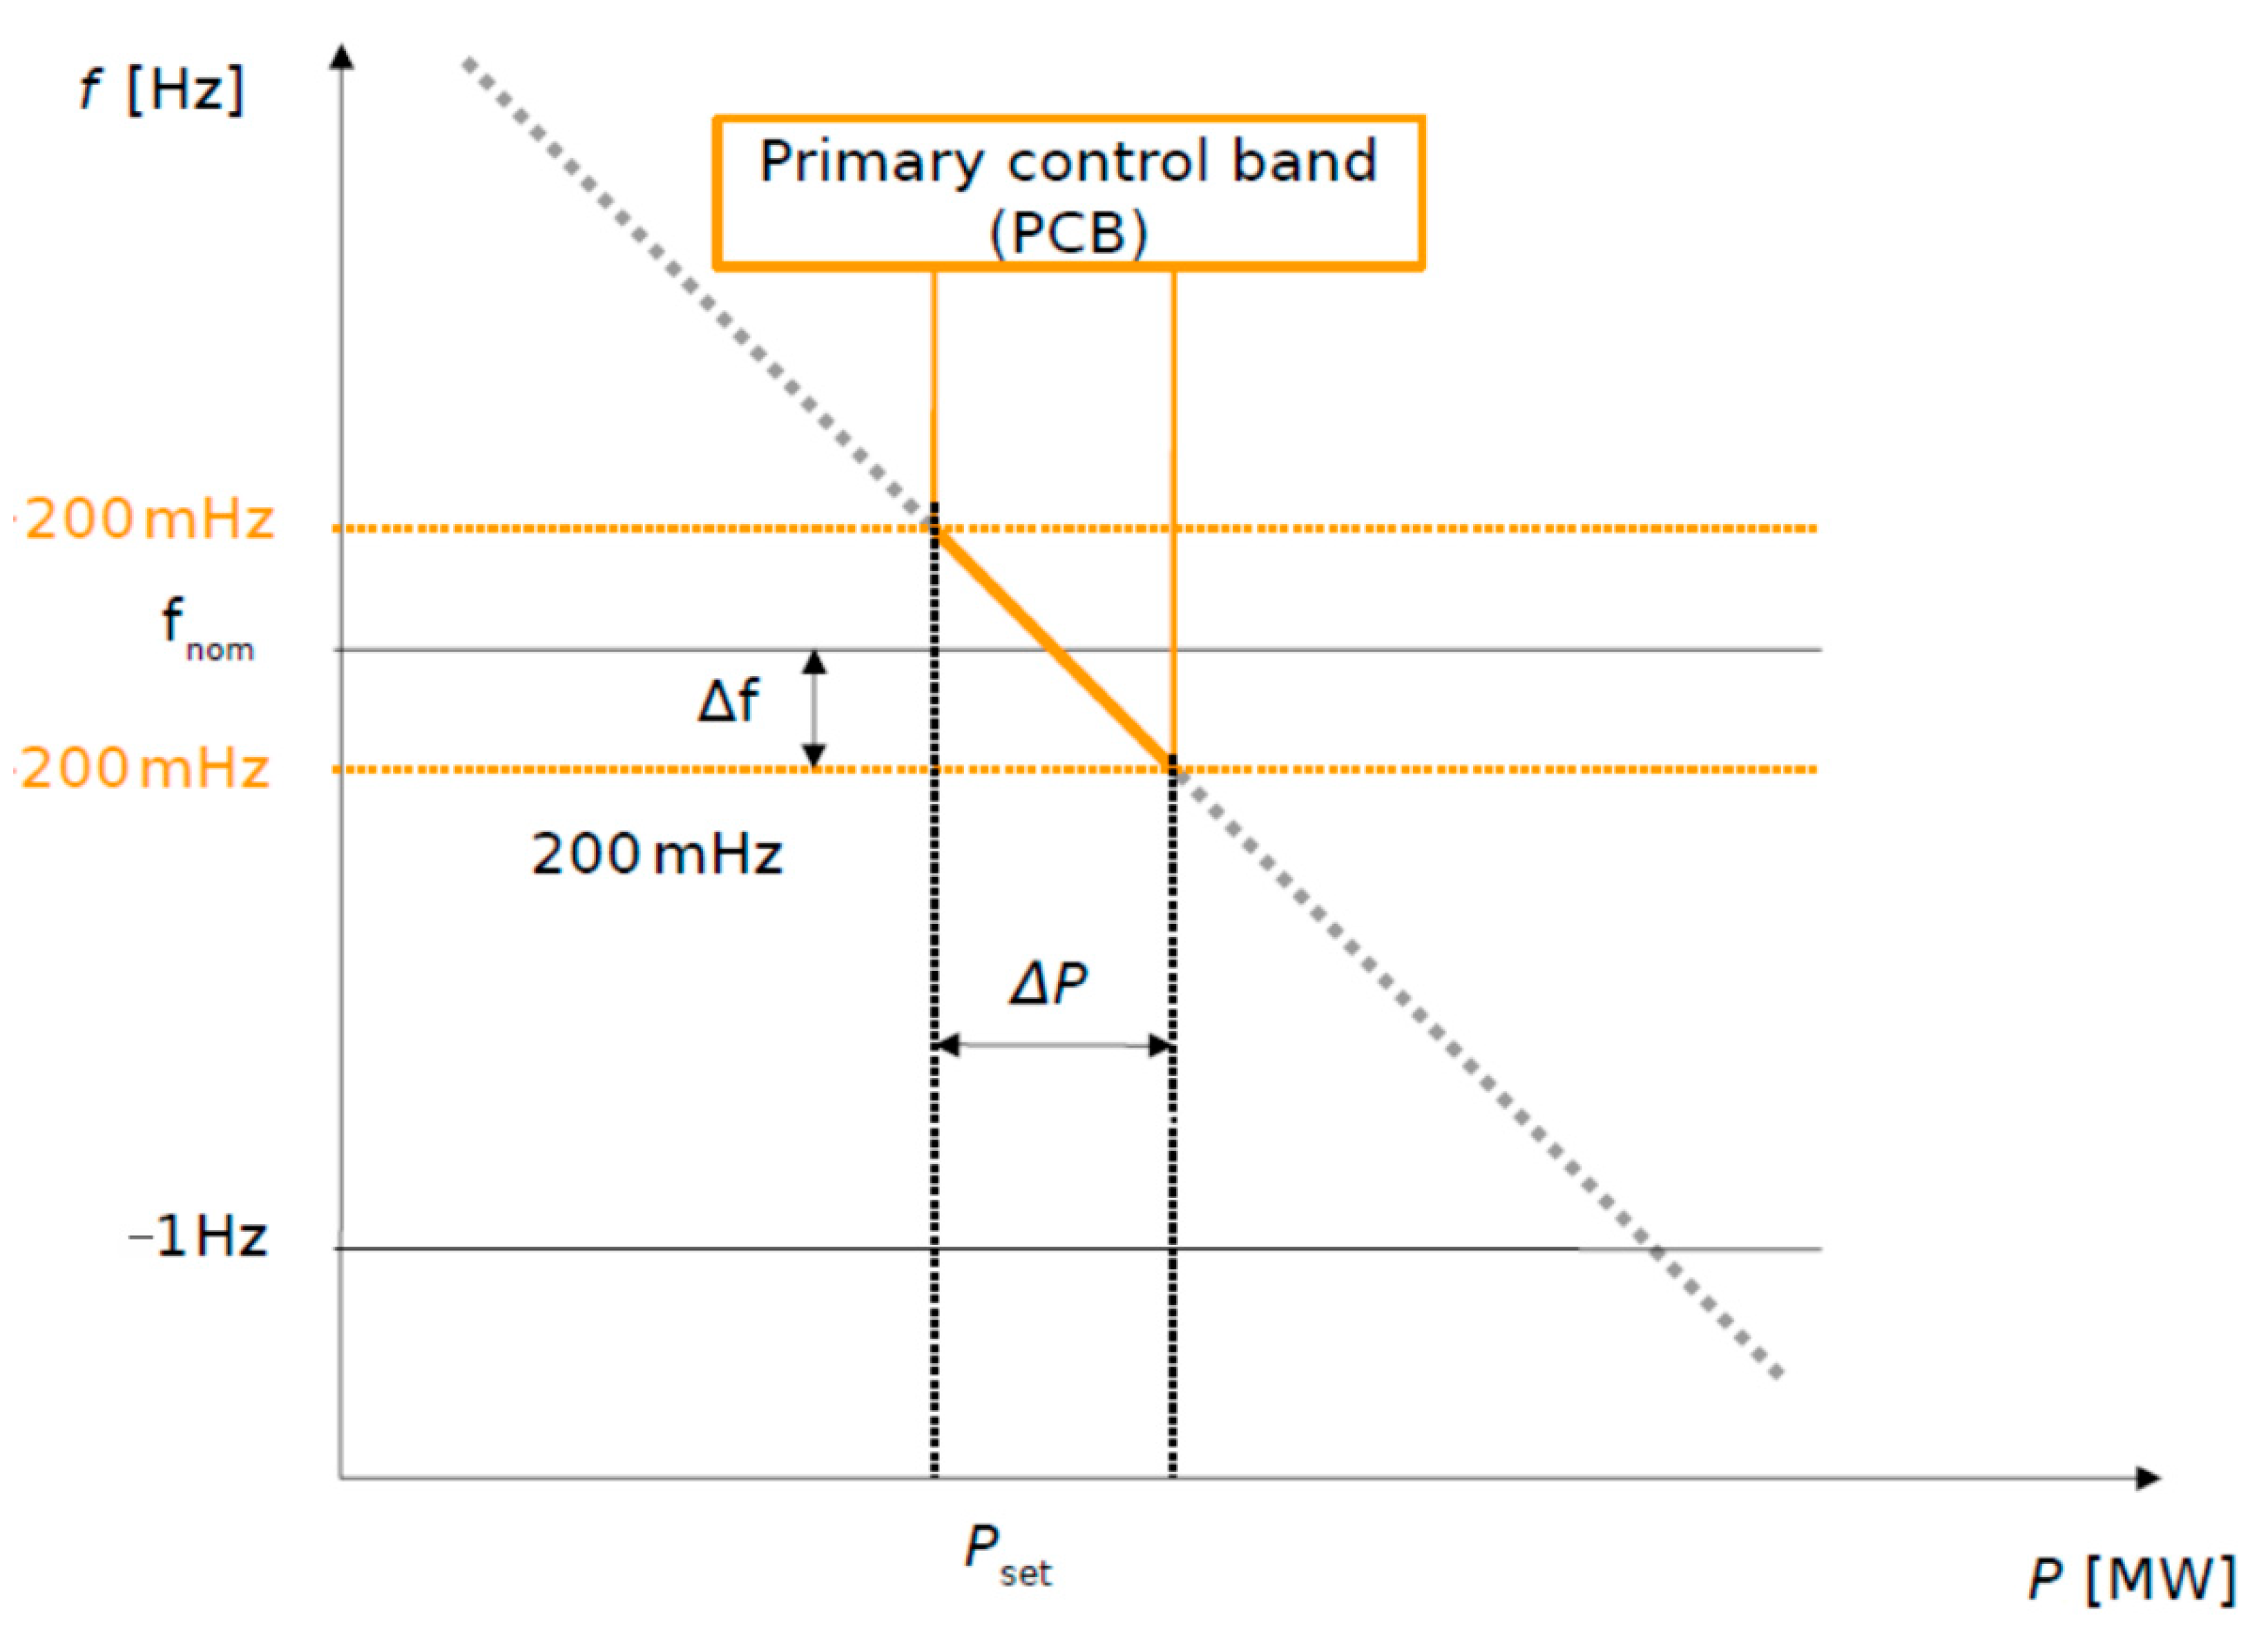
k factor shall only be carried out when the operation of the EPS is already steady and stable. The dependence of frequency and active power of the EPS is then presented in
Figure 4.
The k factor helps to determine the amount of FCR required and the active power imbalance. The value of the k factor is determined from the sum of Pnom values of all the generators with FCR enabled operating in the isolated EPS.
The
k factor of an isolated EPS is a relative value that indicates the response of the system (primary regulation, MW) to frequency deviations (Hz) [
1,
21,
22,
23,
24,
25].
To study the response of the EPS and the effect on the system frequency with different values of the
k factor, three generators with 100 MW of active power generation are switched on successively in digital simulations. For all three generators (G1, G2, and G3) the FCR function is enabled. EPS has an additional load of 10 MW connected. The response of EPS to different
k factor values is presented in
Figure 5:
One generator (G1) with the FCR function enabled is switched on;
Three generators (G1, G2 and G3) with FCR function enabled are switched on.
The results show that the more generators in the system can contribute to the primary frequency regulation and slow down the frequency drop of the EPS before it reaches the emergency limit, the lower frequency variation in the EPS. This study has shown that the more generators are operating with the FCR function enabled, the lower frequency deviation and the more accurate and lower frequency difference (Δf) from the 50 Hz value during the reset.
According to the European Commission Regulation (EU) 2017/2196 establishing a network code on electricity emergency and restoration, the EPS with the highest real-time estimated
k factor will be appointed as the frequency leader, unless the EPSs of the synchronized region, or the synchronous area, agree to appoint another EPS as the frequency leader [
28].
Each generator connected to the EPS is unique and therefore has different operating limits,
k factor value, frequency insensitivity limit Δ
f, and inertia constant
H. Depending on these different characteristics of the generator, the
k factor of the EPS is generally determined as follows (see
Figure 6):
The frequency response of the system depends on the combined frequency response of the generators connected to the EPS. For each generator connected to the EPS, it is mathematically described as follows:
where:
δ is droop relative value (%),
fnom is nominal frequency (50 Hz),
Pnom is nominal value of the active power of generator [
1].
Generator turbine controller can be configured/set for the following:
Active power control, in which case the setpoint Pset is set and the power control/variation takes place up to its setpoint Pact;
Frequency control, in which case a setpoint fset is set and the frequency control/variation takes place up to the setpoint fact. The variation takes place in cycles per minute.
Primary frequency control, in which case the active power value is set to setpoint
Pset and frequency control/variation takes place up to setpoint
fact. The variation takes place by varying the active power within the set frequency variation limits (49.8 Hz >
f < 50.2 Hz) [
29,
30].
In the case of a desynchronized region or EPS area, the amount of available active power reserves, and in particular the amount of frequency restoration reserves, and the permissible capacity of the inter-system lines have to be taken into account and assessed. In addition, the availability of EPS frequency measurements for the desynchronized region or zone and the critical elements of the region or zone must be assessed.
The
k factor is very important for load frequency control (LFC) settings. In addition to the frequency restoration reserves with automatic activation (aFRR), frequency restoration in EPS can also be performed manually. For frequency restoration reserves with manual activation (mFRR), the function and operating principle of the aFRR and the mFRR are the same [
31,
32,
33].
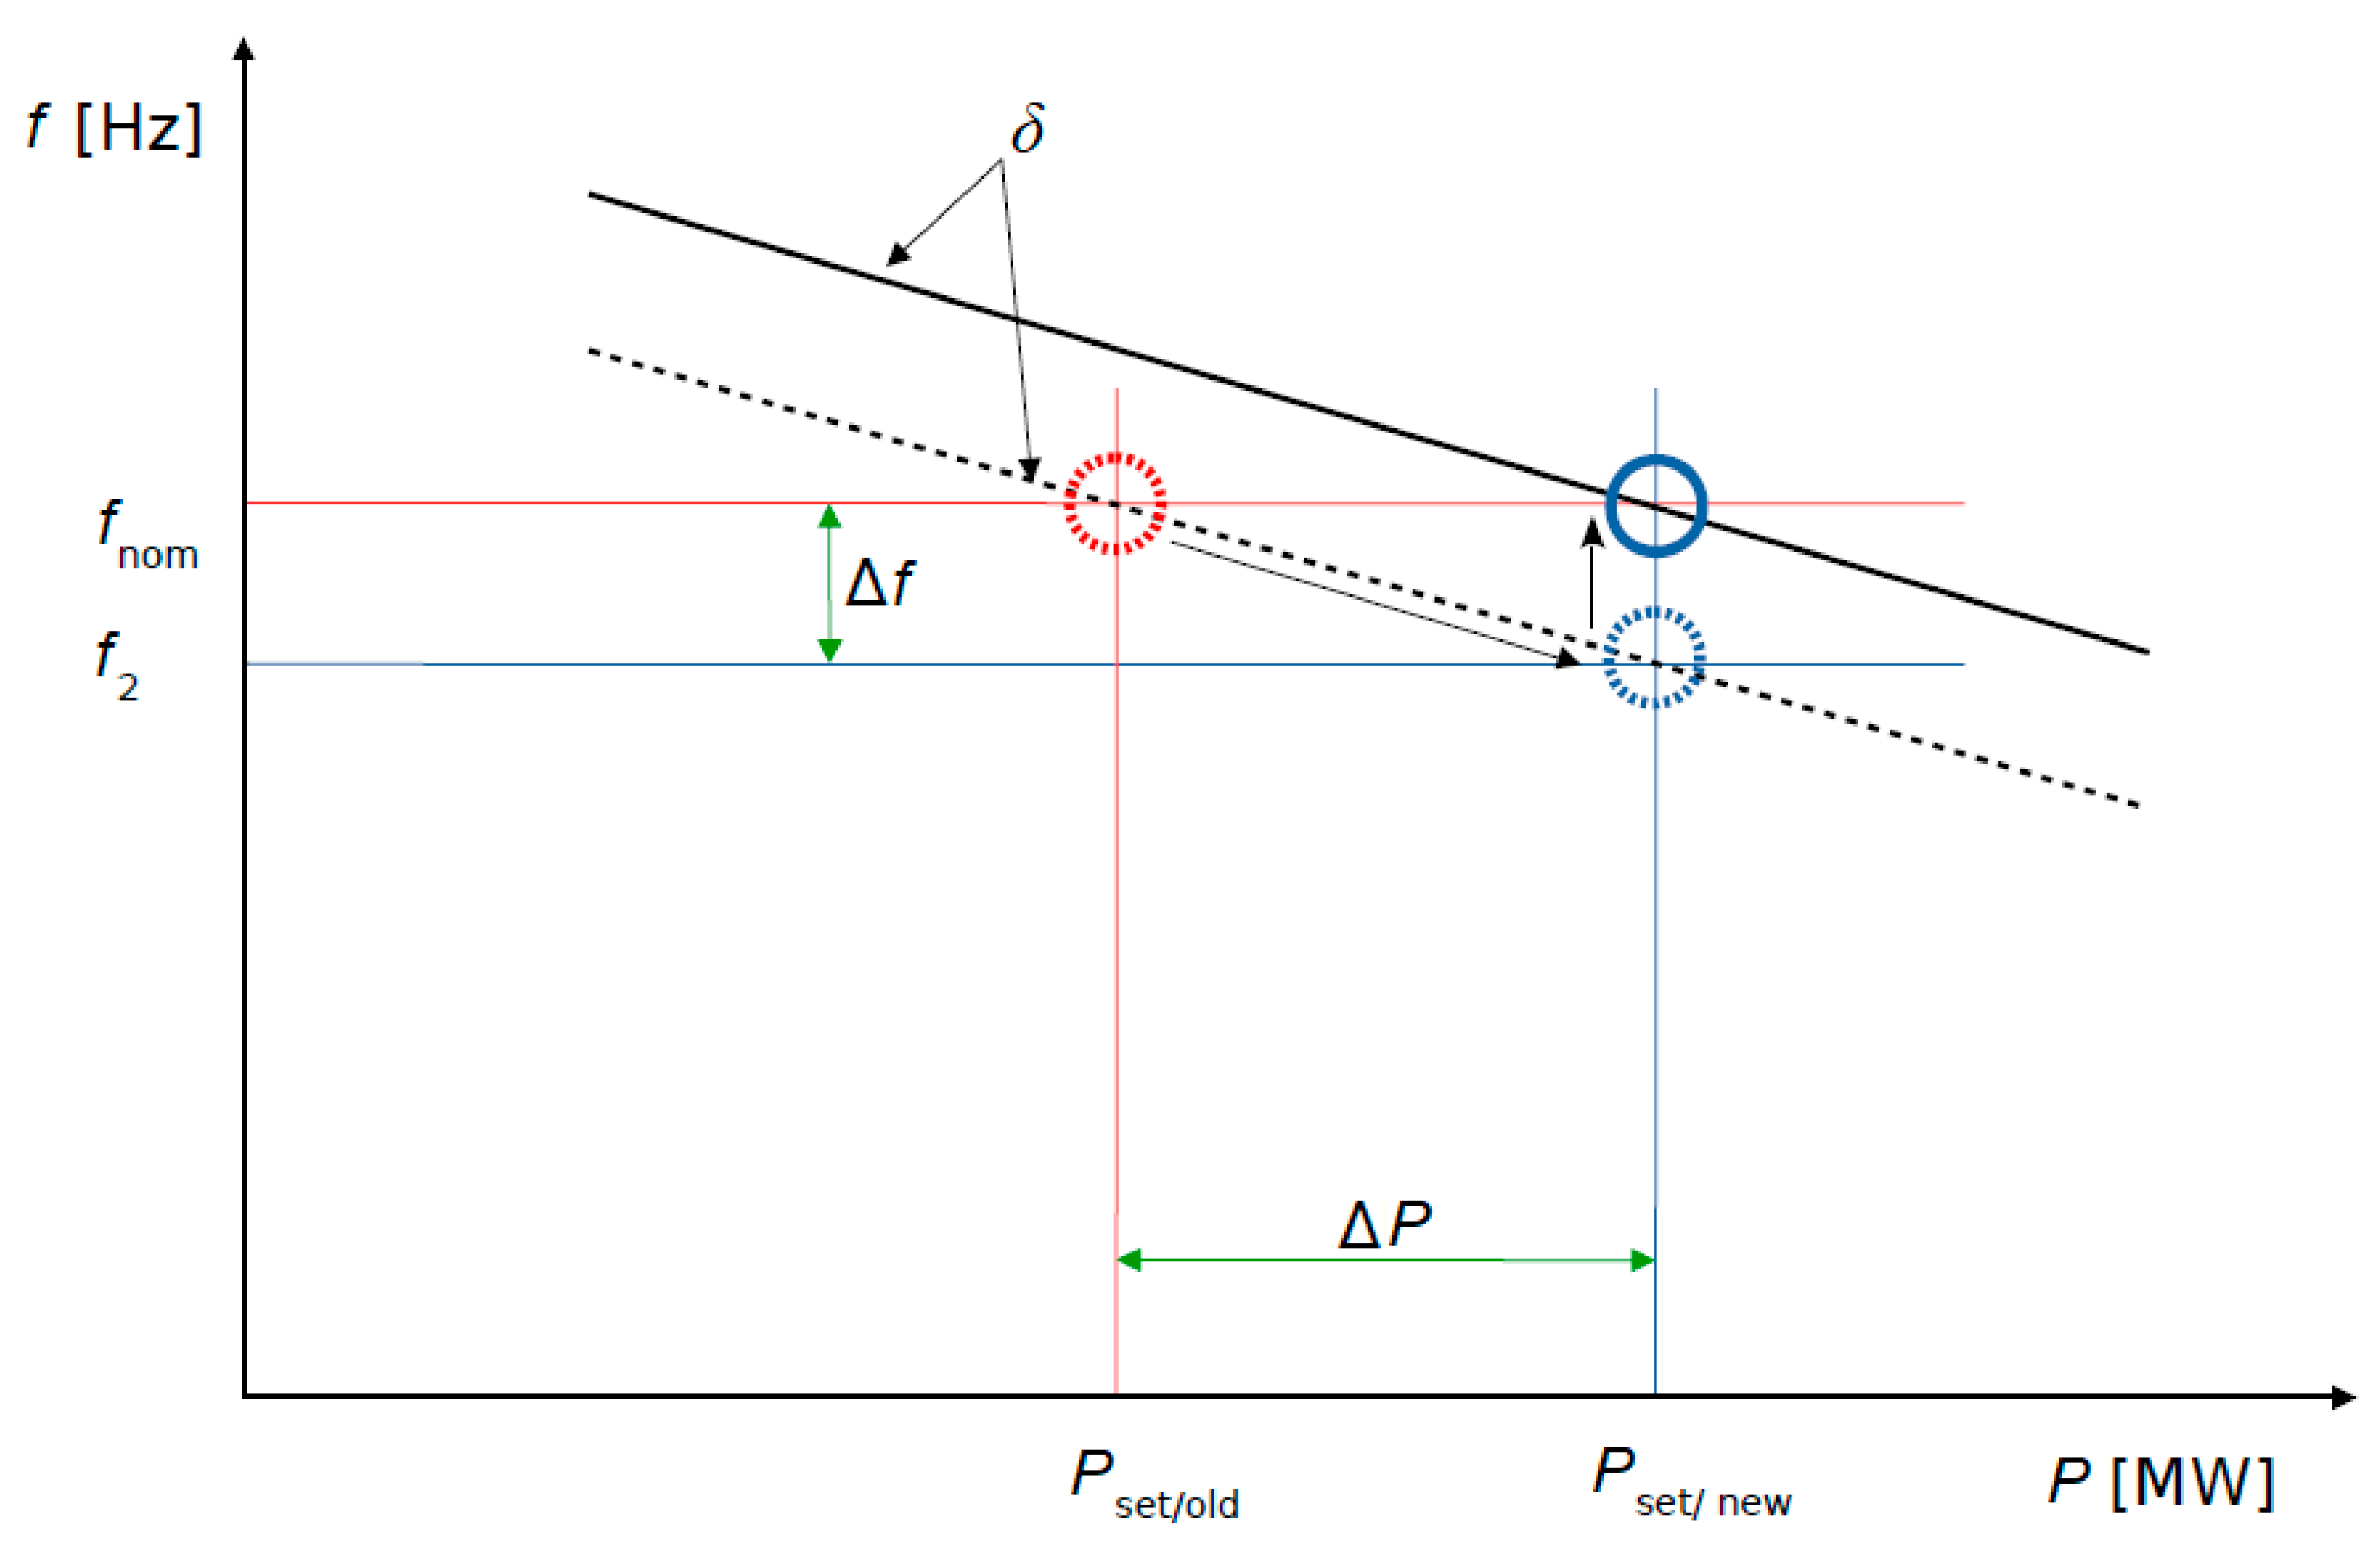
The change in active power Δ
P is a direct factor influencing the frequency variation Δ
f of the EPS. The EPS frequency dependence on the variation in the active power is shown in
Figure 7.
From
Figure 7 droop relative value is calculated as follows:
Frequency change is calculated as follows:
where
f2 is the new value of the established frequency (Hz), and
fnom is nominal frequency (50 Hz).
The change of active power is calculated as follows:
where
Pset/new is the newly changed generator active power value (MW), and
Pset/old is the active power value of the generator which is determined according to the work schedule (MW).
5. Signs of an Abrupt and Unexpected EPS Disconnection
Plausible indications that an EPS is being prepared for disconnection/isolation:
- (a)
Transferring stable EPS generation to new power plant units to ensure reliable frequency management;
- (b)
Abnormally low power flow between different EPSs;
- (c)
Abnormally low power flows between different EPS even with spare power capacity;
- (d)
A large part of the inter-system lines are disconnected;
- (e)
Sharing of SCADA data between different EPSs is discontinued;
- (f)
Signs of a cyberattack.
Signs of an abrupt disconnection of the EPS from the shared EPS:
Information received in SCADA that the connecting devices of the inter-system lines to the shared EPS have been disabled (on the shared EPS side);
Flows in the inter-system lines equal 0 MW;
Frequency deviations greater than ±0.2 Hz on the disconnected part of the EPS;
Significant voltage level deviations;
The effect of the disconnected EPS on the UFLS [
34,
35,
36].
If the EPS remains in a stable islanding mode after an abrupt disconnection/isolation, it is important to assess factors such as the activation of the FCR for operating generators as soon as possible. Check that the n–1 reliability criterion is maintained in the isolated EPS. The largest source of generation must not exceed the set value of the calculated active power. A sufficient amount of EPS inertia must be ensured. The frequency of the EPS must not exceed the critical limit, as this is the only way to ensure a frequency drop reserve that prevents the triggering of the UFLS (see
Figure 8 and
Figure 9).
The situation after an unplanned disconnection of the EPS can be much worse if the isolated EPS has an insufficient level of inertia, if the frequency control (FC) function is unavailable or not activated via the HVDC interconnectors and the HVDC interconnectors are under maximum load, if there is insufficient primary active power reserve in an isolated EPS and not enough generators in operation, or if the active power reserve of the primary regulation of the generators in operation is too low [
5,
18,
22,
29].
The unplanned or abrupt disconnection of the EPS may result in emergency disconnection of users/load due to the operation of the UFLS. A drop in frequency may also lead to the disconnection of some generation sources.
A digital simulation of the frequency variation in an isolated EPS has been carried out where a generation source of 524 MW is disconnected and the UFLS is triggered, and the initial active power reserve is only 100 MW. The results of the simulation are shown in
Figure 8.
In an isolated EPS, in the event of a 524 MW active power system disturbance and having only a 100 MW primary active power reserve, the system frequency drops to 48.10 Hz. When the system frequency reaches 49.2 Hz, the UFLS is triggered, causing the disconnection of electricity users. Once the system frequency has stabilized, it reaches 49.4 Hz. To restore the nominal 50 Hz frequency of the isolated EPS, aFRR or mFRR are required. Without sufficient active power reserve in an isolated EPS, frequency restoration becomes a systemic problem that can only be solved by limiting the supply of electricity to users.
The digital simulation and analysis of frequency variation in an isolated EPS when there is a disconnection of a generation source with 100–400 MW of active power and only 100 MW of primary active power reserve was performed, and the impact of UFLS analyzed. The results of the frequency variation in the isolated system are shown in
Figure 9.
The main factors affecting the response of an EPS to a sudden disconnection are: the power plants operating in the disconnected EPS and their primary active power reserve, the amount of inertia remaining in the disconnected EPS, remaining active power reserve through HVDC interconnectors and the EPC of the interconnectors, and users (loads) of the isolated EPS including automatic self-regulation of the load and UFLS.
Excluded from connection to the UFLS and from the user disconnection schedules are the users running continuous and complex technological processes, whose short-term disconnection endangers people’s lives, causes significant material losses, disrupts complex technological processes, disrupts important processes of the state and city economy, and medical institutions.
In the event of an emergency in an isolated EPS, where the system is short of power or energy, the UFLS must switch off up to 50% of the available power and limit the daily consumption of electricity up to 25%.
6. Power System Simulation of Desynchronization from the Synchronous Area
In the numerical simulations, the sum of exchange with the synchronous area was about 325 MW and constant, HVDC1–HVDC4 schedules varied within ±50 MW, and the load forecast was up to 50 MW.
The first indication that fast desynchronization from the synchronous area has occurred in the EPS is switching off the overhead lines OHL8, OHL9, OHL10, and OHL11 (see
Figure 1). Exchanging active power between a stabile EPS and a regional EPS during transition to isolated operating mode changes from 100 MW to 0 MW. The frequency deviation of EPS is shown in
Figure 10.
Due to an unplanned decrease in the throughput between EPS parts from 100 MW to 0 MW, EPS part No.2 operates the G11 and G12 FCR of the generators. The FCR function of these generators is always on and has the lowest insensitivity limit, i.e., less than 10 mHz. The increase in EPS load (up to 100 MW) affects the frequency change, which is not very large. The frequency drops to 49.97 Hz. Intersystem bandwidths are also affected by the size of the load, i.e., the transmission lines between part No.2 and No.3 of the EPS.
The voltage level increases at stabile EPS part No.3 because unloaded energized lines appear in the system. The voltage value increases to 363–364 kV, so it is necessary to react immediately and take measures to reduce the voltage value. Switching on shunt reactors in the area of voltage increase is perfect for this. Another effective method of voltage control is the disconnection of unloaded 330 kV overhead lines. After doing so, the voltage of 330 kV in part No.3 settles down to the permissible value of 359–360 kV.
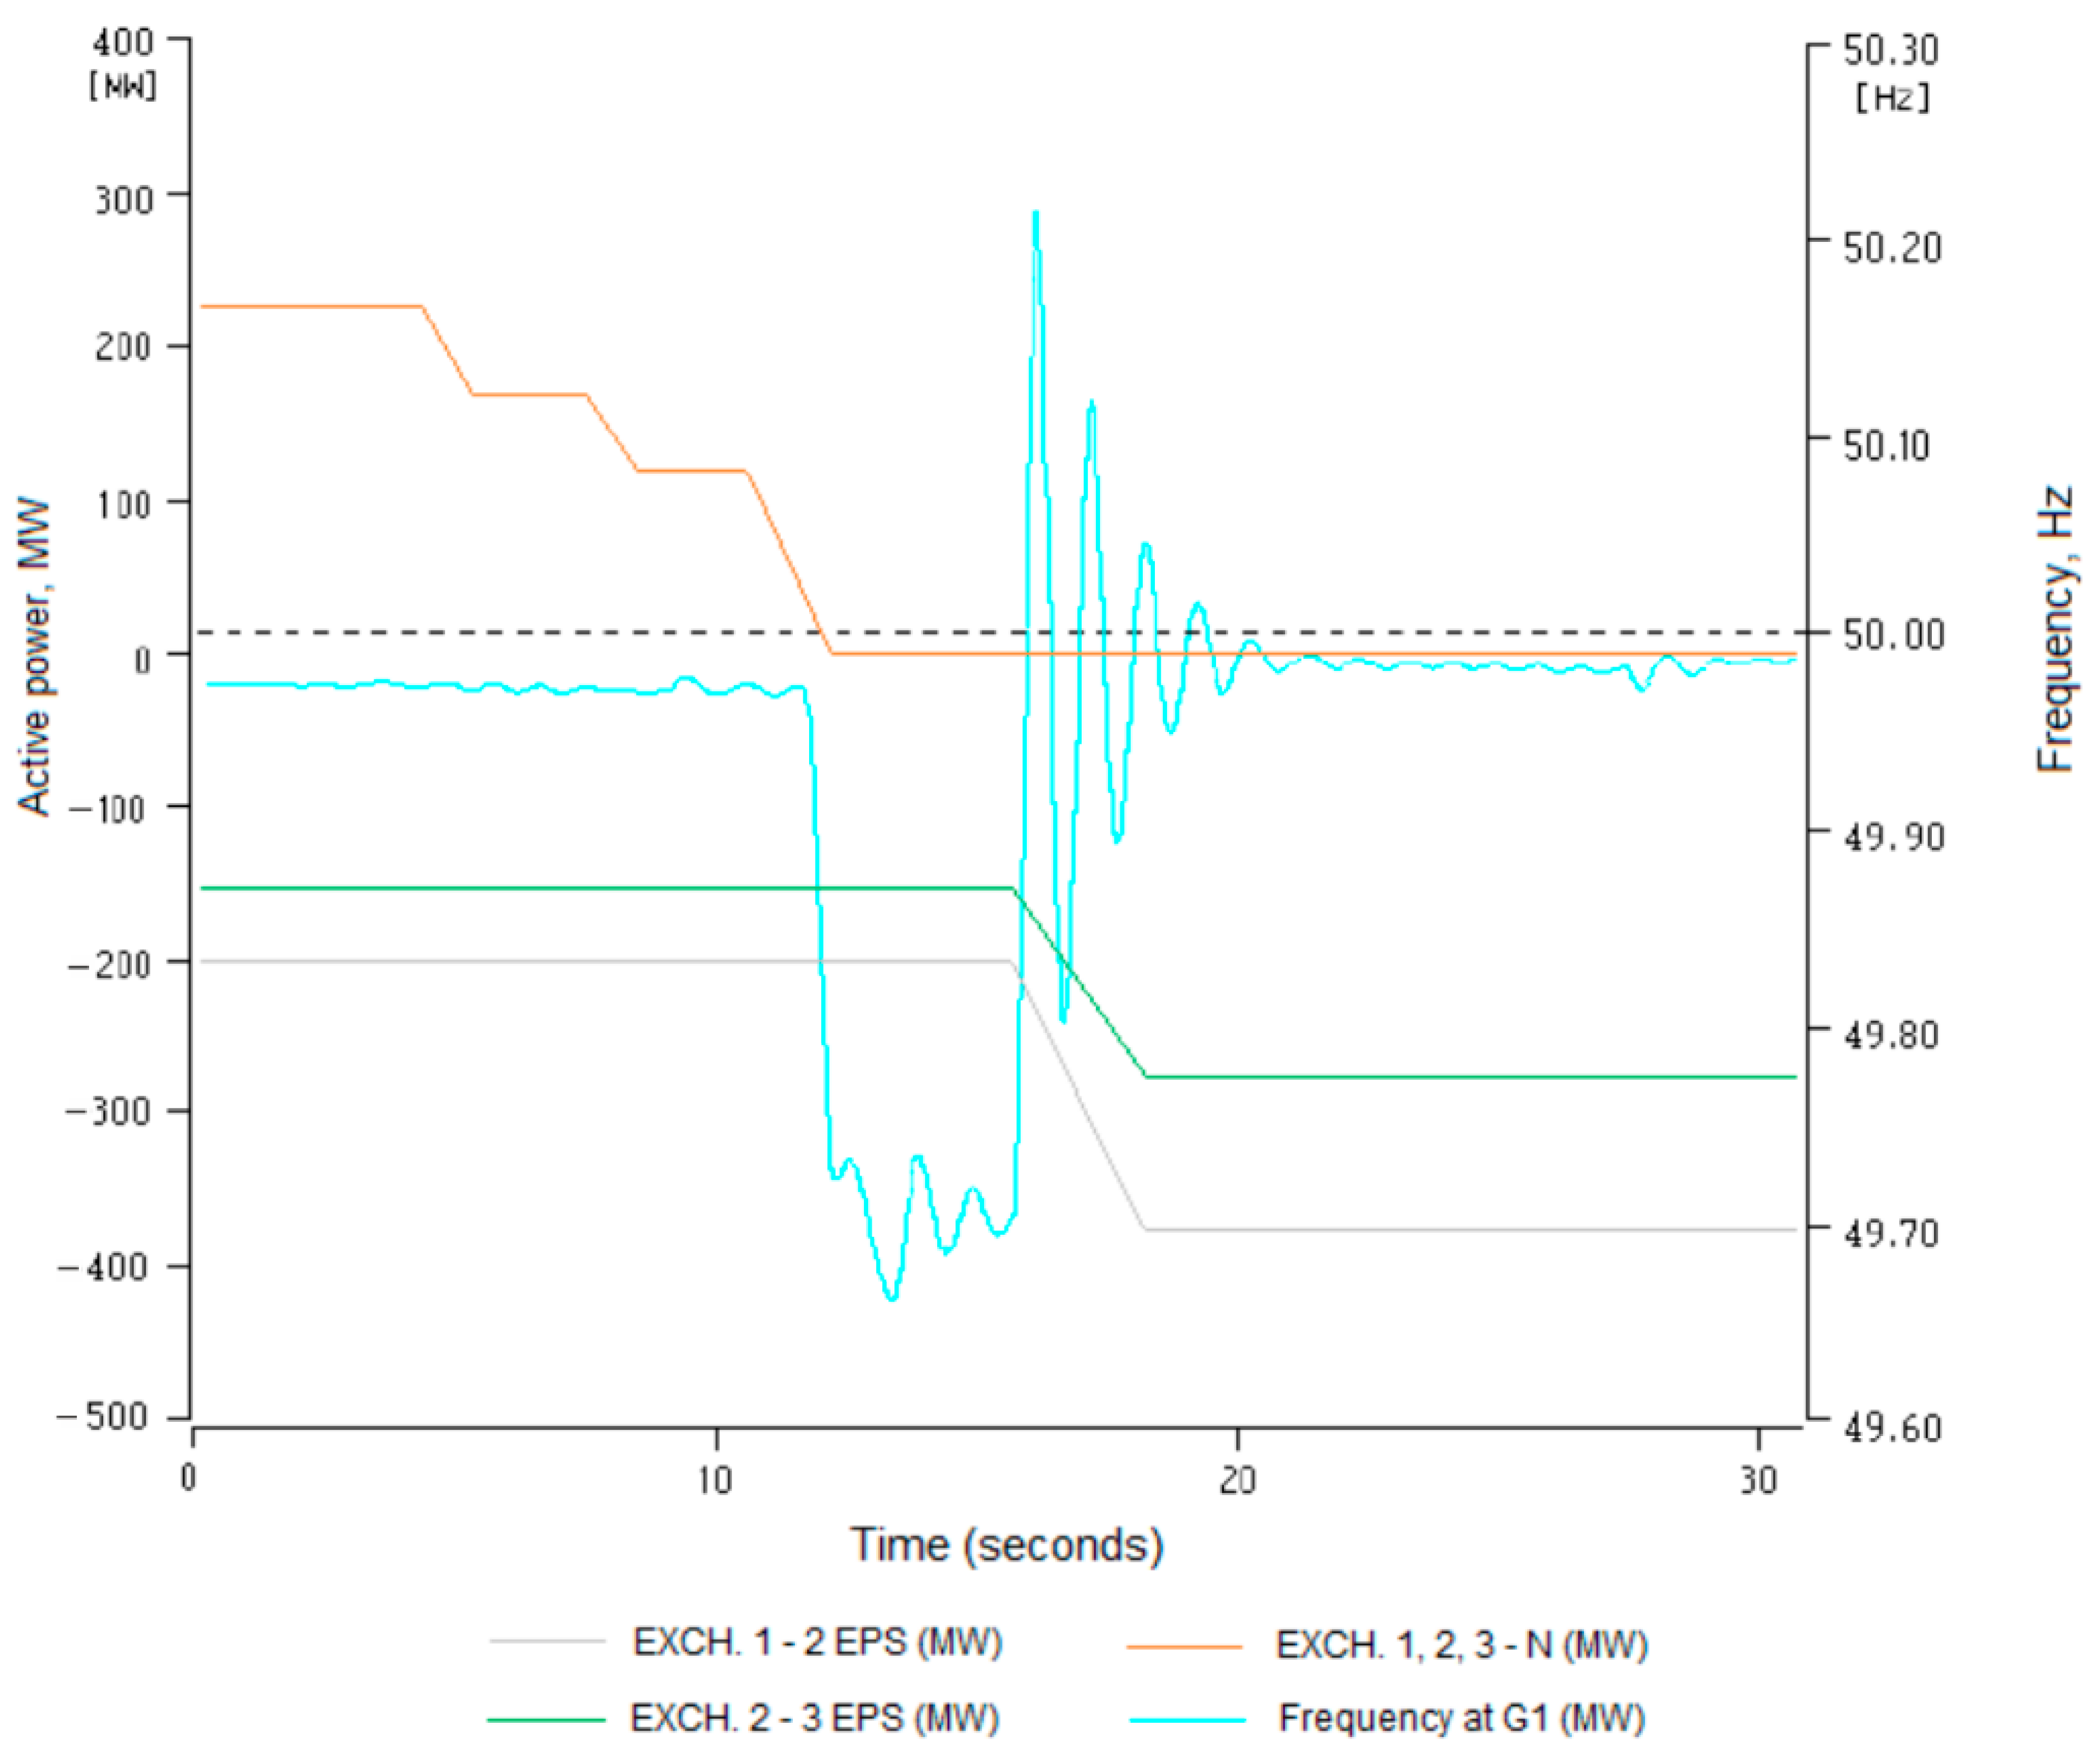
The second step is switching off the part of EPS (part No.1, part No.2, and part No.3) switching off isolated operating mode from the large and stabile EPS, this time in parallel, switching off overhead lines from OHL1 to OHL7 (see
Figure 1). The exchange active power between the stabile EPS and the regional EPS in isolated operating mode changes from 225 MW to 0 MW. The frequency deviation of EPS is shown in
Figure 11.
After the reduction in throughput between EPS parts from 225 MW to 0 MW, EPS part No.1 operates the G3–G6 FCR of generators. The FCR function of these generators is always on and their insensitivity limit is close to 10 mHz. The increase in EPS load (up to 225 MW) affects the frequency change, which is already more pronounced this time. The frequency drops to 49.65 Hz. System bandwidths are also loaded with the size of the load, i.e., transmission lines between EPS part No.1 and No.2 and between No.2 and No.3. EPS parts No.1, No.2 and No.3 are in isolated operation. Actions in isolated operation are balancing the system and controlling the voltage.
The voltage level increases at all isolated EPS parts, No.1, No.2, and No.3, because of unloaded energized lines in isolated parts of system. The voltage values increase to 364–365 kV, so it is necessary to react immediately and take actions to reduce the voltage values. Switching on shunt reactors is perfect for this. A very effective way to control the voltage is to disconnect the unloaded 330 kV overhead lines. After doing so, the 330 kV voltage in isolated EPS parts No.1, No.2, and No.3 stabilizes to permissible values. If these means to suppress voltages are not enough, it is necessary to use hydro aggregates that can work in SC mode [
1].
Isolated Power System Trips Simulation
Reaction of the isolated EPS to disturbances:
- (a)
Tripping of the generator G5 + FCR (generator 80 + 55 = 135 MW) at EPS part No.1. Activation of additional power (FCR of generators: G3, G4, and G6) at EPS part No.1 restored the frequency back to 50 Hz. Frequency deviation of isolated EPS shown in
Figure 12.
After the reduction in active power generation in an isolated EPS from 135 MW to 0 MW, in the EPS part No.1 operates G3, G4, and G6 FCR generators. The FCR function of these generators is always on and their deadband is close to 10 mHz. As the isolated EPS increased the load to 135 MW, the frequency change is pronounced. The frequency drops to 49.72 Hz. The loading of the system’s bandwidths, i.e., transmission lines between EPS part No.1 and No.2 and between No.2 and No.3 is presented in
Figure 12. The voltage level is stable at all isolated EPS. The voltage values in EPS nodes are 357–360 kV.
- (b)
The second generator G15 (248 MW) trips at part No.3 of the EPS. The activation of additional power (FCR of generators (G3, G5, G11, G12)) and HVDC3 at EPS parts No.1, No.2, and No.3 restored the frequency back to 50 Hz. The frequency deviation of the isolated EPS is shown in
Figure 13.
After the reduction in active power production in the isolated EPS from 248 MW to 0 MW, EPS parts No.1, No.2, and No.3 of generators G3, G5, G11, G12 and HVDC3 FCR operate. The FCR function of these oscillators is always on and the blind band is 10 mHz. When the isolated EPS increased the load to 248 MW, the frequency change becomes pronounced. The frequency drops to 49.4 Hz. The loading of the system’s bandwidths, i.e., transmission lines between EPS parts No.1 and No.2 and between No.2 and No.3 is presented in
Figure 13. The voltage level is stable in all isolated EPS. Voltage values in EPS nodes are in the range 357–360 kV.
- (c)
The biggest active power HVDC1 (300 MW) unit is tripped at EPS part No.1. The activation of additional power (FCR of generators (G3, G5, G6, G11, G12)) and HVDC2 at EPS part No.1 and part No.2 restored the frequency back to 50 Hz. The frequency deviation of the isolated EPS is shown in
Figure 14.
After the reduction in active power generation in the isolated EPS from 300 MW to 0 MW, EPS parts No.1 and No.2 operate generators G3, G5, G6, G11, G12 and HVDC2 FCR. The FCR function of these generators is always on, with a deadband of 10 mHz. As the load on isolated EPS increases to 300 MW, the frequency change is very pronounced. The frequency drops to 49.25 Hz. Loading of the system’s bandwidths, i.e., transmission lines between EPS part No.1 and No.2 and between No.2 and No.3, is presented in
Figure 14. The voltage level is stable at all isolated EPSs. Voltage values in EPS nodes are in the range 355–359 kV.
When the active power generation in the isolated EPS decreases to more than 300 MW, the frequency drops to the critical limit of 49.2 Hz and the UFLS starts to operate.
7. EPS Synchronization with the Synchronous Area
For an isolated EPS to be connected to a synchronous power system, the isolated EPS must maintain stable parameters, such as active power generation, frequency, import/export stable timing via HVDC, and low and steady load variation. In addition, the isolated EPS must maintain sufficient inertia magnitude, active and reactive power reserves, FCR, and FRR. The system needs to have the means to manage the voltage and the generation source must not exceed the allowed maximum value of 300 MW. Intraday trading must be limited to 0 MW throughout this period [
37,
38,
39,
40]. In addition to the above requirements, for successful synchronization of an isolated EPS with a synchronous system, the following technical conditions for this synchronization must be fulfilled:
Voltages of two EPSs must be equal (difference not exceeding ΔU < 0.05UN);
Phase sequence of two EPS voltages must be the same;
Frequency of two EPS voltages must be the same (difference not exceeding Δf <0.1 Hz);
Voltages of two EPSs must be of the same phase at the moment of switching on (difference between the vectors of the same phase not exceeding ±15°).
To fulfil the synchronization conditions, the reactive power influence of the overhead/cable lines within the system on the EPS has to be calculated and assessed. Charging reactive power (MVar) per 100 km is shown in
Table 5.
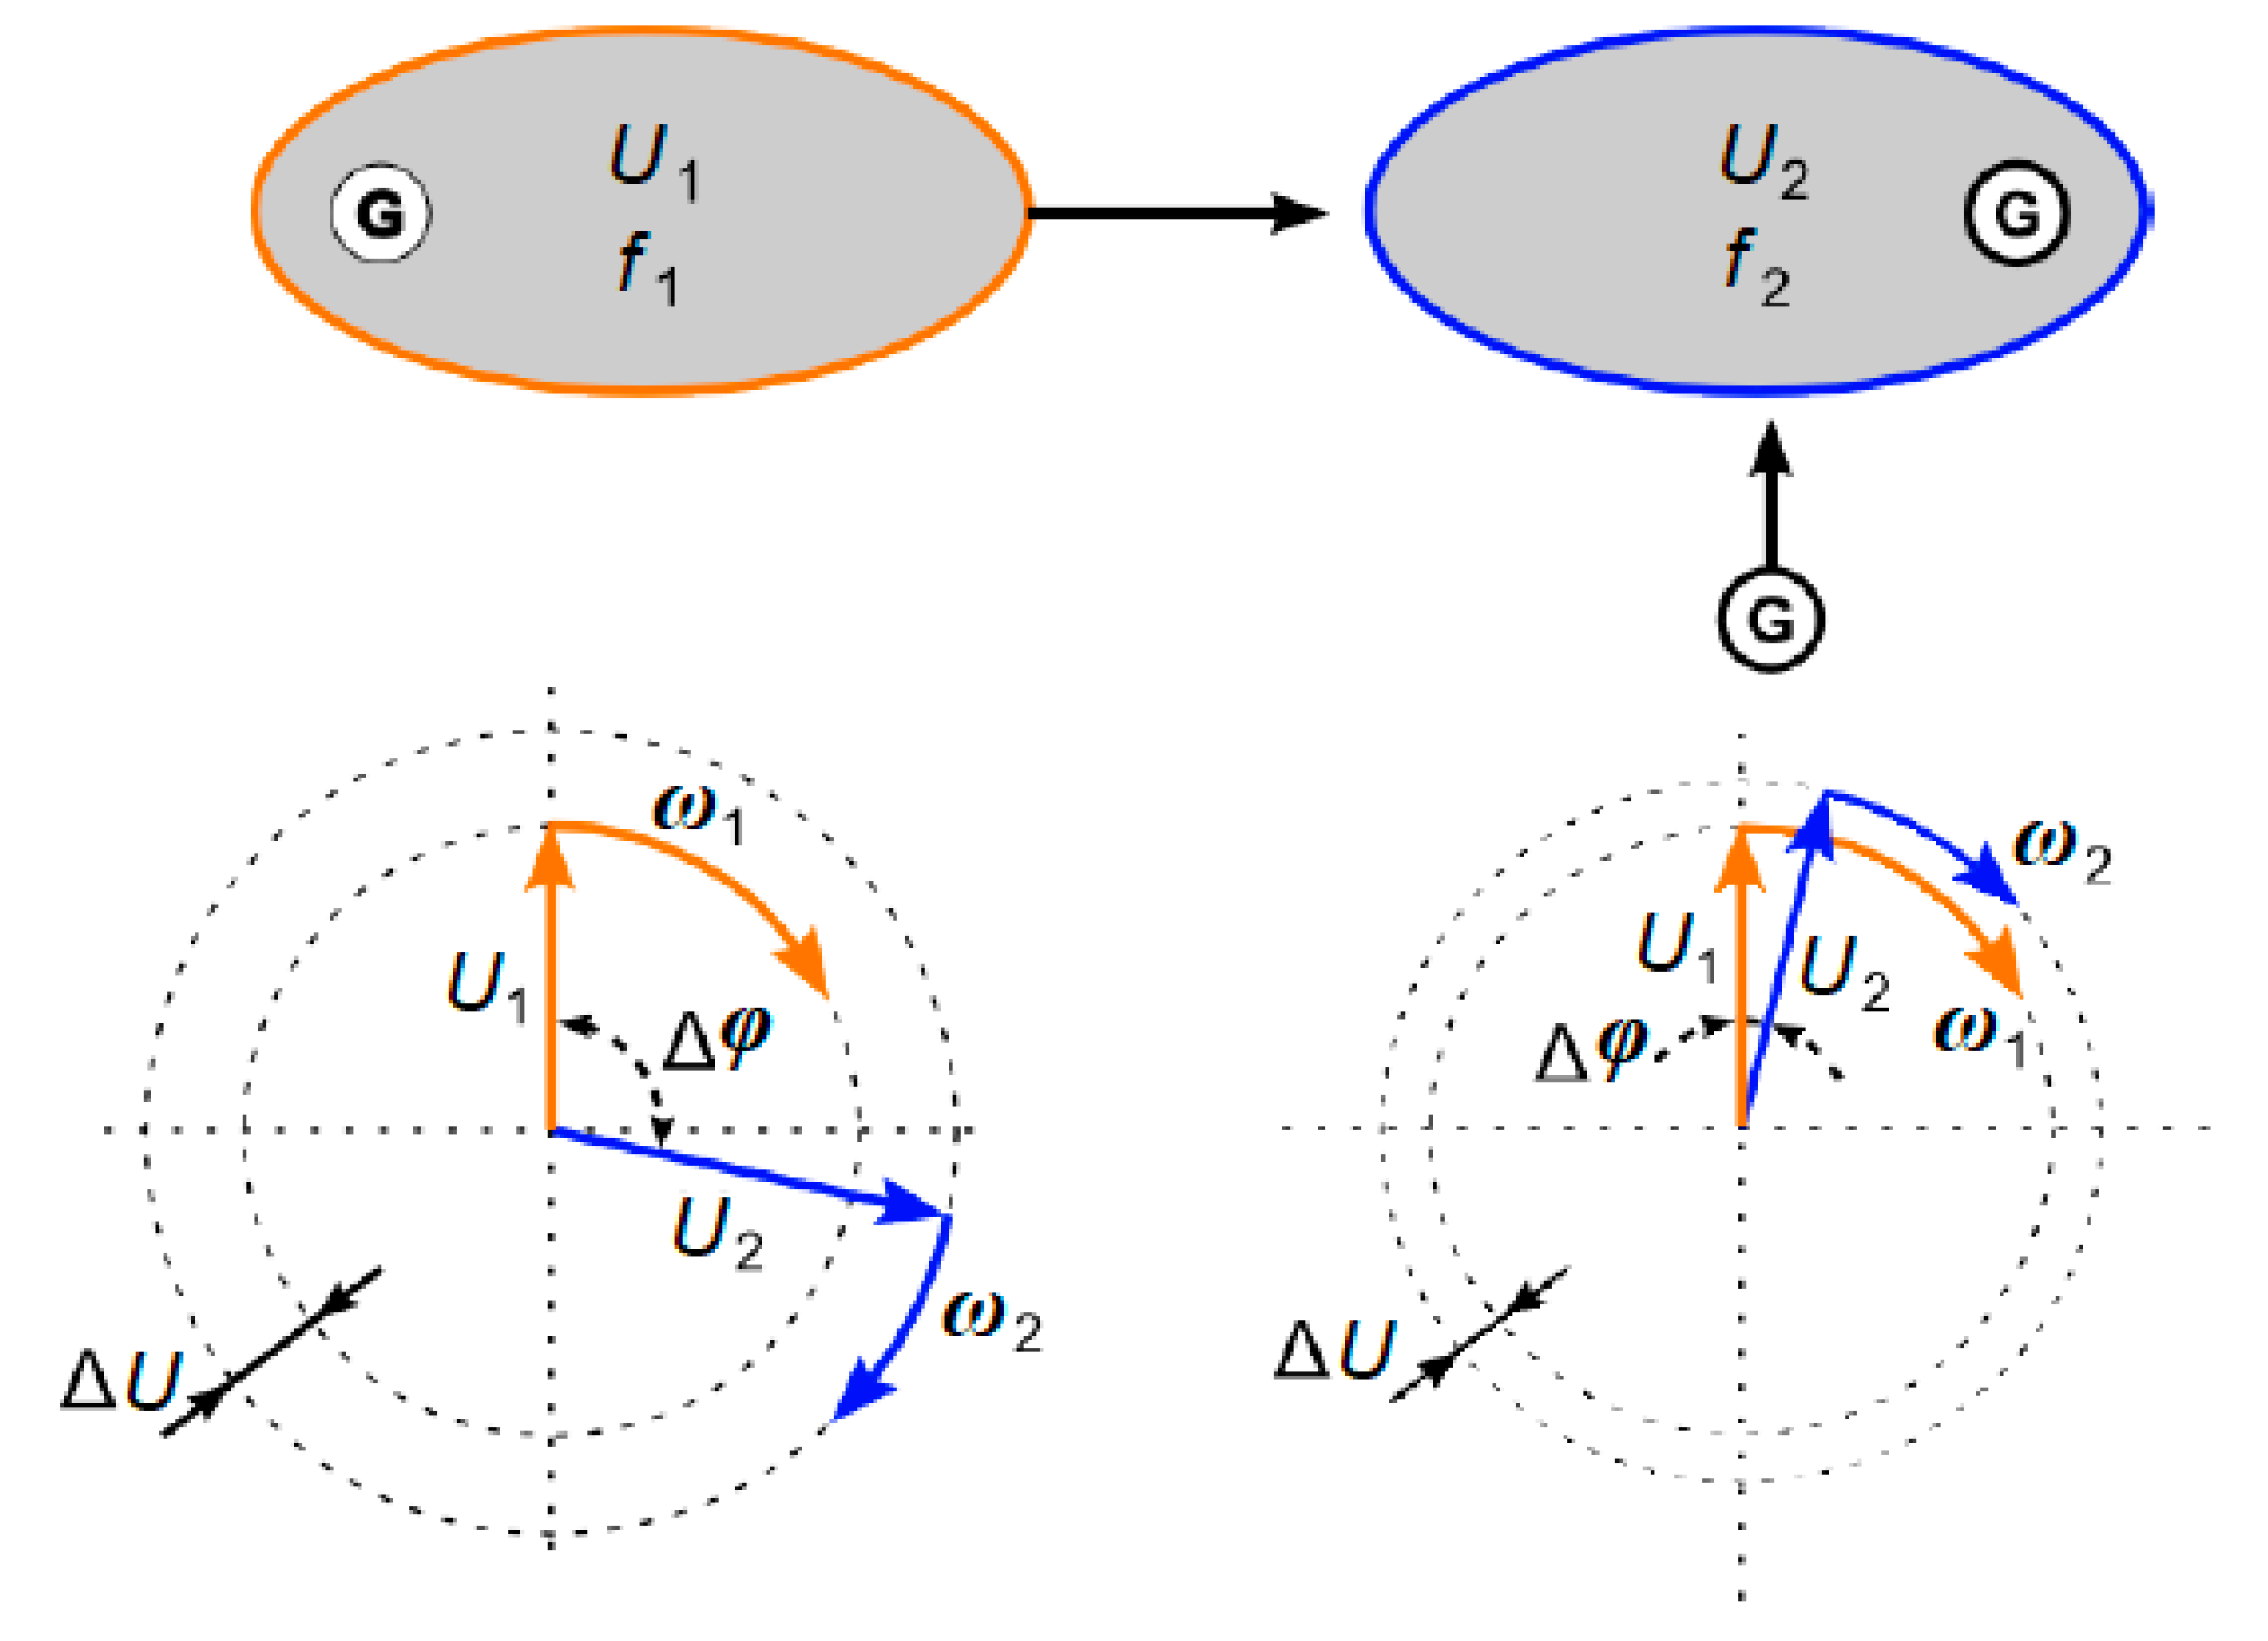
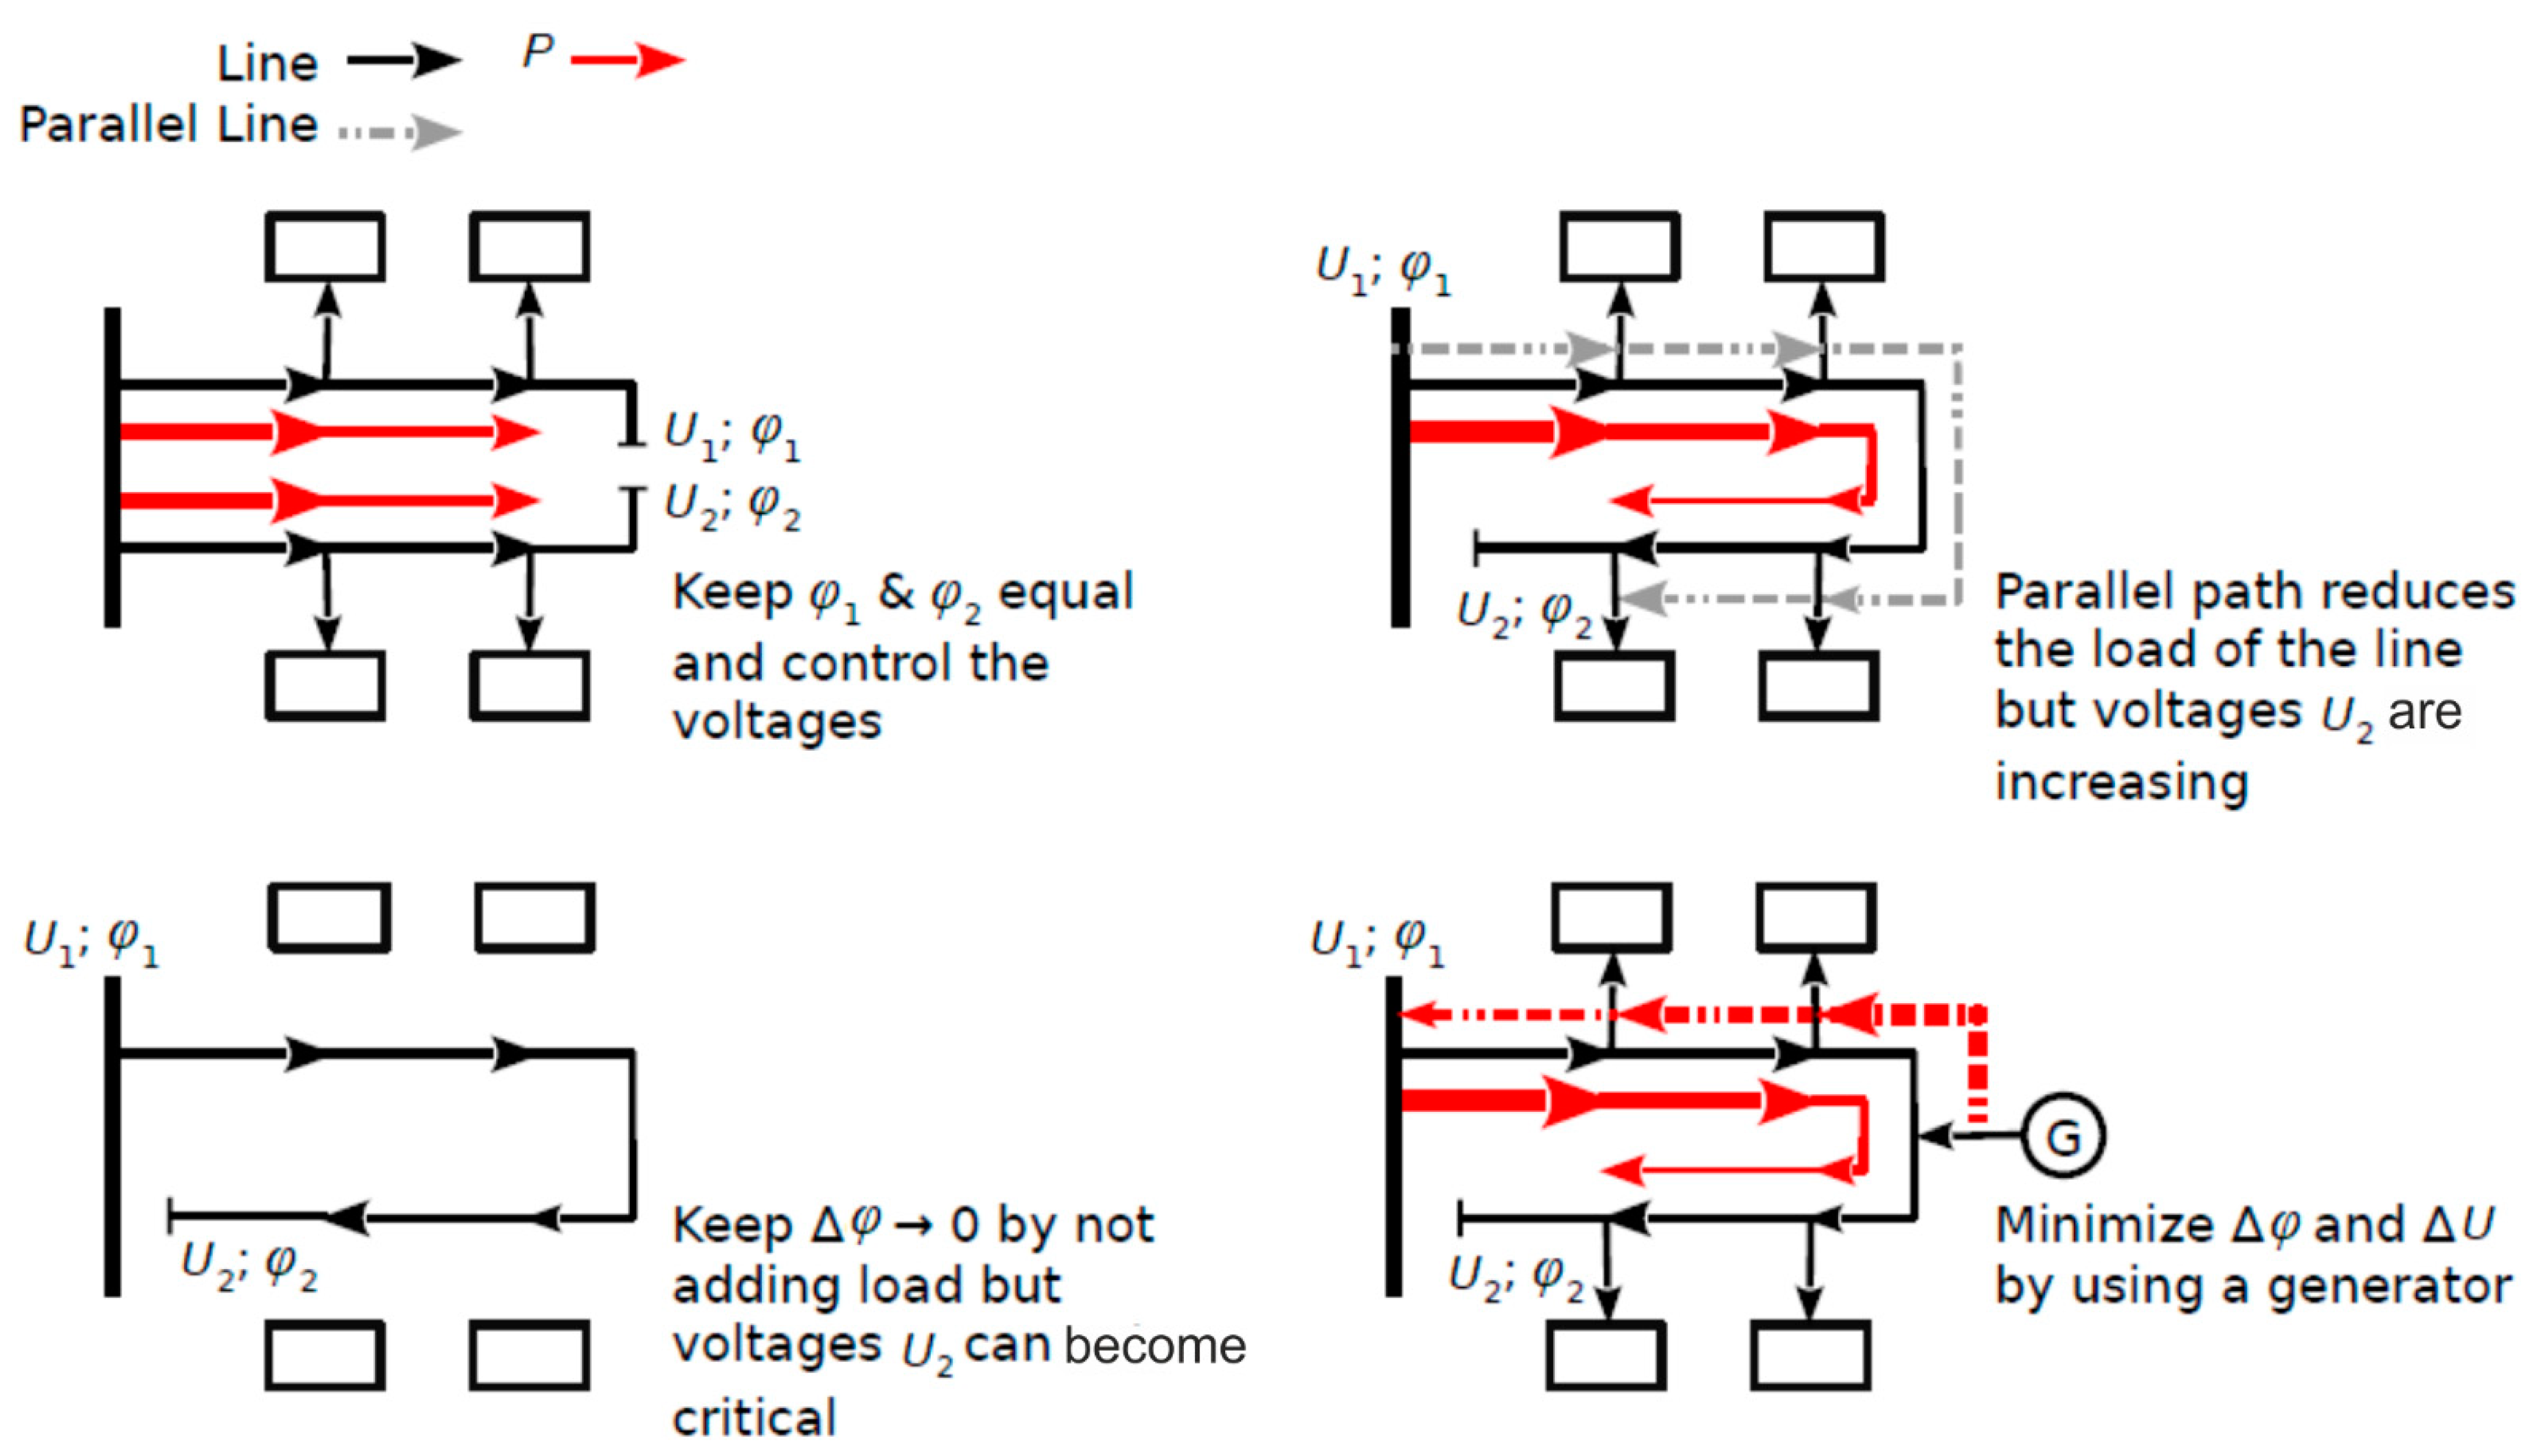
To ensure the smoothest and most reliable synchronization of two EPSs, the second and additional transmission lines must be put into operation as soon as possible. The EPS synchronization process can be carried out as described below (see
Figure 15).
In a case where two EPSs with active power transfer and connected load have different modes, the synchronization of two EPSs requires maintaining the phase difference angles
φ1 and
φ2 of two EPSs at the same value and controlling the voltages
U1 and
U2. Reduce the phase difference angle Δ
φ and the voltage difference Δ
U of two EPSs using a generator. If the line is not loaded, the load is off and no active power is transmitted through the line, then the phase difference angle Δ
φ between two EPSs will be maintained at 0 and the load will not be switched on. However, this mode of operation has a high risk of significantly increasing the EPS voltage. If there is a second line, it reduces the load on the first line but increases the voltage on the first line. The synchronization conditions are implemented according to the requirements specified in
Figure 16.
The voltage difference between two EPSs is found as follows:
where
U1 is the voltage of the first EPS (kV), and
U2 is the voltage of the second EPS (kV).
The phase difference angle between two EPS voltages is calculated as follows:
where:
is angular frequency (s
−1),
t is time (s), the initial phase of the voltage (°).
The difference between two EPS frequencies is found as follows:
where
is the angular frequency of the first EPS (s
−1), and
is the angular frequency of the second EPS (s
−1).
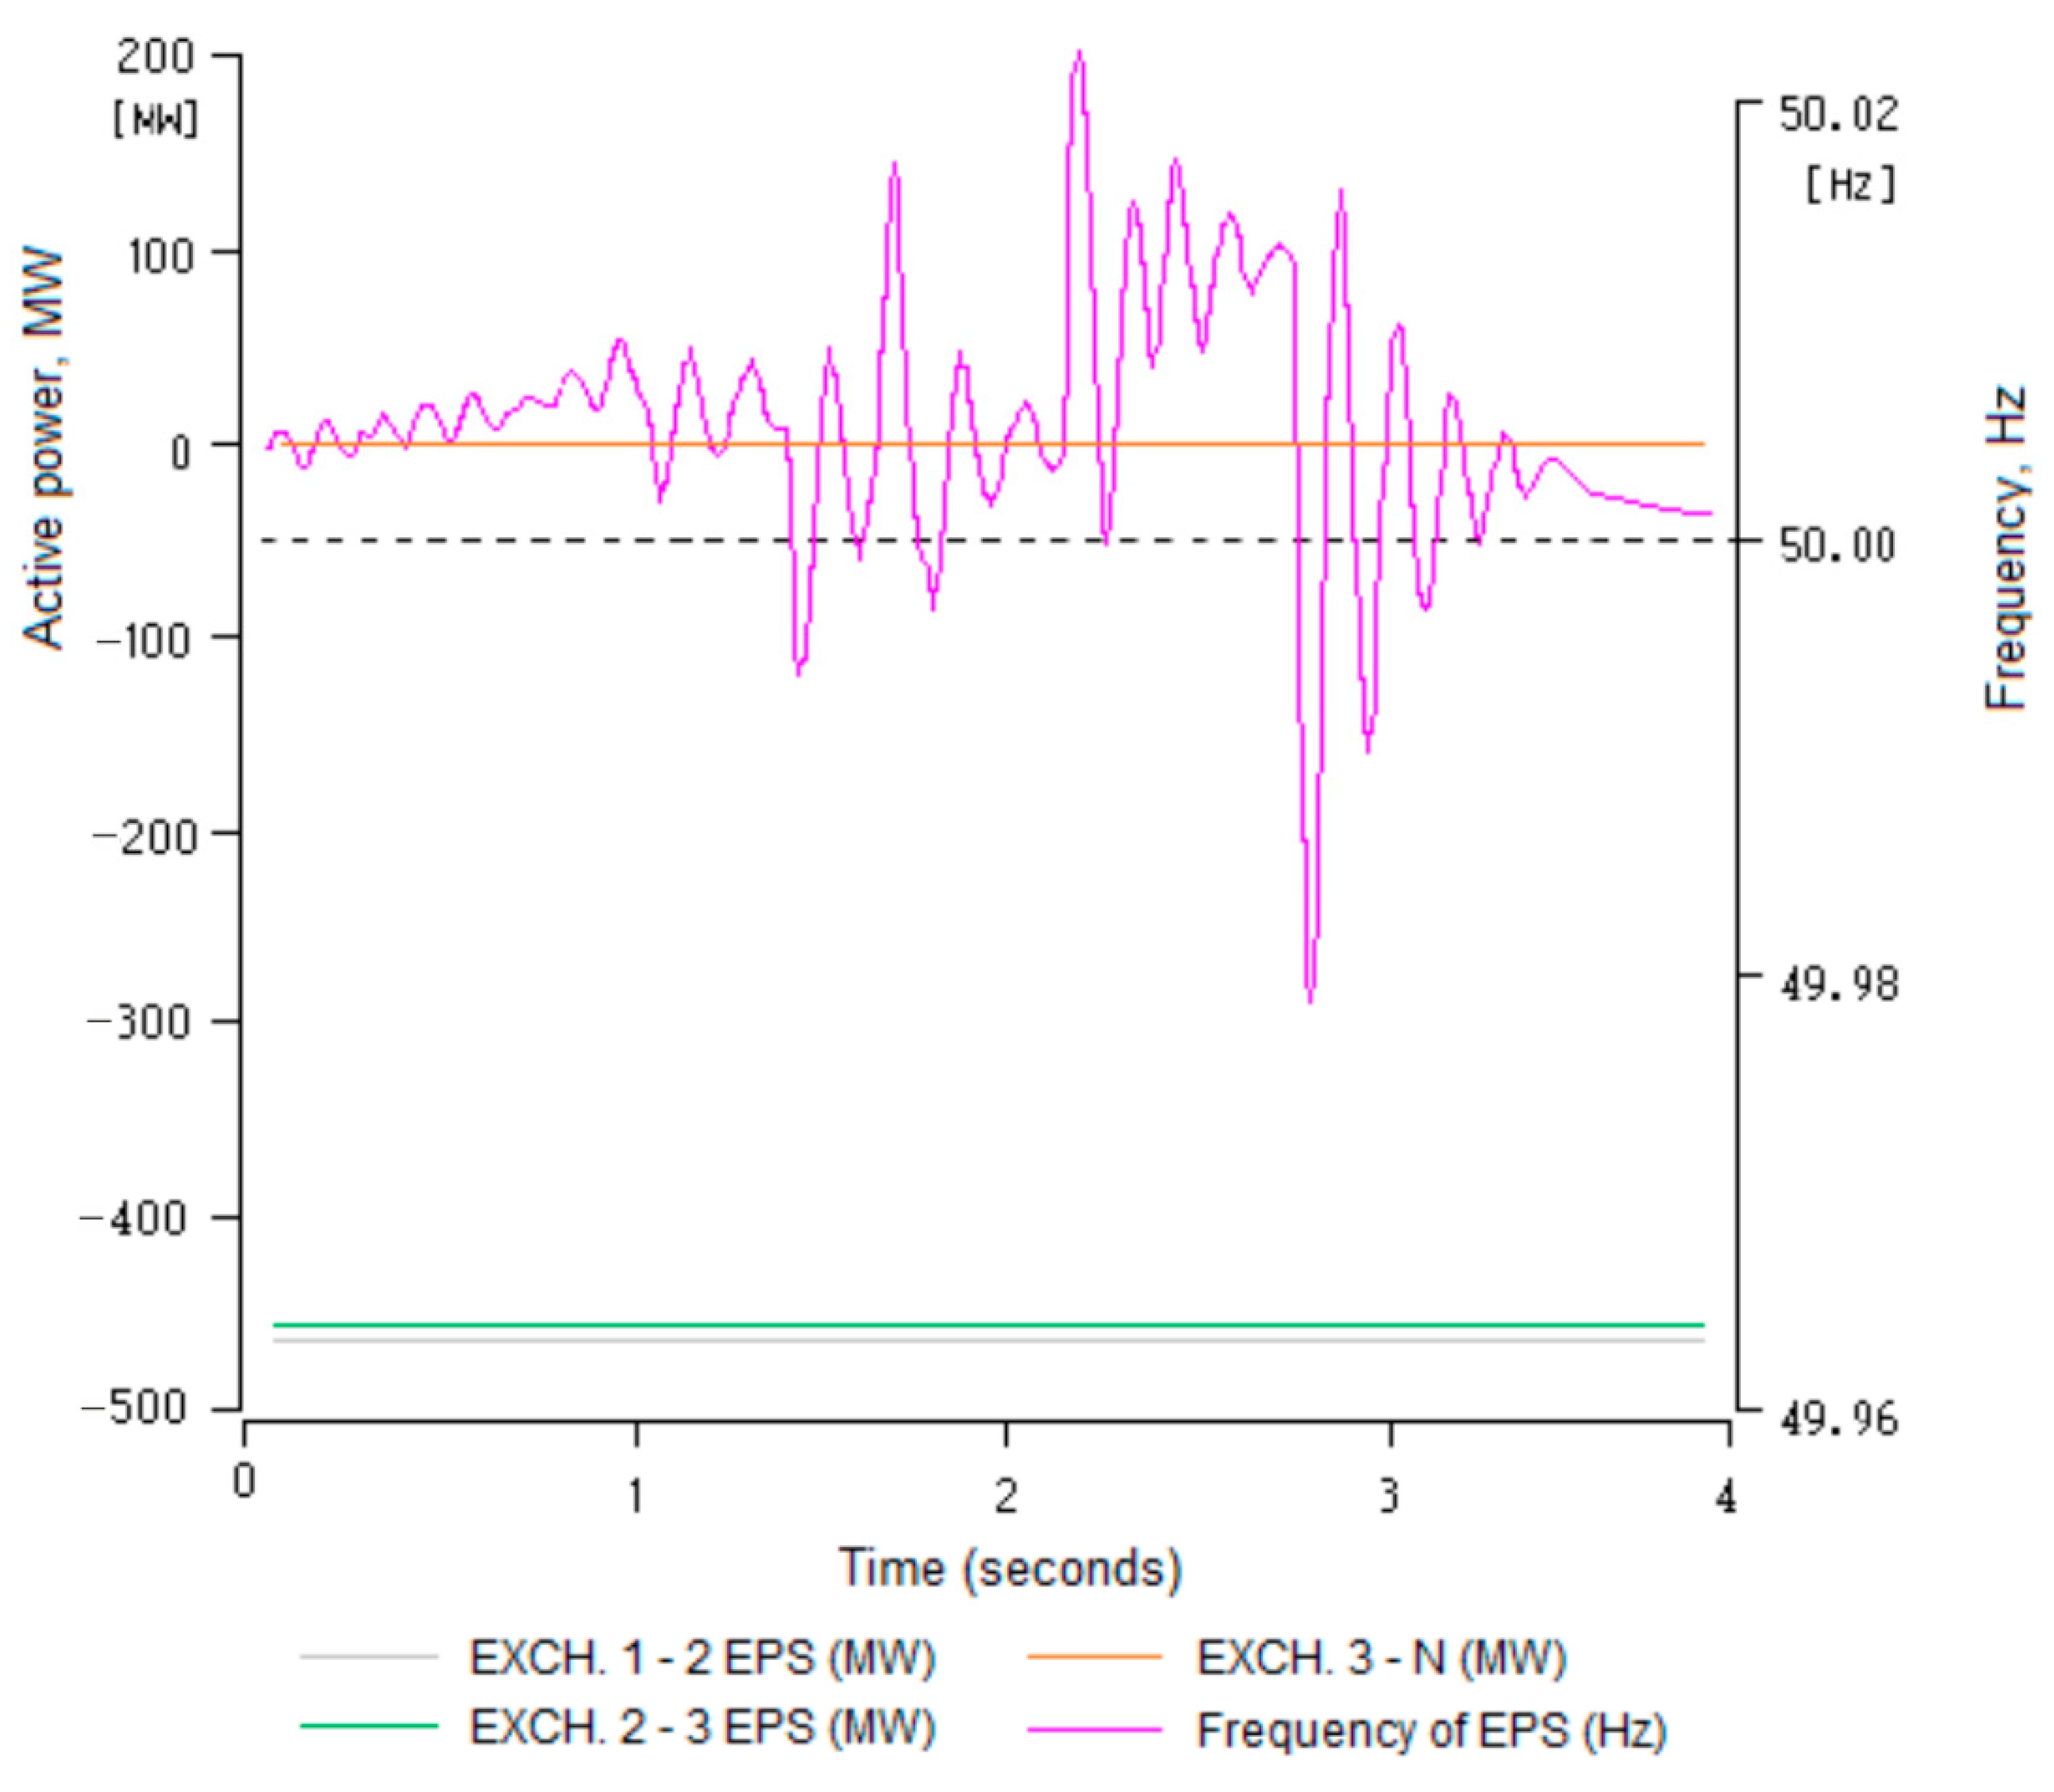
The frequency change after successful synchronization and the distribution of inter-system flows are presented in
Figure 17. Voltage values in the EPS nodes range from 355 to 358 kV.
During the synchronization of two EPS, a frequency fluctuation is observed during the transient process. The frequency ranges from 50.023 to 49.978 Hz and stabilizes.
8. Sequence of Actions after an Abrupt and Unexpected EPS Disconnection
Abrupt, non-planned EPS desynchronization from a synchronous area is relatively rare, and requires proper situation handling. A small, desynchronized, isolated power system is much more prone to suffer stability issues or even blackout. Mitigation of the risks related to the desynchronization of EPSs could be accomplished two ways: by proper preconceived analysis and planning and by proper real-time control. The primary task for the EPS operator during such events is to ensure stable EPS operation and prevent damage to its equipment, putting power-quality and efficiency-optimization requirements in the background. A clear plan of action and clarity on the aspects which must be considered in such situations could be the key to successful situation management.
The sequence of actions presented below will help to quickly and properly control the EPS after an unexpected and rapid reorientation from normal work mode to island mode. The sequence of actions is:
Assess the situation and the state of EPS;
Is power flow between different (neighboring) EPS equal to 0 MW?
Are all inter-system lines switched off?
Is sharing of SCADA data between different (neighboring) EPS disabled?
Are frequency deviations greater than ±0.2 Hz in the isolated part of the EPS?
Are sudden and significant deviations of the voltage level observed?
Are effects of UFLS on disconnected/isolated EPS noticed?
Is the EPS in a stable islanding mode after a sudden disconnection/isolation? (Yes/No);
Maintain the currently active power flow through the HVDC. The flow cannot be changed even if the results of the intraday electricity exchange are different.
- 9.1.
Set the intraday trading capacity for all EPS internal and external inter-system lines to 0 MW;
- 9.2.
Deactivate (if enabled) the FC function on the HVDC converter side of the neighboring EPS;
- 9.3.
Deactivate (if enabled) the aFRR function on the HVDC converter side of the neighboring EPS;
Assess/calculate the available primary active power reserve;
Bring into operation the power plants that can provide sufficient primary active power reserve (must not exceed 300 MW);
Check the active power regulation FCR and aFRR for the power plants and/or enable the active power regulation;
Check whether criterion n–1 is met in the EPS (Yes/No);
- 13.1.
Switch on the 330 kV lines undergoing repair work and the reserve lines;
Check whether the maximum generation source exceeds the specified value of 300 MW (also HVDC) (Yes/No);
- 14.1.
In existing power plants, increase active power generation up to the technical maximum (must not exceed 300 MW) by an amount that is compensated to reduce the source of generation;
- 14.2.
Switch on the generators of the power plants (must not exceed 300 MW) at the correct level to compensate for the reduction in the generation source;
- 14.3.
Reduce the capacity of the generation source up to 300 MW, if it exceeds this value;
Check whether the inertia of the EPS is sufficient (Yes/No);
- 15.1.
Switch on power generators or synchronous compensators to increase inertia;
Check whether the voltage in the EPS is within the permissible limits (Yes/No);
- 16.1.
Switch on shunt reactors to control the voltage;
- 16.2.
Switch on the synchronous compensators of the power plants;
Maintain the frequency of the EPS higher than the critical value of 49.20 Hz;
Redistribute active power flows;
- 18.1
Arrange for the operation of HVDC interconnectors, with the active power flow to be redirected to the isolated EPS (must not exceed 300 MW);
Enable FC in HVDC interconnection;
Activate active power reserves from the cold reserve with a start-up time of about 12 h;
Increase active power generation to the technical maximum (must not exceed 300 MW) in the operating power plants;
Assure proportional distribution of the active power generation among the three EPS;
Switch on the 330 kV lines undergoing works and the lines in reserve;
Determine to what extent and where the UFLS has operated;
Gradually (in steps of up to 50 MW) increase the generation of the power plants (the total capacity must not exceed 300 MW) by the amount that is intended to compensate for the effect of UFLS;
Restore the load/users disconnected by UFLS;
Monitor whether the EPS frequency is within the permissible limits (Yes/No);
- 27.1.
Gradually (in steps of up to 50 MW) increase the generation capacity of the power plants (total capacity must not exceed 300 MW);
Check whether the baseload generation is distributed proportionally to all parts of the EPS (Yes/No);
If necessary, shut down wind power plants;
If the available generation sources cannot meet the total demand for electricity, the load must be disconnected manually (load disconnection must be evenly distributed in each part of the EPS);
Assess the effect of UFLS and pre-emergency automation (PA) on the steady-state operation of the EPS.
The algorithm for the sequence of steps is shown in
Figure 18.
Each EPS is unique and individual in its structure, size, and geographical implementation. As the presented algorithm reveals the main sequence of actions, their order and the main aspects, which must be considered during desynchronization and operation in islanded mode, it could be easily adopted for any particular electric power system.
9. Discussion
This research aimed to investigate the behavior of electrical power systems (EPSs) during desynchronization from a synchronous area and their ability to operate and withstand disturbances in islanded mode. Synchronization of the system was considered as well. The main factors related to EPS’s desynchronization/synchronization and its operation in islanded mode were indicated, researched, and discussed.
The rapid identification of desynchronization is critical for EPS operators. The main signs of a sudden EPS disconnection from a shared EPS are SCADA control system data which indicate that connecting devices of the inter-system lines to the shared EPS (on the side of the shared EPS) are disabled are that the active power flows through the inter-system transmission lines equal 0 MW and sustained deviations in frequency (greater than ±0.2 Hz) and voltage (above 362 kV in 330 kV network) are observed.
The most important key factors affecting the response of an EPS to a sudden disconnection are the power balance of the disconnected EPS, including the active power flows from neighboring EPSs; the number of power plants operating in the isolated EPS and their FCR; the amount of inertia remaining in the disconnected EPS; the remaining active power reserve through HVDC interconnectors; and the EPC of the interconnectors and loads of the insulated EPS, i.e., UFLS automatic self-regulation.
The more generators operate in the islanded EPS, the more generators are available with the FCR function, enabling lower frequency variation in the system. Another very important aspect is the k factor of the EPS. Its calculation is useful when the system frequency varies in the range of 0.2–0.25 Hz and the EPS itself is in a quasi-static state, i.e., when the frequency variation (Δf) is in the range of 0.2–0.3 Hz. The situation after an unscheduled disconnection in an isolated EPS is untoward if it has small inertia, if FC and FCR functions remain inactivated in the HVDC interconnections, and if the HVDC interconnections are at maximum load, the isolated EPS has insufficient FCR and not enough generators in operation, or the power reserve of the operating generators is too low for primary regulation.
To determine the operation and reliability of the EPS, consisting of three parts with known parameters, during its desynchronization, in islanded mode, and in synchronization, numerical simulations were caried out with a widely used power-system simulation package. The analysis revealed that the most effective control of generators is observed when their generation range varies from 50 to 300 MW and the FCR of the generators varies from 50 to 170 MW. The simulations showed that the frequency gradient of the EPS restoration with a single generator is too low. The frequency restoration with several generators determines the higher gradient of generators (sum of involved generators) and lower frequency deviation. It was defined that none of the generators operating in the islanded EPS should be driven to the maximum (nominal) value and they could exceed the power limit of 300 MW. The amount of electrical power generation and its management must be distributed evenly across all three parts of the EPS. Frequency deviation in the system does not exceed 200 mHz for disturbances of lower than 100 MW in the islanded EPC, when the FC function of the HVDC converters is disabled. The maximum permissible disturbance that can occur in the analyzed isolated EPS amounts to 300 MW. This causes the frequency to drop to 49.25 Hz in the EPS, which is close to the critical limit of 49.2 Hz where the UFLS is triggered.
Analysis revealed that voltage increases of up to 365 kV are observed in the isolated EPS when the HVDC converters are operating without the FC function. In response to the voltage increase and control, it is recommended to maintain the voltage below 357 kV.
During the EPS operation in islanded mode, it is recommended to check and switch on the generators that can support the FCR function with parameters such as dead-band db = ±10 mHz corresponding to 4% droop. Optimal FC parameters for HVDC converters are: gain K = 420 MW/Hz corresponding to 4% droop, ramp speed = 200 MW/s, dead-band db = ±10 mHz, delta power limit ±50 MW. HVDC must operate with harmonic filters enabled.
Restoring the EPS from emergency (isolated operation) to normal operation requires energizing the grid, restoring the operation of power stations and substations, and resuming the supply of electricity to consumers. The frequency and voltage parameters of the EPS must be continuously monitored and controlled.
10. Conclusions
The resilience of power systems must be considered with great concern, as power outages in contemporary economics lead to huge losses. Modern power systems face a wide range of risks related to cyberattacks or even non-technical factors such as geopolitical tensions. The rapid spread of generation from renewable power sources ensures the decreased inertia of the systems. The factors mentioned increase the chances for power systems to suffer serious and unfavorable events causing desynchronization, islanded mode operation, or even blackouts, and decrease their capabilities to withstand these. The issue must be handled comprehensively, from identifying a power system’s capability to remain stable during these events and strengthening cyber-security, to the application of the technical means to increase its stability.
The results of this research have proved that the analyzed system is capable of withstanding desynchronization and remaining stable during disturbances in the islanded mode. Nevertheless, the ongoing growth of generation from renewable power sources, particularly in real-world scenarios with restricted availability of some turbo- or hydropower units or HVDC links, requires the consideration of means for further reliability improvement and desynchronization mitigation. Improving the stability of the system could be achieved by increasing the inertia of the system and by decreasing of its impedance. This could be achieved by entering additional turbo- and hydropower units, synchronous compensators, and energy- and power-storage devices, and by strengthening links of the transmission networks. As all these means require substantial financial investments, the improvement of the system’s reliability brings additional research tasks to identify the optimal mean, its optimal amount, and the optimal installation place.
The reliability of the system during desynchronization and operation in islanded mode could be assured by proper preconceived analysis and planning and proper real-time situation handling. The presented sequence of actions (algorithm) reveals the main aspects which must be managed during non-planned EPS desynchronization and operation in islanded mode (and how they are to be managed) and could be easily adapted to any particular power system.


