Article

The Thermal Analysis and Heat Dissipation Structure Optimization of a Propeller Driver System

School of Mechanical Engineering, Hangzhou Dianzi University, Hangzhou 310018, China
*
Author to whom correspondence should be addressed.
Appl. Sci. 2023, 13(13), 7495; https://doi.org/10.3390/app13137495
Submission received: 29 May 2023 / Revised: 21 June 2023 / Accepted: 22 June 2023 / Published: 25 June 2023

Abstract

:
The thermal performance of the propeller driver system is very important for underwater vehicles. A new kind of cylindrical heat sink is designed for a certain propeller driver system. The performances of the heat sink are analyzed, mainly using numerical methods. The thermal influences of structure parameters, such as base thickness, fins length, and fin number, are studied for the heat sink with an orthogonal experimental method. The results show that all three parameters have positive impacts on the heat dissipation of the driver. Compared with the fin numbers and the fin length, the base thickness has a relatively small impact on the working temperature of the driver. Compared to the initial design, the maximum temperature of the propeller driver drops by 22.3% with the designed novel cylindrical heat sink in the studied cases.

1. Introduction

In recent years, the intensification of marine resource exploration and development has led to an increased use of submarine robots and underwater vehicles. Among them, the propeller driver is used as a driving component to control the submersible robots and underwater vehicles to dive, float, advance, and retreat. Therefore, the stability of the propeller drive is becoming more and more important. The rapid development of electronic information technology has resulted in the miniaturization and high power density of various electronic devices [1,2,3], which are now widely used in propeller drives. The dense arrangement of electronic devices on the driver increases the heat flux density and the temperature rises rapidly, the driver is prone to overheating, and high temperature is one of the main reasons for the failure of electronic devices, which seriously affects the stability of the driver. Statistics show that electronic equipment failure caused by high temperature accounts for up to 55% every year [4,5,6,7]. Moreover, for every 10 °C increase in temperature, the reliability of the device is reduced by 50% [8]. When the device temperature is above 70 °C, reliability decreases by 5% for every 1 °C increase in temperature [9,10]. Therefore, the heat dissipation of the propeller driver device has become one of the main problems restricting the working stability of underwater vehicles.
Scholars have proposed many optimization methods for different electronic devices. These methods can mainly be classified into material optimization and structure optimization. For example, Wang [11] and others studied the influence of substrate material, bonding layer material, and package shell material on chip temperature. Coudrain et al. [12] studied the effect of silicon thickness, 3D interconnection, and packaging schemes on the temperature distribution of 3D chips. Timbs et al. [13] studied the heat dissipation performance of finned heat sinks made of thermally conductive polymer composites under forced convection conditions. The study found that carbon-filled polymer heat sinks have better heat dissipation capabilities than metal-filled polymer heat sinks. Arshad et al. [14] used a two-dimensional transient numerical simulation method to study the heat transfer performance of finned heat sinks based on phase change materials (PCMs) in the passive cooling of electronic devices. Transient numerical simulations were carried out using the finite volume method to investigate the coupled heat transfer and melting/solidification phenomena at different power levels. Hu et al. [15] studied the effect of PCM type, PCM porosity, and PCM material on heat sink thermal performance. Mozafari et al. [16] used numerical methods to study finned heat sinks embedded with single and multiple phase change materials and used the Nusselt number to characterize their heat transfer characteristics to compare their heat dissipation performance. The analysis compares the time to reach the transient average temperature for different cases.
However, most of the material-optimizing methods are limited by their processing cost, material strength, high-temperature resistance, and other factors. Therefore, they are difficult to use in underwater equipment. Therefore, structural optimization becomes mainstream. Zhu et al. [17] optimized the design based on the number and distribution mode of the heat sink; Yang et al. [18] studied the heat dissipation of the fin shape. Wang et al. [19] and Wang et al. [20] analyzed the structure of the microchannel heat sink. Zhang et al. [21] studied the influence of fin number and fin spacing on heat dissipation. Yang et al. [22] analyzed the heat dissipation characteristics of the microchannel by using experimental analysis and established the relationship between cooling water flow and temperature. Wu et al. [23] adopted the bionics method to optimize the structure of the heat sink shape. He et al. [24] designed a finned water-cooled heat sink and studied the influence of cooling water inlet and outlet positions, fin height, thickness, and spacing on the thermal resistance and flow resistance performance of the radiator. The study found that the heat dissipation performance of the central arrangement of the cooling water inlet and outlet is better than that of the diagonal arrangement, and the optimal fin coverage area of the radiator is almost equal to the chip area. Song et al. [25] studied the heat dissipation performance of a heat sink with perforated fins on a cylindrical base of a light-emitting diode (LED), and they studied the influence of the size of each fin of the heat sink and the number of perforations on the heat dissipation performance. Studies have found that a large number of small-sized perforations are beneficial to improve heat dissipation performance. Bello-Ochende et al. [26] used the finite volume method for numerical analysis of three-dimensional microchannels. The optimal geometric characteristics obtained numerically (the aspect ratio and the optimal channel shape (hydraulic diameter). Khalid et al. [27] used experimental methods to study the heat dissipation performance of finned heat pipes, finless heat pipes, and grooved heat pipes. Krstic et al. [28] studied the effect of heat sinks of different geometries on the heat dissipation of photovoltaic panels. Nemati [29] proposed a new method based on entropy generation minimization to optimize the plate fin heat sink. This equation can be used for both natural and forced convection.
However, the heat dissipation of propeller-drive devices has not been extensively studied until now. In this paper, we investigate the thermal performance of a specific propeller driver using both numerical simulations and experiments. To improve the working stability and reduce the temperature of electronic equipment, we design a new cylindrical heat sink for the driver. We use the orthogonal experimental method to analyze and discuss the effects of three structural parameters, namely base thickness, fin length, and fin number, on the heat dissipation performance of the heat sink.

2. Thermal Analysis of Propeller Driver

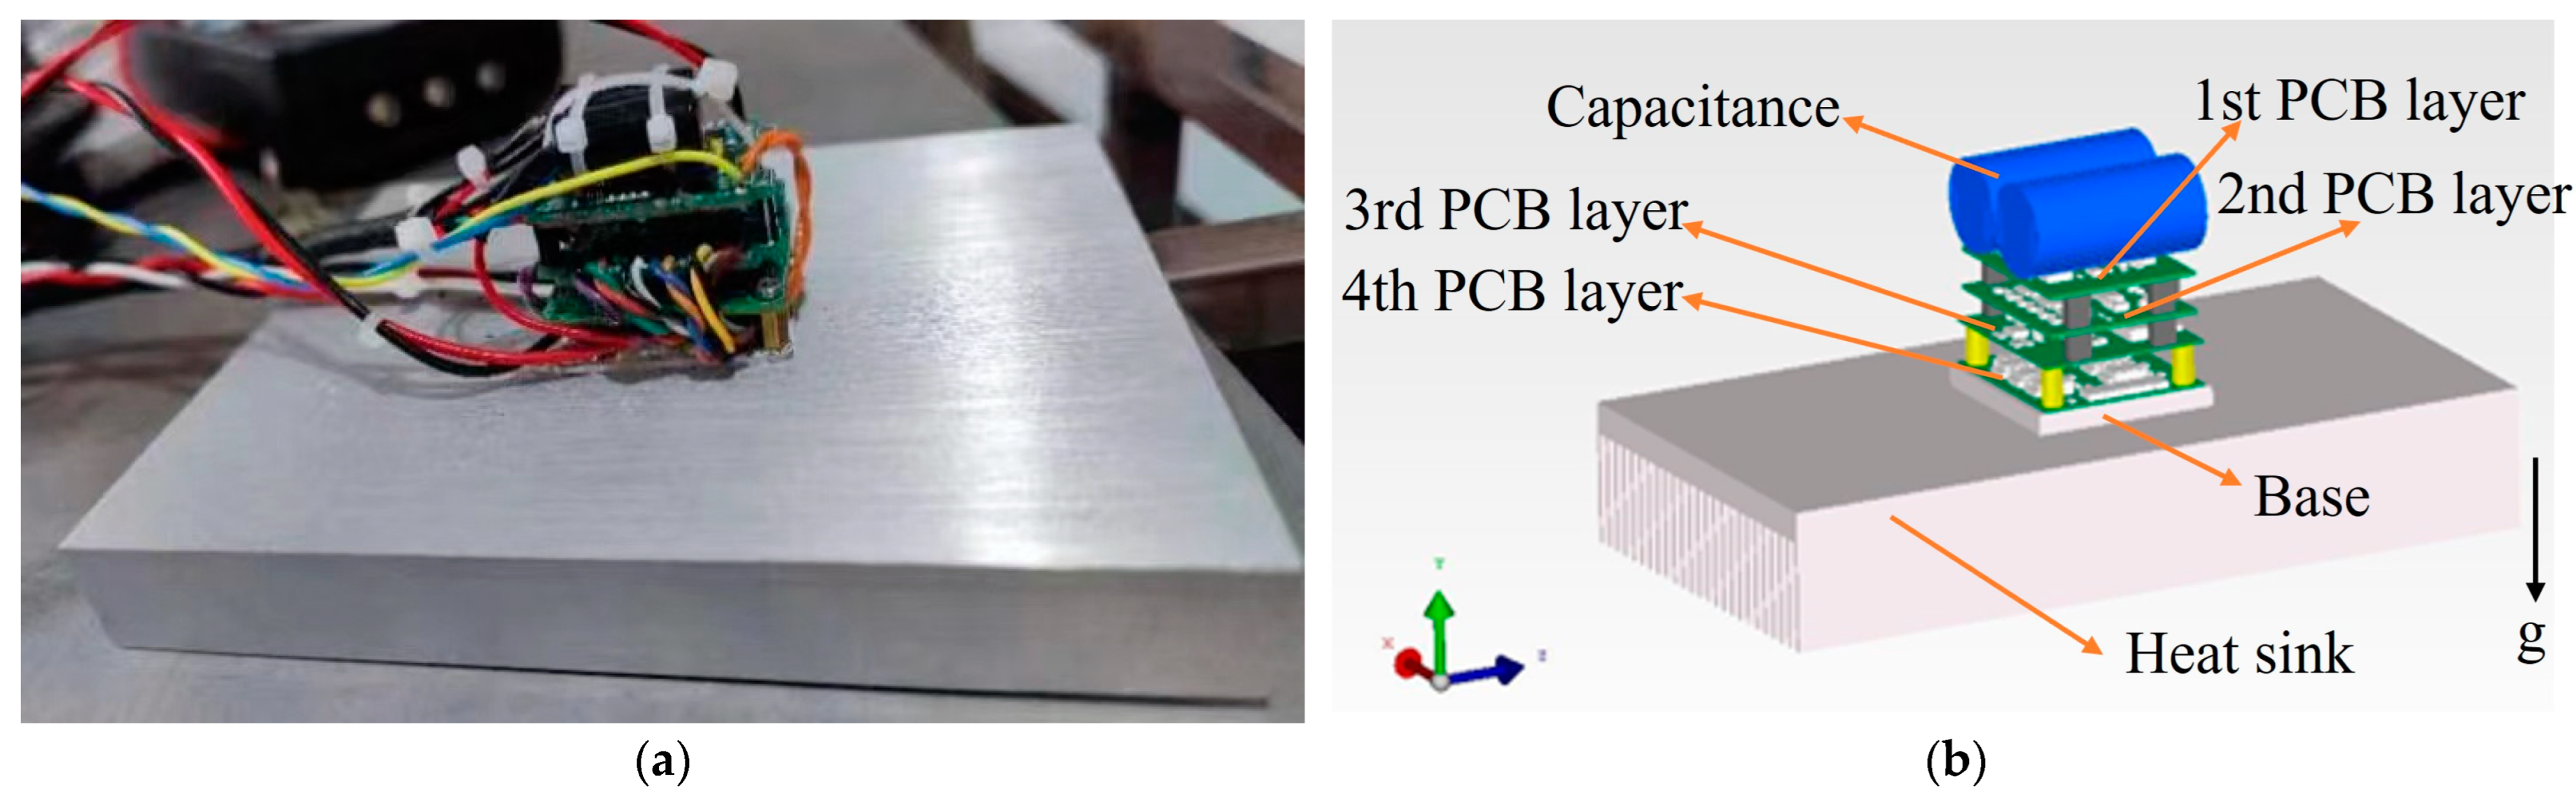
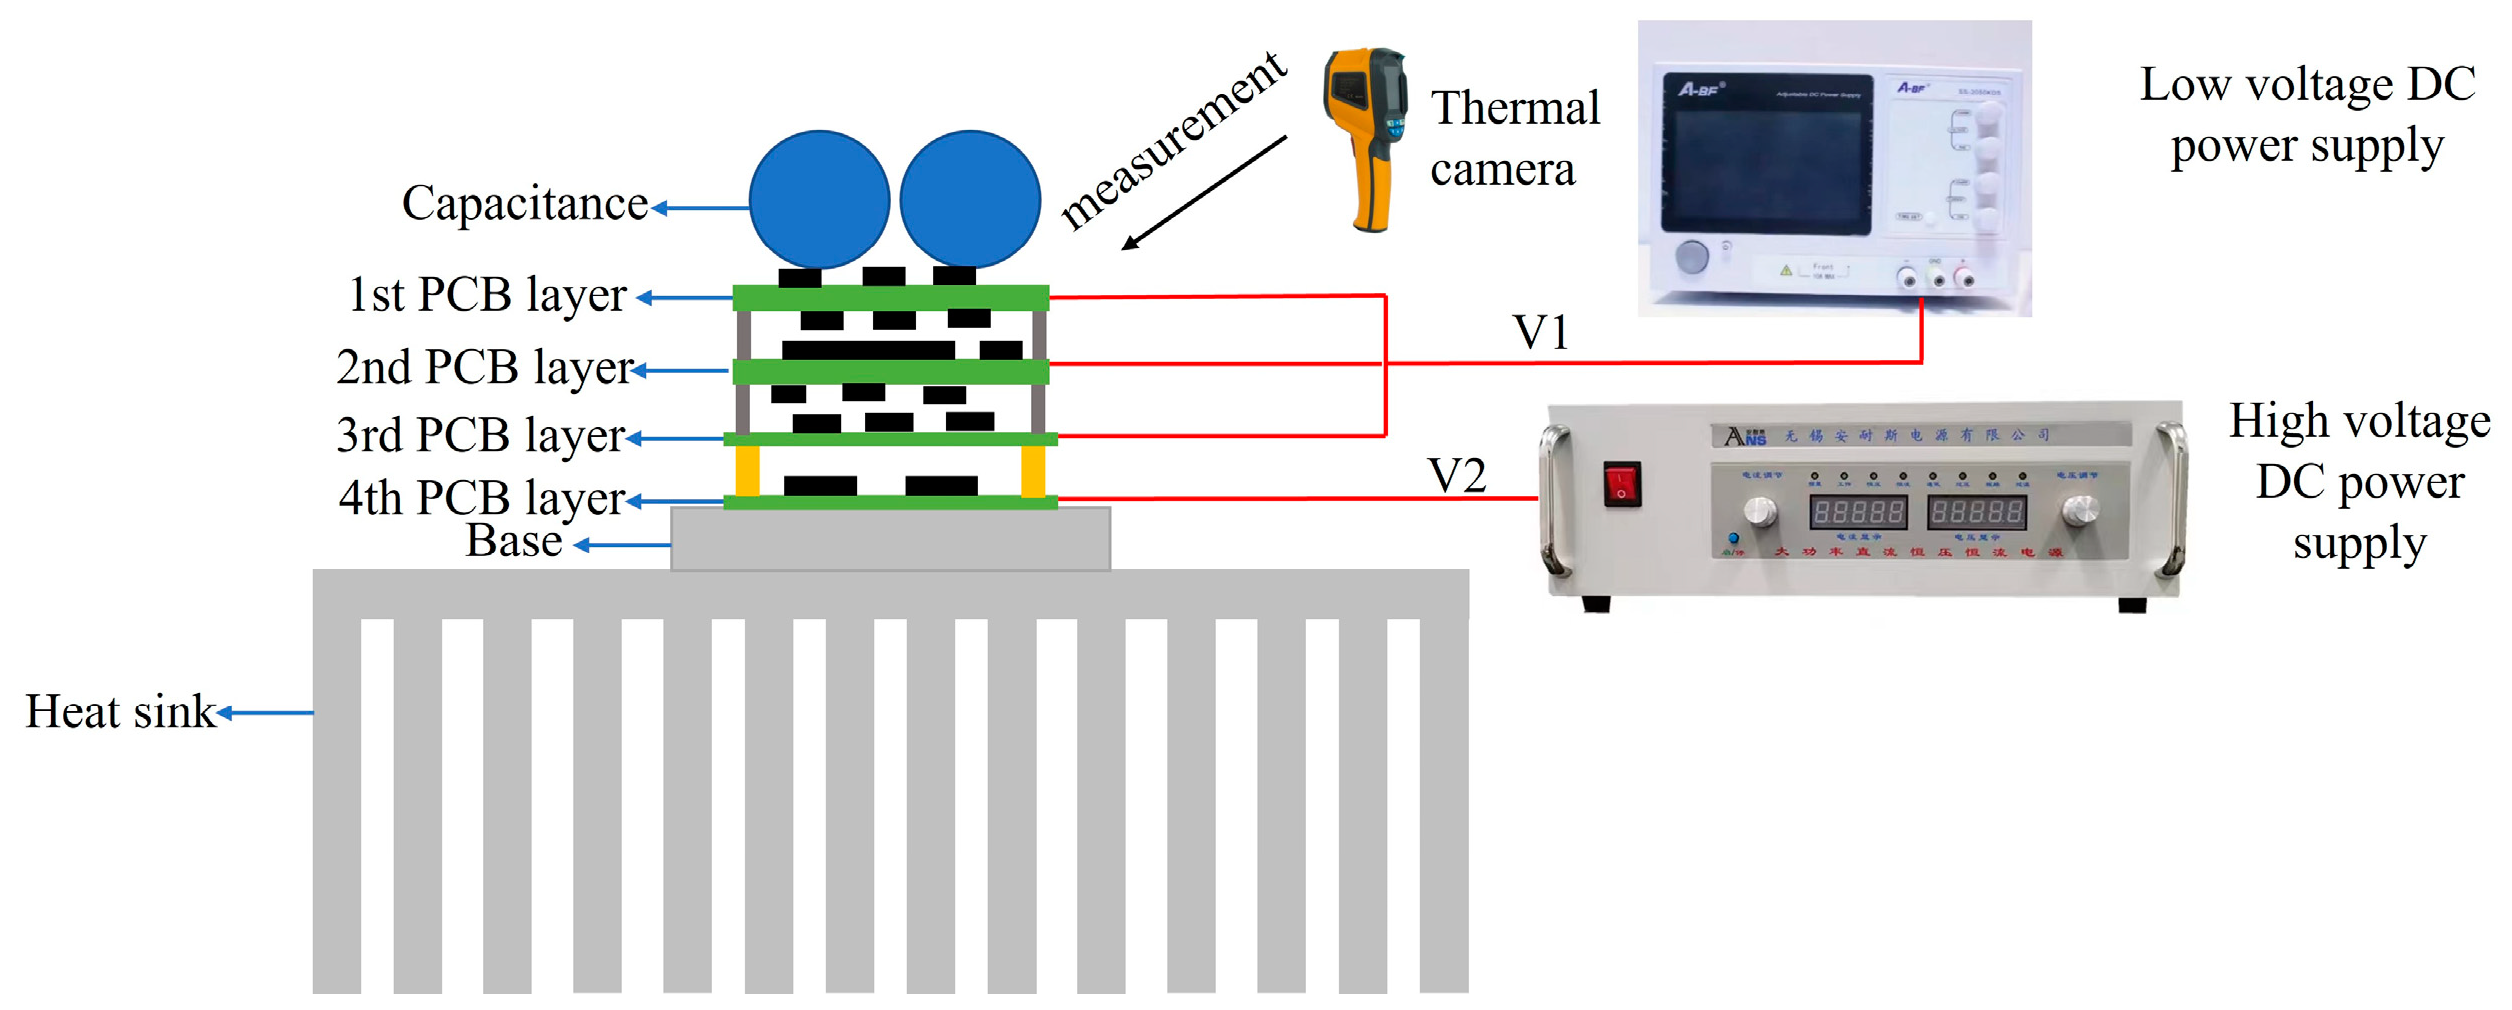
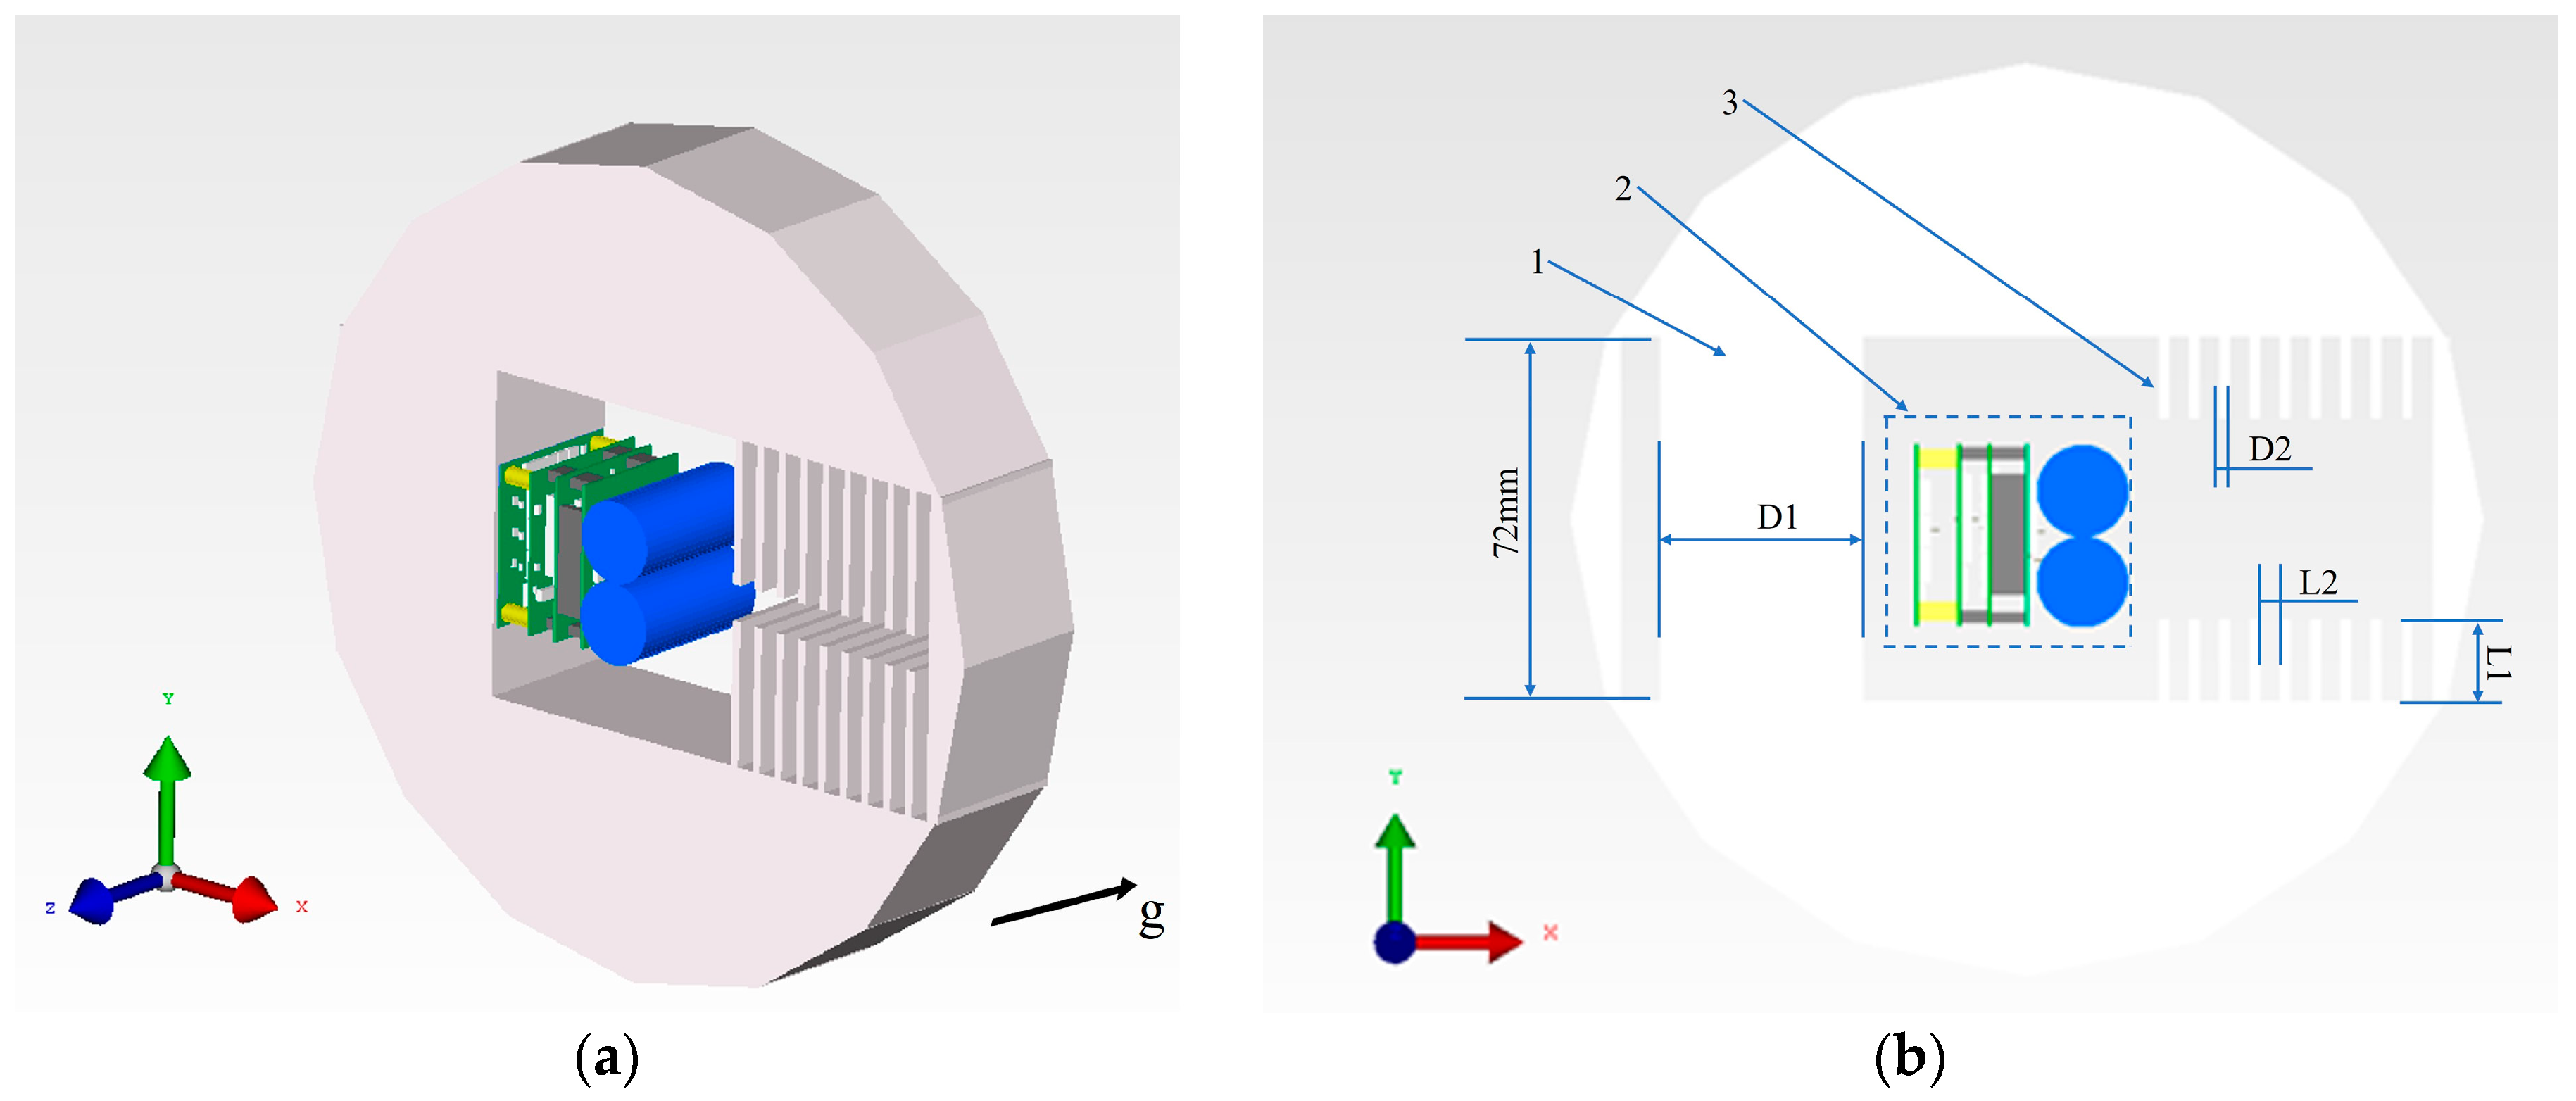
2.1. Numerical Model Description

The propeller driver device and its simulation model are shown in Figure 1. It is made up of a base, a rectangular heat sink, two capacitors, and four driver PCB layers. The rectangular heat sink has a total size of 80 mm × 27 mm × 150 mm. The cylindrical capacitors have a height of 35 mm and a radius of 9 mm. The dimensions and power of each driver board are shown in Table 1. The total power of this driver is 10.6 W. The power of the 4th PCB layer, including U4, is 10 W. That means that most of the heat generated in this work comes from the 4th PCB layer. Heat conduction within a solid and heat convection between layers and surroundings can be used to categorize the heat transfer manners of multi-layer plate [1]. Since there is little space between the layers, heat is primarily transferred by heat conduction within the driver. The conduction processes can be described with the Fourier heat conduction law. For the steady-state heat transfer with an internal heat source, the heat conduction differential equation for a three-dimensional system can be expressed as in Equation (1) [30].
x ( λ t x ) + y ( λ t y ) + z ( λ t z ) + Φ ˙ = 0
The heat convection process can be expressed with Newton’s cooling law as Equation (2) [31].
Q = h A Δ t
In the formula, Δt is the temperature difference between the solid wall and the fluid.
In the thermal analysis software, three major conservation equations are mainly used to calculate and solve the model, namely the mass conservation equation, momentum conservation equation, and energy conservation equation. The governing equations of fluid flow are shown in Equation (3) [31].
p τ + d i v p v Φ = d i v Γ g r a d Φ + s
In Cartesian coordinates, the continuity equation is given in Equation (4) [31].
p τ + ρ u x + ρ v y + ρ w z = 0
In the Cartesian coordinate system, the momentum conservation equations in each sub-direction are shown in Equations (5)–(7) [31].
( ρ u ) τ + ( ρ u u ) x + ( ρ u v ) y + ( ρ u w ) z = p x + x ν u x + y ν u y + z ν u z + s u
( ρ v ) τ + ( ρ v u ) x + ( ρ v v ) y + ( ρ v w ) z = p y + x ν v x + y ν v y + z ν v z + s v
( ρ w ) τ + ( ρ w u ) x + ( ρ w v ) y + ( ρ w w ) z = p z + x ν w x + y ν w y + z ν w z + s w
The energy conservation equation is shown in Equation (8) [31].
( ρ t ) τ + ( ρ u t ) x + ( ρ v t ) y + ( ρ w t ) z = x λ c P t x + y λ c P t y + z λ c P t z + s t
The buoyancy force in this model is calculated based on the Boussinesq assumption, in which the density change due to pressure is ignored, and only the influence of temperature on density is considered. The specific calculation of buoyancy is shown in Equation (9) [32].
F = g a ρ ( t t r e f )
In the formula, tref represents the boundary temperature.

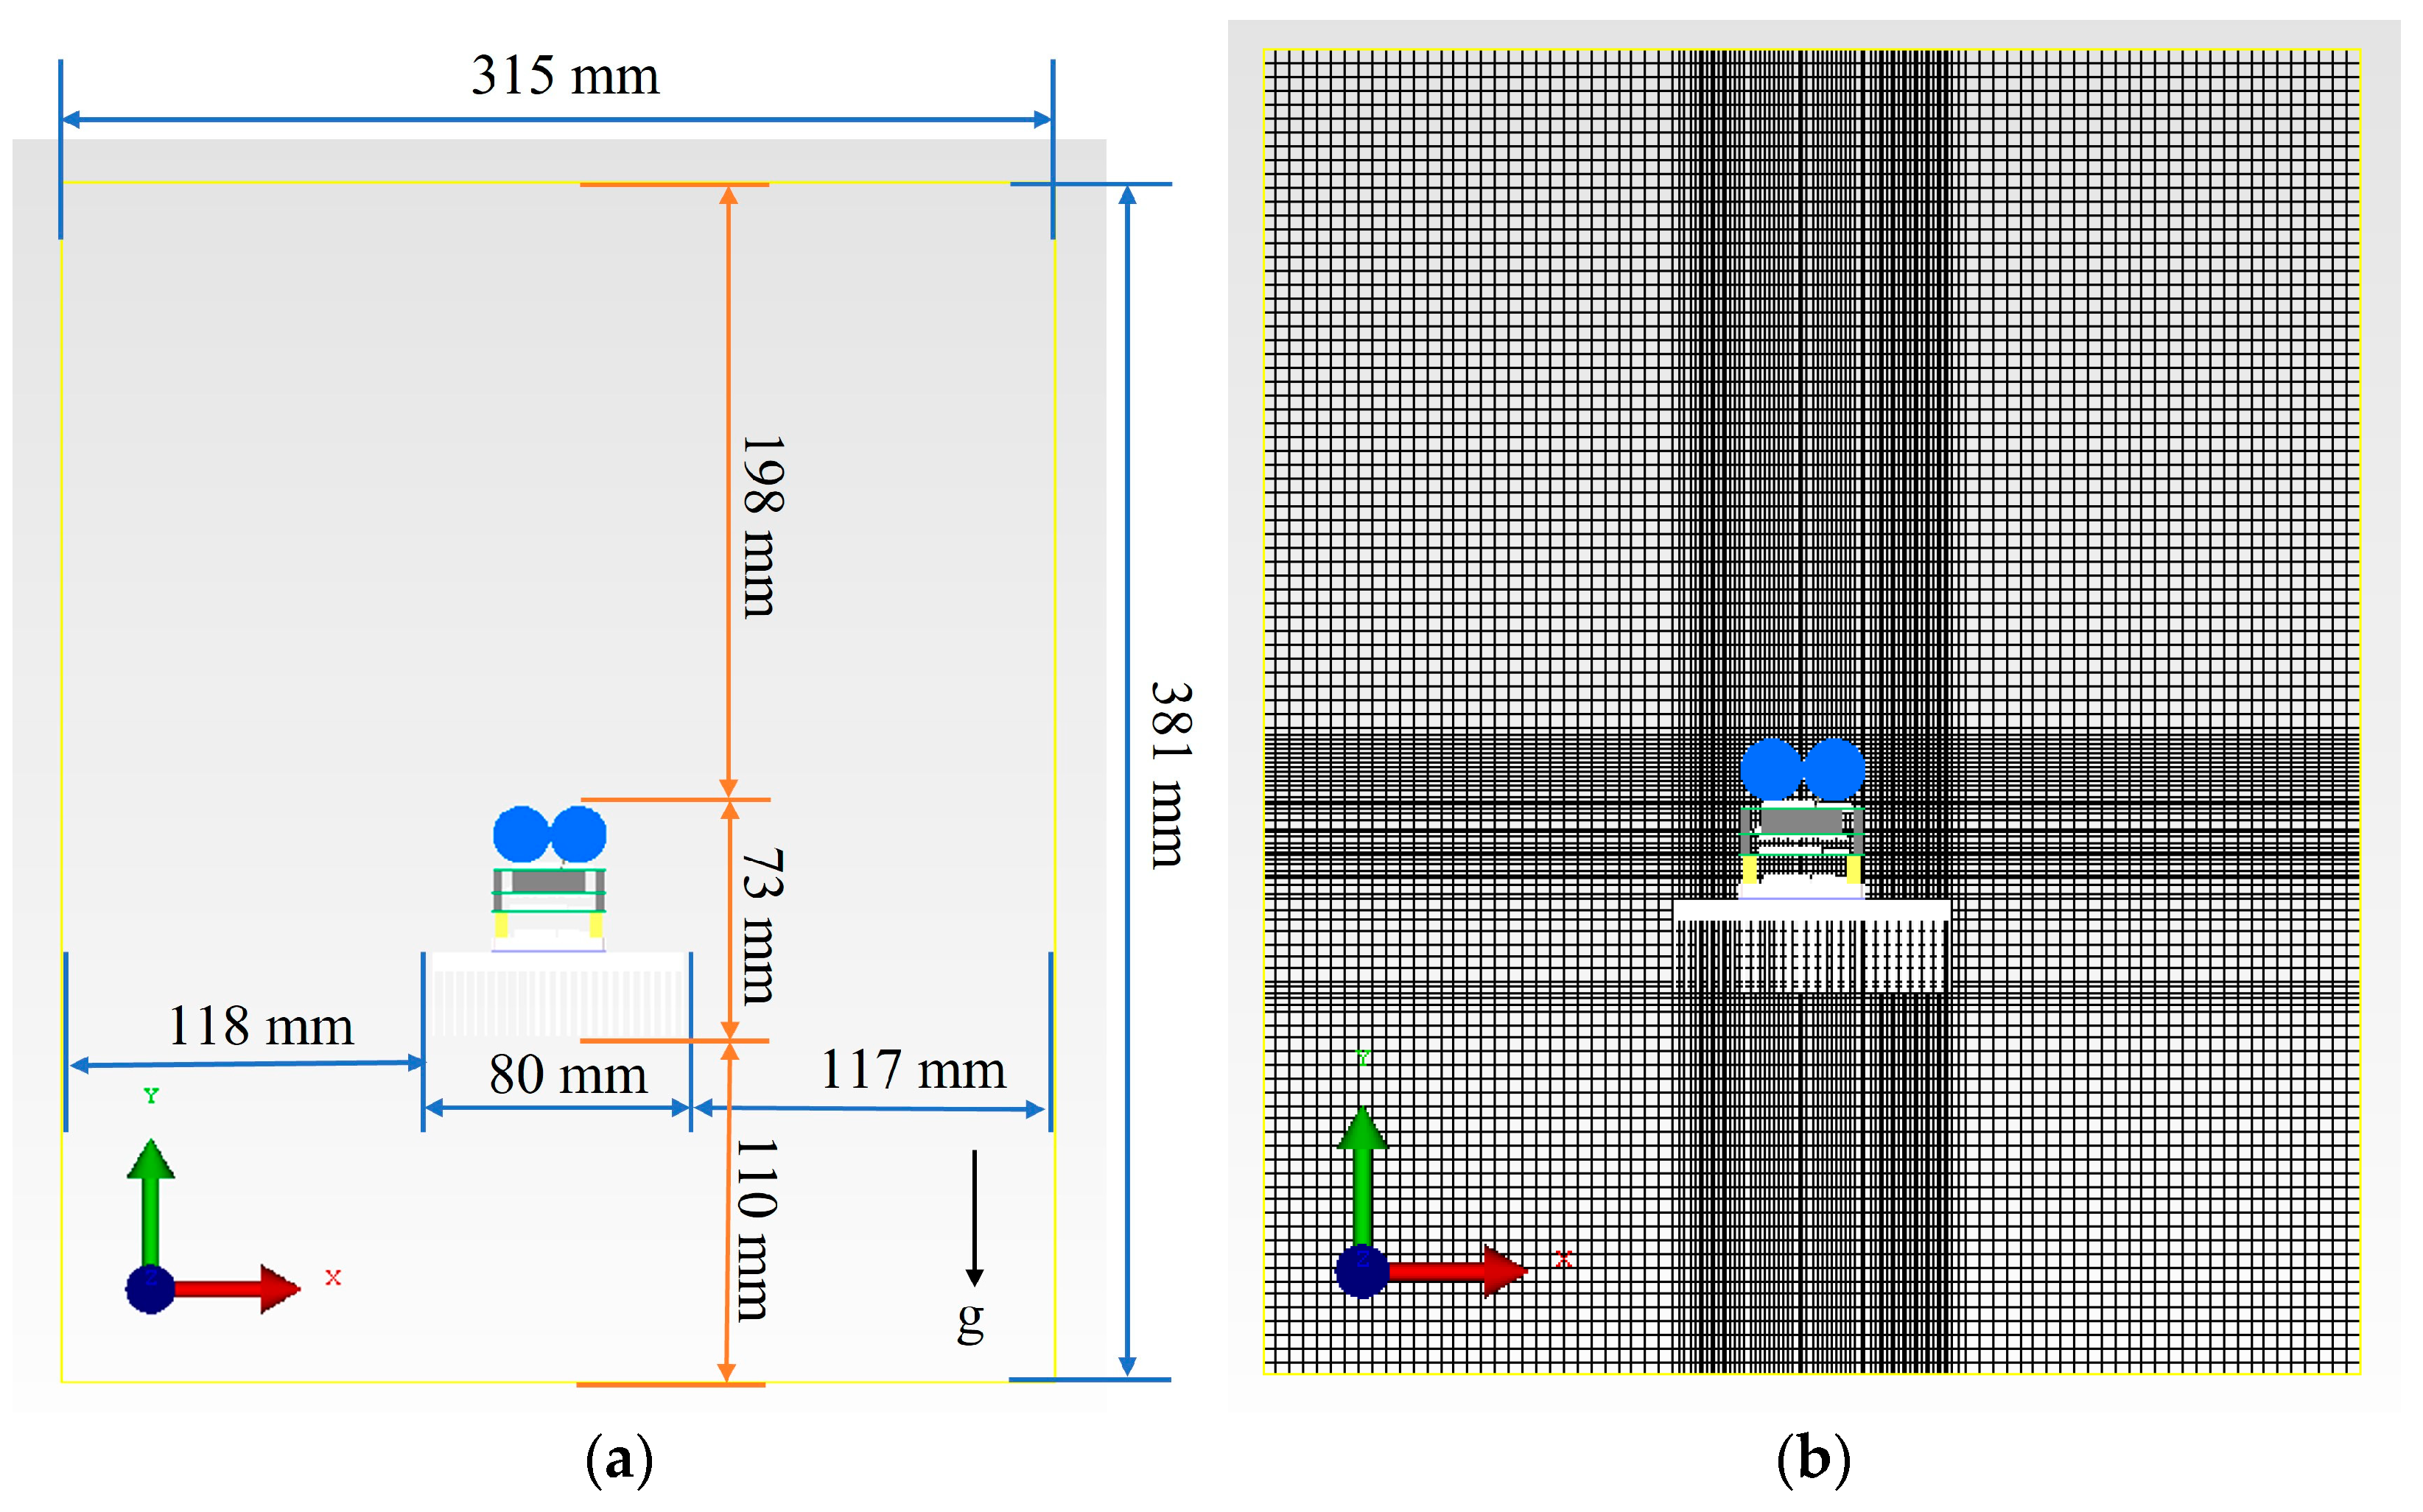
2.2. Boundary Condition Settings

The driver model’s boundary conditions include ambient characteristics, heating power parameters, and component material parameters. The material of driver boards is set to FR4. The materials of chips’ substances are set to silicon. The materials of columns that link the 1st, 2nd, and 3rd PCB layer are set to plastic. The material of the column joining the 4th PCB layer and the base is set to copper. The materials of the heat sink and base are Al6063. The material and thermal conductivity for the main components in the model are listed in Table 2.

2.3. Grid and Solution Domain Setting

As natural convection is the primary mode of heat transfer in our study, the computational domain was set up as depicted in Figure 2. The distance of the enclosure in the direction of gravity was set to be 1–2-times the height of the model, while the distance of the enclosure in the opposite direction of gravity was set to be 2-times the height of the model. For all other directions, the enclosure distances were set to be 1–2-times the size of the model [32]. The distance of the enclosure in the direction of gravity was set to 110 mm, while the distance of the enclosure in the opposite direction of gravity was set to 198 mm. For x directions, the enclosure distances were set to117 mm and 118 mm. The dimensions of the computational domain were set to be 315 mm in length, 381 mm in width, and 551 mm in height. The boundaries of the domain were all set as open boundaries, with an ambient temperature of 25 °C and a gauge pressure of 0 Pa. Gravity was set to act in the negative Y direction. The fluid used was air at 1 atm. At these conditions, the density of air is 1.1614 kg/m3, the thermal conductivity is 0.0261 W/(m·K), and the specific heat capacity is 1005 J/(Kg·K).
The grid encryption scheme is as follows: the minimum and the maximum grid sizes for the zone near heat sink and PCB layers were set to 3 mm and 4 mm, respectively. Discretize the whole computational domain with grids that have sizes between 1 mm and 4 mm. The grid aspect ratio is 3.989. There are 2,405,352 grids in the model, as shown in Figure 2b. Then, increase the grid density. Setting the maximum mesh size of the drive unit to 3 mm and 2.5 mm, respectively, the number of meshes in the model increased to 4,225,221 and 6,341,556. The calculation results are shown in Table 3. Under the three grid models, the calculation results have no obvious change. Therefore, the 2,405,352 grid system was used in the following simulation cases, as shown in Figure 2b.
Before performing numerical calculations on the model, it is necessary to consider the flow state of the fluid. In this paper, the Ra of the fluid can be calculated using Equations (10) and (11) [31,32].
G r = g a Δ t l 3 ν 2
R a = G r × Pr
From experimental results, as shown in the Section 2.5, assuming the wall temperature is 65 °C, the fluid temperature is 25 °C, and the bulk temperature is 45 °C. The kinematic viscosity of the air is 1.75 × 10⁻⁵ m2/s, and the Prandtl number is 0.6985. The characteristic dimension for free convection from the horizontal plate is chosen as 150 mm. Then, the Rayleigh Number is calculated to be about 9.5 × 10⁶. According to the data, the flow state of the fluid is turbulent [31].
Therefore, the calculation model is selected as the Automatic Algebraic Turbulence model. This iteratively solves the method using the SIMPLE method. Additionally, the simulation is considered to be converged when the temperature of the monitoring point is maintained within 0.5 °C for 30 consecutive iterations or when the residual error is less than 1 × 10⁻⁶.

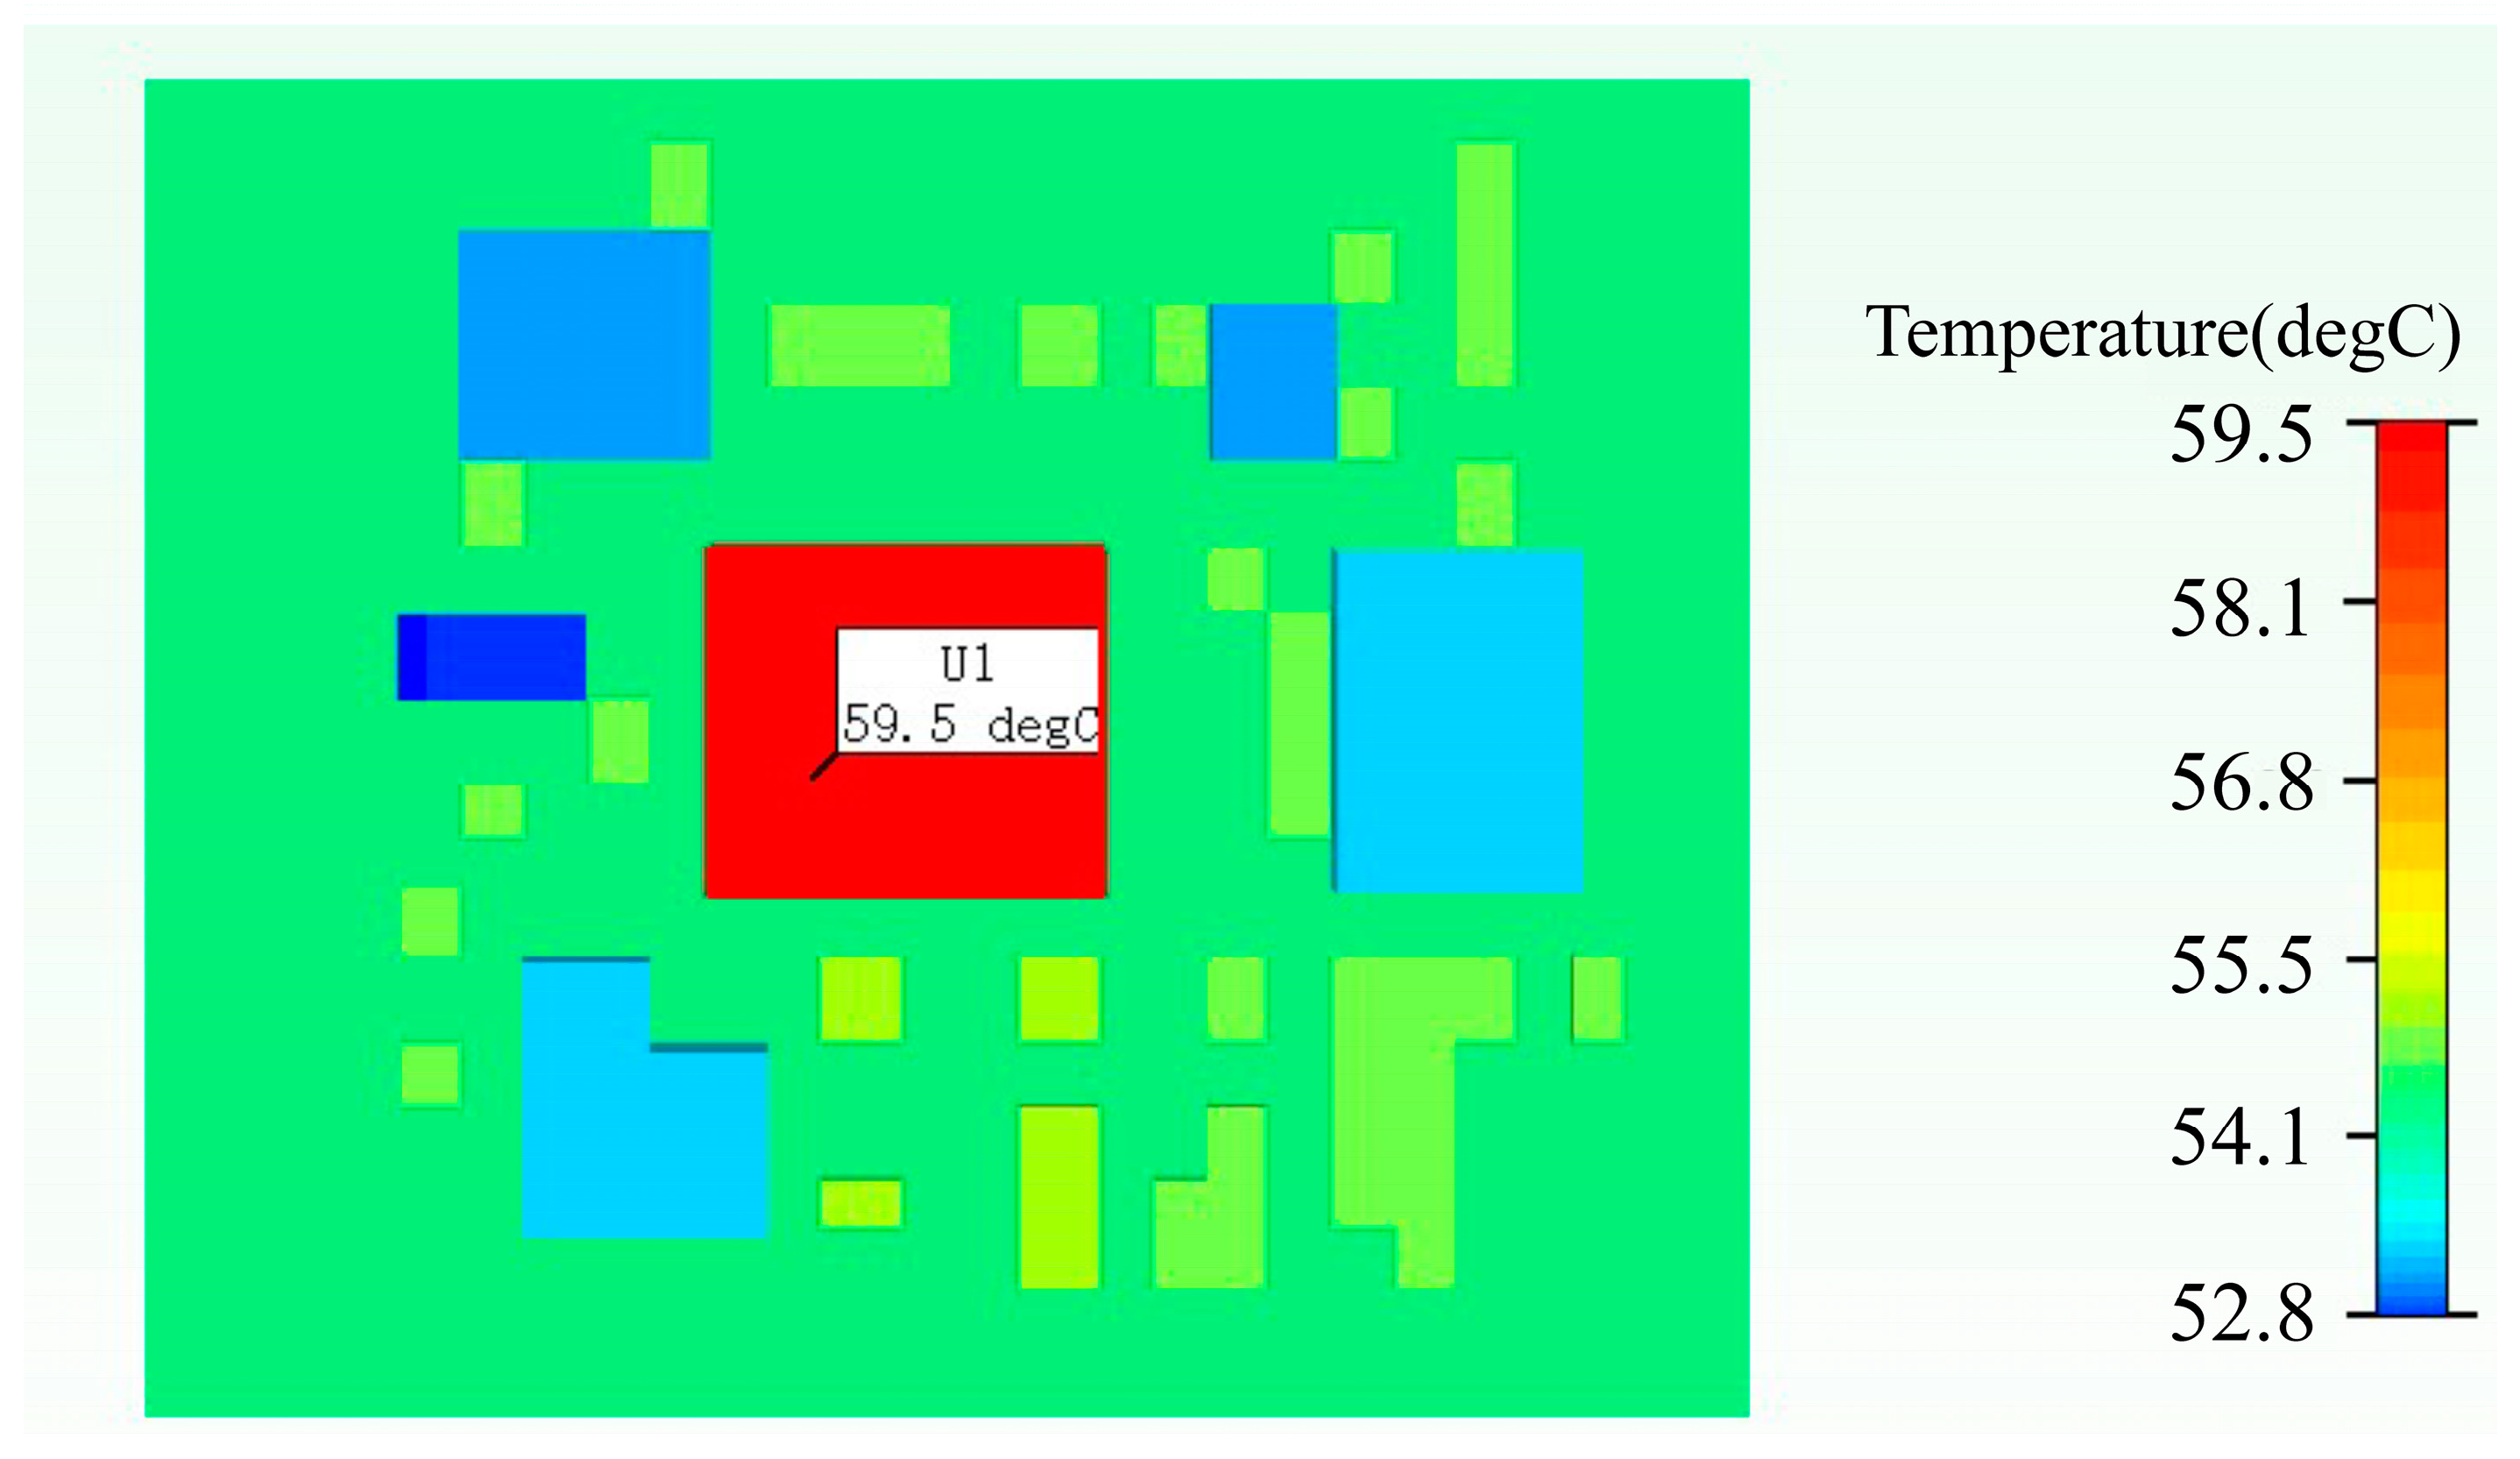
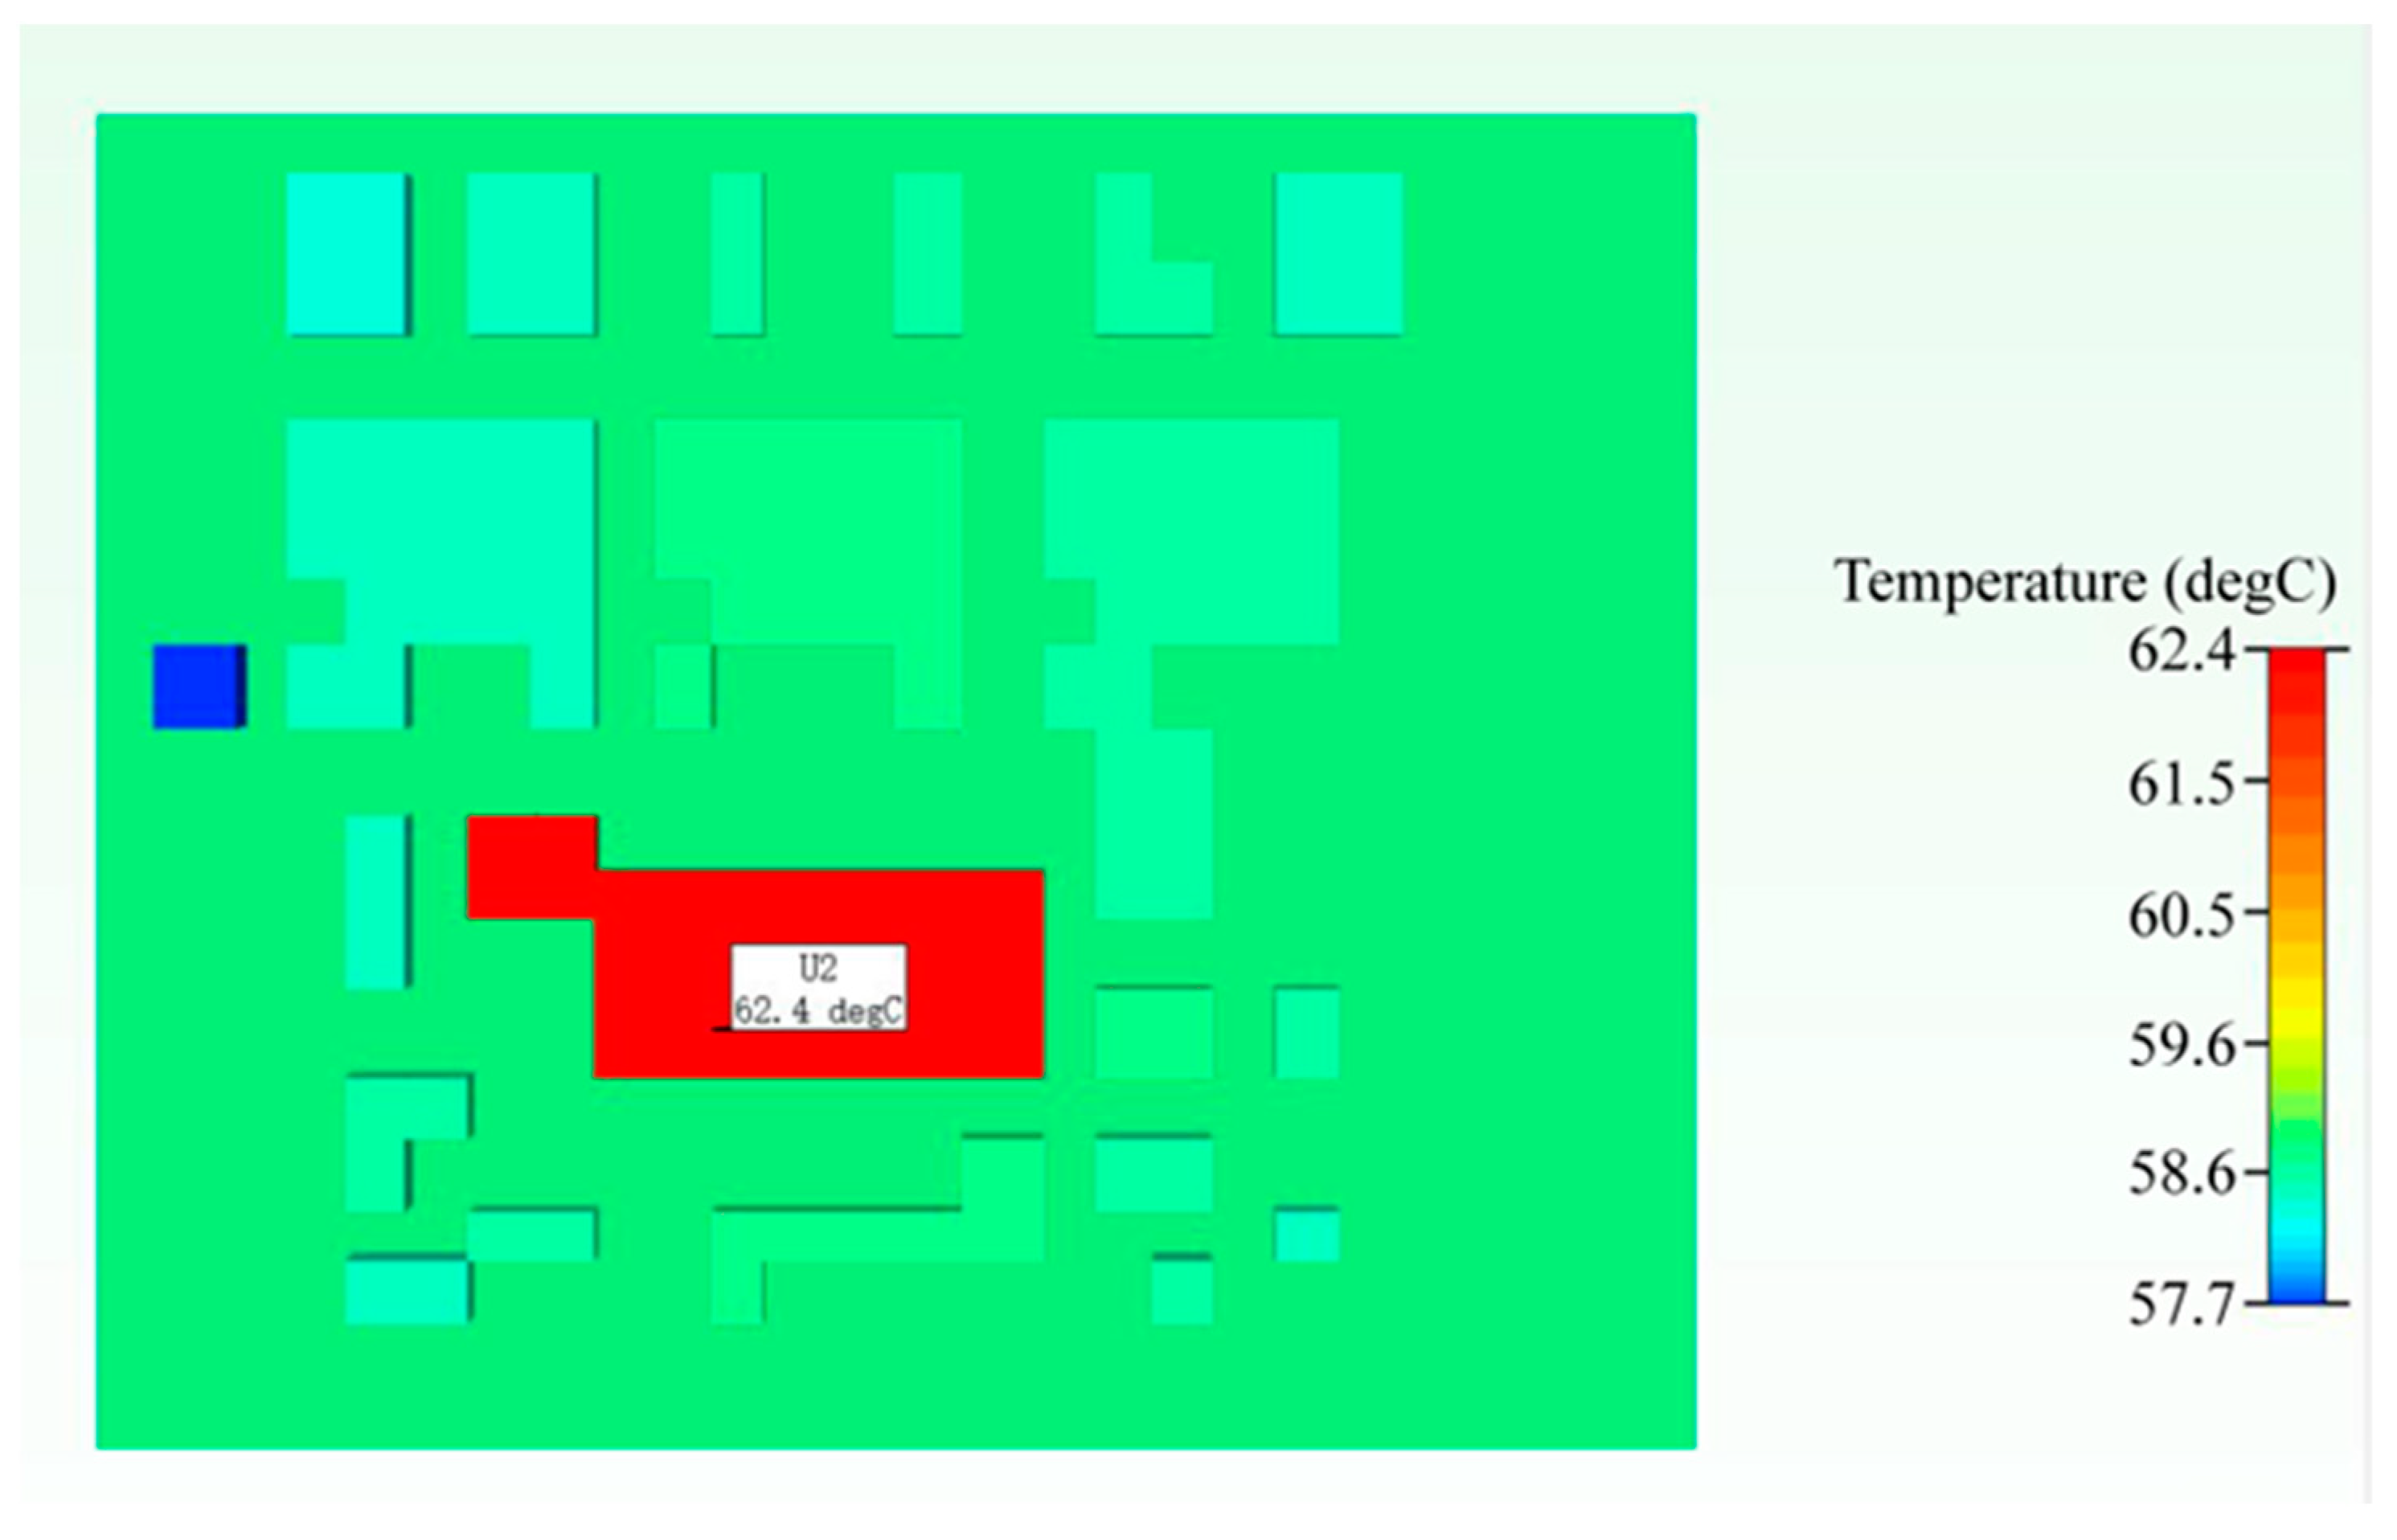
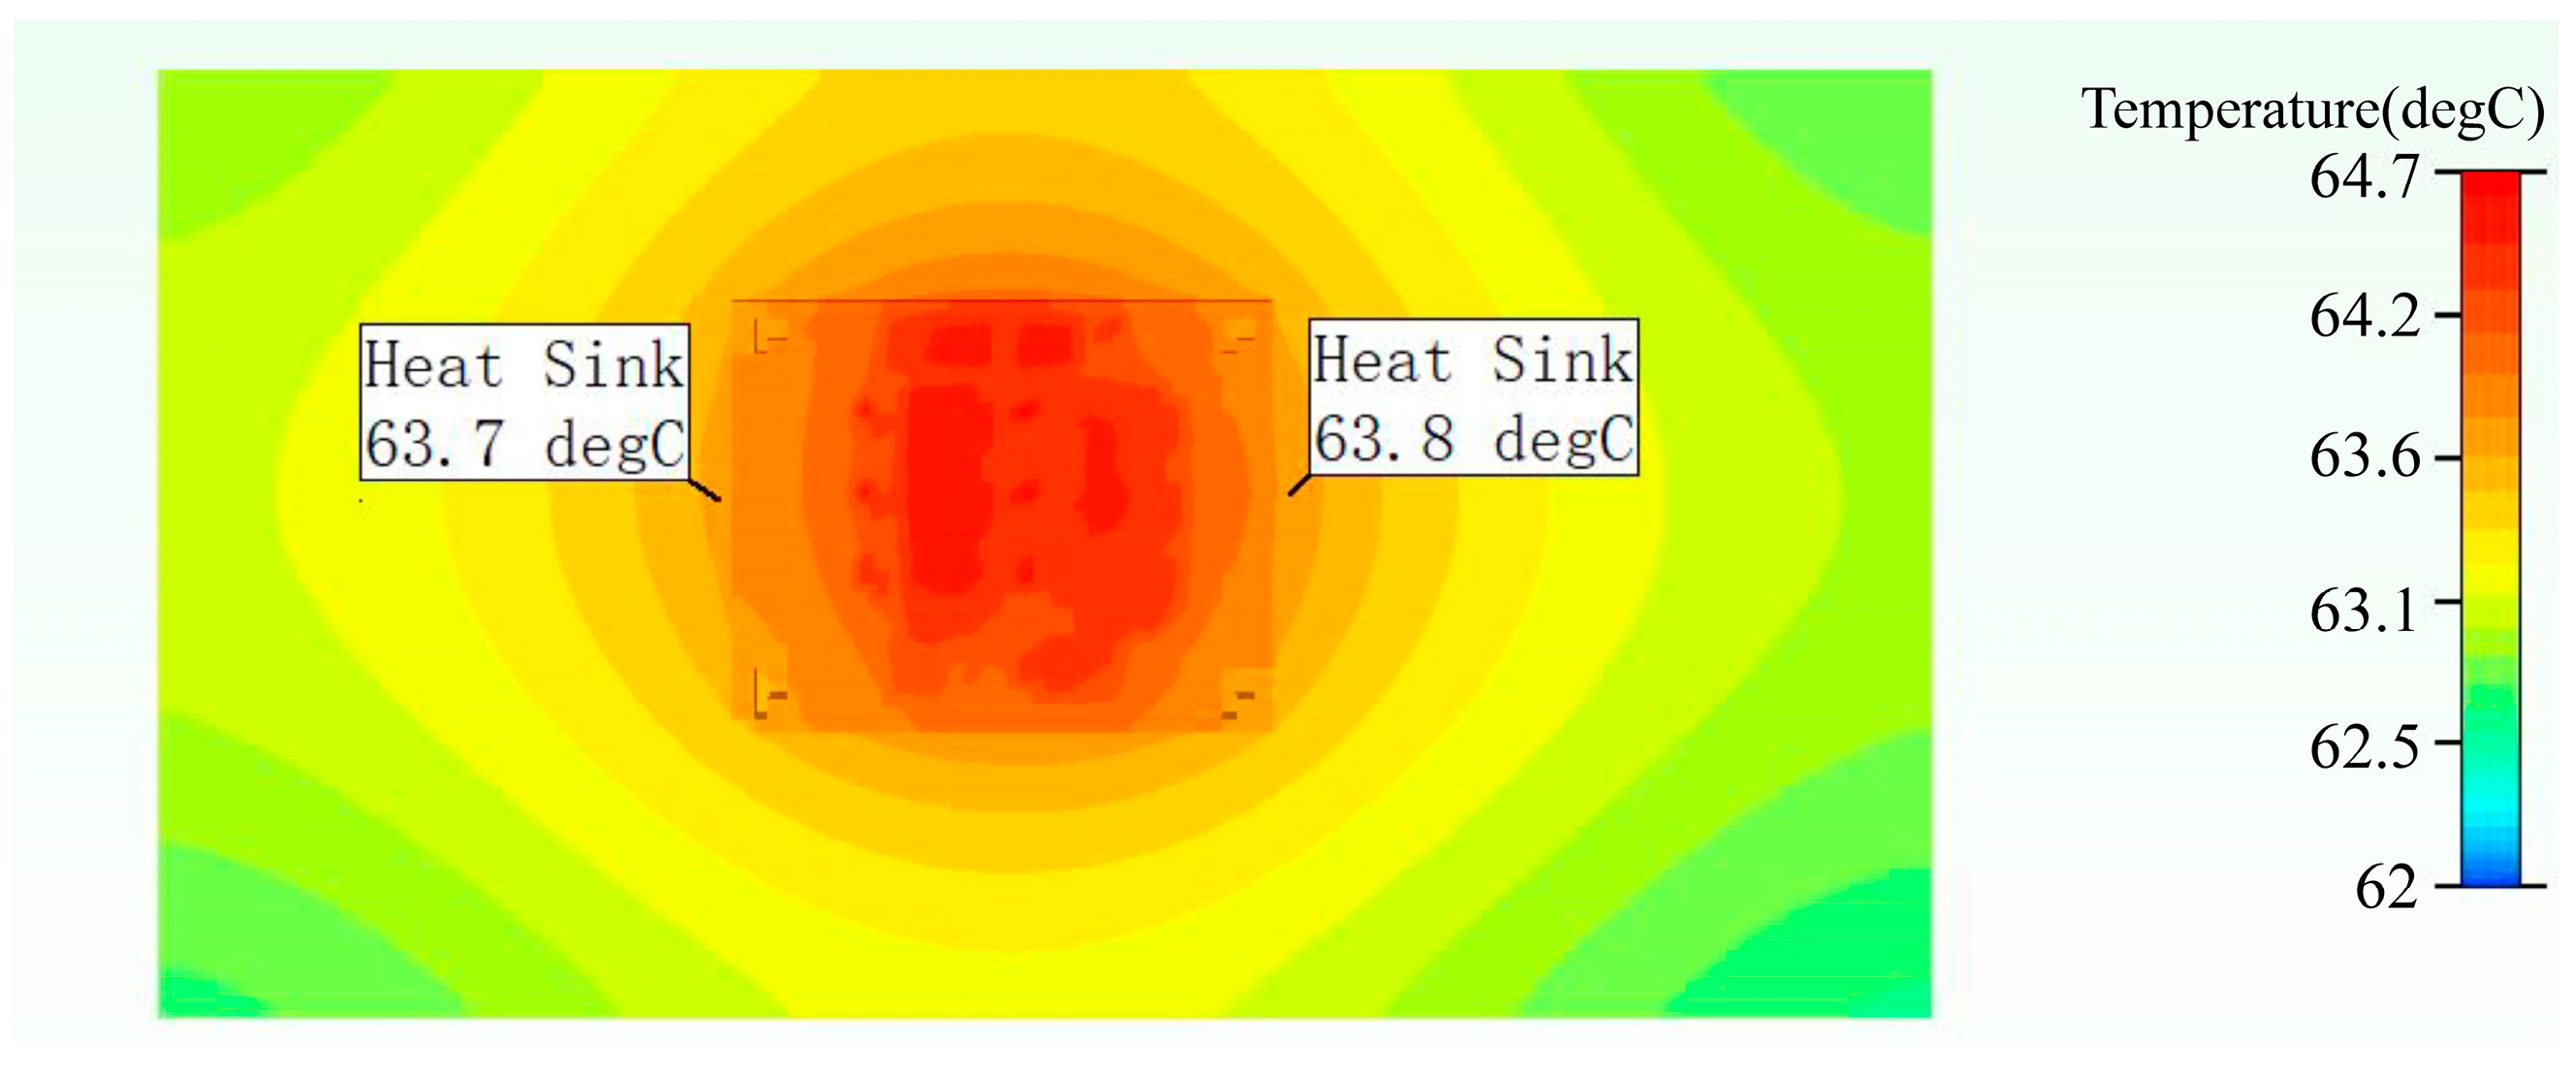
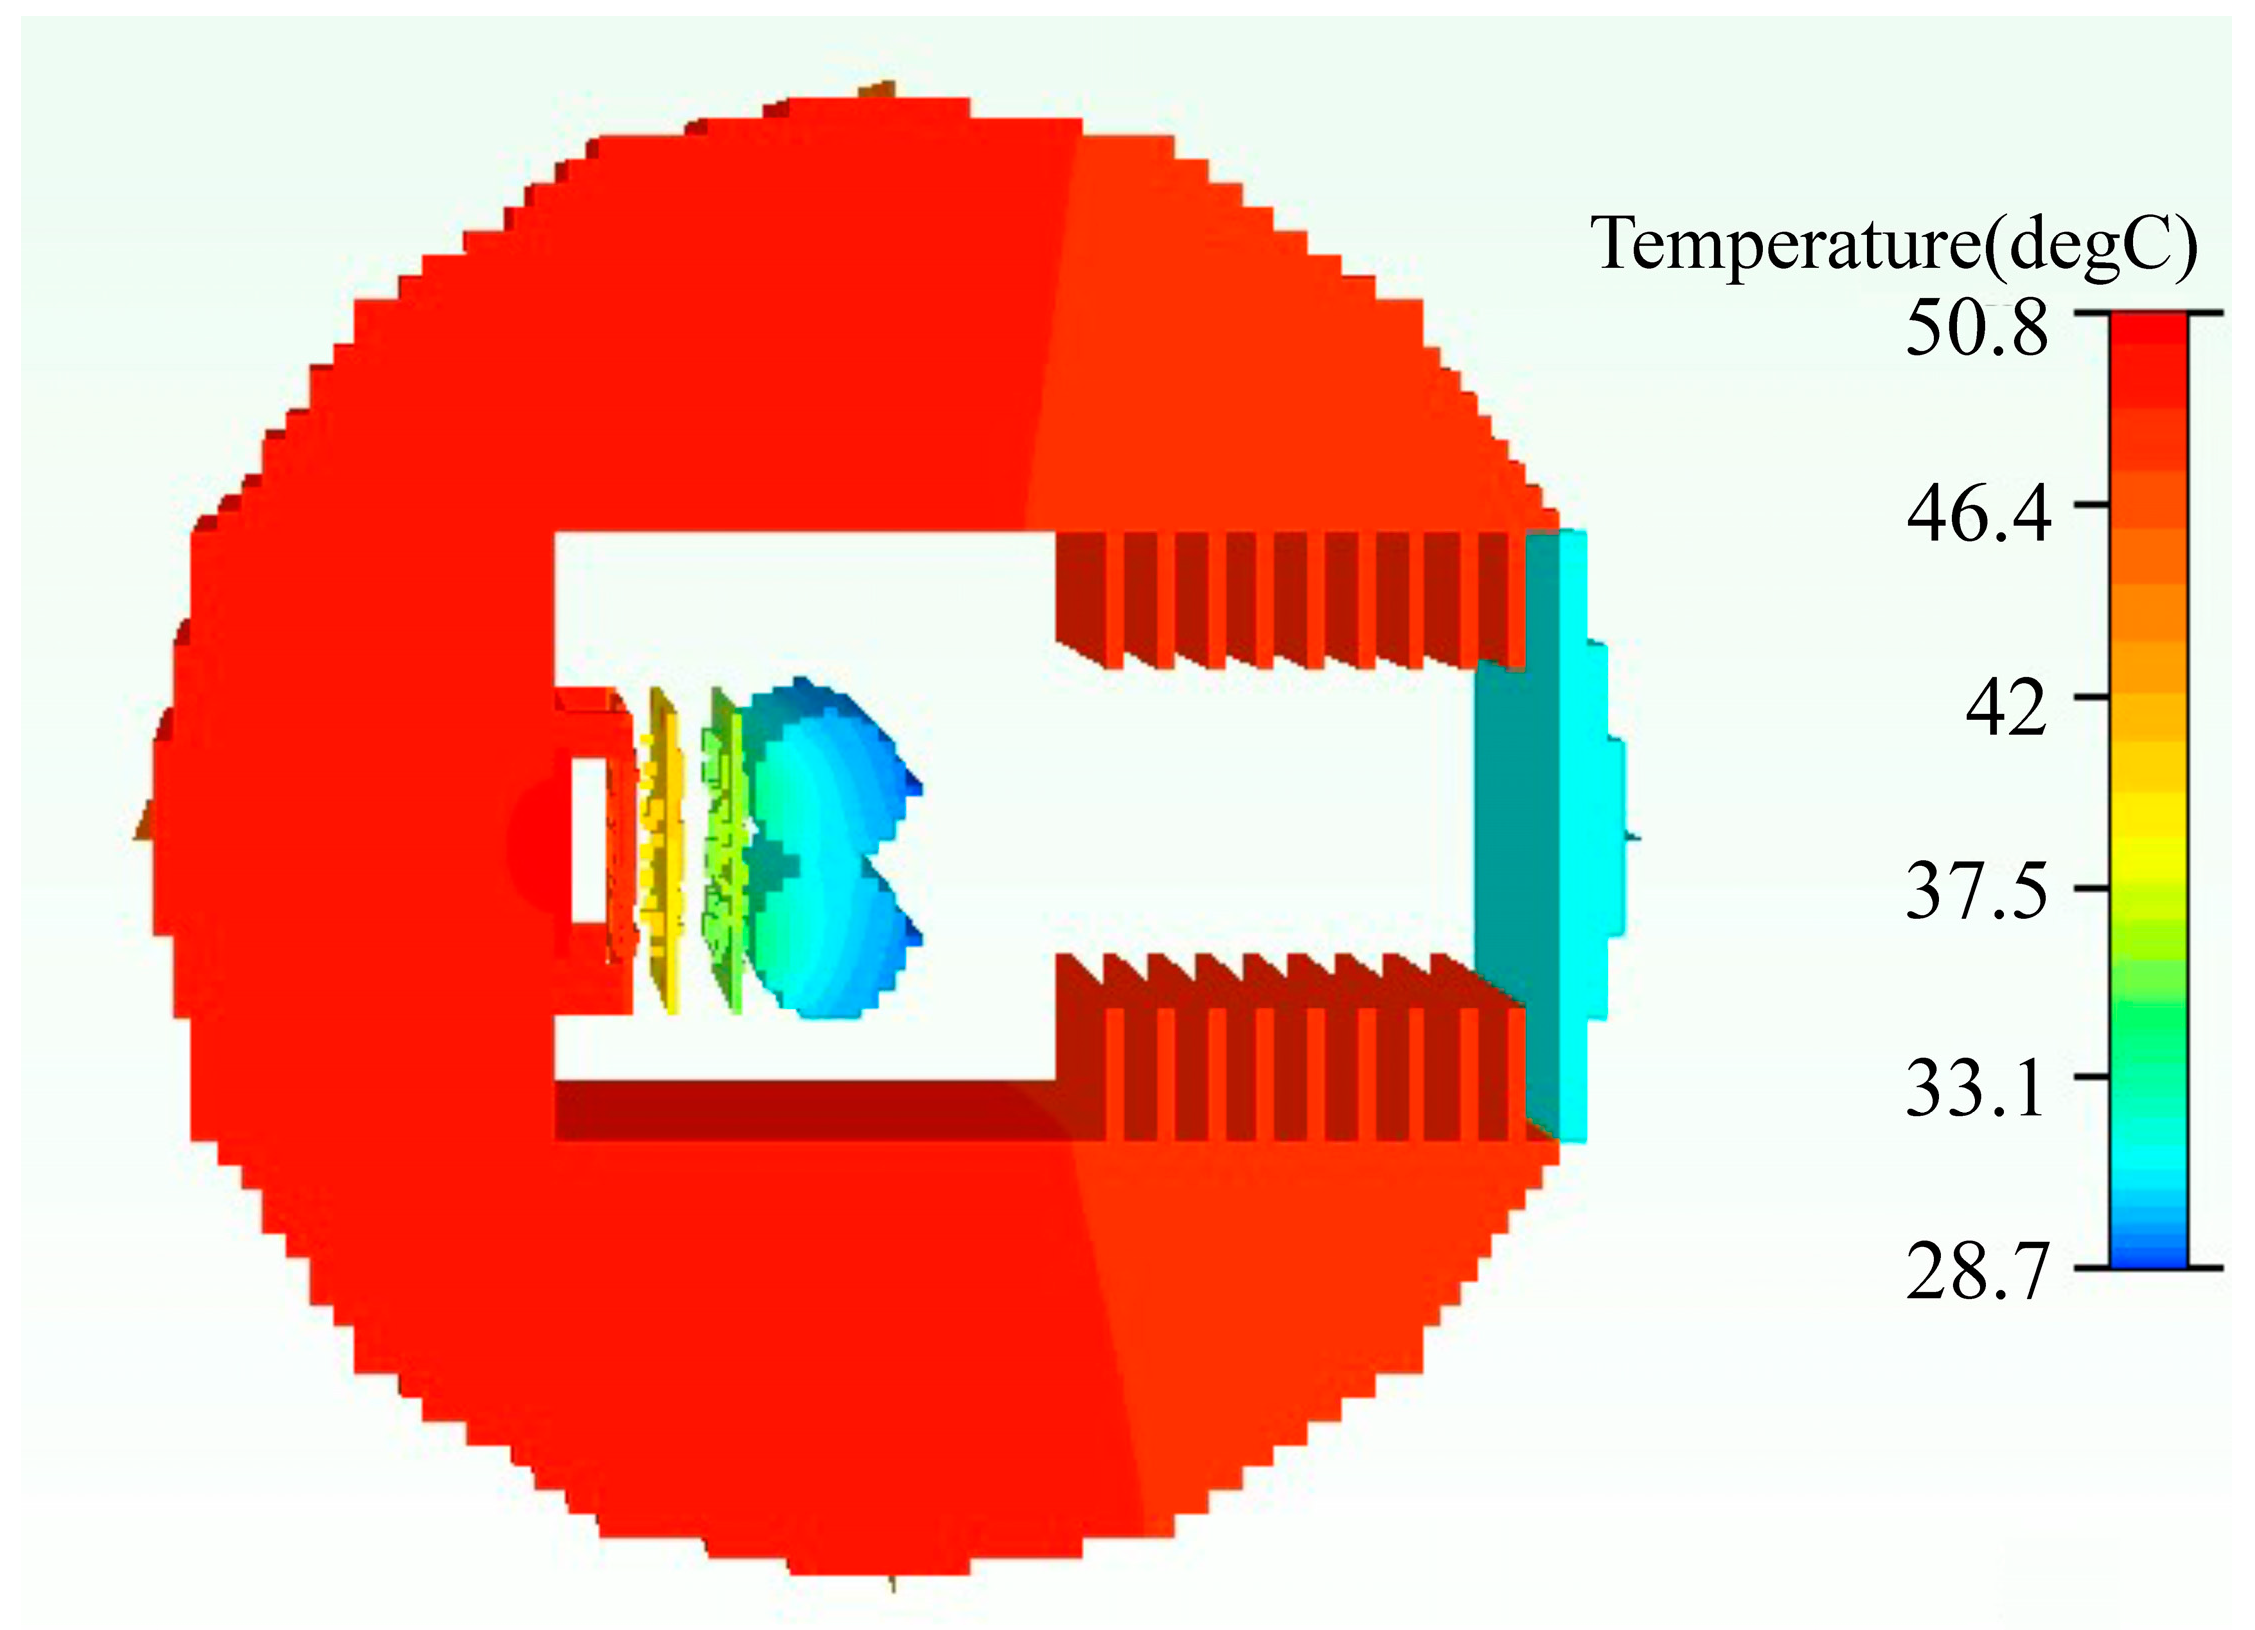
2.4. The Simulation Results and Discussion

The overall temperature field of the driver is shown in Figure 3. It can be seen that the highest temperature in the driver system is 65.6 °C, and the lowest temperature is 42 °C. It can be seen from Figure 3 that the temperature of the driving device decreases from bottom to top. The temperature of the 4th PCB layer is the highest, and the temperature of the capacitor is the lowest. The temperature of the 4th PCB layer can be well transferred to the heat sink. Therefore, the temperature of the heat sink shown in the figure is almost the same as the temperature of the 4th PCB layer.
Figure 4 shows the surface temperature of the 1st PCB layer. It has a maximum temperature of 59.5 °C and a minimum temperature of 52.8 °C, as shown in Figure 4. The maximum temperature appears on the power element U1, which lays on the top center of the 1st PCB.
Figure 5 shows the surface temperature of the 2nd PCB layer. It shows that the temperatures there reach a maximum value of 62.4 °C and a minimum value of 57.7 °C. The power element U2 on the top of the 2nd PCB has the largest temperature of 62.4 °C.
Figure 6 shows the surface temperature of the 3rd PCB layer. The highest temperature is 64.3 °C and the lowest temperature is 65.6 °C, as shown in Figure 6. The highest temperature appears on the power element U3, which lays on the top of the 3rd PCB.
Figure 7 shows the surface temperature of the 4th PCB layer. As seen in Figure 7, the highest temperature on is 64.8 °C, and the lowest temperature is 64.1 °C.
The temperature distributions of the heat sink and base are shown in Figure 8. The maximum temperature is 64.7 °C and the lowest is 62 °C. The temperature at the point where the base and the heat sink contact is shown in Figure 8. It can be seen that the high-temperature area is mainly located at the place where the driver and the base contact.

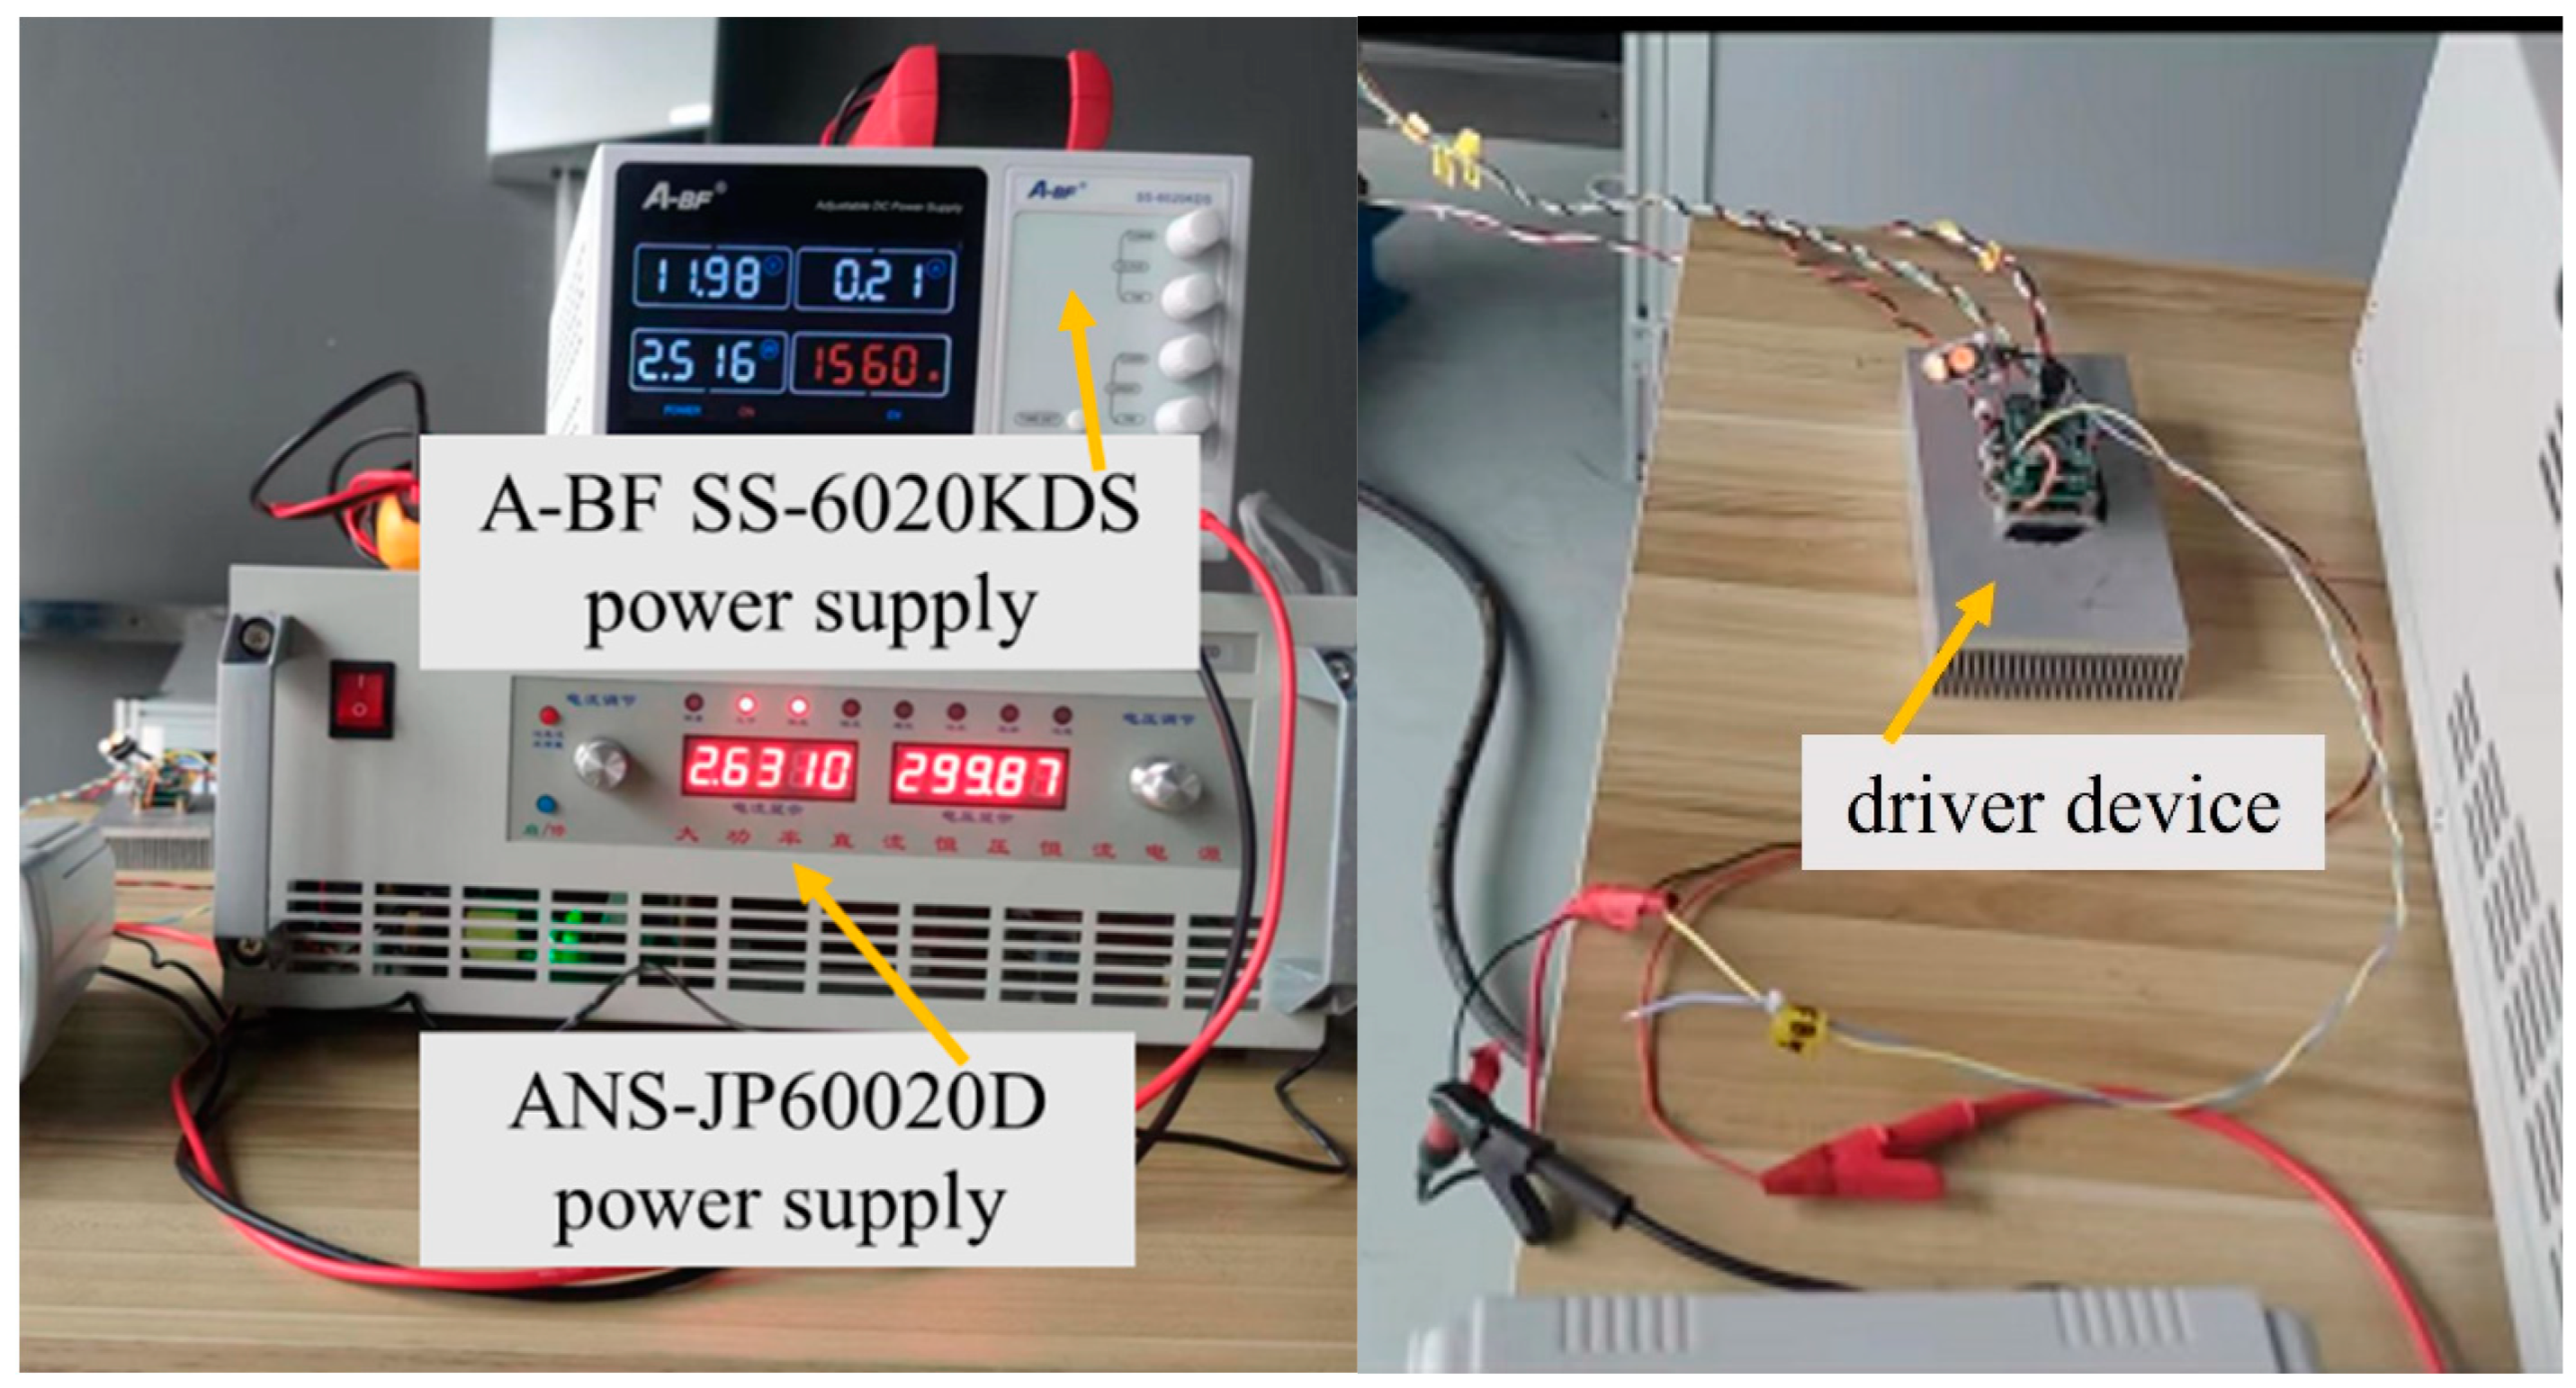
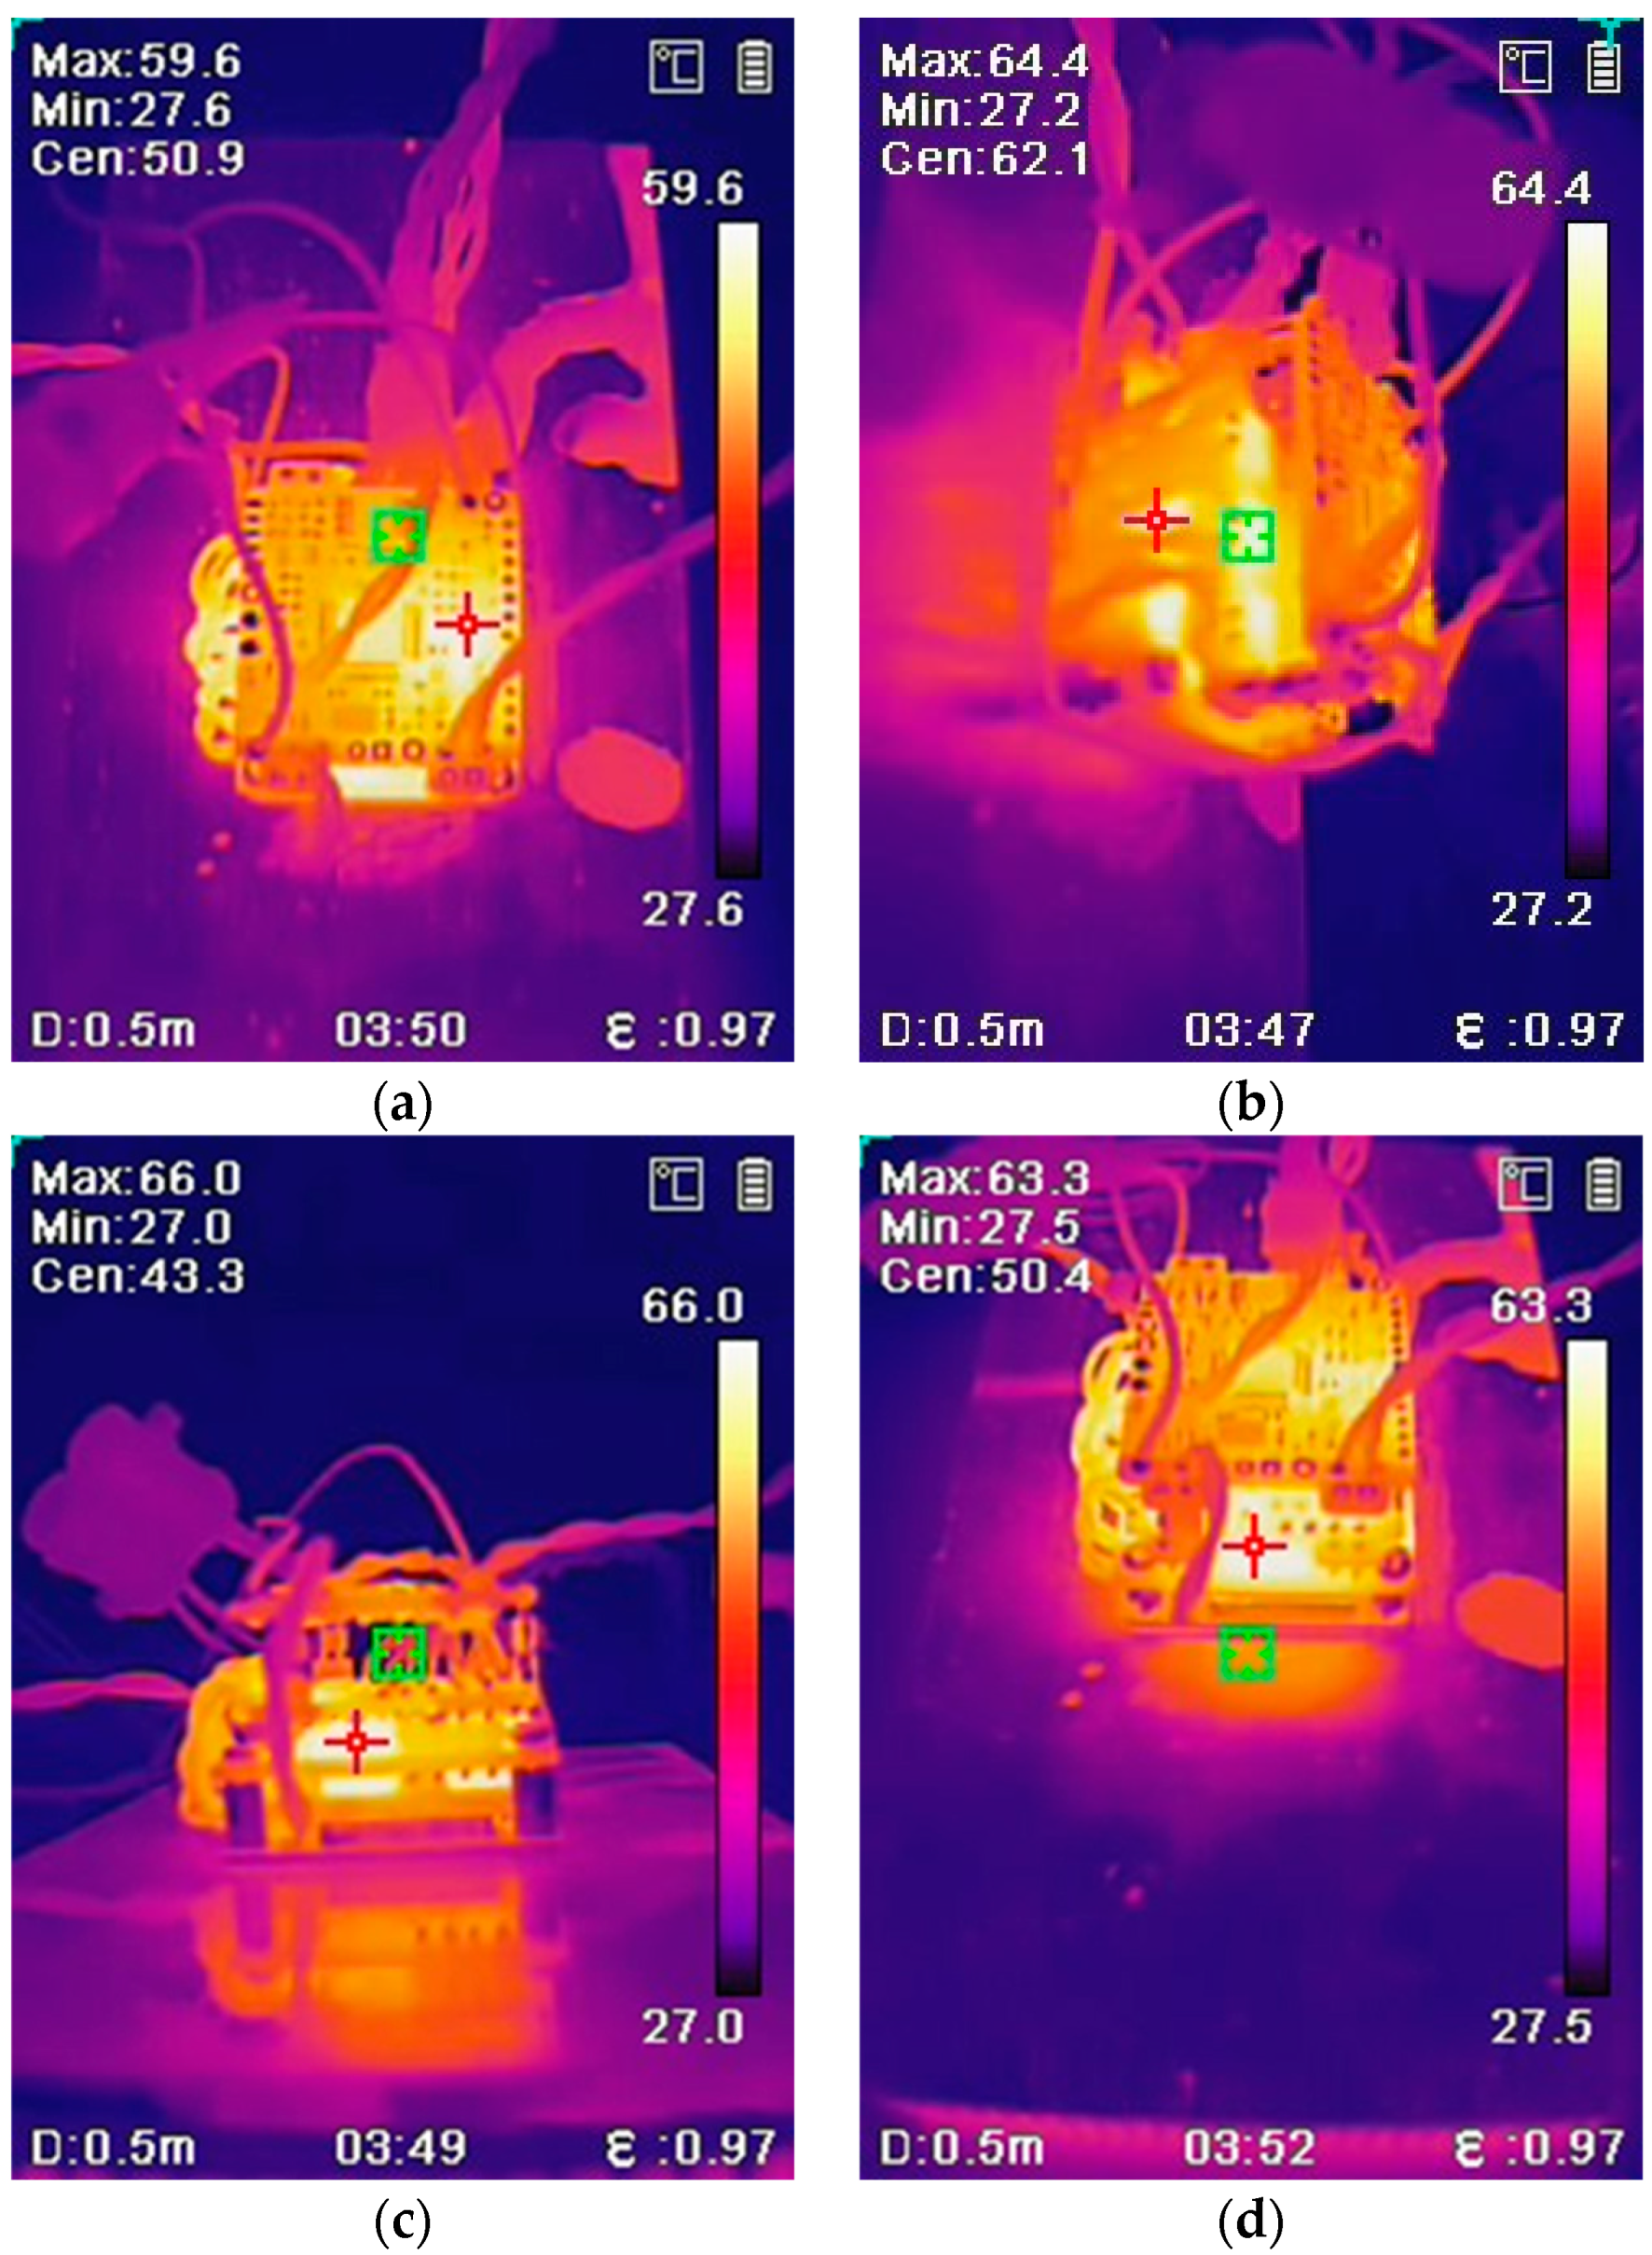
2.5. Model Experiment Verification

In order to verify the accuracy of the model used in numerical analysis, experiments were carried out for the propeller driver with full power. The surrounding temperature of testing was set as 25 °C. The experimental system consists of two power supplies, one thermal imaging instrument and the test propeller drivers. A schematic diagram of the experimental system is shown in Figure 9. As shown in Figure 9, a low-voltage DC power supply (A-BF SS-6020KDS) was used to supply a voltage of 12 V for the upper three driver PCB layers. A high-voltage DC power supply (ANS-JP60020D) was used to provide a voltage of 300 V for the 4th PCB layer. A thermal imager was used to measure the surface temperature of the 1st PCB layer, the 2nd PCB layer, and the 3rd PCB layer. Since the surface temperature of the 4th PCB layer is difficult to measure accurately, the temperature at the junction of the base and the heat sink was measured.
Figure 10 shows photos of the experimental test. Figure 10 shows that during the experimental test, the actual output voltage of the low-voltage DC power supply is 11.98 V, and its output current is 0.21 A. The actual output voltage of the high-voltage DC power supply is 299.87 V, and its actual output current is 2.631 A. Figure 11 shows the experimental test results, the green test box shows the temperature at the center of the test chart, and the red test cross shows the highest temperature position in the test chart.
The maximum surface temperature of the 1st PCB layer, the 2nd PCB layer, the 3rd PCB layer, and the connection between the base and the heat sink in the experimental measurement results shown in Figure 11 are compared with the maximum temperature calculated via simulation. The comparison results are shown in Table 4. It shows that the experimental results are consistent with the simulation results. The maximum temperature error is 2 °C, and the average absolute error is about 0.75 °C.

3. Thermal Analysis and Optimization of Heat Sink Based on Sealed Cabin

3.1. Influences of Heat Sink Geometry on Heat Dissipation

For most underwater vehicles, the propeller driver can often be sealed in a cylindrical sealing pressure cabin. Therefore, a new kind of cylindrical heat sink is designed for the propeller driver system and is analyzed in this section. The structure of the cylindrical heat sink is shown in Figure 12. The heat sink has a function of both heat dissipation and driver installation. The heat sink has a flat cylindrical body. It has a radius of 90 mm and a thickness of 35 mm. There is a rectangular through-hole inside. The driver base locates on one short side of the rectangular hole. Several rectangular fins are symmetrically distributed along the long side of the rectangular hole, as shown in Figure 12. The driver device is mounted on the base. The base thickness D1 is set as 40 mm. The base width is set as 72 mm. The fin thickness D2 is set as 2 mm. Initially, the fin length L1 is set to 16 mm, and the fin spacing L2 is set to 4 mm.
The dimensions of the computational domain are set to be 575.6 mm in length, 631 mm in width, and 179 mm in height. The boundaries of the domain are all set as open boundaries, with an ambient temperature of 25 °C and a gauge pressure of 0 Pa. Gravity is set to act in the negative Z direction. The fluid used is air at 1 atm. At these conditions, the density of air is 1.1614 kg/m3, the thermal conductivity is 0.0261 W/(m·K), and the specific heat capacity is 1005 J/(Kg·K). The Computational domain and discretized grid of the cylindrical radiator are shown in Figure 13.
The typical temperature field of the cylindrical heat sink and driver is shown in Figure 14. It can be seen that the maximum and the minimum temperatures for the driver are 50.8 °C and 28.7 °C, respectively. The highest temperature is 14.6 °C lower than the result for the model in Figure 3. The minimum temperature is 13.3 °C lower, too. It shows that the cylindrical heat sink can improve thermal conduction efficiency significantly compared with the old rectangular heat sink.

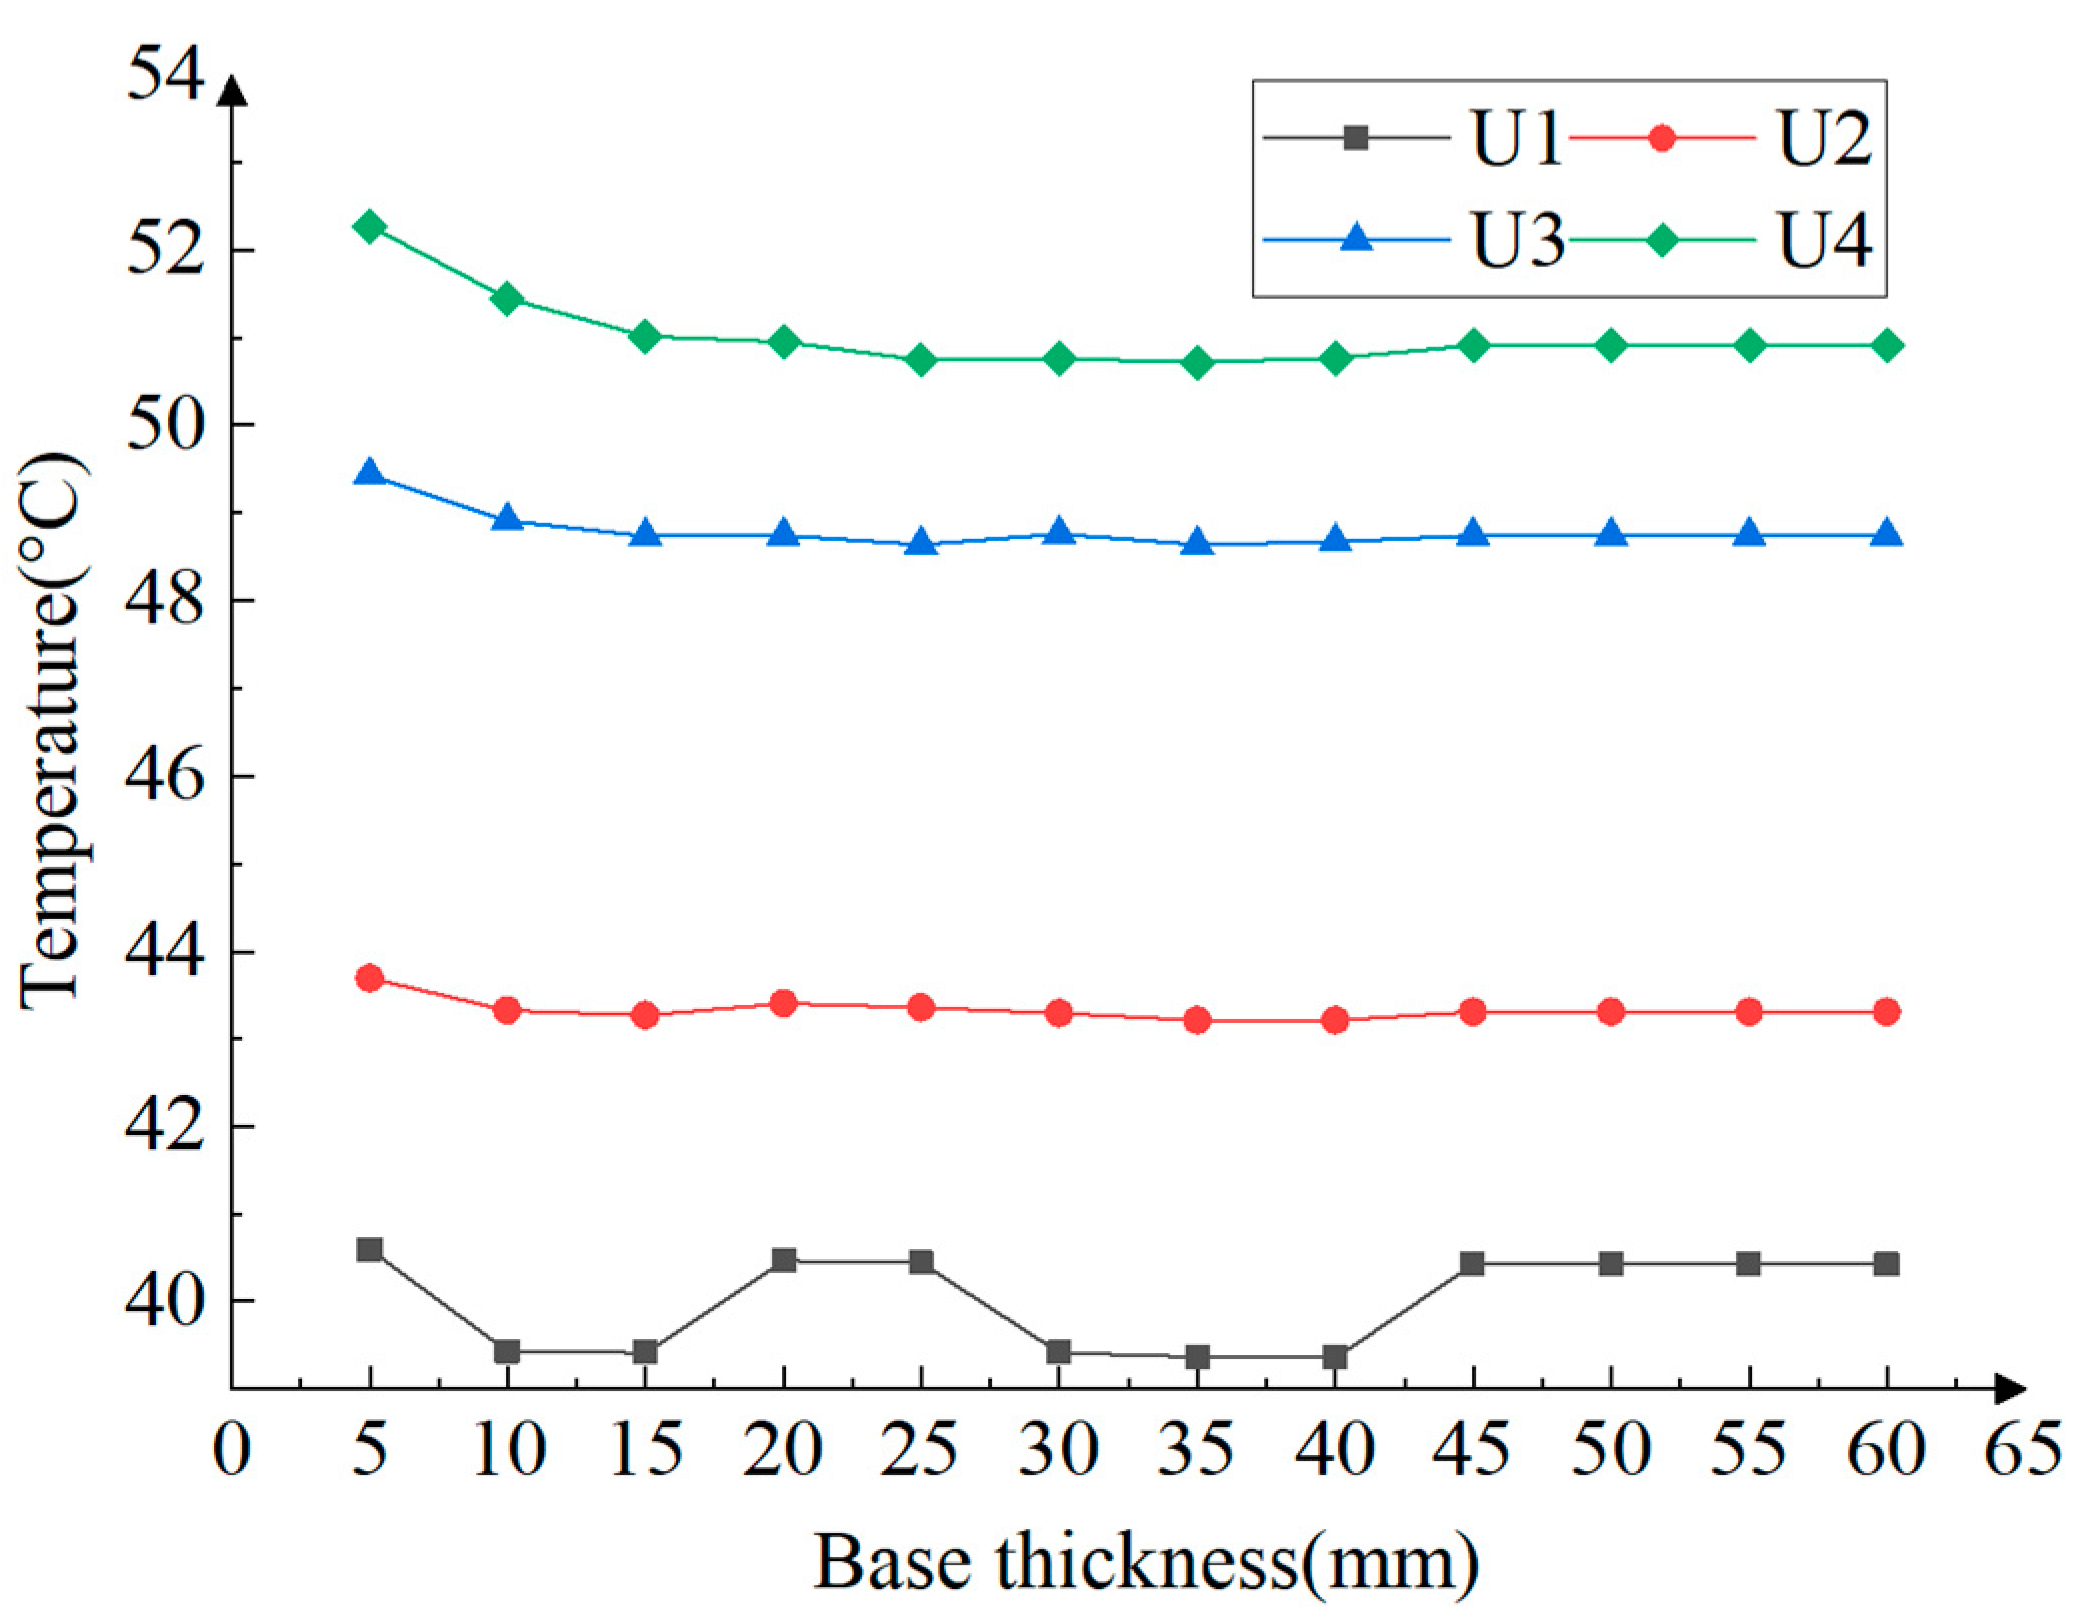
3.2. The Influences of Base Thickness on Thermal Performance

The total number of fins is set as 18. The fin thickness is set as 2 mm. The fin length is set as 16 mm. Then, the impacts of base thickness on the driver’s maximum temperature are analyzed. Five kinds of thicknesses are discussed here: 5 mm, 10 mm, 15 mm, 20 mm, and 60 mm. Figure 15 shows the temperatures of monitoring points on the U1, U2, U3, and U4 at various base thicknesses. When the thickness of the base increases from 5 mm to 60 mm, the temperature curve of the device U1 shows a trend of decreasing, increasing, decreasing, and increasing with the increase in the base thickness. After the thickness of the pedestal increases, the temperature curves of devices U2, U3, and U4 show a trend of first decreasing and then flattening. In addition, as the thickness of the base increases, the cross-sectional area of the thermal conductivity channel from base to fin inside the heat sink increases, which can strengthen the heat dissipation of the driver through conduction. However, when the thickness of the base increases, the distance between the device and the fins decreases (especially device U1); the heat will transfer back from the hot fin to the low-temperature parts of the driver via radiation and convection. Under the combined influences of two ways of heat transfer above, the temperature of device U1 decreases and then increases twice as the base thickness increases. When the thickness of the base reaches 40 mm, increasing the thickness of the base cannot improve the heat dissipation of the system. Therefore, the optimal base thickness is 40 mm, and the temperatures of devices U1, U2, U3, and U4 are reduced by 3%, 1.1%, 1.5%, and 2.9%, respectively. At this time, the temperatures of U1, U2, U3, and U4 monitoring points are 39.36 °C, 43.22 °C, 48.67 °C, and 50.77 °C.

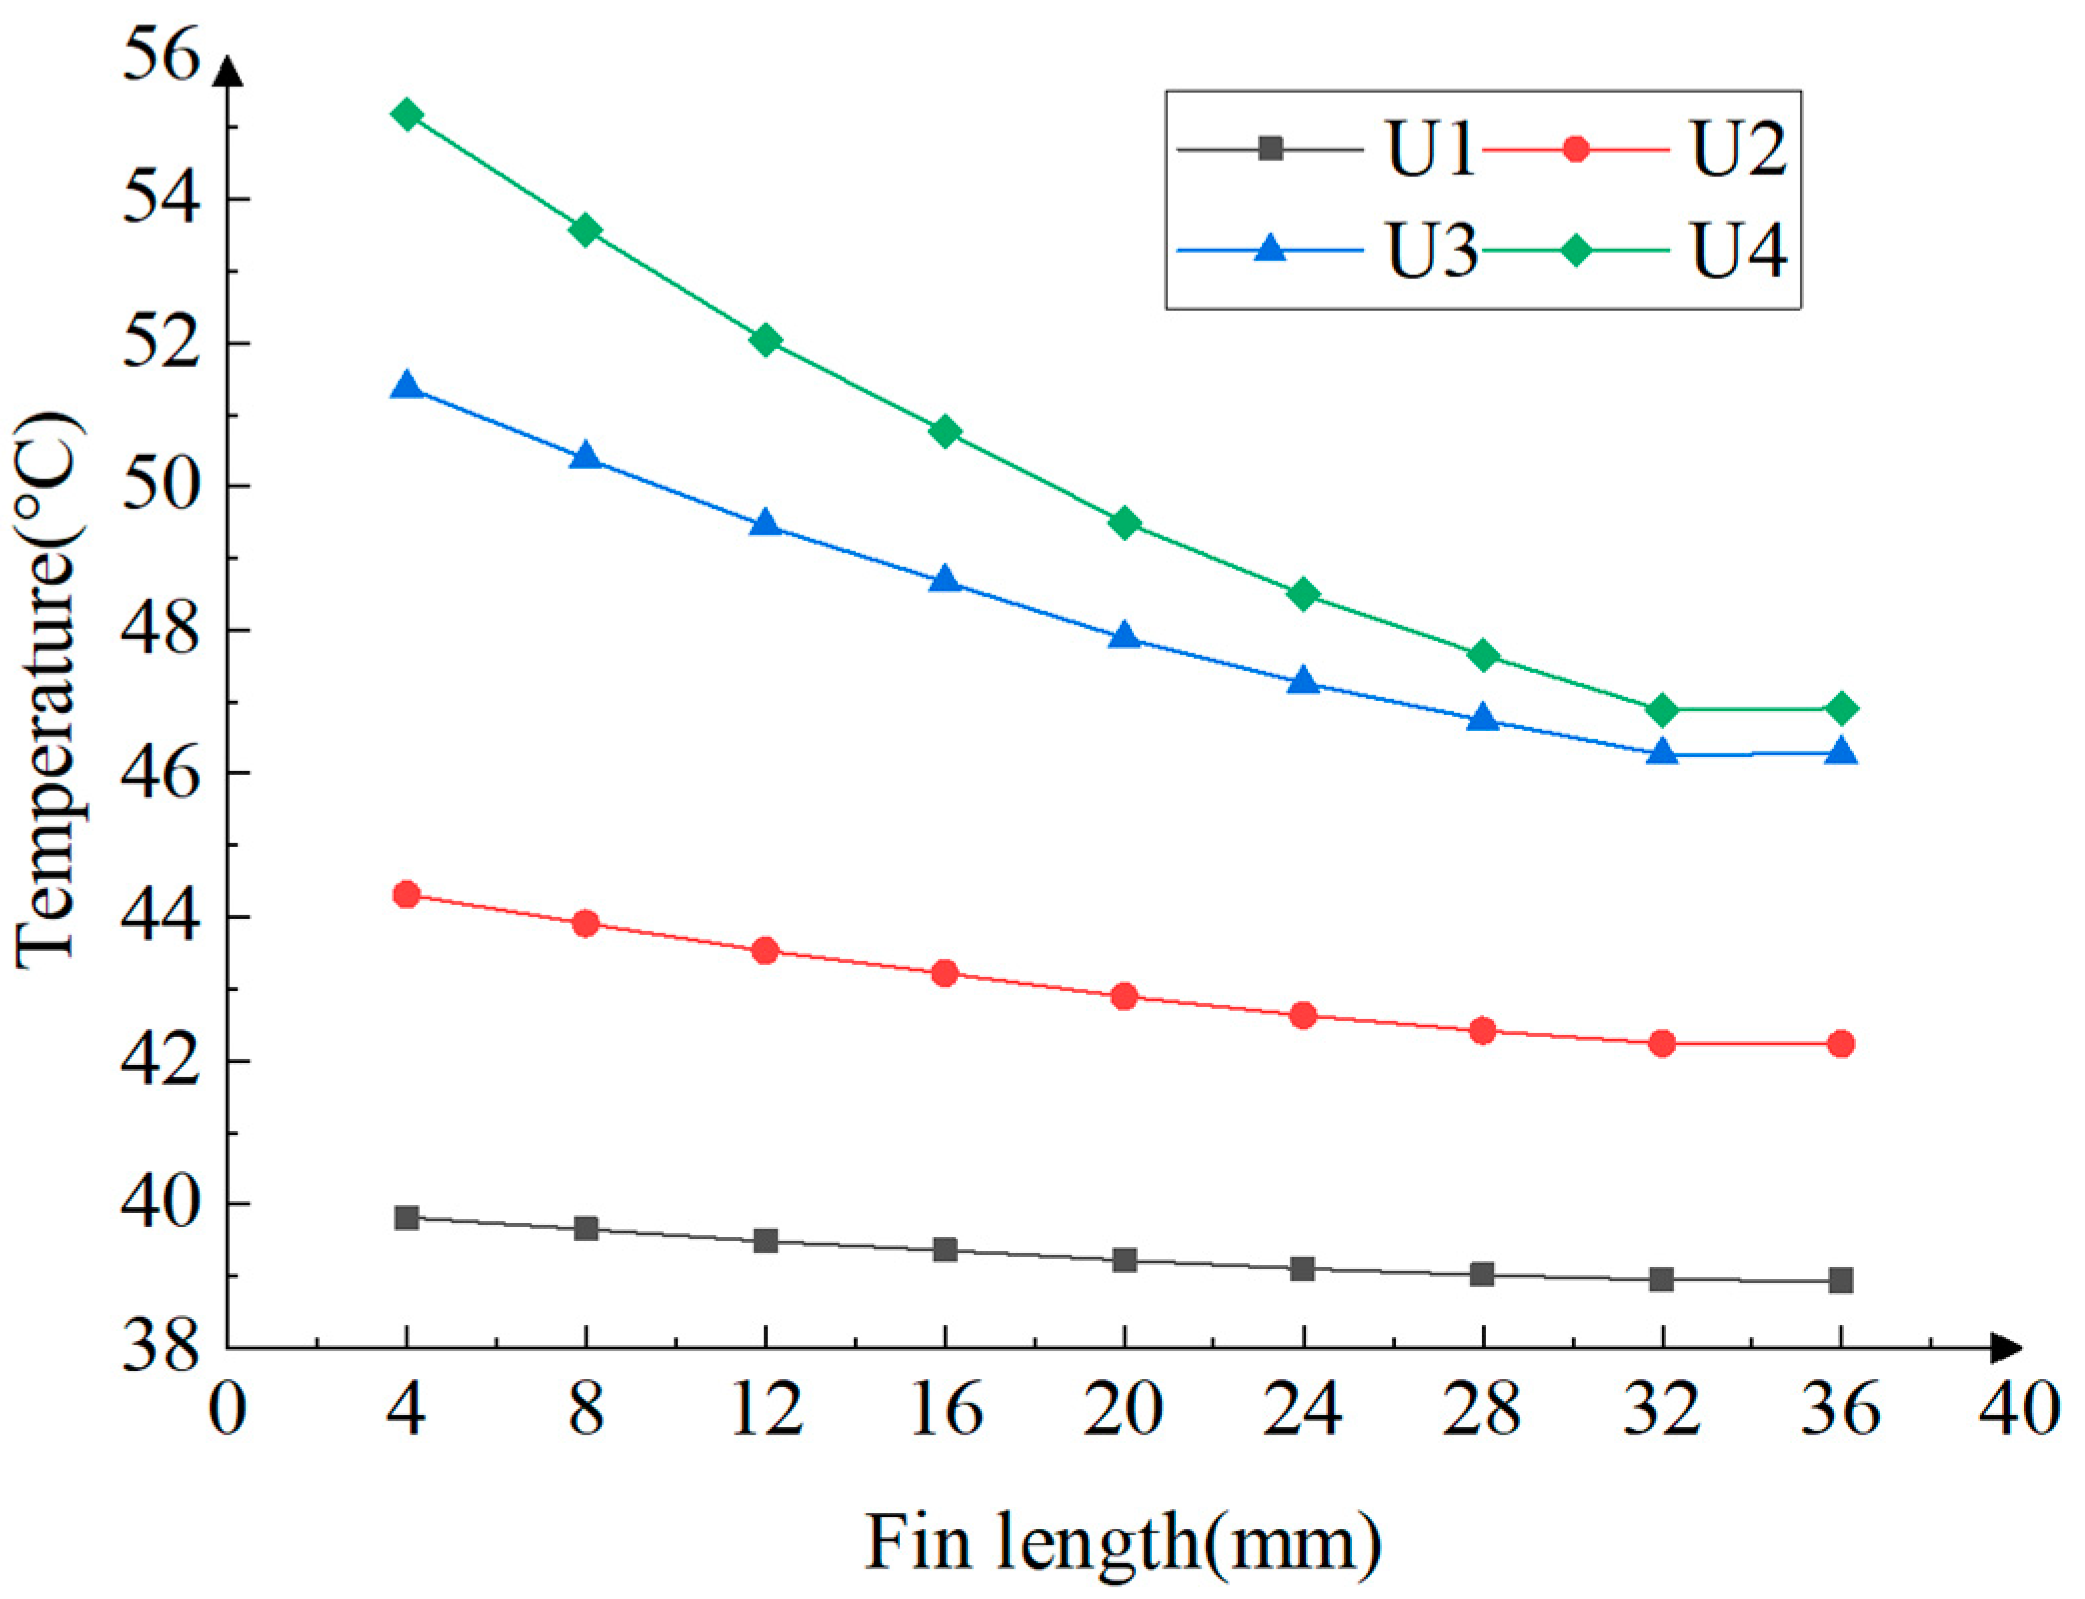
3.3. The Influences of Fin Length on Thermal Performance

The influences of fin length on thermal performance are studied from cases with the optimal base thickness of 40 mm, 2 mm fin thickness, and 18-fin system. While the fin length is larger than 36 mm, two rows of fins will contact each other. Therefore, the max value of fin length in the studied cases is 36 mm. Figure 16 illustrates how the lengthening of fins can help to decrease the device’s temperature. The temperatures of devices U1, U2, U3, and U4 all drop down as the fin length increases from 4 mm to 36 mm. The temperature decreased by approximately 2.2%, 4.7%, 9.9%, and 15% for U1 to U4, respectively. This is due to the fact that the lengthening of fins can increase their surface area for heat convection and so strengthen the heat transfer process. But, when the length of the fin is larger than 32 mm, the space between two rows of fins is very small. That causes the weakness of heat convection inside the rectangular hole of the heat sink. Then, the strengthening effect of increased fin area is canceled. Therefore, the optimal fin length for this cylindrical heat sink is about 32 mm. At this time, the temperatures of U1, U2, U3, and U4 monitoring points are 38.95 °C, 42.24 °C, 46.27 °C, and 46.89 °C.

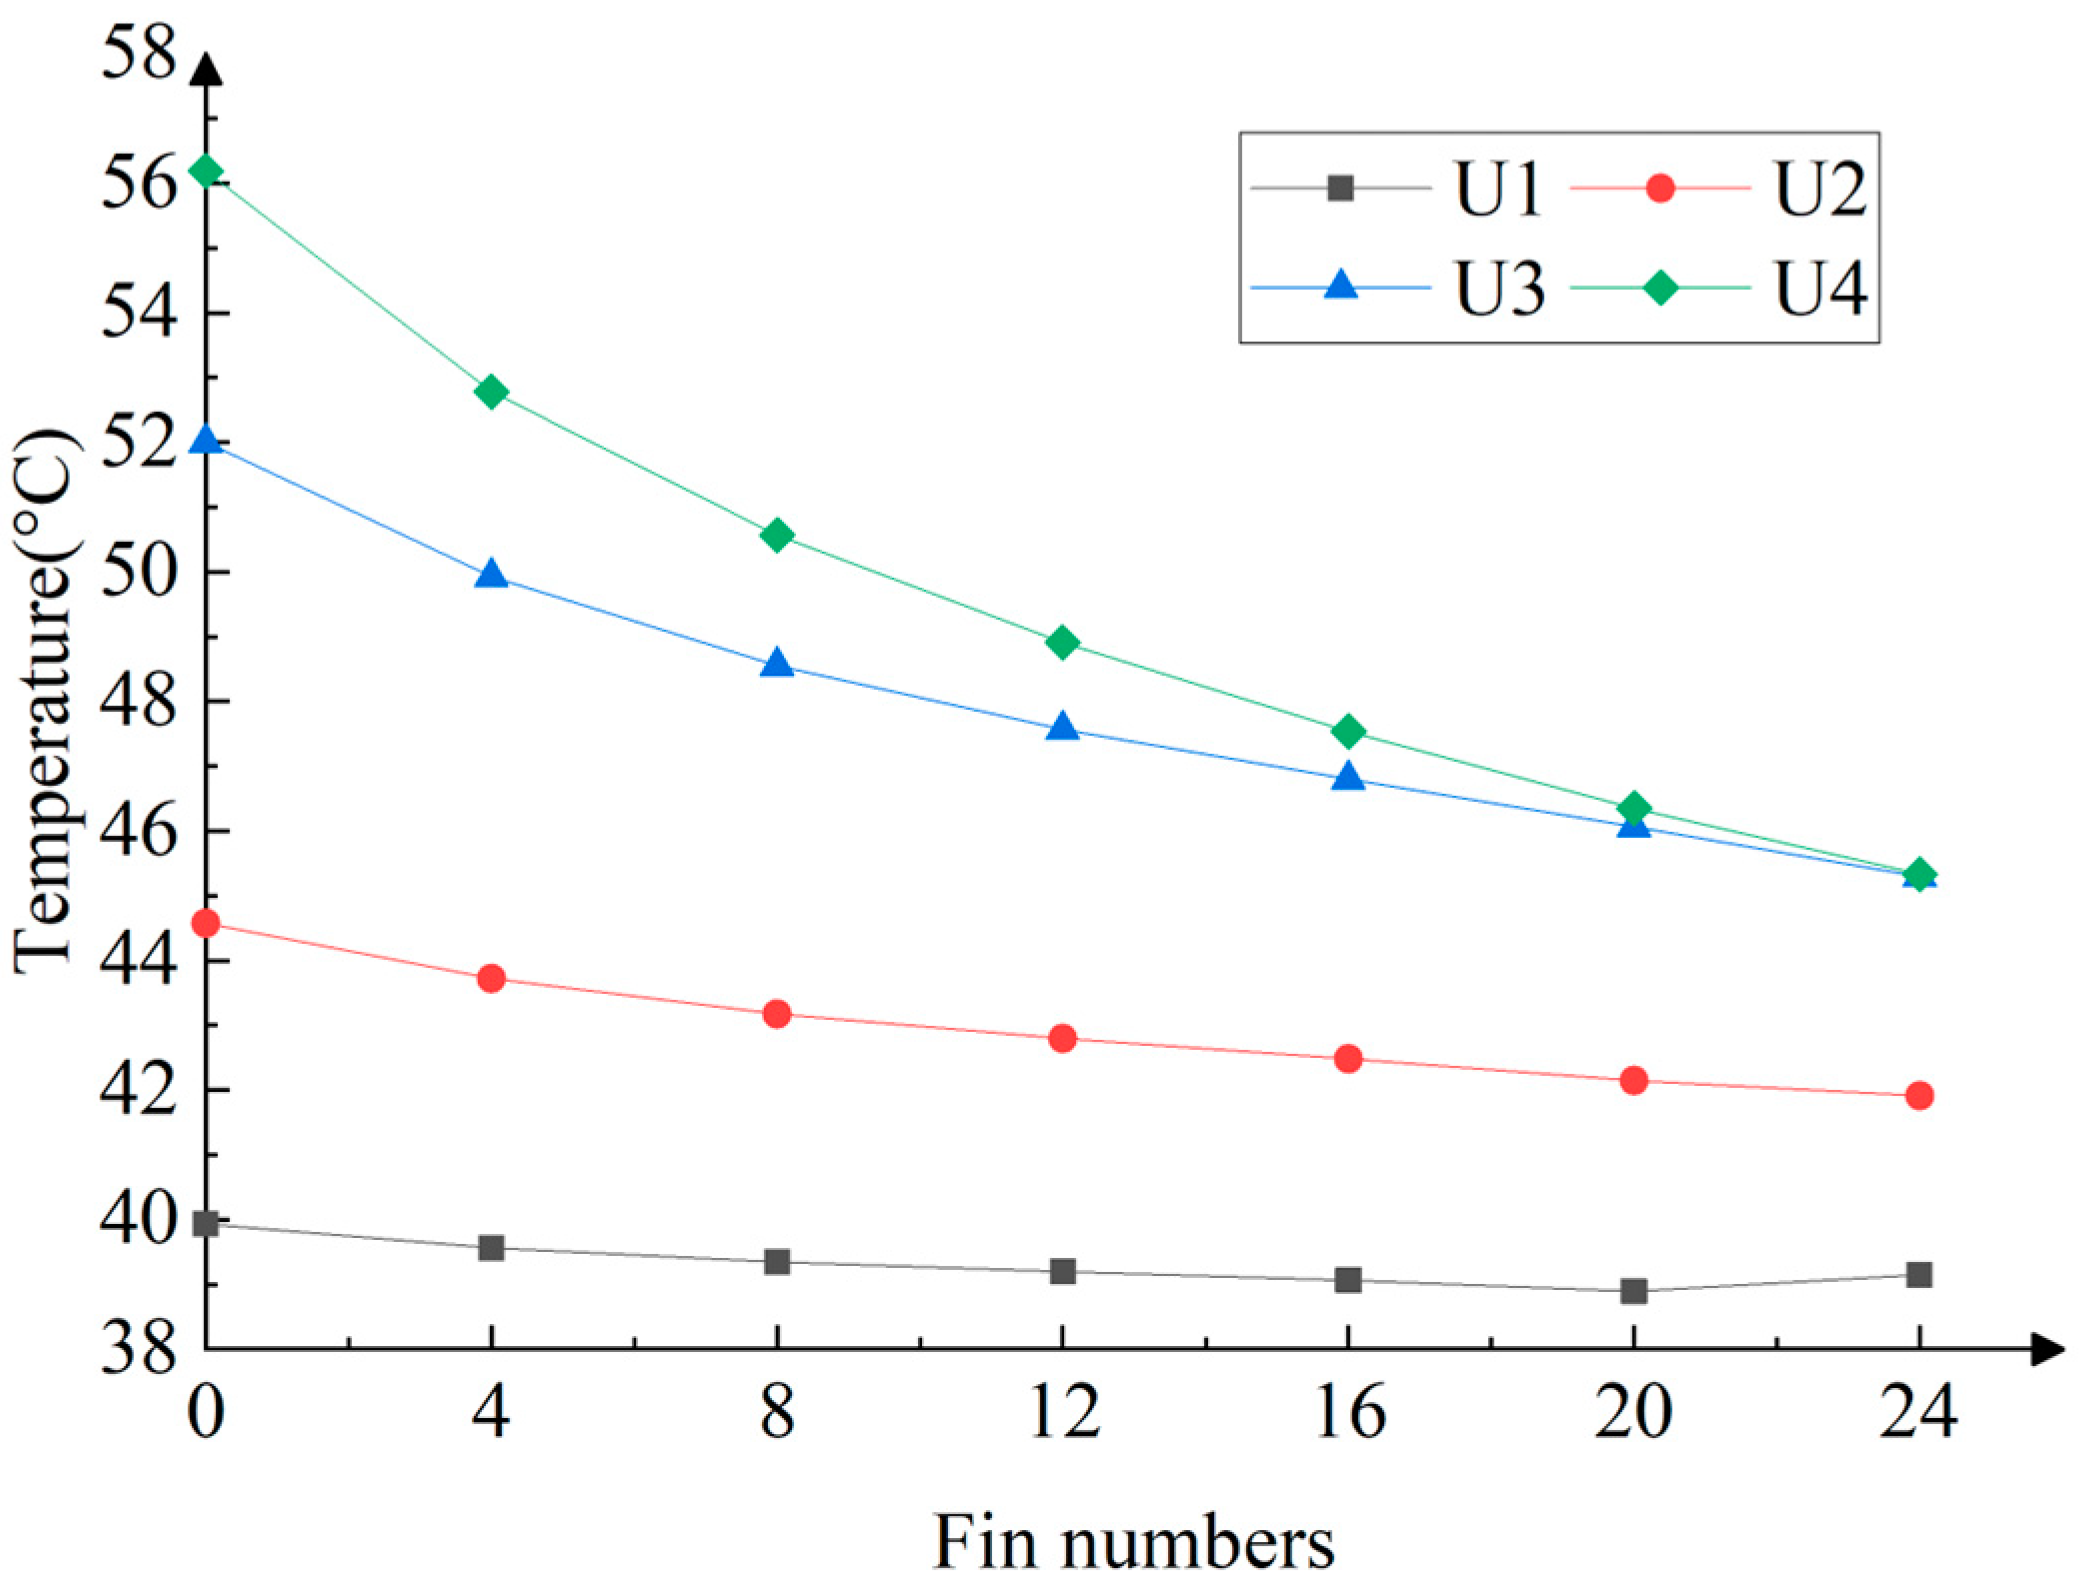
3.4. The Influences of Fin Numbers on Thermal Performance

The influences of fin numbers on thermal performance are studied from cases with a base thickness of 40 mm, fin thickness of 2 mm, and fin length of 32 mm. The temperatures of devices U1, U2, U3, and U4 are also used to monitor how the temperature changes with the fin numbers, as illustrated in Figure 17. It is shown that the driver temperature decreases as the fin number increases. That is also on account of the increase in the heat transfer surface area. Compared to the wing-free sections, the temperatures are reduced by about 1.96%, 5.97%, 12.9%, and 19.3% for U1, U2, U3, and U4, respectively, as the fin numbers increase from 4 to 24. When the number of fins is 24, the temperature of U1, U2, U3, and U4 is the lowest, and the temperature is 39.14 °C, 41.92 °C, 45.29 °C, and 45.33 °C.
According to the analysis results above, when the base thickness is 40 mm, the fin length is 32 mm, and the fin number is 24, the heat sink has the best presentation on heat dissipation.

4. Orthogonal Experiments

The analyses above demonstrate how variables, like base thickness, fin numbers, and fin length, will impact the thermal performance of the heat sink. Set three different variables for each factor: base thickness (factor 1, set to 20 mm, 30 mm, and 40 mm); fin numbers (factor 2, set to 4, 8, and 12); and fin length (factor 3, set to 12 mm, 24 mm, and 36 mm). Then, the significant effects of various factors on the performance of heat sinks are assessed. Following the optimization of the orthogonal experimental law, nine experimental groups are arranged in accordance with the orthogonal table L9 (33) [33] (as shown in Table 5).
In order to analyze the degree of influence of variables on heat transfer efficiency, the average maximum-temperature value of three levers for each variable is shown in Table 6. It can be seen from the variances that the base thickness has a very small impact on the maximum temperature of the driver. The fin length has a greater impact on the maximum temperature of the driver. The fin number has a great influence on the maximum temperature of the driver. This result is consistent with the simulation results obtained from Figure 15, Figure 16 and Figure 17.

5. Conclusions

The thermal performances of a certain kind of propeller driver are analyzed, mainly using the method of numerical simulation. Firstly, the model of the driver with a direct-board heat sink is built and analyzed with the numerical method. Then, the experiment is carried out to verify the feasibility of the numerical model. We then design a novel cylindrical heat sink and study the effects of its base thickness, fin length, and fin numbers on heat dissipation. Finally, the impact levels of three structure variables for the driver are accessed through the orthogonal experiment. The conclusions are listed as follows:
(1)
Compared to the initial straight-board heat sink, the cylindrical heat sink structure has a good heat dissipation ability. Under the same working conditions, the maximum temperature of the propeller driver can be reduced by 22.3%.
(2)
For the studied cylindrical heat sink, 29 simulation cases are carried out to analyze the influences of driver structure variables, such as base thickness, fin length, and fin numbers. It is shown that, generally speaking, the heat dissipation performance is strengthened by the increases in base thickness and fin length, as did the fin numbers. Considering the economics, there is an optimal solution for the cylindrical heat sink, that is, the heat sink with a base thickness of 40 mm, a fin length of 32 mm, and a fin number of 24.
(3)
Through orthogonal experiments, the base thickness has a very small impact on the working temperature of the driver. The fin numbers and the fin length have relatively greater impacts on the working temperature of the driver.

Author Contributions

Methodology, N.L. and M.L. and H.P.; simulation and experiment, N.L.; validation, N.L.; writing—original draft preparation, N.L.; writing—review and editing, M.L. All authors have read and agreed to the published version of the manuscript.

Funding

This research received no external funding.

Institutional Review Board Statement

Not applicable.

Informed Consent Statement

Not applicable.

Data Availability Statement

The data that support the findings of this study are available from the corresponding author upon reasonable request.

Acknowledgments

This work was supported by the Key R&D Program of Zhejiang Province (No. 2021C03013).

Conflicts of Interest

The authors declare no conflict of interest.

Nomenclature

Asurface area (m2)
athermal expansion coefficient (1/K)
cpSpecific heat capacity (J/(kg·K))
FBuoyancy force
GrGrashof number
gacceleration of gravity (m/s2)
hconvection heat transfer coefficient
lgeometrically set dimensions (m)
ppressure (Pa)
PrPrandtl number
Qheat transfer rate (J/s)
RaRayleigh number
τTime(s)
ttemperature(°C)
trefboundary temperature(°C)
uvelocity in the x-direction (m/s)
vvelocity in the y-direction (m/s)
wvelocity in the z-direction (m/s)
ρ fluid density (kg/m3)
STviscous dissipation term
Sumomentum source terms in the u-velocity direction
Svmomentum source terms in the v-velocity direction
Swmomentum source terms in the w-velocity direction
ν kinematic viscosity (m2/s)
λthermal conductivity (W/(m·K))
Φ ˙ internal heat source
Δttemperature difference
Acronyms
3DThree-dimensional
DCDirect current
LEDlight-emitting diode
PCMphase change materials
PCBPrinted circuit board

References

  1. Zhao, M.; Zhou, J.; Sun, H.; Wu, B.H. Si-Based Embedded GaAs Chip Packaging Technology and Its Thermal Analysis. Chin. J. Electron Devices 2020, 43, 477–481. [Google Scholar]
  2. Pi, X.L.; Li, R.L.; Wang, L.P. Simulation Study on Heat Dissipation Efficiency Calculation of High Power Semiconductor Rectifier Chip. Comput. Simul. 2020, 37, 66–69. [Google Scholar]
  3. Ma, J.; Xu, N. Research on Thermal Analysis Method of Chip Based on GPU. Appl. Res. Comput. 2018, 35, 773–776. [Google Scholar]
  4. Niu, F.; Zhao, X.M.; Huang, S.P.; Huang, X.Y.; Wu, L.J.; Fang, Y.T. Heat dissipation optimization of high power density motor driver. Electr. Mach. Control 2022, 26, 58–67. [Google Scholar]
  5. Sun, F.Y. Numerical Simulation and Experiment Study on Heat Sink with Heat Pipe for Chips. Power Electron. 2021, 55, 153–156. [Google Scholar]
  6. Wu, H.; Chen, M.; Gao, L.M.; Li, M. Effect of Solder Layer Voids on the Thermal Resistance of Power Device Package. Semicond. Optoelectron. 2013, 34, 226–230. [Google Scholar]
  7. Wei, N.; Liu, S.Y.; Wan, W.J.; Sun, W.F. A New Method for Measuring Thermal Resistance of Power MOSFET. Microelectronics 2014, 44, 131–134. [Google Scholar]
  8. Liu, P.H.; Su, M.Y.; Li, J.; Zhou, M.H. Research on Microchannel Heat Dissipation Based on High Power Density Chip Application. Power Electron. 2021, 55, 129–132. [Google Scholar]
  9. Zhang, R.P.; Sun, J.; Wang, H.P.; Feng, Q. Numerical Simulation of Heat Dissipation for Multiple Electronic Chips Under Forced Air Convection Cooling Conditions. Cryog. Supercond. 2015, 43, 61–65. [Google Scholar]
  10. Pan, Y.; Liu, X. Experimental Investigation on Flow and Heat Transfer of High Power Electronics Radiator. Power Electron. 2020, 54, 10–12. [Google Scholar]
  11. Wang, D.C.; Yang, X.Y.; Yang, F.S.; Hu, R.; Wang, Z.K.; Chen, X. Thermal Research and Optimization Design of High Voltage and High Power Chip Package. Microelectronics 2018, 48, 850–854. [Google Scholar]
  12. Coudrain, P.; Souare, P.; Colonna, J.P.; Vivet, P.; Prieto, R.; Ben-Jamaa, H.; Le Pailleur, L. Experimental insights into thermal dissipation in TSV-based 3D integrated circuits. IEEE Des. Test Comput. 2016, 1, 1. [Google Scholar]
  13. Timbs, K.; Khatamifar, M.; Antunes, E.; Lin, W. Experimental study on the heat dissipation performance of straight and oblique fin heat sinks made of thermal conductive composite polymers. Therm. Sci. Eng. Prog. 2021, 22, 100848. [Google Scholar] [CrossRef]
  14. Arshad, A.; Jabbal, M.; Sardari, P.T.; Bashir, M.A.; Faraji, H.; Yan, Y. Transient simulation of finned heat sinks embedded with PCM for electronics cooling. Therm. Sci. Eng. Prog. 2020, 18, 100520. [Google Scholar] [CrossRef]
  15. Hu, X.; Gong, X.; Zhu, F.; Xing, X.; Li, Z.; Zhang, X. Thermal analysis and optimization of metal foam PCM-based heat sink for thermal management of electronic devices. Renew. Energy 2023, 212, 227–237. [Google Scholar] [CrossRef]
  16. Mozafari, M.; Lee, A.; Mohammadpour, J. Thermal management of single and multiple PCMs based heat sinks for electronics cooling. Therm. Sci. Eng. Prog. 2021, 23, 100919. [Google Scholar] [CrossRef]
  17. Zhu, K.; Liu, Z.K.; He, W.; Chai, X. Optimal Design of CPU Water-cooled Radiator in a Data Center Server. J. Refrig. 2019, 40, 36–42. [Google Scholar]
  18. Yang, D.; Wang, Y.; Ding, G.; Jin, Z.; Zhao, J.; Wang, G. Numerical and experimental analysis of cooling performance of single-phase array microchannel heat sinks with different pin-fin configurations. Appl. Therm. Eng. Des. Process. Equip. Econ. 2017, 112, 1547–1556. [Google Scholar] [CrossRef]
  19. Wang, F.Y.; Fan, X.B. Calculation and Simulation of Heat Dissipation Efficiency of High Power Semiconductor Rectifier Chip. Sci. Technol. Eng. 2018, 18, 225–231. [Google Scholar]
  20. Wang, H.; Yuan, L.; Wang, C.; Wang, R.Z. Structural design and heat dissipation performance of periodic shunt microchannels. Acta Phys. Sin. 2021, 70, 200–211. [Google Scholar]
  21. Zhang, R.P.; Chen, C.; Wang, Y.F. Numerical study of electronic cooling based on phase change heat transfer of heat pipe. Cryog. Supercond. 2016, 44, 88–92. [Google Scholar]
  22. Yang, Z. Performance study of U—Shape flow channel water cooling radiator in data center server. Cryog. Supercond. 2019, 47, 91–96. [Google Scholar]
  23. Wu, L.W.; Lu, T.; Chen, J.J.; Wang, M.Y. A Study of Bionic Micro-channel Topology for Chip Cooling. Acta Electron. Sin. 2018, 46, 1153–1159. [Google Scholar]
  24. He, W.; Zhang, J.; Guo, R.; Pei, C.; Li, H.; Liu, S.; Wang, Y. Performance analysis and structural optimization of a finned liquid-cooling radiator for chip heat dissipation. Appl. Energy 2022, 327, 120048. [Google Scholar] [CrossRef]
  25. Song, G.; Kim, D.H.; Song, D.H.; Sung, J.B.; Yook, S.J. Heat-dissipation performance of cylindrical heat sink with perforated fins. Int. J. Therm. Sci. 2021, 170, 107132. [Google Scholar] [CrossRef]
  26. Bello-Ochende, T.; Liebenberg, L.; Meyer, J.P. Constructal cooling channels for micro-channel heat sinks. Int. J. Heat Mass Transf. 2007, 50, 4141–4150. [Google Scholar] [CrossRef]
  27. Khalid, S.U.; Hasnain, S.; Ali, H.M.; Bano, S.; Nasir, M.A.; Abbas, N. Experimental investigation of aluminum fins on relative thermal performance of sintered copper wicked and grooved heat pipes. Prog. Nucl. Energy 2022, 152, 104374. [Google Scholar] [CrossRef]
  28. Krstic, M.; Pantic, L.; Djordjevic, S.; Radonjic, I.; Begovic, V.; Radovanovic, B.; Mancic, M. Passive cooling of photovoltaic panel by aluminum heat sinks and numerical simulation. Ain Shams Eng. J. 2023; in press. [Google Scholar]
  29. Nemati, H. A general equation based on entropy generation minimization to optimize plate fin heat sink. Eng. J. 2018, 22, 159–174. [Google Scholar] [CrossRef]
  30. Zhu, Y.M.; Zheng, H.; Luo, X.B. Thermal Performance Study of a Novel Automotive Headlamps LED Module With Double Substrates. J. Eng. Thermophys. 2016, 37, 390–393. [Google Scholar]
  31. Holman, J.P. Heat Transfer; China Machine Press: Beijing, China, 2005. [Google Scholar]
  32. Li, B. FloTHERM Software Foundation and Application Example; China Water & Power Press: Beijing, China, 2014. [Google Scholar]
  33. Li, H.Q.; Wei, L.P.; Zhuang, Z.X.; Zheng, M.S. Temperature Control Characteristics And Heat Dissipation Structure Optimization Design Of Photovoltaic Phase Change System. Acta Energ. Sol. Sin. 2022, 43, 57–62. [Google Scholar]
Figure 1. (a) Driver device physical drawing. (b) Driver device model.
Applsci 13 07495 g001
Figure 2. (a) Computational domain. (b) discretized grid.
Applsci 13 07495 g002
Figure 3. The overall temperature distribution of the driver system.
Applsci 13 07495 g003
Figure 4. Temperature distribution of the 1st PCB layer components.
Applsci 13 07495 g004
Figure 5. Temperature distribution of the 2nd PCB layer components.
Applsci 13 07495 g005
Figure 6. The temperature distribution of the 3rd PCB layer components.
Applsci 13 07495 g006
Figure 7. The temperature distribution of the 4th PCB layer components.
Applsci 13 07495 g007
Figure 8. Temperature distribution of heat sink and base.
Applsci 13 07495 g008
Figure 9. Schematic diagram of the experimental system.
Applsci 13 07495 g009
Figure 10. The power sources in experiments.
Applsci 13 07495 g010
Figure 11. (a) the 1st PCB layer. (b) the 2nd PCB layer. (c) the 3rd PCB layer. (d) the contact region of the base and the heat sink.
Applsci 13 07495 g011
Figure 12. (a) Cylindrical heat sink model. (b) Cylindrical heat sink structure illustration: 1 base, 2 drivers, 3 fins.
Applsci 13 07495 g012
Figure 13. (a) Computational domain. (b) discretized grid. (c) discretized grid.
Applsci 13 07495 g013
Figure 14. The temperature field of the cylindrical heat sink and driver.
Applsci 13 07495 g014
Figure 15. Influences of base thickness on driver thermal performance.
Applsci 13 07495 g015
Figure 16. Influences of fin length on thermal performance.
Applsci 13 07495 g016
Figure 17. Influences of fin numbers on thermal performance.
Applsci 13 07495 g017
Table 1. The main parameters of the driver layer.
Layer NameSize (mm)Main Heating ComponentPower of the Main Heating Component (W)Quantity of the Main Heating Component
1st PCB layer36 × 30 × 0.8U10.151
2nd PCB layer36 × 30 × 0.8U20.11
3rd PCB layer36 × 33 × 0.4U30.351
4th PCB layer36 × 33 × 0.4U416
Table 2. The material property parameters of components.
Component NameMaterialThermal Conductivity
(W/(m·K))
U1silicon419
U2silicon419
U3silicon419
U4silicon419
Driving plateFR40.3
BaseAl6063201
Heat sinkAl6063201
ColumnPlastic Package5
ColumnCu385
Table 3. Mesh independence verification.
Maximum Grid Size (mm)Number of GridsMonitoring Point
Temperature (°C)
42,405,35254.84
34,225,22155.61
2.56,341,55655.34
Table 4. Numerical simulation temperature values and experimental measurement temperature values.
Temperature Measurement Position1st PCB
Layer
2nd PCB
Layer
3rd PCB
Layer
The Connection between the Base and Heat Sink
Simulation results/°C59.562.465.663.8
Experimental results/°C59.664.46663.3
Table 5. Orthogonal experimental data.
No.Base Thickness/mmFin NumberFin Length/
mm
Maximum Temperature/°C
12041254.1
22082449.4
320123645.9
43042451.7
53083647.6
630121251.1
74043650.6
84081252.6
940122447.2
Table 6. Parameters of intuitive analysis method.
Maximum TemperatureMaximum Temperature/°C
Variable 1Variable 2Variable 3Variance
Factor 149.8050.1350.130.0363
Factor 252.1349.8748.074.1385
Factor 352.6049.4348.035.4823
Disclaimer/Publisher’s Note: The statements, opinions and data contained in all publications are solely those of the individual author(s) and contributor(s) and not of MDPI and/or the editor(s). MDPI and/or the editor(s) disclaim responsibility for any injury to people or property resulting from any ideas, methods, instructions or products referred to in the content.

