Article

Robustness Optimization of Cloud Manufacturing Process under Various Resource Substitution Strategies

1
School of Economics and Management, University of Science and Technology Beijing, Beijing 100083, China
2
China Academy of Launch Vehicle Technology, Beijing 100076, China
*
Author to whom correspondence should be addressed.
Appl. Sci. 2023, 13(13), 7418; https://doi.org/10.3390/app13137418
Submission received: 26 May 2023 / Revised: 20 June 2023 / Accepted: 21 June 2023 / Published: 22 June 2023
(This article belongs to the Special Issue Design and Optimization of Manufacturing Systems)

Abstract

:
Cloud manufacturing is characterized by large uncertainties and disturbances due to its networked, distributed, and loosely coupled features. To target the problem of frequent cloud resource node failure, this paper proposes (1) three resource substitution strategies based on node redundancy and (2) a new robustness analysis method for cloud manufacturing systems based on a combination of the complex network and multi-agent simulation. First, a multi-agent simulation model is constructed, and simulation evaluation indexes are designed to study the robustness of the dynamic cloud manufacturing process (CMP). Second, a complex network model of cloud manufacturing resources is established to analyze the static topological robustness of the cloud manufacturing network. Four types of node failure modes are defined, based on the initial and recomputed topologies. Further, three resource substitution strategies are proposed (i.e., internal replacement, external replacement, and internal–external integration replacement) to enable the normal operation of the system after resource node failure. Third, a case study is conducted for a cloud manufacturing project of a new energy vehicle. The results show that (1) the proposed robustness of service index is effective at describing the variations in CMP robustness, (2) the two node failure modes based on the recalculated topology are more destructive to the robustness of the CMP than the two based on the initial topology, and (3) under all four failure modes, all three resource substitution strategies can improve the robustness of the dynamic CMP to some extent, with the internal–external integration replacement strategy being most effective, followed by the external replacement strategy, and then the internal replacement strategy.

1. Introduction

In the era of Industry 4.0, with the rapid development of Internet technology, information technology, and manufacturing technology, the traditional large-scale manufacturing mode is gradually being replaced by customized service modes. A series of advanced networked manufacturing modes, such as application service providers, manufacturing grids, agile manufacturing, and global manufacturing have been proposed successively [1]. In this context, Li et al. [2] introduced the concept of “cloud manufacturing”—a new service-oriented networked manufacturing mode that gathers manufacturing resources and capabilities together on the cloud platform, escaping the limitations of space and distance; through service integration, the sharing of manufacturing resources and capabilities is fully realized [3]. Since its inception, cloud manufacturing has attracted widespread attention because of its advanced ideas and technical concepts [4].
The cloud manufacturing mode extends the manufacturing environment to multiple user subjects, service subjects, and geographical spaces. As such, it faces a high level of uncertainty and disturbance [5]. The cloud manufacturing system (CMS) can reduce the impact of some disturbances (e.g., demand change, order fluctuation, and emergency order insertion) through its own flexible configuration and self-adjustment strategies, but relatively serious disturbances can cause a variety of damage, such as insufficient supervision of the cloud platform, random the withdrawal of cloud service providers from the platform, the failure of cloud resource nodes, and the interruption of cloud paths, among others [6]. Therefore, it is of great practical significance for the implementation and deployment of cloud manufacturing projects to accurately identify the impact of uncertain environments on cloud manufacturing [7,8,9], explore the robustness level of the cloud manufacturing process (CMP) under different interference modes, and formulate corresponding robustness recovery strategies to improve the stability and anti-interference of the system [10,11,12].

2. Related Works

2.1. Robustness Analysis Study of Manufacturing Systems

Many scholars have conducted research on the robustness of advanced manufacturing systems and networks. Gao et al. [13] applied complex network theory to the manufacturing industry, proposing the construction method of the complex network failure model. Yana et al. [14] proposed that the vulnerability of the manufacturing network may lead to new risks; they analyzed the topology structure and vulnerability of the cloud manufacturing network (CMN) and put forward management suggestions. Cauvin et al. [15] analyzed the impacts of interruption events on the entire industrial system and proposed a cooperative repair approach based on a distributed industrial system to limit these impacts. Li et al. [16] established a collaborative manufacturing services network model using the complex network method, defined six fault types, and proposed corresponding fault detection methods. Further, the cascaded propagation characteristics of different faults were revealed, and corresponding control strategies were proposed. Lachenmaier et al. [17] analyzed the changing individualized requirements, risks, and possible solutions in cyber-physical systems. Galaske and Anderl [18] proposed a decision support method for the terminal management process of a cyber-physical production system, modeling and simulating respective scenarios of interruption events and response strategies. Hou [19] established the process relationship network of the flexible job shop by analyzing the relationships among basic production factors, such as machines and workpieces in the shop. They proposed adaptive preventive maintenance and buffer time insertion strategies. Zhang [20] proposed the definition of the manufacturing product assurance network; they established an evolutionary model of the manufacturing product assurance weighted network on this basis, and then analyzed the robustness characteristics of the network.
Such research demonstrates that cloud manufacturing and other advanced networked manufacturing modes have large uncertainties and risks due to their networked, distributed, and loosely coupled characteristics. Robustness analysis of these modes has become a popular issue in academic circles, with many scholars exploring this from a variety of perspectives.

2.2. Robustness Enhancement Strategies and Recovery Measures

The specific robustness enhancement and defense strategies vary from network to network, but from the perspective of a network structure, establishing redundant nodes or links is one of the most common methods to improve network robustness. As early as 2005, Beygelzimer et al. [21] proposed that people are usually faced with the problem of improving the robustness of an existing network that cannot be substantially modified or redesigned: only minor modifications are allowed, such as adding new nodes, reconnecting partial edges, or adding new edges. Ma [22] stated that the robustness of the whole network can be improved by increasing the number of reliable nodes in the network or improving the reliability of a small number of nodes in the network. Ji et al. [23] argued that it is impossible to enhance the reliability of every node in the network, so it is instead necessary to specify the priority of nodes and links and focus on their protection. Regarding the study of reliable nodes, Li [24] proposed a heuristic scheduling rule based on controlling critical nodes for the scheduling optimization of the job shop in a disturbed environment, and Wang [25] used both the improved node shrinkage method and the triangular fuzzy number method to comprehensively evaluate the importance of nodes in the network, proposing corresponding improvement measures in terms of critical node protection. Regarding the study of adding links (i.e., connected edges), Ji et al. [23] proposed two new strategies: low inter degree–degree difference addition and random inter degree–degree difference addition. They verified the effectiveness of these proposed strategies through a comparison with four existing link-addition strategies (i.e., random addition, low degree addition, low betweenness addition, and algebraic connectivity-based addition). Wang et al. [26] proposed a preferred connectivity strategy based on the structure of interdependent networks. They applied this strategy to three existing link-addition strategies (i.e., random addition, low degree addition, and low inter degree–degree difference addition), finding that each improved strategy was significantly better than the previous one in terms of robustness improvement. The effects of link-addition strategies on the improvement of the robustness of different networks have been further investigated [27,28,29,30].
Measures such as adding redundant nodes and connected edges can effectively improve network robustness. As such, these measures are receiving increasing attention from scholars, and they also provided ideas for the design of the cloud manufacturing-based robustness improvement strategy in this paper. Targeting the problem of frequent cloud resource node failure, this paper attempts to establish redundant nodes so that appropriate alternative resources [31] can be used to avoid the complete breakdown of the manufacturing process or system when the original manufacturing resource nodes fail. Based on this and the background characteristics of cloud manufacturing, this paper presents three kinds of robustness improvement strategies: internal resource replacement, external resource replacement, and internal–external integration replacement.

2.3. Multi-Agent Simulation Study of Cloud Manufacturing System

The existing research on the robustness of advanced manufacturing systems mostly uses the complex network analysis method, which is well suited to reflect the structural characteristics of the system. As a type of networked manufacturing mode, the structural characteristics of cloud manufacturing is a key topic in robustness research; however, the dynamic operation process, logical judgment, and dynamic temporal relationship among entities are also aspects of cloud manufacturing that should be focused on.
The CMS contains a variety of entities, and various forms of behavior interaction and information transfer exist between the same entities and different entities, showing the characteristics of the complex system. Analyzing the complexity through simple, intelligent, and autonomous entities, such as agents in multi-agent systems, is considered an appropriate approach to address this challenge in industrial scenarios [32]. Further, the multi-agent simulation modeling of the CMS is presently a popular research topic. For example, Zhao et al. designed and implemented an agent-based cloud manufacturing simulation platform, where the simple reflective agent was used to encapsulate the resources and the complex agent was used to encapsulate the services. This gave the cloud platform a five-layer architecture (i.e., the data layer, low tool layer, management layer, upper tool layer, and application layer). Dobrescu et al. [33] proposed a cloud simulation platform to provide computing resources and services for the hybrid simulation of virtual manufacturing systems, and Chen and Chiu [34] developed a cloud-based factory simulation experiment system. Zhang et al. [35] analyzed typical smart manufacturing simulation techniques from three aspects: manufacturing unit simulation, manufacturing integration simulation, and manufacturing intelligence simulation. In addition, some scholars have conducted multi-agent simulation modeling research on cloud manufacturing from multiple perspectives, such as cloud service entity encapsulation [36,37], selection and scheduling [38,39,40], and trust and security issues [5,8], among others. Multi-agent simulation has become an important tool for cloud manufacturing research, yet current multi-agent simulation research on the robustness of cloud manufacturing appears relatively rare.
This paper proposes a robustness analysis method that combines the complex network and multi-agent simulation to investigate the optimization and enhancement of CMS robustness under multiple resource substitution strategies. The complex network perspective can reflect the structural robustness of CMSs, while multi-agent simulation can consider the process robustness of CMSs from multiple dimensions, such as time, cost, quality, and reliability. The combination of these two perspectives extends the robustness analysis object of the CMS from the CMN to the CMP, thereby realizing the dual-dimensional analysis of the static structure and dynamic process of CMS robustness.
The rest of this paper is arranged as follows. Section 3 constructs a multi-agent simulation model of the CMP and proposes process robustness indexes from the simulation perspective. Section 4 establishes a complex network model of cloud manufacturing resources and selects structural robustness metrics from the network perspective. Section 5 defines four types of resource node failure modes and three types of resource replacement strategies to deal with resource failure. Section 6 conducts a case study, combining multi-agent simulation software Anylogic and Python 3.0 tools to study the changes in the robustness of cloud manufacturing under different failure modes. Section 7 provides the research conclusions and future prospects.

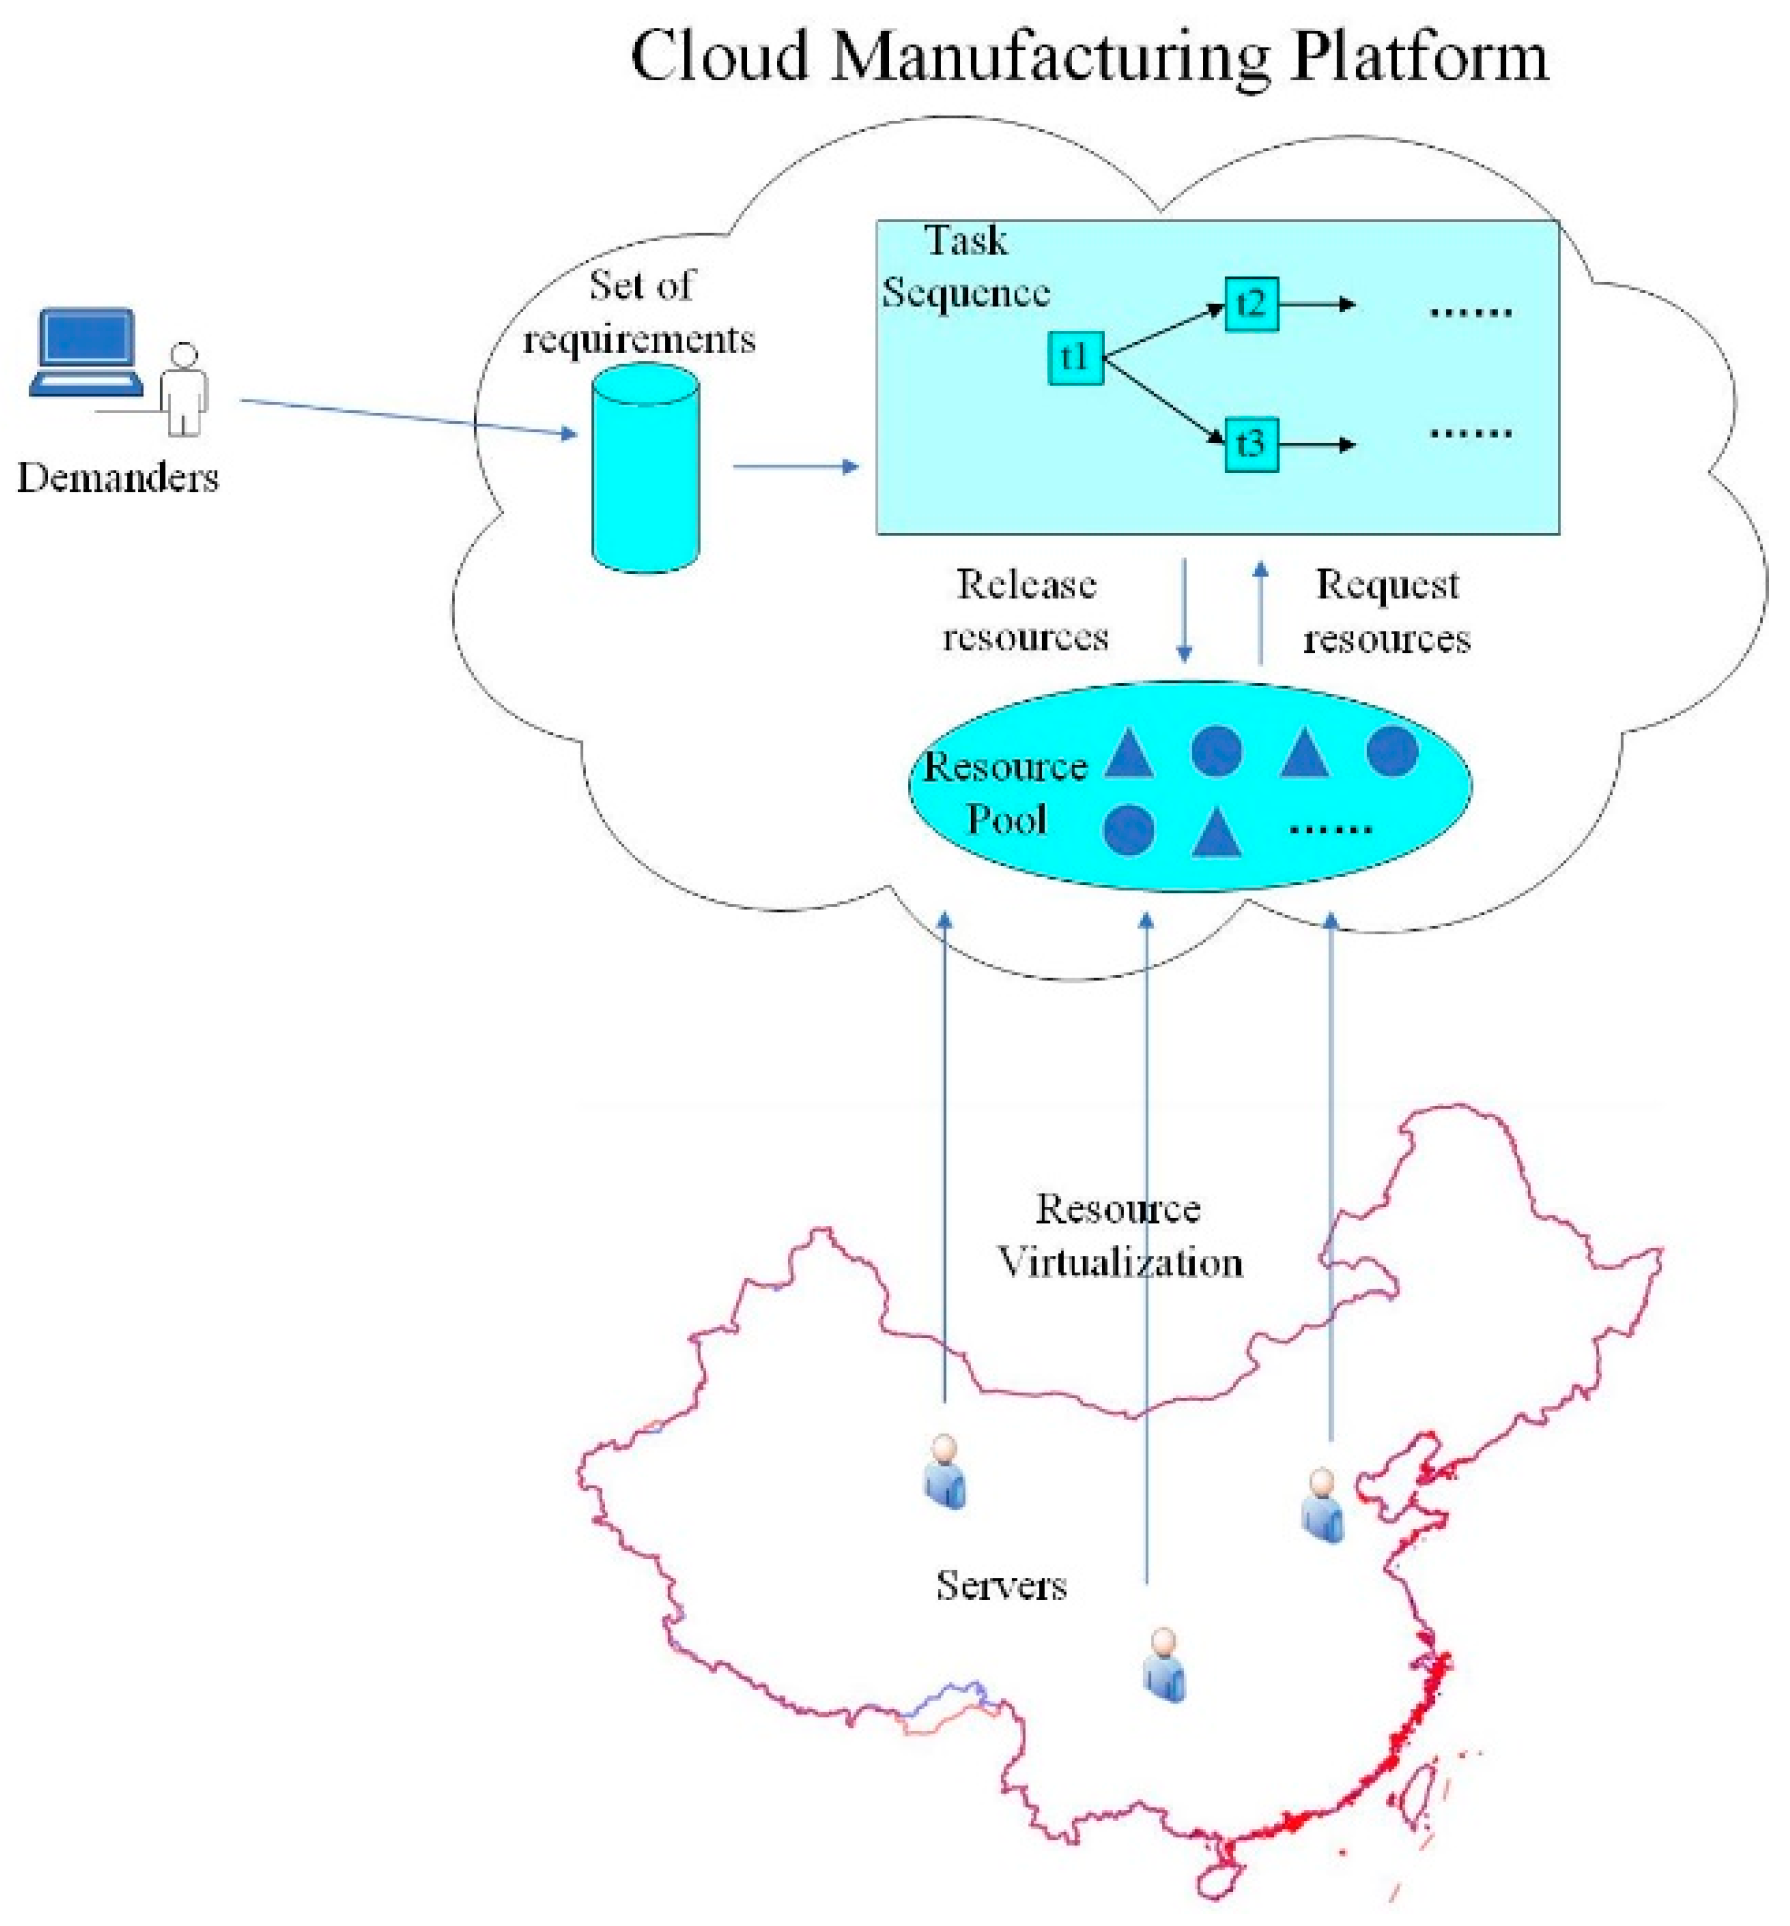
3. Model of the Cloud Manufacturing Process and Robustness Evaluation Indicator Based on Multi-Agent Simulation

3.1. Construction of Multi-Agent Simulation Model

The cloud platform, cloud task, cloud resource, cloud message, cloud order, and other types of subjects are all contained in the CMS, along with two different types of user roles: cloud service providers and cloud demanders [41]. The CMP [2] basically entails the following, as indicated in Figure 1:
(1)
Through information transformation, resource sensing, resource access, unified modeling of cloud services, and other technologies, cloud service providers integrate different kinds of manufacturing equipment and manufacturing capability resources into the cloud platform and deposit them into the cloud resource pool. This allows globally distributed resources to be managed and shared centrally, thereby circumventing the spatial and geographical limitations.
(2)
Utilizing terminal devices, cloud demanders submit their requests for services (i.e., orders) to the cloud platform. The cloud demand set uniformly stores orders awaiting processing from various cloud demanders.
(3)
In accordance with the service route of the to-be-processed order, the cloud platform integrates and adapts various cloud tasks to create structured and reliable cloud task sequences.
(4)
In order to perform cloud manufacturing services, the platform imports each order into the appropriate cloud task sequence when the cloud demand set is not vacant. Based on the task type, the appropriate resources are requested from the resource pool while processing cloud tasks. After being requested, resources in an inactive state transition to a busy state. The resource is released and returned to an idle state once the assignment has been finished.
Multiple entity types are present in the CMS, and numerous forms of information transmission and behavior interactions occur among entities of the same and different types. Consequently, the CMS model can be stated as follows:
C M S = { P A , D A , S A , T A , R A , O A , M A , E }
where  P A  represents the cloud platform agent;  D A  represents the cloud demander agent;  S A  represents the cloud service agent;  T A  represents the cloud task agent;  R A  represents the cloud resource agent;  O A  represents the order agent issued by  D A M A  represents the message agent sent to  S A  when  T A  requests or releases resources; and  E  represents the external environment of information transmission and inter-entity behavior interaction.

3.1.1. Modeling of Cloud Resource Agent

Through information transformation, resource access, cloud service unified modeling, and other technology, service providers’ manufacturing equipment and manufacturing capacity resources are integrated into the cloud resource pool to create virtual resources known as cloud resources. The primary function of the cloud resource agent is to collaborate with cloud tasks to finish the processing of cloud orders:
R A 0 = I D , p r o d u c e L e v e l , b u s y , b r o k e n , o w n e r , p r i c e
where  I D  represents the resource’s special identification number;  p r o d u c e L e v e l  is an integer ranging from 1 to 10 that specifies the resource’s productivity level;  b u s y  indicates whether the resource is in a busy condition;  b r o k e n  shows whether the resource is defective;  o w n e r  identifies which cloud server the resource belongs to; and  p r i c e  denotes the resource’s cost, which is randomly generated using a normal distribution at model startup.
Considering the resource substitution strategies developed in this paper in the face of resource failure (see Section 5.2 for details), it is necessary to continue expanding the attributes of cloud resource agents:
R A = R A 0 + r e p l a c e _ R e s o u r c e , r e p l a c e _ R a t e
where  r e p l a c e _ R e s o u r c e  specifies the alternative resource type  R j  for each resource type  R i , with this model assuming that  R i  and  R j  are mutually substitutive; and  r e p l a c e _ R a t e  is the replacement rate (i.e., matching rate) of the replacement resource. Although the substitute resource can replace the original resource to complete the established cloud task, there is an increase in the total work time. The resource replacement rate is generated by a normally distributed random number at the time of model initialization.

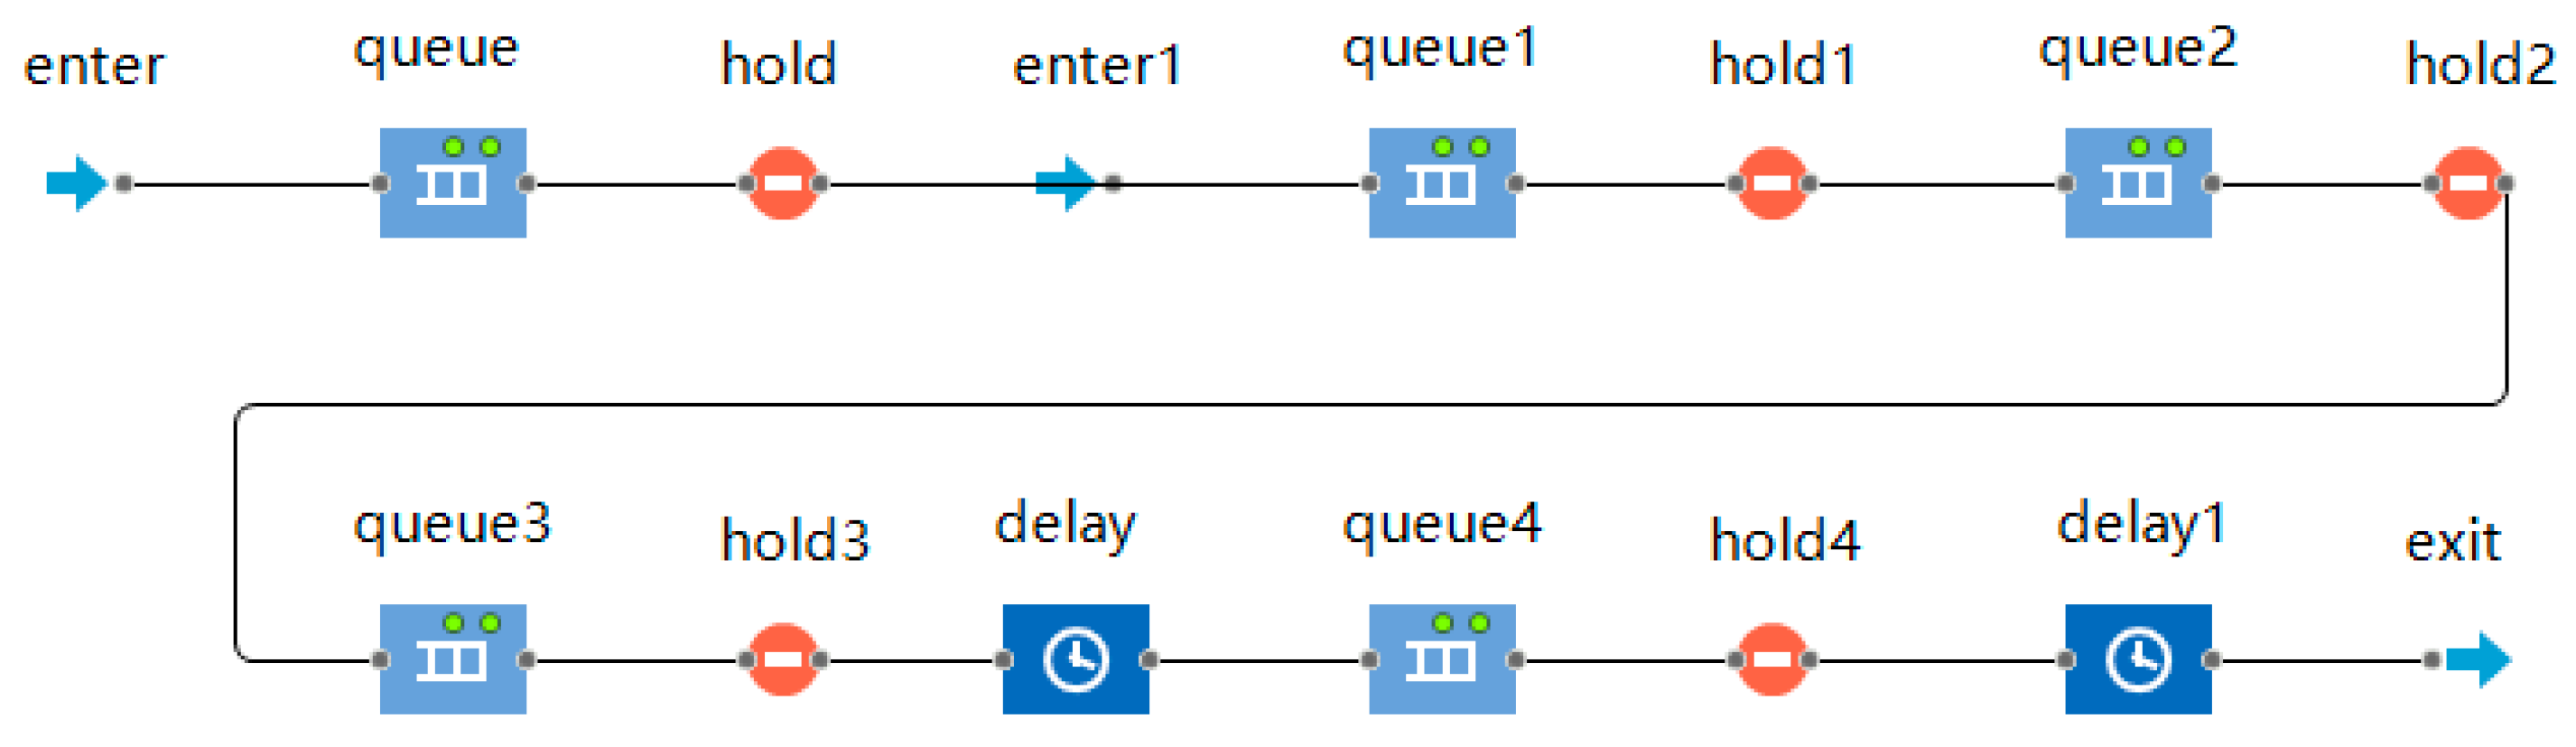
3.1.2. Modeling of Cloud Task Agent

The development of the cloud task agent is essential to cloud manufacturing simulation modeling. It encompasses both the behavior interaction and information transfer between the cloud server agent and the cloud resource agent, in addition to the processing path for all order kinds (e.g., serial, parallel, and hybrid paths). The cloud task agent further generates (a) the mechanism for choosing the best service provider, (b) numerous statistical data, including the service cycle and cost, and (c) information on the cloud task and cloud resource nodes. The existing process modeling library components are modified accordingly to accomplish this goal. The following is a description of the cloud task agent:
T A 0 = I D , o w n e r _ O r d e r s , p r e _ t a s k L i s t , a f t e r _ t a s k L i s t , r e q u e _ r e s o u r c e L i s t , b a s i c W o r k i n g T i m e , c u r r e n t O r d e r , F u n c s e l e c t B e s t S e r v e r , F u n c s e l e c t B e s t R e s o u r c e , F u n c r e c o r d R o u t e S t a m p , F u n c r e c o r d T a s k T i m e , F u n c r e c o r d T a s k C o s t , F u n c r e c o r d T a s k R e l i a b i l i t y
where  I D  represents the task’s special identification number;  o w n e r _ O r d e r s  identifies which type of order processing path the task belongs to;  p r e _ t a s k L i s t  and  a f t e r _ t a s k L i s t  designate the pre-order and post-order tasks, accordingly;  r e q u e _ r e s o u r c e L i s t  indicates the resource type requested by the task.  b a s i c W o r k i n g T i m e  specifies the average time required to complete a task;  c u r r e n t O r d e r  indicates the order being processed at the moment;  F u n c s e l e c t B e s t S e r v e r  identifies the best server by considering the resource cost, logistics, distance, and other variables;  F u n c s e l e c t B e s t R e s o u r c e  decides the best resource;  F u n c r e c o r d R o u t e S t a m p  records the order–task and task–resource relationships for finished orders;  F u n c r e c o r d T a s k T i m e F u n c r e c o r d T a s k C o s t , and  F u n c r e c o r d T a s k R e l i a b i l i t y  record, respectively, the service time, the service cost, and the service reliability of the present task.
Again, it is necessary to continue expanding the attributes of cloud task agents:
T A = T A 0 + i s _ i n t e r n a l R e p l a c e , i n t e r n a l _ r e p l a c e R e s o u r c e , i n t e r n a l _ r e p l a c e R a t e , i n t e r n a l _ r e p l a c e S e r i a l , i s _ e x t e r n a l R e p l a c e ,   e x t e r n a l _ P a r t n e r , e x t e r n a l _ r e p l a c e S e r i a l , F u n c c a l c u W o r k i n g T i m e
where  i s _ i n t e r n a l R e p l a c e  indicates whether the current cloud task process has invoked the internal resource replacement strategy;   i n t e r n a l _ r e p l a c e R e s o u r c e  specifies the replacement resource selected under the internal replacement strategy;  i n t e r n a l _ r e p l a c e R a t e  is the resource matching rate of the internal replacement resource;  i n t e r n a l _ r e p l a c e S e r i a l  is an integer from 1 to 3 indicating which specific case of internal replacement the current process belongs to;  i s _ e x t e r n a l R e p l a c e  indicates whether the current cloud task process has invoked the external resource replacement strategy;  e x t e r n a l _ P a r t n e r  indicates the specific external server with which to cooperate under the external resource replacement strategy;  e x t e r n a l _ r e p l a c e S e r i a l  is an integer from 1 to 3 indicating which specific case of external replacement the current process belongs to; and  F u n c c a l c u W o r k i n g T i m e  calculates the cloud task time under the current resource replacement strategy.
Figure 2 depicts the comprehensive CMP simulation implemented within the cloud task agent by modifying and adapting existing component codes from Anylogic’s process modeling library. This procedure’s specifics are as follows:
(1)
By means of the enter component, the order is imported into the cloud task’s internal procedure. The order is immediately assigned by the cloud platform if the current task is the first in the task sequence; if not, the preceding task assigns the order after it has been finished (e.g., task 2 orders are assigned by task 1 after task 1 is finished).
(2)
The queue component temporarily stores the current order while the following determinations are made: (a) if the current task is first in the task sequence or there is only one task in the previous task sequence, the hold and hold1 components are opened concurrently, and the current order is entered into queue2 for further processing; or (b) if there are multiple tasks in the previous task sequence, the current order must wait until the orders of all previous tasks have been processed before entering queue2 for further processing.
(3)
The queue1 component combines the information of multiple branch orders, whereas the hold2 component ensures that only a single order is entered for subsequent processing at any given time. Hold2 reopens and proceeds to serve the next order when the current order is fulfilled and exits through exit.
(4)
When the order enters queue3, the task agent selects the optimal service provider and sends “resource request” information to it. When the optimal service provider accepts the request, it chooses to adopt or not adopt the resource replacement strategy according to whether the target resource is faulty. If the resource substitution strategy is adopted, it is necessary to further select which resource substitution strategy to adopt. The busy attribute of the corresponding optimal resource is changed to “true”, the hold3 component opens and the order flows through the delay component to simulate the cloud manufacturing service. After a certain delay time, the service is completed.
(5)
The order is placed in queue4 and the “release resource” message is sent to the best server. When the best server acknowledges the message, the busy attribute of the best resource changes from “true” to “false”, and the hold4 component opens. Order traverses the delay1 component, and the release of the resource is accomplished following a predetermined delay period.
(6)
The order passes through the exit component to conclude all of its service procedures for this task. It then imports the post-order task sequence of this task: (a) if there is only one post-order task, it is imported instantly into the enter component of the post-order task; (b) if there are numerous post-order tasks, the information of the current order is copied and brought into the enter component of the corresponding post-order tasks; and (c) if there is no post-order task, this indicates that the task is already the last task in the task sequence. As a result, the order is included in the group of completed orders, and data such as the service cycle, service cost, and route record are tallied and output.

3.1.3. Modeling of Cloud Server Agent

The primary function of cloud servers is to convey information and interact with cloud tasks. Each cloud server’s resource pool has all kinds of cloud resources. The server locates the appropriate resource in its resource pool and allots it to the cloud task after receiving the “request resource” message. The server releases the associated cloud resource and adds it back to the cloud resource pool after receiving the “release resource” message. The cloud server agent can be illustrated as follows:
S A = I D , l o c a t i o n , r e s o u r c e P o o l , d S c o r e ,   p S c o r e , t o t a l S c o r e , F u n c c o n f i g u r e R e s o u r c e ,   F u n c c o m m o n , F u n c i n t e r _ r e p l a c e , F u n c e x t e r _ r e p l a c e , F u n c i n t e r & e x t e r
where  I D  represents the cloud service provider’s special identification number;  l o c a t i o n  refers to the server’s latitude and longitude coordinates, which is utilized to initialize the server’s location on the GIS map;  r e s o u r c e P o o l  is used for storing the corresponding virtual resources of the cloud server;  d S c o r e p S c o r e , and  t o t a l S c o r e  are the distance score, price score, and total score when the cloud task chooses the best cloud server; and  F u n c c o n f i g u r e R e s o u r c e  is used to manage and distribute resources when receiving cloud task information. If the message is “release resource”, the server will locate the corresponding resource and set its busy attribute to “false”. If the message is “request resource”, the broken attribute of the corresponding resource is examined before any other properties: (1) If the value of the broken property is “false”, this indicates that the resource is not faulty, so its busy attribute continues to be judged, where, (a) if the busy attribute is “false”, cloud order processing can be started, and (b) if the busy attribute is “true”, this means that this resource is being used by other tasks, so it needs to wait until the other tasks have been completed before starting the processing of orders. (2) If the value of the broken property is “true”, this means that the resource is faulty and it cannot complete the processing of the corresponding cloud task. If the resource is faulty, according to the experimental settings, one of the following strategies is chosen: the no-resource replacement strategy, the internal resource replacement strategy, the external resource replacement strategy, or the internal–external integrated strategy.  F u n c c o m m o n  is the no-resource replacement strategy: when the requested resource fails, the requested processing order is added to the failed order set.  F u n c i n t e r _ r e p l a c e  is the internal resource replacement strategy: when the requested resource fails, a replacement resource is found for the failed resource within the current service provider.  F u n c e x t e r _ r e p l a c e  is the external resource replacement strategy: when the requested resource fails, the same type of resource as the failed resource from other cloud service providers is requested.  F u n c i n t e r & e x t e r  is a combination strategy of internal and external resource replacement: when the requested resource fails, the priority is to find a replacement resource within the service provider; if the internal replacement resource fails, then external resources are sought from other service providers.

3.1.4. Modeling of Other Agent

In addition to the above types of agents, the CMS also includes multiple types of agents, such as the cloud platform agent, cloud orders agent, cloud messages agent, and cloud demander agent, which can be expressed as:
P A = t o b e P r o c e s s e d O r d e r L i s t , f i n i s h e d O r d e r L i s t , f a i l e d O r d e r L i s t , a t t a c k N u m , F u n c i n i , F u n c a l l o c a t i o n O r d e r s , F u n c s e t t i n g F a u l t S t a t u s ,   F u n c c a l c u Q o s , F u n c o u t p u t N e t w o r k
O A = I D , o w n e r , t a s k L i s t , r o u t e S t a m p , c o s t 1 A c c u m , c o s t 2 A c c u m ,   c o s t 3 A c c u m , r e l i a b i l i t y A c c u m , s t a r t T i m e , f i n i s h T i m e
M A = m s g , r e s o u r c e L i s t , o w n e r
D A = I D , l o c a t i o n , o r d e r L i s t , F u n c s e n d O r d e r s
The attributes and methodologies of these four agent types are already detailed in [42], so they are not repeated here.

3.2. Multi-Agent Simulation-Based Robustness Evaluation Indicator

Based on the multi-agent model in Section 3.1 and the order–task sequence, the dynamic simulation of the CMP can be realized, and the results data (e.g., the order completion time, logistics transportation distance, and resource occupation) can be output to evaluate the performance of the CMP. Quality of service (QoS) is commonly used in academia to evaluate the CMP, with QoS values mostly being evaluated from multiple dimensions, such as the time, cost, and reliability [43,44,45]. Referring to the definition of QoS, this paper proposes robustness of service (RoS) as a robustness measurement indicator from the perspective of the simulation of four dimensions: service time, service cost, reliability, and order completion rate. The specific calculation formulae for these four dimensions are as follows:
(1)
Service time
The sum of all orders’ completion times during the simulation cycle is represented by the following formula:
T = j = 1 m t j
where  m  denotes the overall number of orders,  j  = 1, 2,…,m denotes the jth order in the order sequence, and  t j  denotes the finish time of the jth order, which can be derived from the results of the simulation.
(2)
Service cost
The cloud resource service fee, logistics service fee, and cloud resource release fee, which together make up the overall cloud service cost, are determined as follows:
C = j = 1 m i = 1 n j t i , j serving     p i , j resource   + j = 1 m i = 1 n j d i , j c logistic   + j = 1 m i = 1 n j t i , j releasing   p release   ra  
where  m  represents the total amount of orders and  n j  represents the number of assignments associated with each order;  j  = 1, 2,…, m is the jth order in the order sequence;  i  = 1, 2,…, n is the ith the task in the task sequence;  t i , j s e r v i n g  represents the cloud service time of the ith task in the jth order;  p i , j r e s o u r c e  represents the service cost per unit time of the resource related to the task;  d i , j  represents the logistics distance related to the task;  c l o g i s t i c  represents the logistics cost per unit distance;  t i , j r e l e a s i n g  represents the release time of the cloud resources for the task; and  p r e l e a s e  represents the cost per unit time of releasing resources.
(3)
Service reliability
The service reliability is measured by a multiplicative index [44], which has the following form:
r e l = j = 1 m i = 1 n j r e l i , j m
where  r e l i , j  represents the service reliability of the ith task in the jth order, as specified in the order agent’s  r e l i a b i l i t y A c c u m  property.
The evaluation of the CMP’s robustness in this paper also refers to the definition of robustness, which refers to the ability of the CMS to operate normally and maintain its original performance in the face of various unexpected disruptions and interruptions. For the CMS, the normal completion of cloud orders within a service cycle can reflect its normal operation capability more intuitively. Therefore, the order completion rate index is introduced:
(4)
Order completion rate
The order completion rate is the proportion of total scheduled orders to orders actually completed throughout the simulation cycle.
o f r = N 1 N 1 + N 2
where  N 1  represents the number of orders fulfilled throughout the simulation cycle and  N 2  represents the number of incomplete orders.
In summary, combining the definitions of robustness and QoS, this paper proposes a new robustness evaluation index, RoS, to comprehensively consider the normal operational capability of the CMS in the face of unexpected disturbances.
The RoS index takes the order completion rate as the main body, where the higher the order completion rate, the stronger the normal operational ability in the face of interference, and the stronger the ability to resist risks (i.e., the stronger the robustness of the cloud service), and vice versa. When the order completion rates are the same, the index then compares the differences in the time and cost of completing the same order quantity: if the same number of orders are completed with less time, lower cost, and higher reliability, the cloud service is more robust, and vice versa. Therefore, it can be expressed as:
R o S = o f r [ 1 ( ω 1 | T T 0 | T 0 + ω 2 | C C 0 | C 0 + ω 3 | r e l r e l 0 | r e l 0 ) ]
where  T 0 C 0 ,  and  r e l 0  are the respective baseline values of the service time, cost, and reliability under the condition of no interference;  T C ,  and  r e l  are the actual values of the current experimental group; and  ω 1 ω 2 ,  and  ω 3  are the respective weight coefficients of the three indexes, satisfying  i = 1 3 ω i = 1 .

4. Model of the Cloud Manufacturing Network and Robustness Evaluation Indicator Based on Complex Network

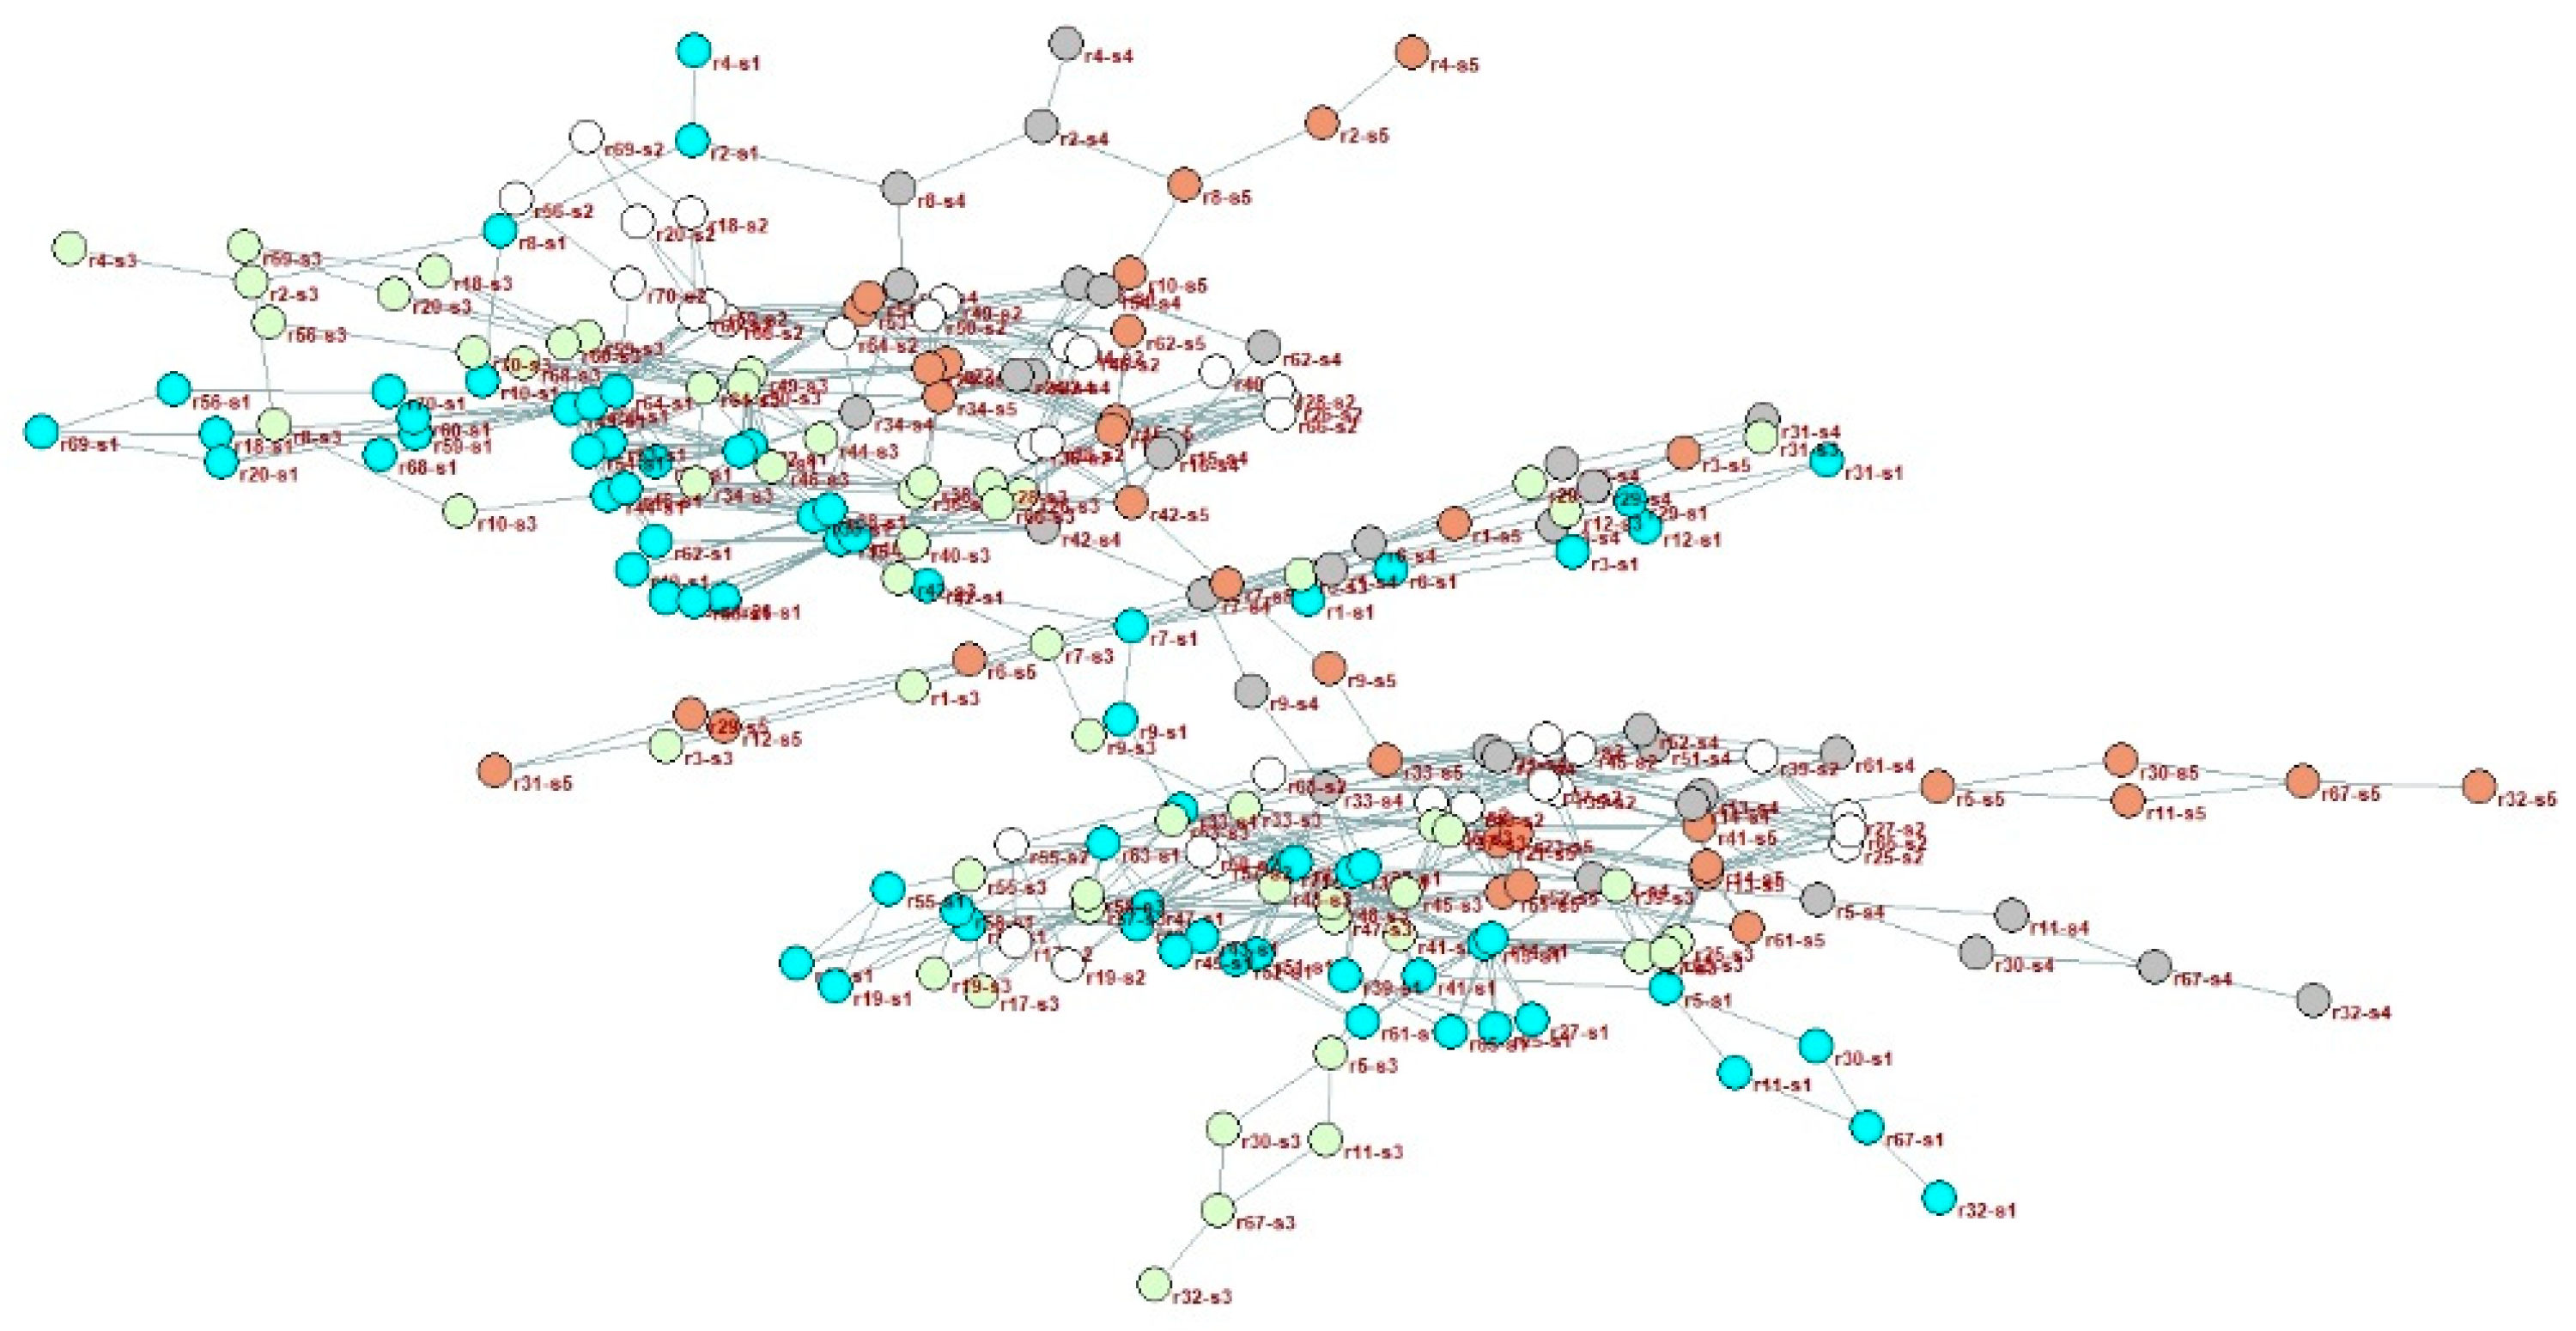
4.1. Development of a Complex Network Model for Cloud Manufacturing

The CMN consists of cloud service resources and their interconnections. The network can be evaluated utilizing the complex network model due to the vast number of resources and intricate connection relationships. Figure 3a depicts the processing task paths for Order-A, Order-B, and Order-C, the resources utilized by each task along these paths, and the relationships between the resources and servers. If two tasks are linked by a path, their corresponding resources are also linked. Figure 3b illustrates how the CMN is formed by considering all resources to be network nodes and resource connections to be connected edges.

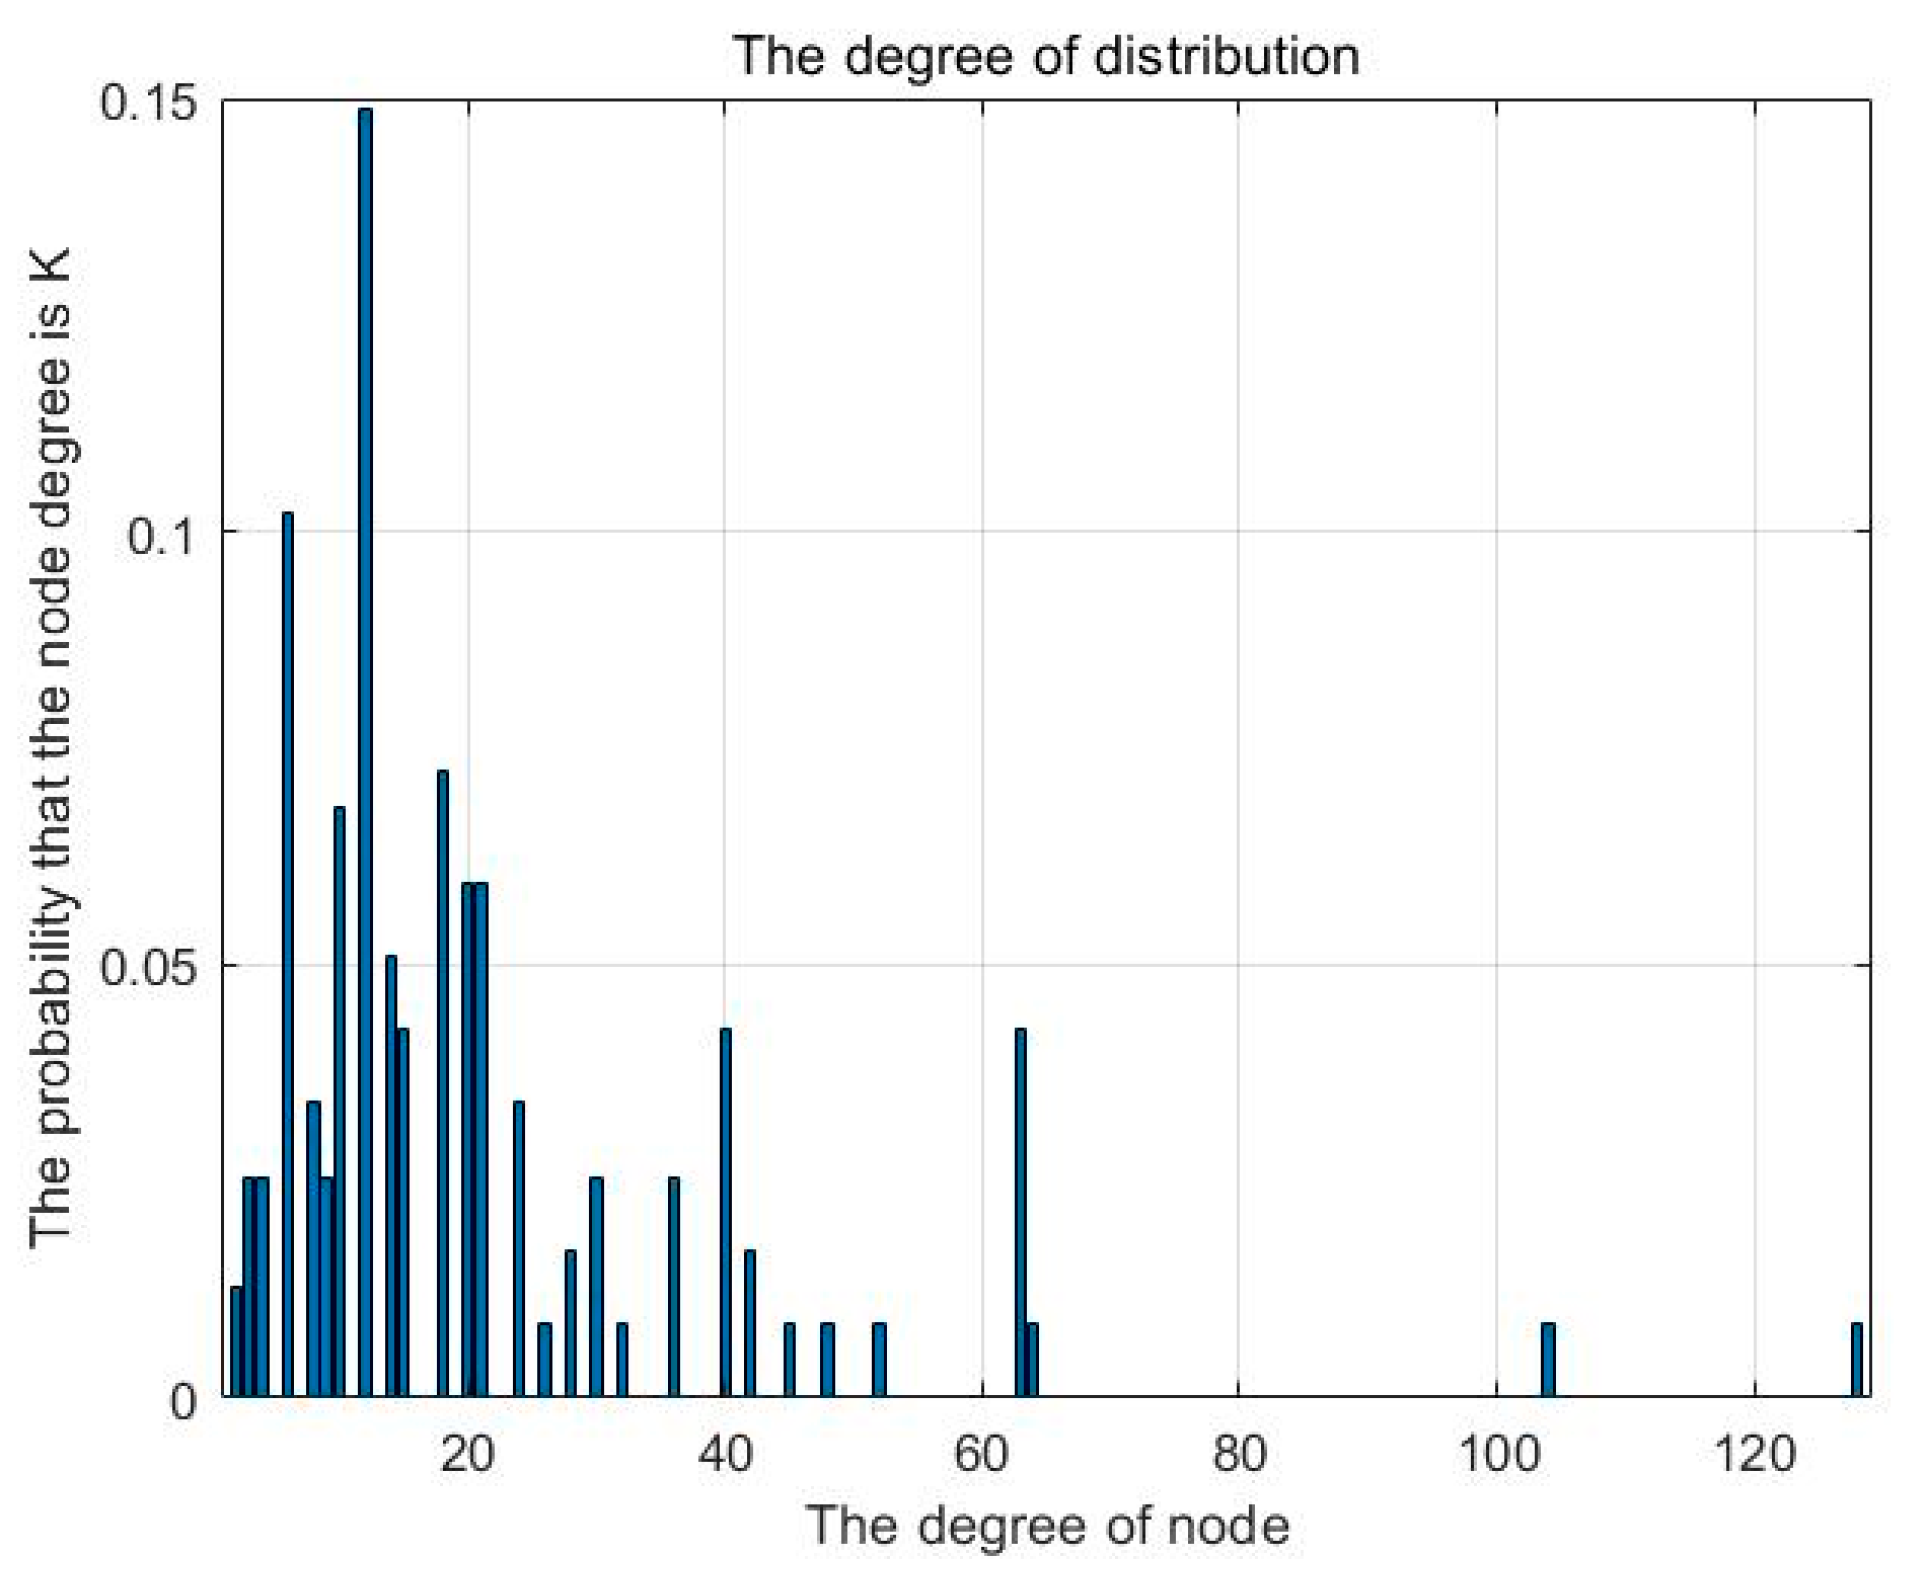
4.2. Evaluation Indicator for Network Robustness Based on Static Topology

The term “network robustness” is generally used to describe the degree of network performance retention following the failure of network nodes or edges [44], and the change in the maximum connected subgraph following node failure can reflect the degree of structural integrity retention in the network. As a result, the rate of change in the maximal connected subgraph’s node count was chosen as one of the robustness evaluation indicators for this study.
S = N N
where N’ represents the number of nodes in the maximally connected subgraph after the network has been attacked, and N represents the number of nodes in the original network. Specifically, S = 0 indicates that the network is disconnected, whereas S = 1 indicates that the network is completely connected and there are no isolated nodes.

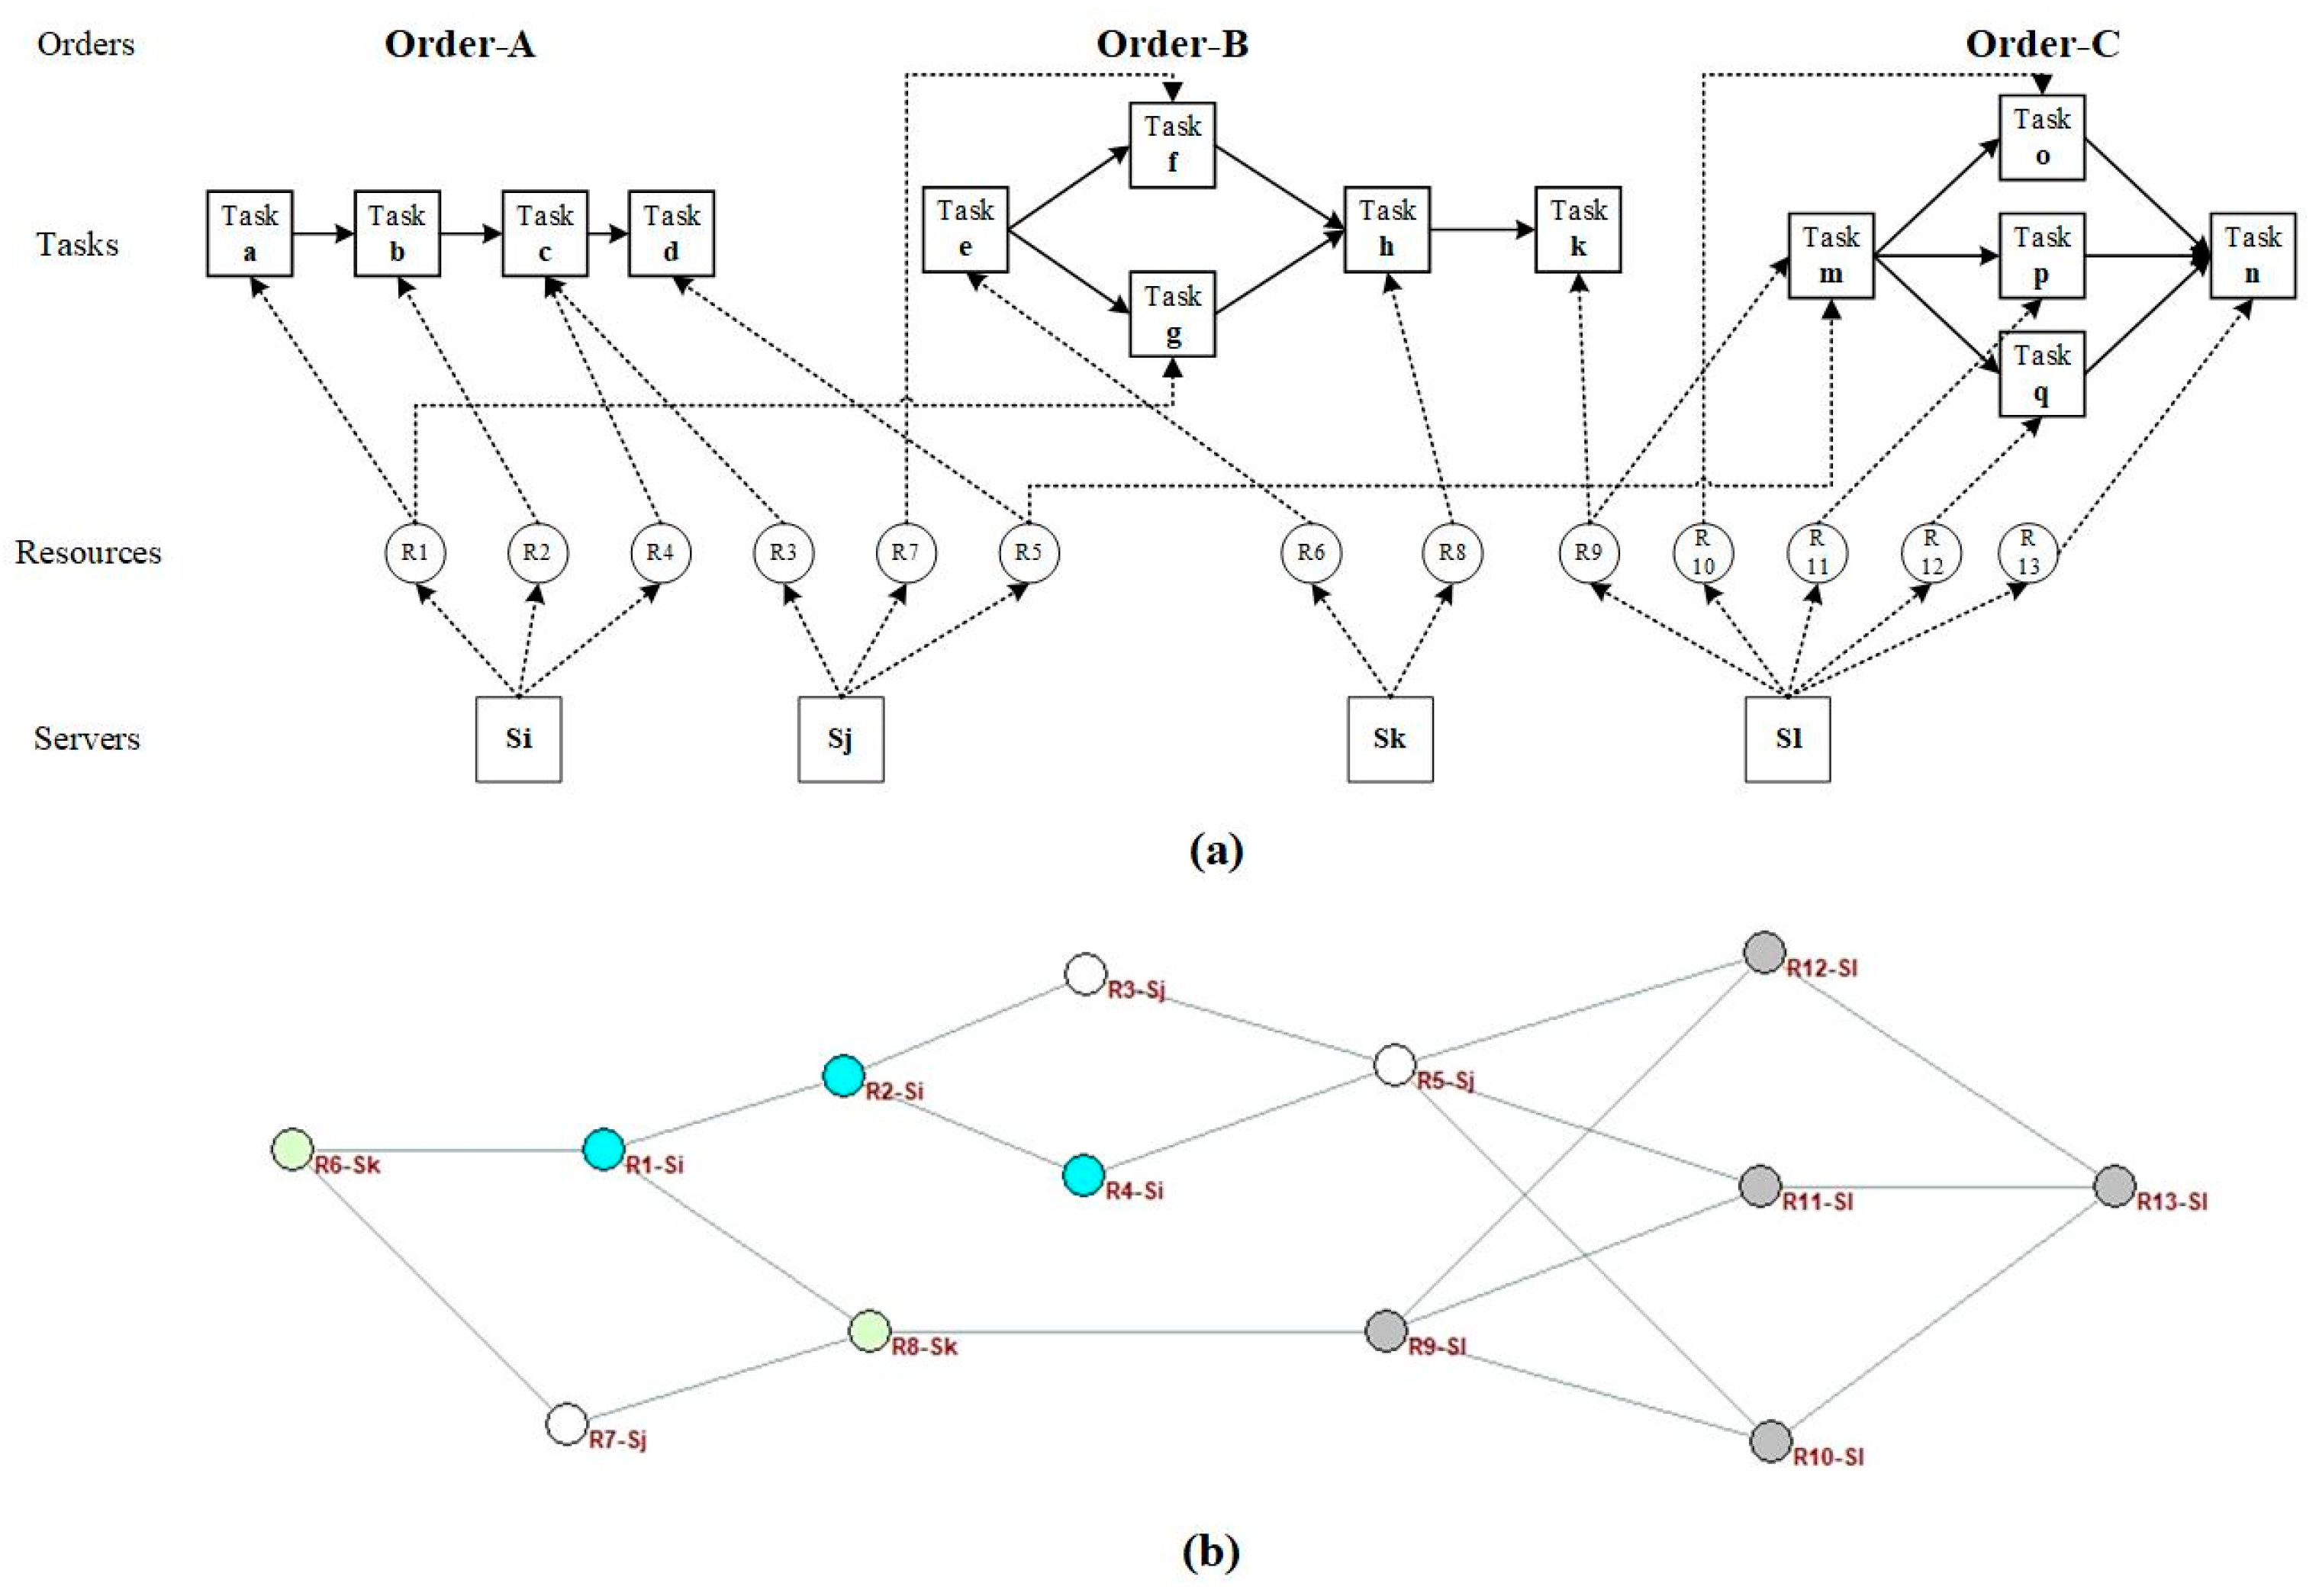
5. Robust Failure Mode Definition and Formulation of Multiple Resource Replacement Strategies

5.1. Definition of Failure Modes for Robustness Analysis

The definition of failure modes is the key to robustness analysis. Based on a combination of the cloud manufacturing characteristics and the spatial topology structure of the CMN, this paper proposes two types of failure modes: cloud resource failure based on the initial topology, and cloud resource failure based on the recomputed topology.
The initial topology refers to the initial structural characteristics of the CMN, which is a static network. The recalculated topology refers to the structural characteristics of the CMN that are obtained through recalculation after the initial network is attacked, which is a dynamic network that changes step by step with the attack steps.
Both failure modes are subdivided into degree-based and betweenness-based resource failures. The degree is widely used to measure the importance of the nodes: it represents how closely a resource node is connected to other resource nodes in the CMN. The betweenness reflects the structural importance of the nodes in the network [46,47]: a node with high betweenness has greater control over the logistics and information flow in the network. The specific failure mode definitions are shown in Table 1.

5.2. Formulation of Multiple Resource Substitution Strategies
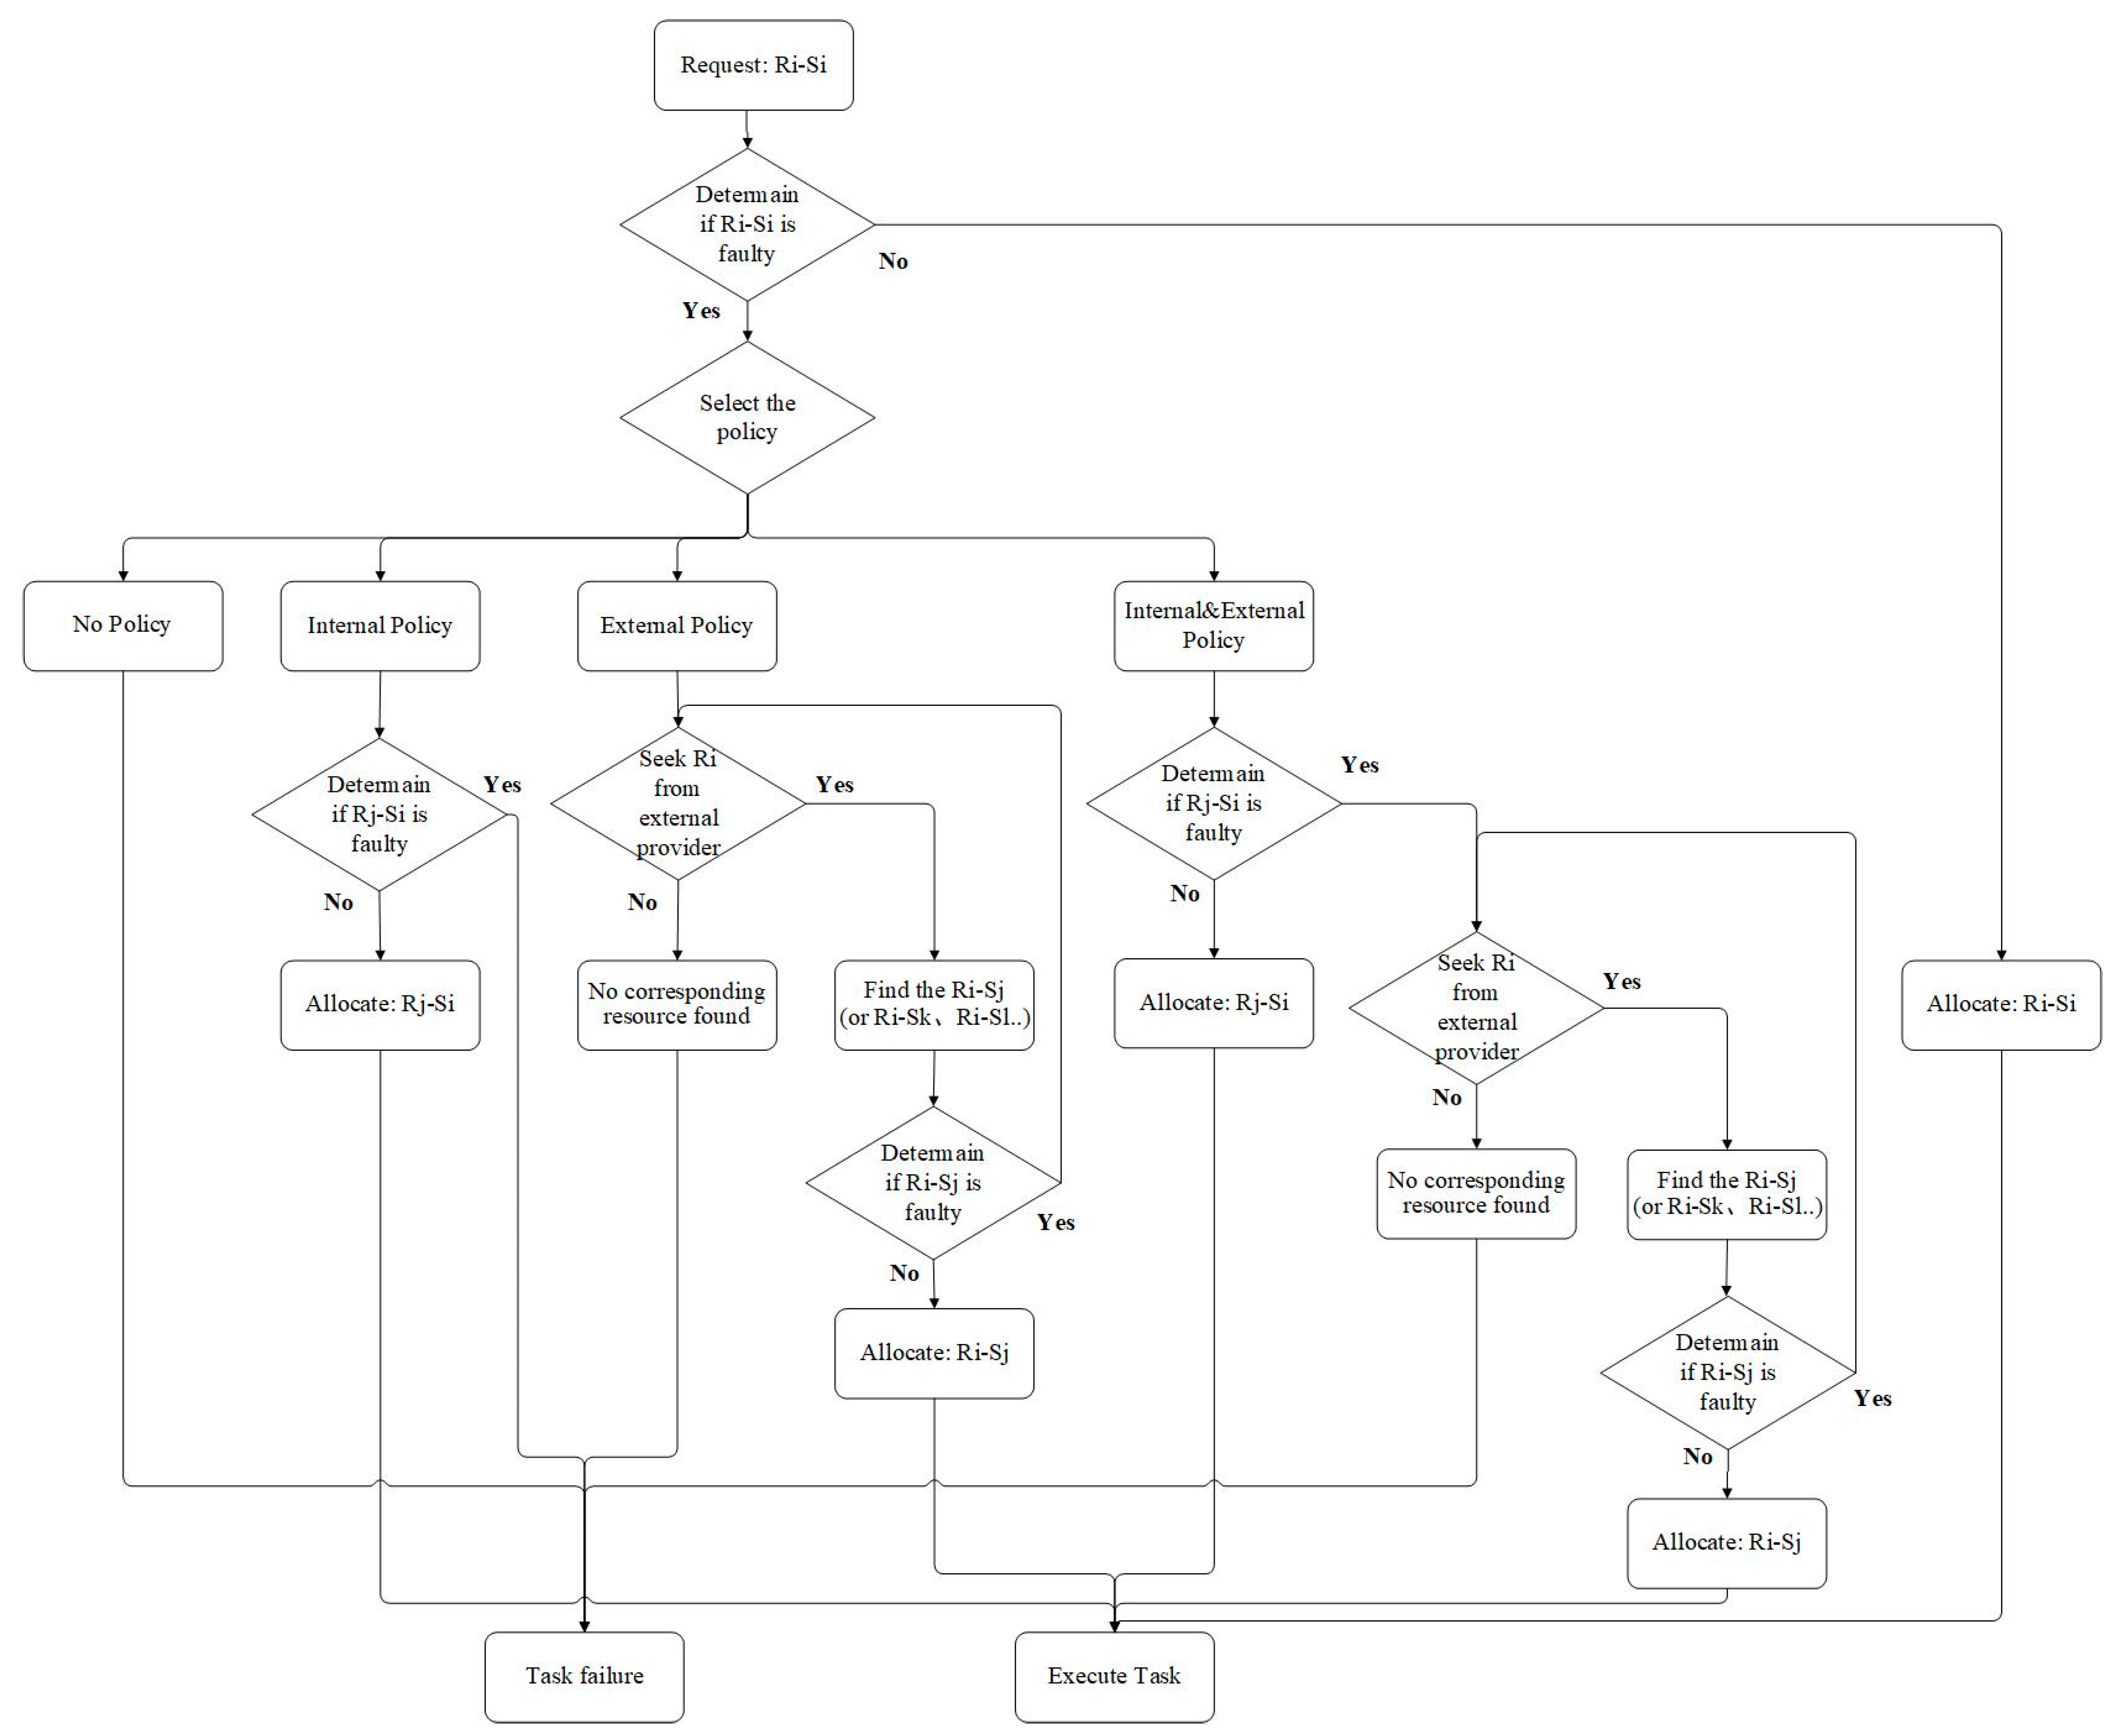
Targeting the cloud resource node failure problem proposed in Section 5.1, this paper aims to develop a robustness enhancement strategy for CMNs that involves adding redundant nodes.
For the supply chain modeling and robustness problem, Zhao [48] took the smartphone supply chain as an example and put forward three different robustness optimization strategies: enterprise internal operation management, cooperative management between enterprises, and a regional development strategy. Inspired by this, and combined with the characteristics of cloud manufacturing, this paper proposes three kinds of robustness improvement strategies: internal resource replacement, external resource replacement, and internal–external integration replacement.
(1)
Internal replacement strategy: The cloud service provider Si will internally provide replacement resources Rj for Ri (noted as Ri-Si and Rj-Si, respectively). If Ri-Si fails, Rj-Si will replace it to complete the processing of cloud manufacturing tasks. Although the tasks will be completed, the cloud task time will be increased due to the different resource types, and additional working hours will be incurred.
(2)
External replacement strategy: The cloud service provider Sj, Sk…etc. will provide the same type of resources Ri as Ri-Si (recorded as Ri-Sj, Ri-Sk…etc.). When the resource Ri fails, the strategy will comprehensively select the best cloud service provider based on multiple factors, such as resource quotation and the distance between service providers. It will then request alternative resources from them to replace the failed Ri-Si to complete the cloud manufacturing task. Since the resource types are the same, this does not add additional task time; however, the transfer of resources and information among different service providers will generate additional logistics transportation costs and time.
(3)
Internal–external integration replacement strategy: This strategy is the combination of the previous two strategies. When a cloud resource fails, this strategy first looks for a replacement resource within the service provider; if no replacement resource is found or its replacement resource also fails, it continues to seek the same type of resource from other service providers. The logical flow of these three strategies is shown in Figure 4.
In addition, in the complex network model, node failure is reflected by removing the failed resource node and all the edges connected to the node. After selecting the corresponding resource replacement strategy, the optimal alternative resource node under the current strategy is first determined. If this replacement node is already in the original network, all connected edges belonging to the failed node will be directly linked to the replacement node; if it is not already in the original network, the replacement node should first be added to the network, then be linked similarly.

6. Case Study

6.1. Model Parameters Description

The cloud manufacturing project for a new energy vehicle is used as a case study. This project offers life-cycle cloud manufacturing services for new energy vehicles, with the technologies provided including electrification and autonomous driving.
The cloud manufacturing project consists of 24 order types, 95 cloud tasks (t1–t95), and 72 resource types (r1–r72). Table 2 displays the appropriate resource types for each cloud task, and Table 3 displays the routes for each order type’s associated cloud task. This paper assumes a bidirectional substitution relationship between resources (e.g., if the substitute resource of  r i  is  r j , the substitute resource of  r j  is  r i ). Based on this, the substitution relationships among internal resources are shown in Table 4.
Each of the project’s five cloud servers (S1-S5) offers 72 different kinds of cloud resources. The cloud servers compete for different orders because they charge different prices for their resources and are located at various distances from cloud demanders. Resource r1 of servers S1–S5 are identified by the labels r1–S1, r1–S2, r1–S3, r1–S4, and r1–S5, respectively.
Moreover, there are 14 cloud demanders (d1–d14). Each cloud demander submits 24 orders, with 1 of each order type submitted (i.e., 1 of each of the 24 order types). As indicated in Table 5, the fundamental details of each cloud service provider and cloud demander are externally imported from Excel.
The weight coefficients for the RoS were set in this study to be  ω 1  = 1/3,  ω 2  = 1/3, and  ω 3  = 1/3.

6.2. Structural Robustness Analysis

Based on the network model construction method described in Section 4.1, Figure 5 depicts the initial cloud manufacturing resource network. Matlab-2020a software was implemented to conduct data statistical analysis on the network, and as shown in Table 6 and Figure 6, the relevant network topology parameters and degree distribution were obtained.
The network contained 231 resource nodes, and the distribution of node degrees was very unbalanced. A small number of nodes occupied the vast majority of connected edges, proving that the network possessed the traits of a scale-free network. It was a sparse network, as the nodes with higher degree values tended to connect the nodes with lower degree values, as indicated by the network’s low density.
Then, using the four failure modes outlined in Section 5.1, Python 3.0 was used to simulate and determine how the structural robustness indexes changed in response to each failure mode.

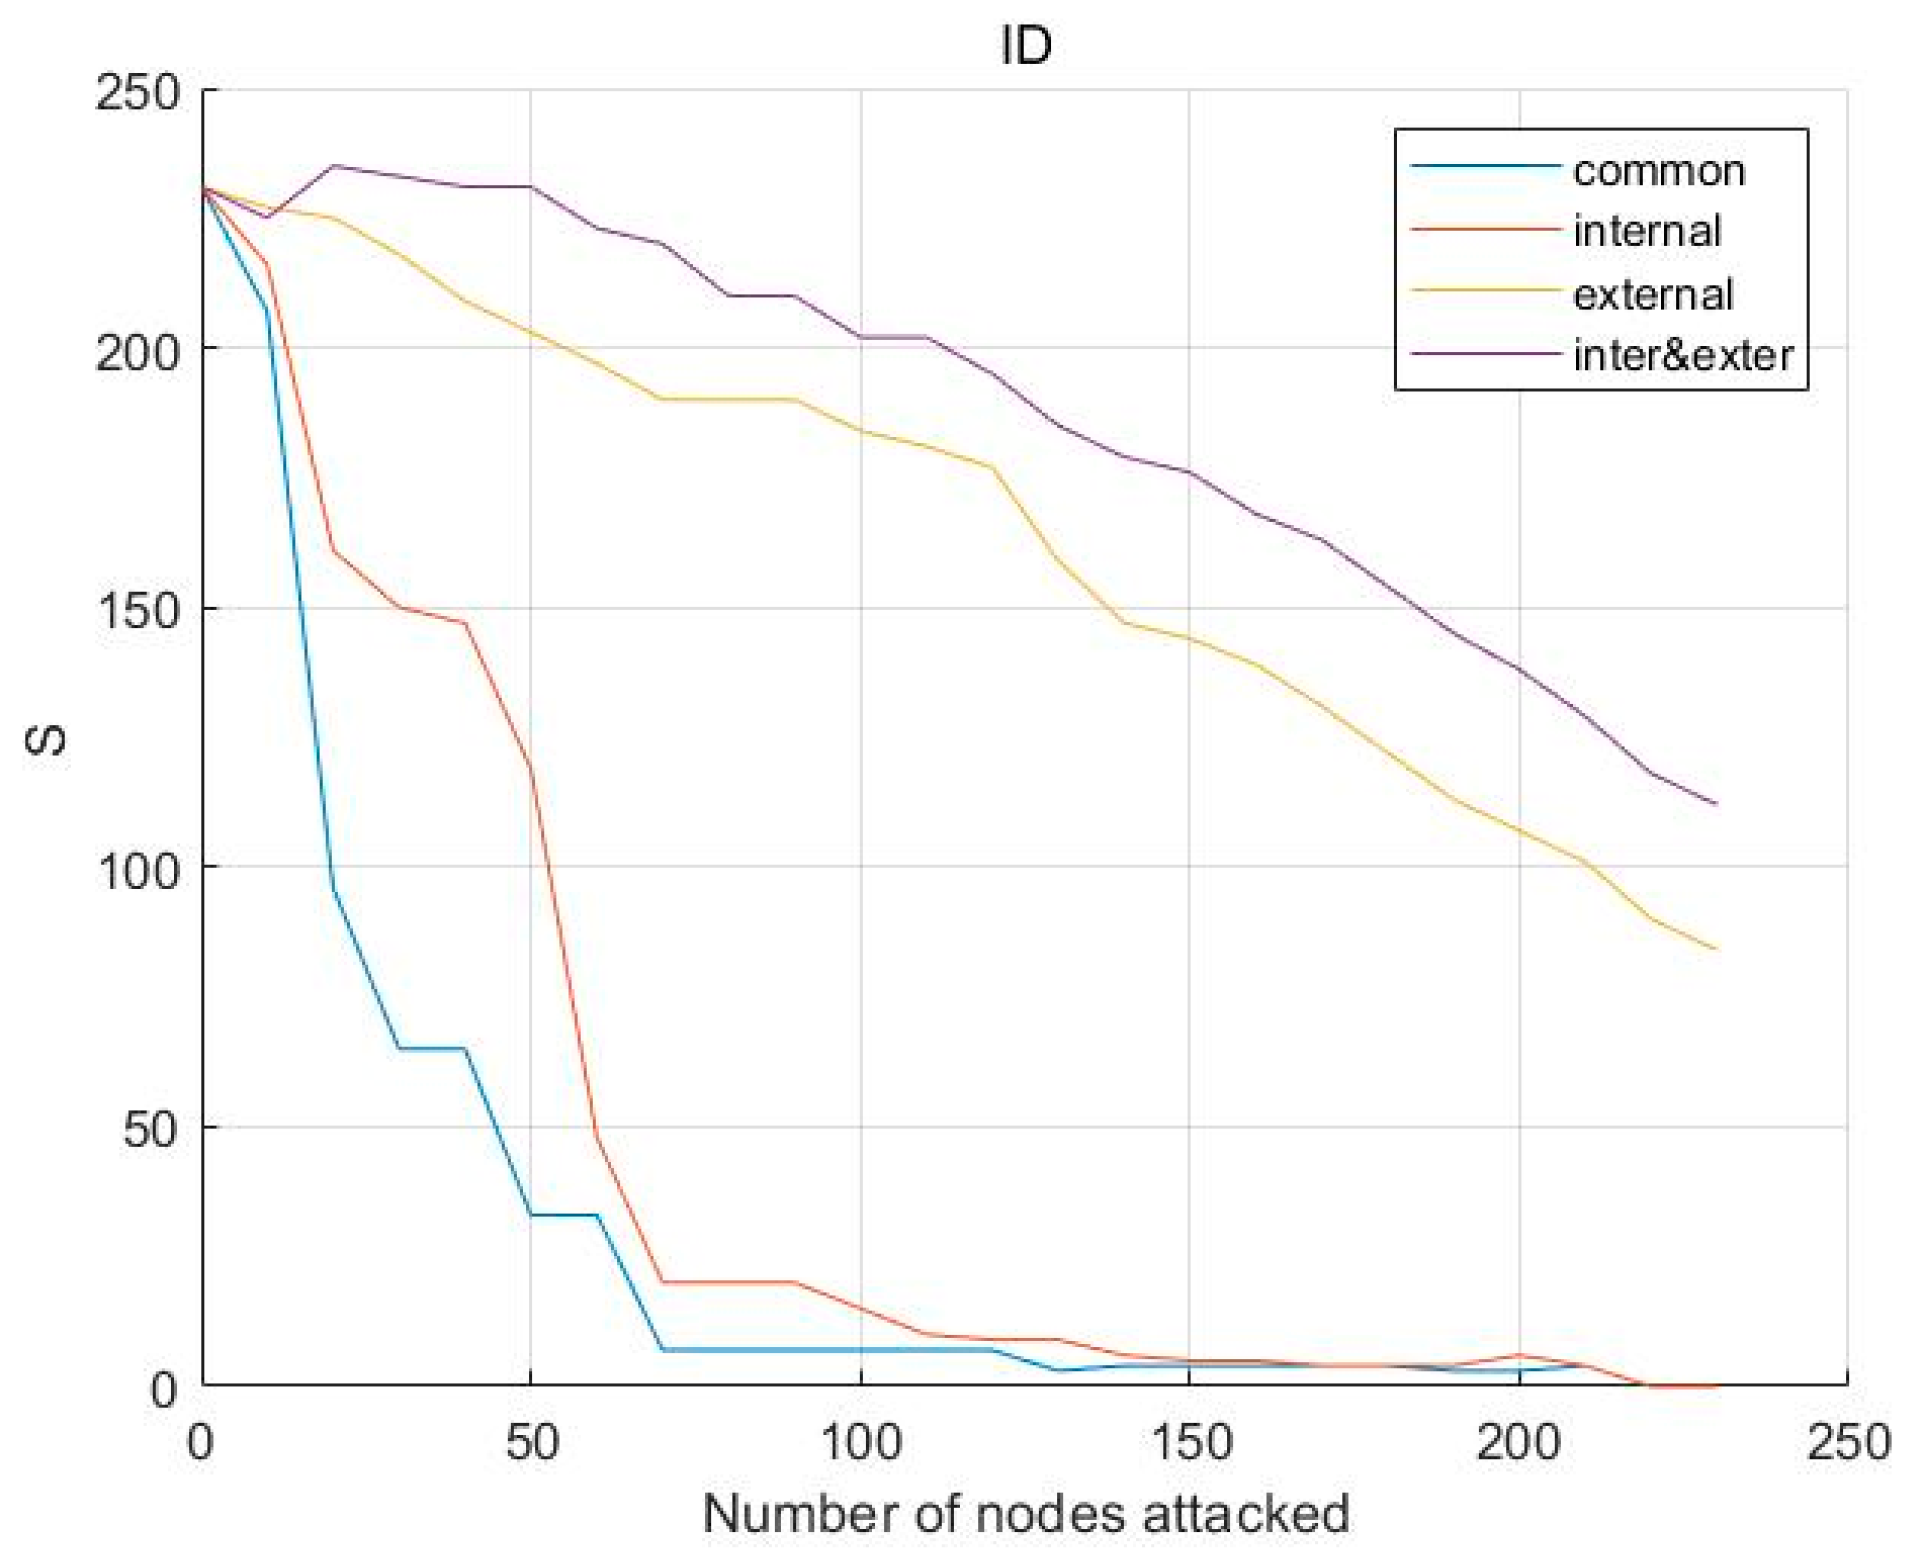
6.2.1. Structural Robustness Comparison of Three Substitution Strategies under Initial Node Degree Loss (ID) Failure Mode

As shown in Figure 7, (1) in the ID failure mode, the maximum connectivity subgraphs under the no-substitution strategy (“common”) and the three resource substitution strategies (“internal”, “external”, and “inter&exter”) all show a decreasing trend as the number of node failures increases. This indicates that from the complex network perspective, the structural robustness of the CMS gradually decreases. (2) The curves of the three resource substitution strategies are all located above the curve of the no-substitution strategy (i.e., their maximum connectivity subgraph values are larger than the no-substitution strategy’s value). This indicates that all three resource substitution strategies can improve the structural robustness of the CMS in the face of initial node degree failure. (3) The “internal” curve is only slightly higher than the “common” curve, and when the number of node attacks is high, the maximum connected subgraph values of these two strategies decrease to 0, at which point the CMN has completely collapsed. In contrast, the “external” and “inter&exter” curves are significantly higher than the “common” curve, and even when the number of node attacks is high, the connected subgraph values still maintain a high level. This indicates that the external replacement strategy and the internal–external integrated replacement strategy both offer more significant robustness enhancement than the internal replacement strategy under the ID failure mode.

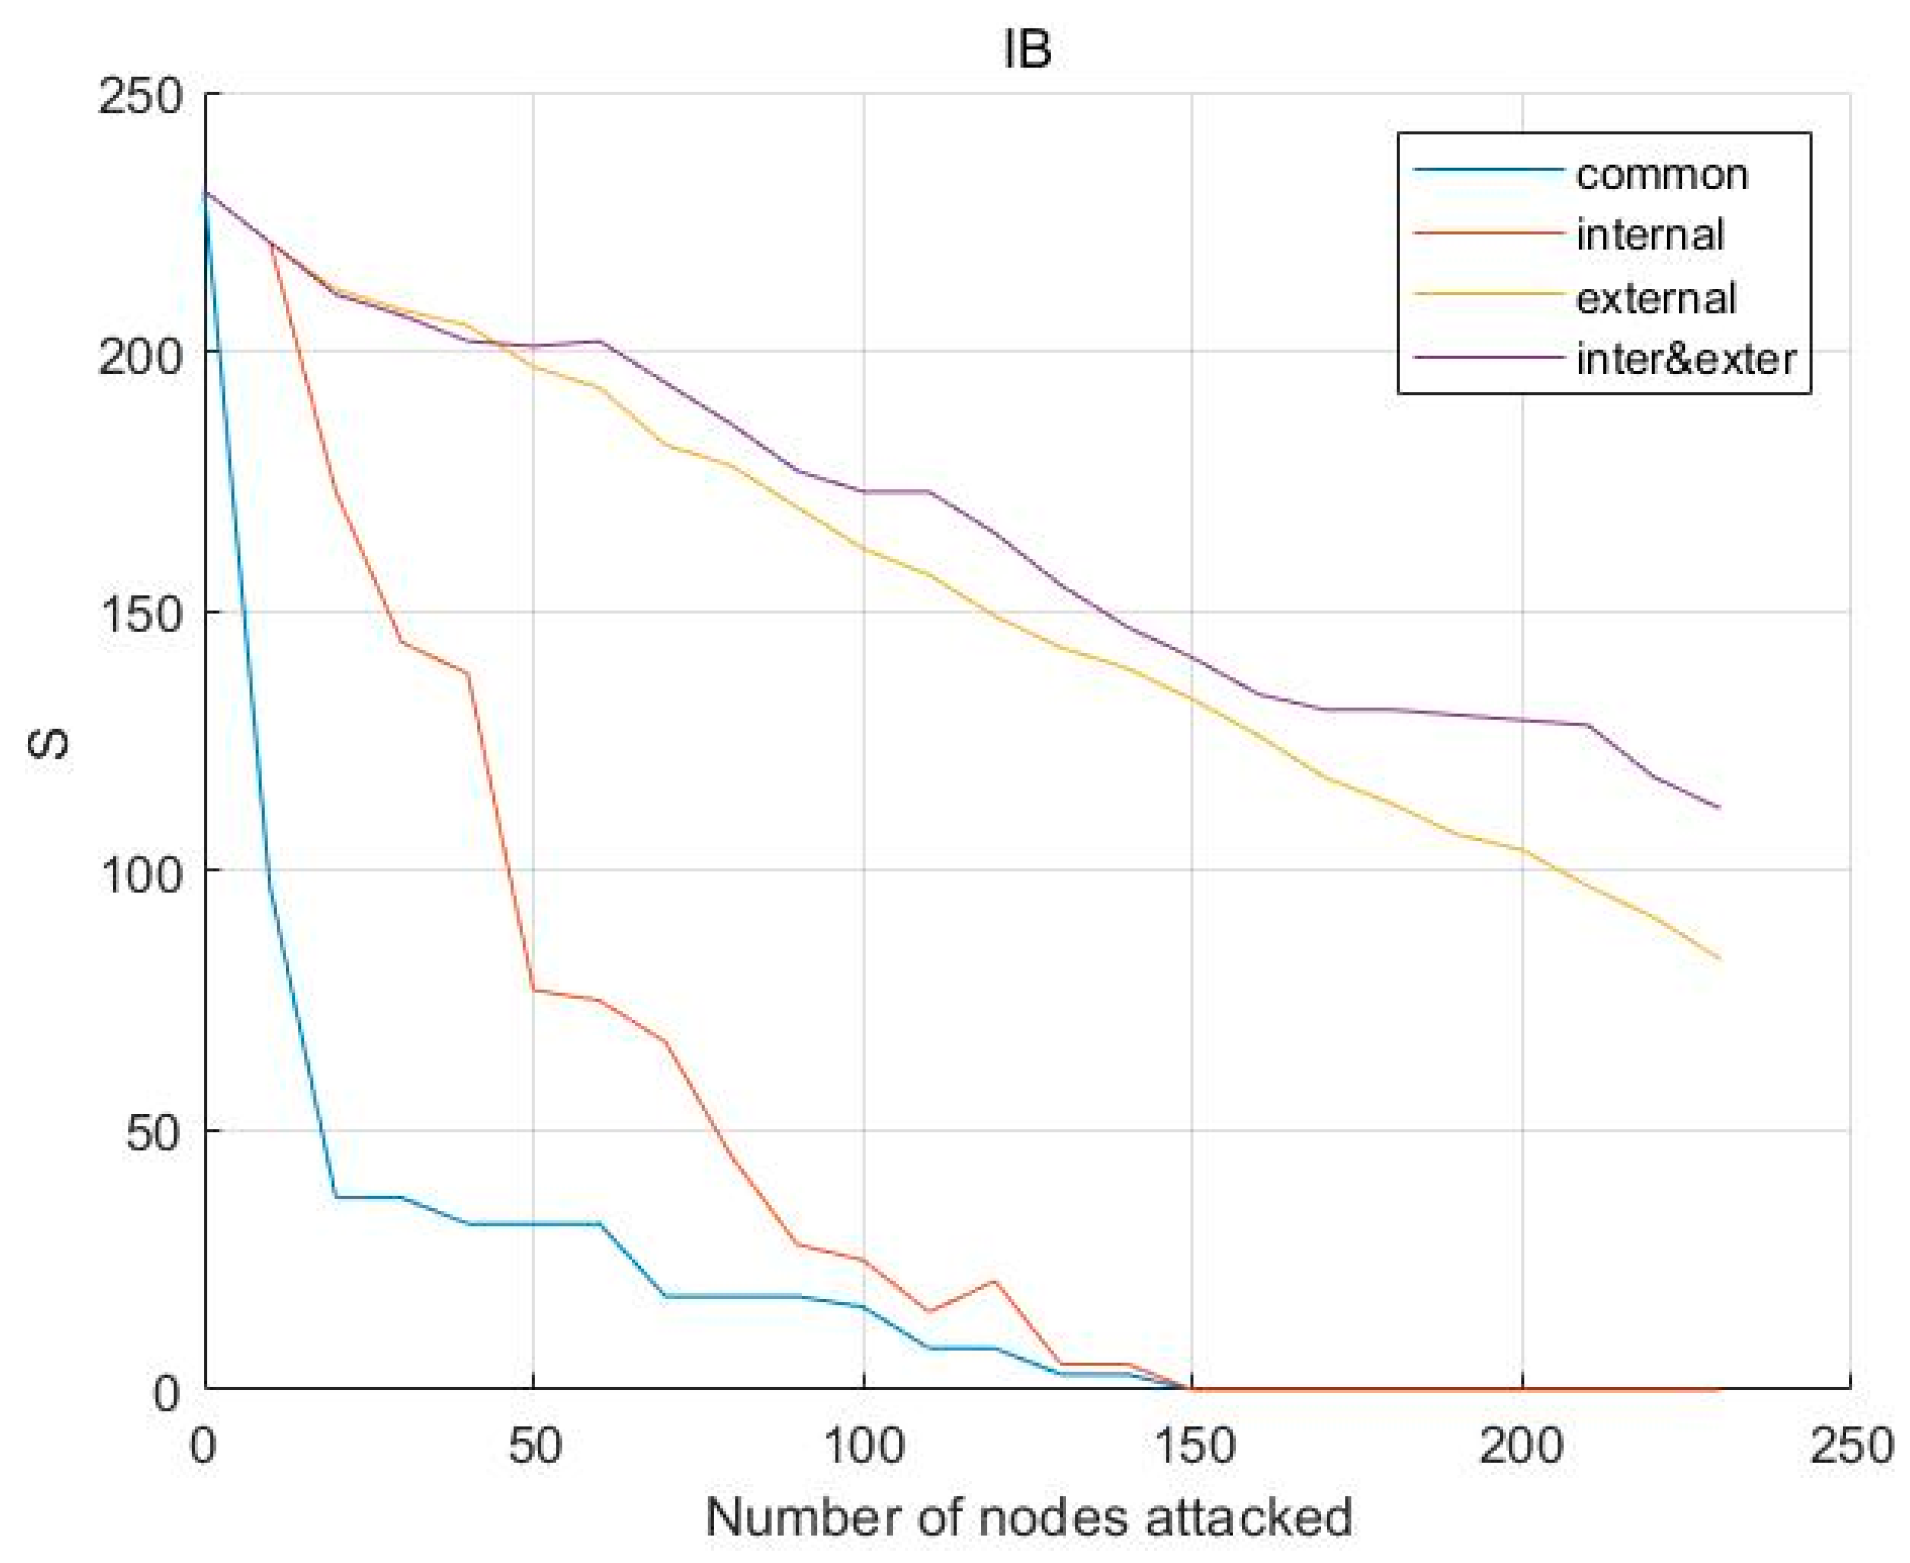
6.2.2. Structural Robustness Comparison of Three Substitution Strategies under Initial Node Betweenness Loss (IB) Failure Mode

As shown in Figure 8, (1) in the IB failure mode, the maximum connectivity subgraphs under the no-substitution strategy (“common”) and the three resource substitution strategies (“internal”, “external”, and “inter&exter”) all show a decreasing trend as the number of node failures increases. This indicates that from the complex network perspective, the structural robustness of the CMS gradually decreases. (2) The curves of the three resource substitution strategies are all located above the curve of the no-substitution strategy (i.e., their maximum connectivity subgraph values are larger than the no-substitution strategy’s value). This indicates that all three resource substitution strategies can improve the structural robustness of the CMS in the face of initial node betweenness failure. (3) The “internal” curve is only slightly higher than the “common” curve, and when the number of node attacks is high, the maximum connected subgraph values of these two strategies decrease to 0, at which point the CMN has completely collapsed. In contrast, the “external” and “inter&exter” curves are significantly higher than the “common” curve, and even when the number of node attacks is high, the connected subgraph values still maintain a high level. This indicates that the external replacement strategy and the internal–external integrated replacement strategy both offer more significant robustness enhancement than the internal replacement strategy under the IB failure mode.

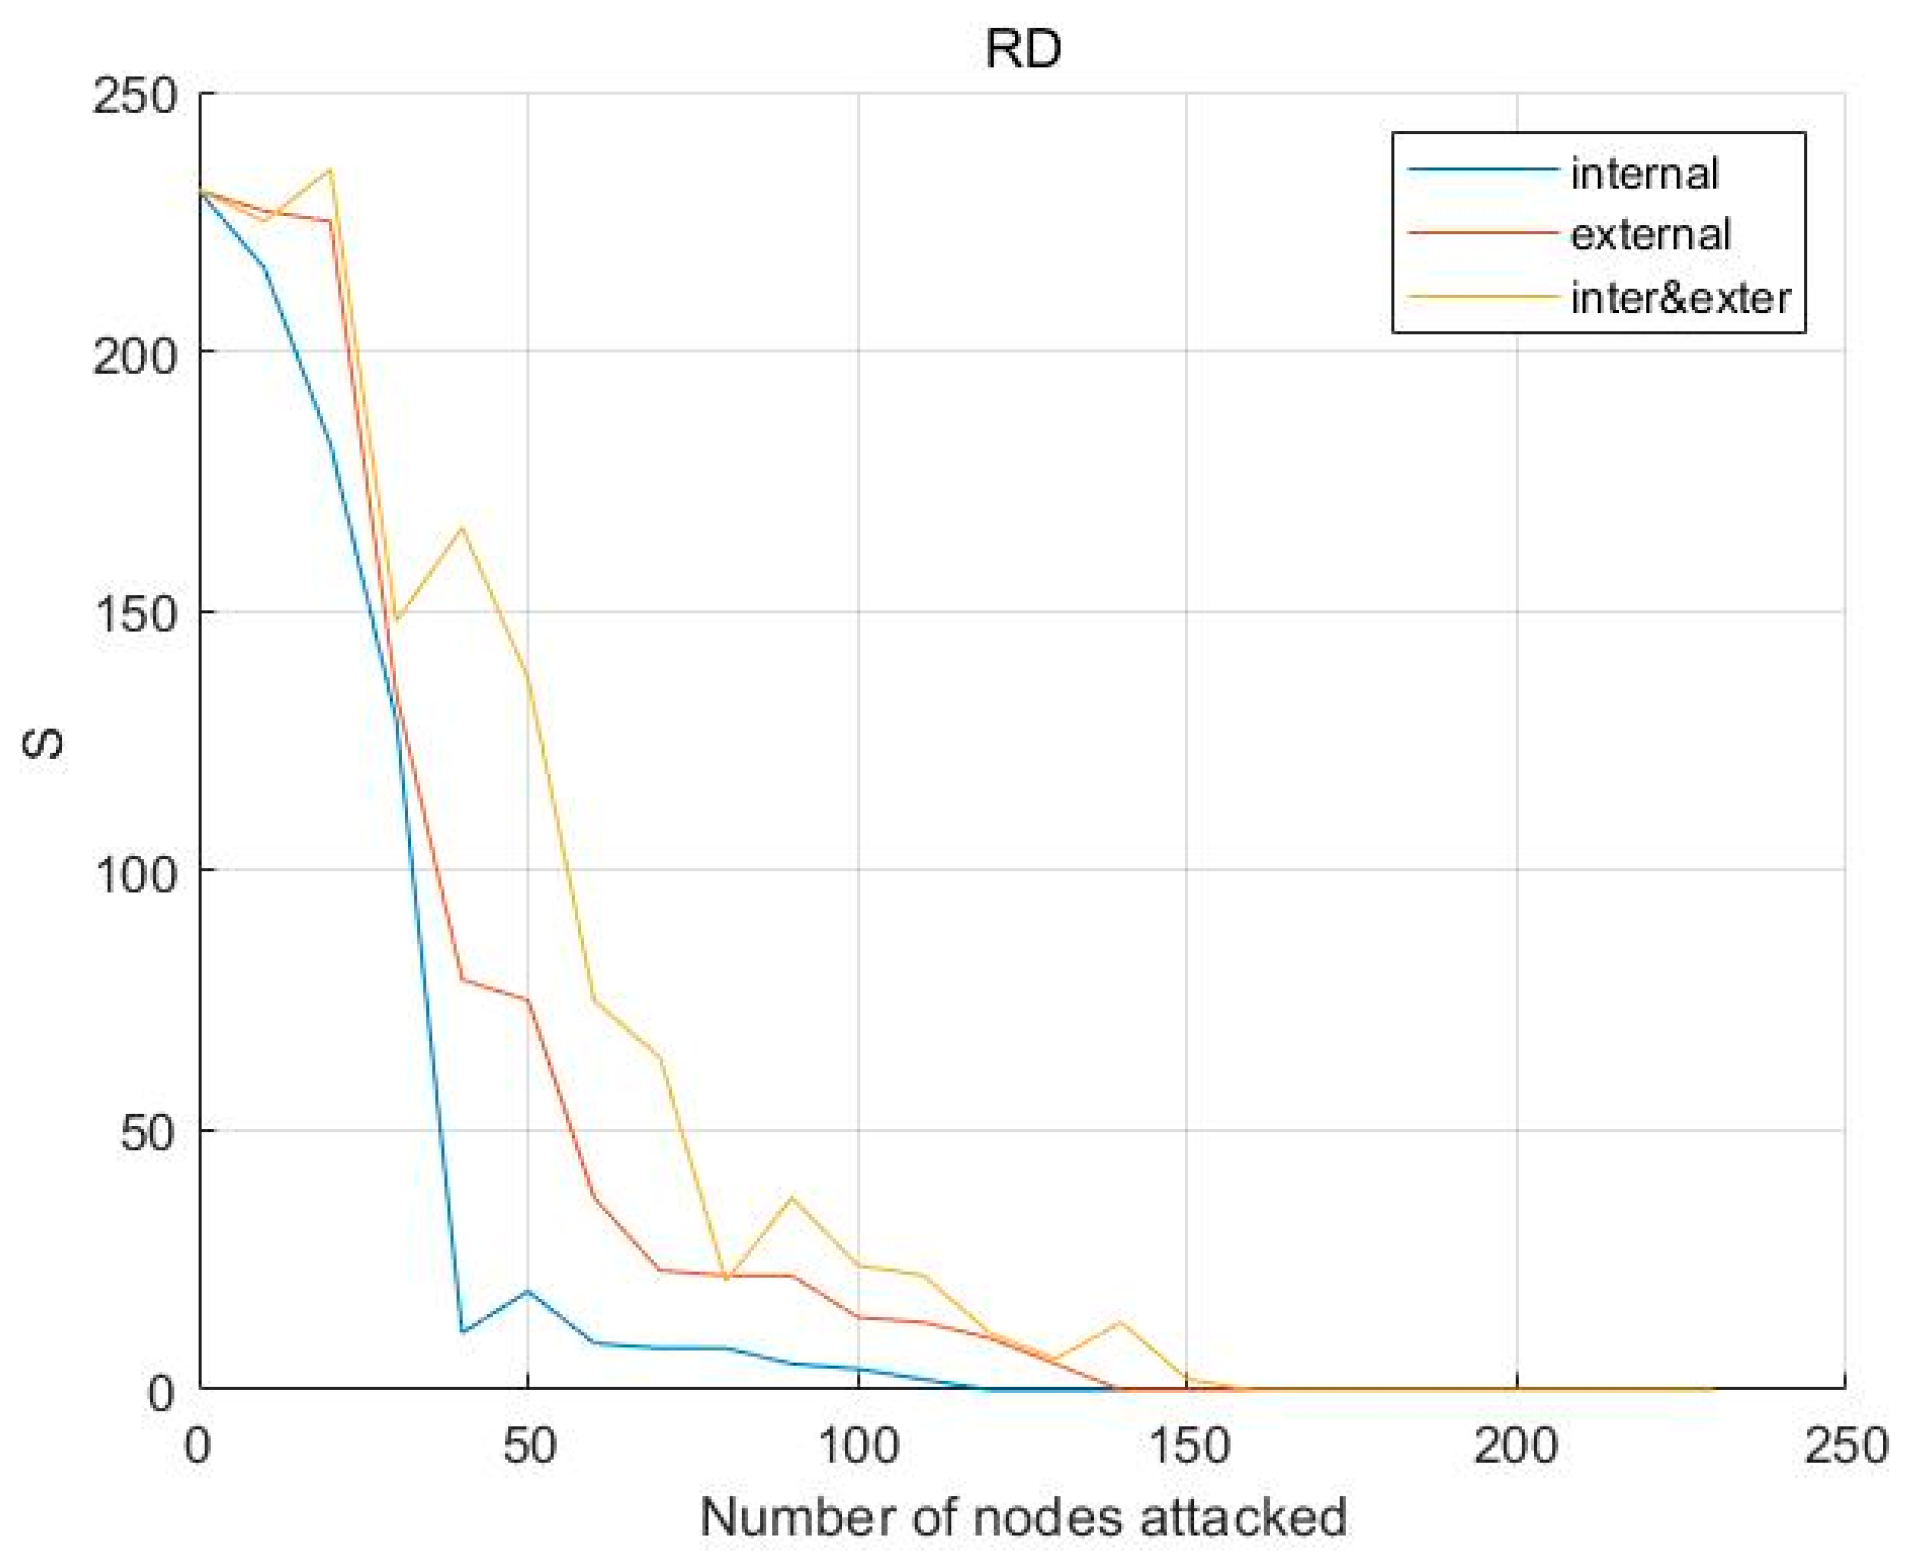
6.2.3. Structural Robustness Comparison of Three Substitution Strategies under Recomputed Node Degree Loss (RD) Failure Mode

As shown in Figure 9, (1) in the RD failure mode, when the number of node attacks is high, the maximum connectivity subgraph values under all three substitution strategies decrease to 0, at which point the CMN has completely collapsed. This indicates that the RD failure mode is more destructive to the structural robustness of the CMS than either the ID or IB modes. (2) The “external” curve is always located above the “internal” curve, and the “inter&exter” curve is nearly always located above the “external” curve. This indicates that the maximum connectivity subgraph value is largest under the internal–external integration replacement strategy, followed by the external replacement strategy, and then the internal replacement strategy. Therefore, for the structural robustness of the CMS under the RD failure mode: internal–external integration replacement strategy > external replacement strategy > internal replacement strategy.

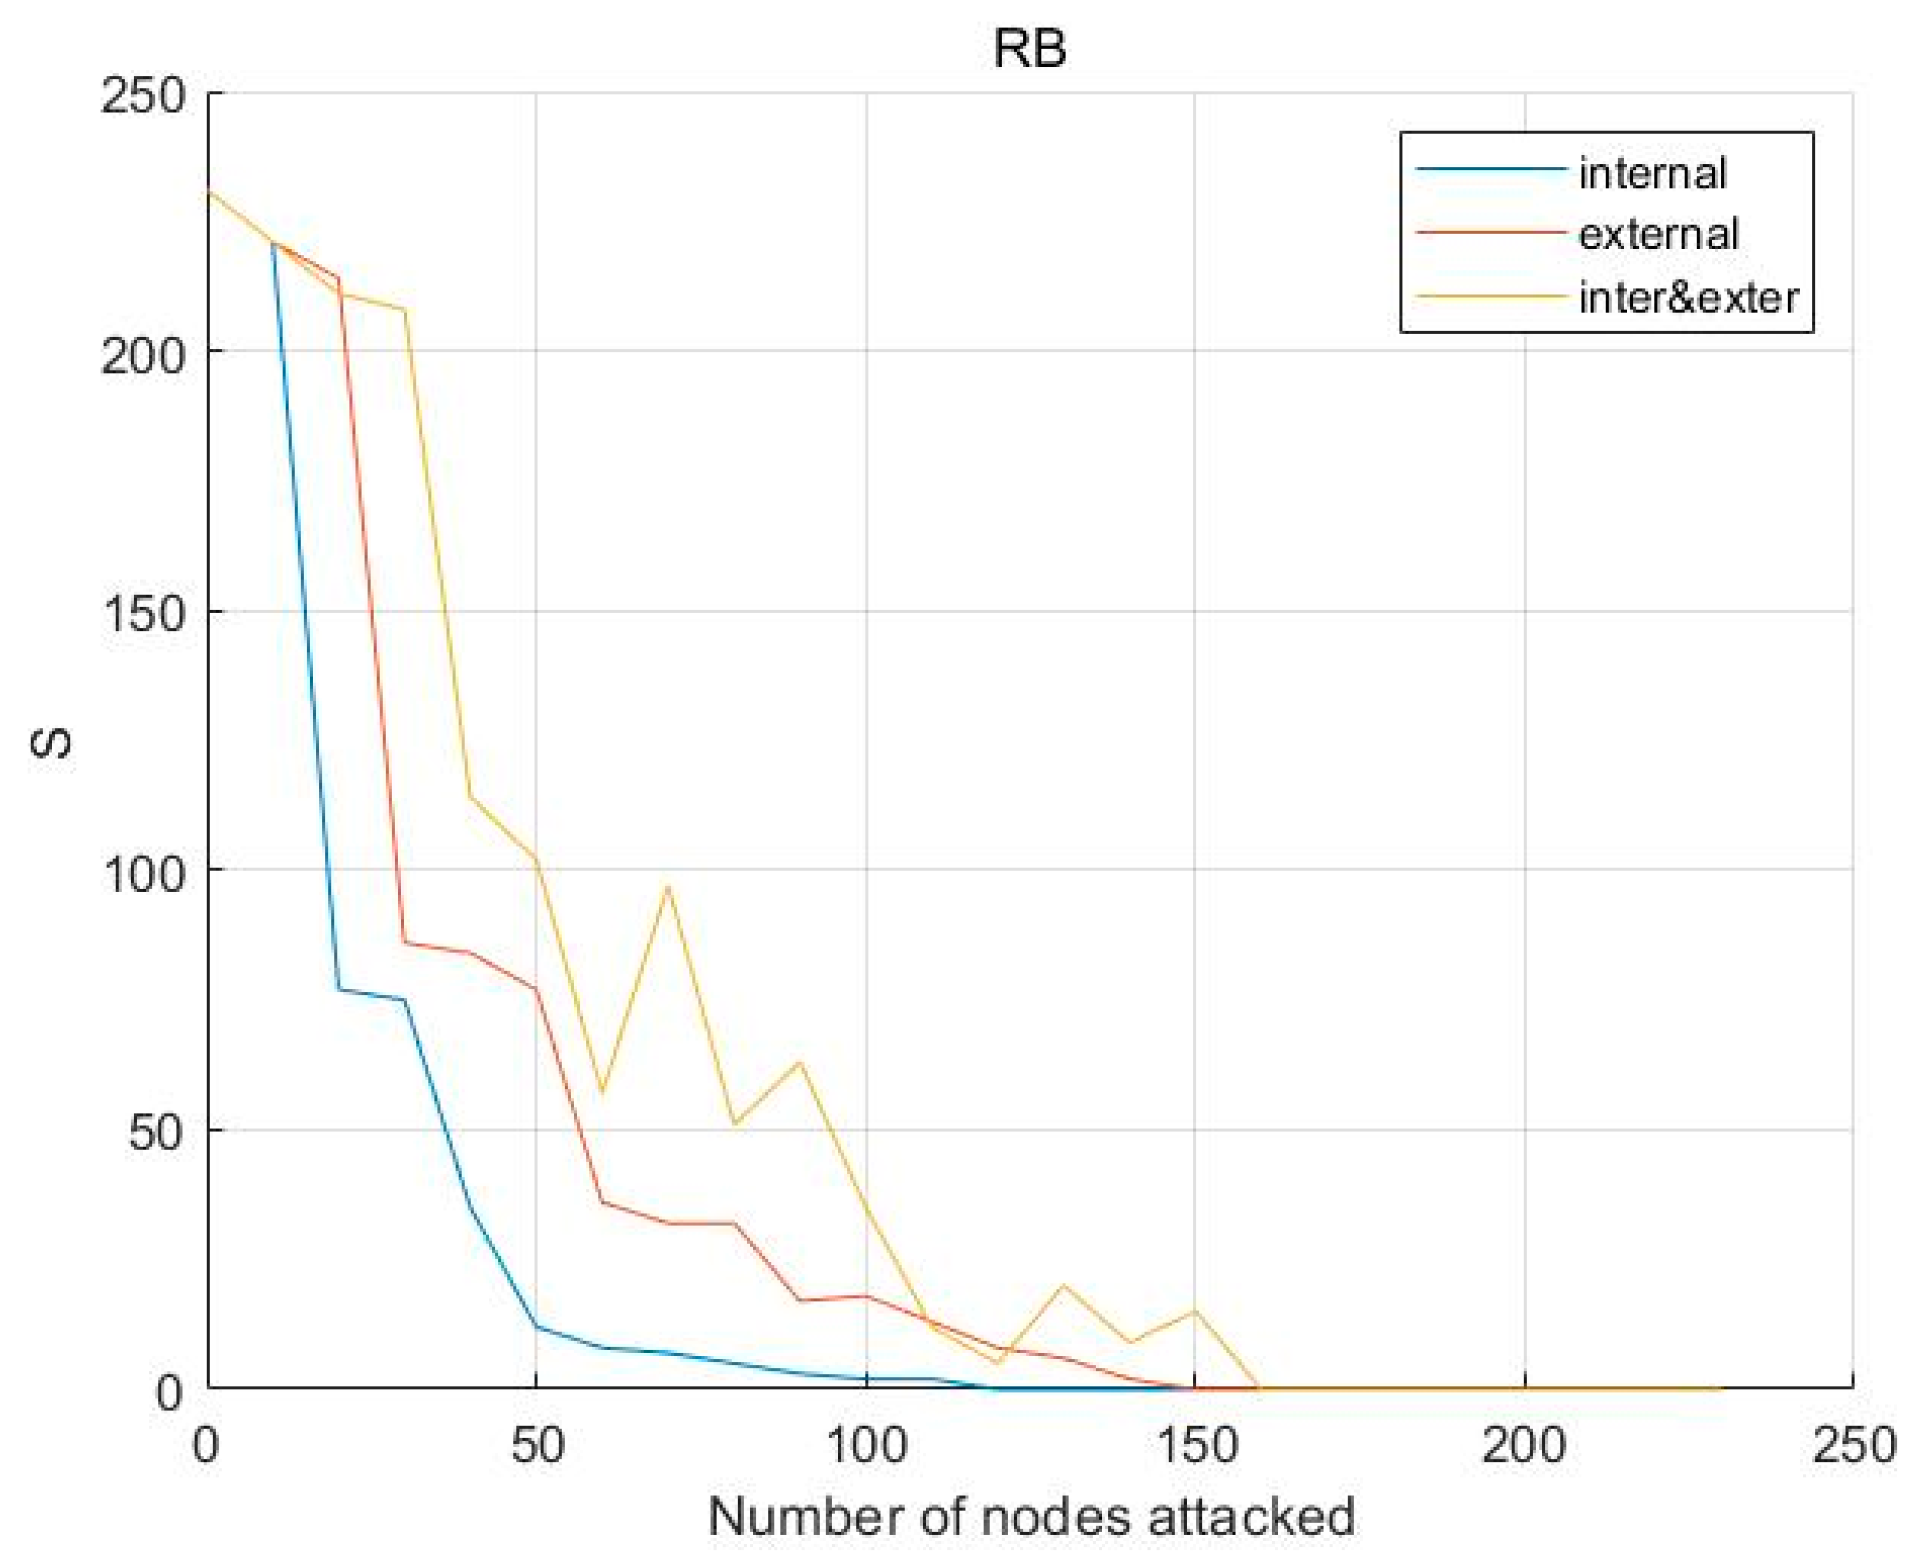
6.2.4. Structural Robustness Comparison of Three Substitution Strategies under Recomputed Node Betweenness Loss (RB) Failure Mode

As shown in Figure 10, (1) in the RB failure mode, when the number of node attacks is high, the maximum connectivity subgraph values under all three strategies decrease to 0, at which point the CMN has completely collapsed. This indicates that the RB failure mode is more destructive to the structural robustness of the CMS than either the ID or IB modes. (2) The “external” curve is always located above the “internal” curve, and the majority of the “inter&exter” curve is located above the “external” curve. This indicates that the maximum connectivity subgraph value is largest under the internal–external integration replacement strategy, followed by the external replacement strategy, and then the internal replacement strategy. Therefore, for the structural robustness of the CMS under the RB failure mode: internal–external integration replacement strategy > external replacement strategy > internal replacement strategy.
In summary, from the complex network perspective, all three resource substitution strategies significantly improved the structural robustness of the CMS. In the four failure modes (i.e., ID, IB, RD, and RB), the structural robustness levels under all three strategies were higher than those with no strategy. Further, the internal–external integration replacement strategy brought the greatest robustness enhancement to the CMS, followed by the external replacement strategy, and then the internal replacement strategy. This is reasonable because the essence of a resource substitution strategy is to add redundant nodes, so when a resource fails, redundant alternative resources will be there to replace it to complete the task. Therefore, as the number of node failures increased, the strategies with more initial redundant nodes (i.e., the internal–external resource integration strategy and the external replacement strategy) were more robust. Conversely, the strategy with fewer initial redundant nodes (i.e., the internal replacement strategy) was less robust. In addition, in the failure modes based on the initial topology (i.e., ID and IB), only the structural robustness under the no-replacement strategy and the internal replacement strategy significantly decreased. In contrast, in the failure modes based on the recomputed topology (i.e., RD and RB), the structural robustness under all strategies significantly decreased, indicating that the failure modes based on the recomputed topology were more destructive to the structural robustness of the CMS. However, for all four failure modes, all three resource substitution strategies could protect the structural robustness of the CMS to some extent.

6.3. Process Robustness Analysis

This research analyzed changes in the RoS under the four failure types using the multi-agent simulation program Anylogic and Python 3.0.

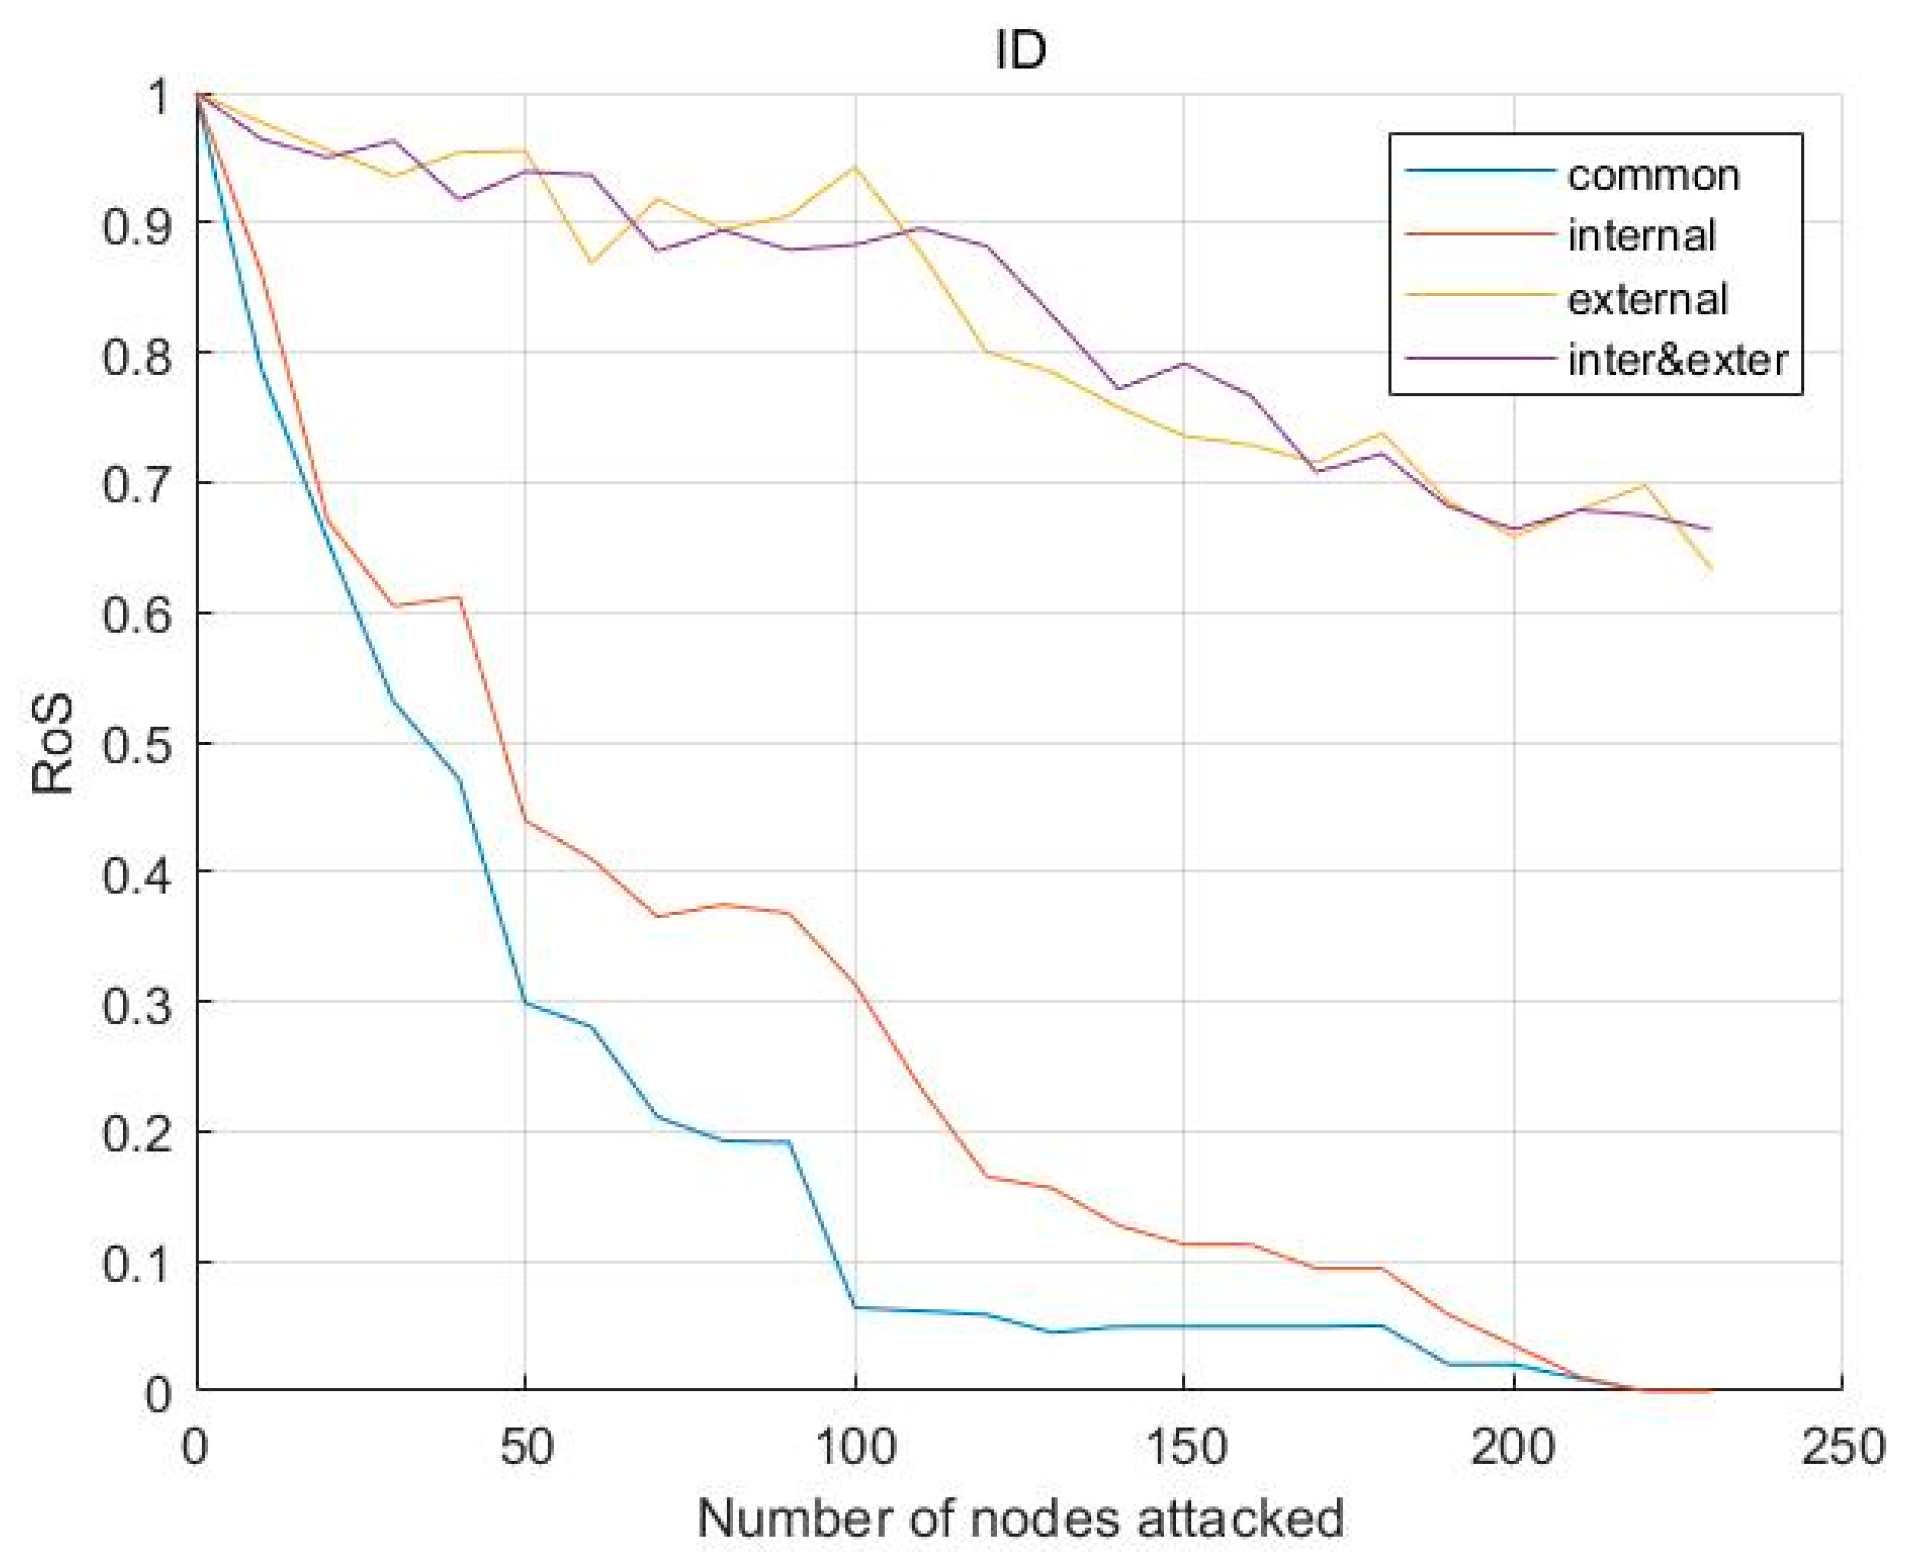
6.3.1. Process Robustness Comparison of Three Substitution Strategies under ID Failure Mode

As shown in Figure 11, (1) in the ID failure mode, the RoS values under the no-substitution strategy (“common”) and the three resource substitution strategies (“internal”, “external”, and “inter&exter”) all show a decreasing trend as the number of node failures increases (i.e., as the cloud order completion rate decreases). This indicates that from a multi-agent simulation perspective, the robustness of the CMP gradually decreases. (2) The curves of the three resource substitution strategies are all located above the curve of the no-substitution strategy (i.e., their RoS values are larger than the no-substitution strategy’s value, which means their order completion rates are higher). This indicates that all three resource substitution strategies can improve the robustness of the CMP in the face of initial node degree failure. (3) The “internal” curve is only slightly higher than the “common” curve, and when the number of node attacks is high, the RoS values of these two strategies decrease to 0, at which point all cloud orders fail to be processed. In contrast, the “external” and “inter&exter” curves are significantly higher than the “common” curve, and though the RoS values fluctuate when the number of node attacks is high, they still maintain a high level (above 0.6). This indicates that the external replacement strategy and the internal–external integration replacement strategy both offer more significant robustness enhancement than the initial replacement strategy under the ID failure mode. In particular, when the number of node attacks is high, the slight fluctuations of the RoS value indicate that the cloud order completion rate tends to be stable at this time, but different resource substitution strategies will lead to changes in the service time, cost, reliability, and other factors.

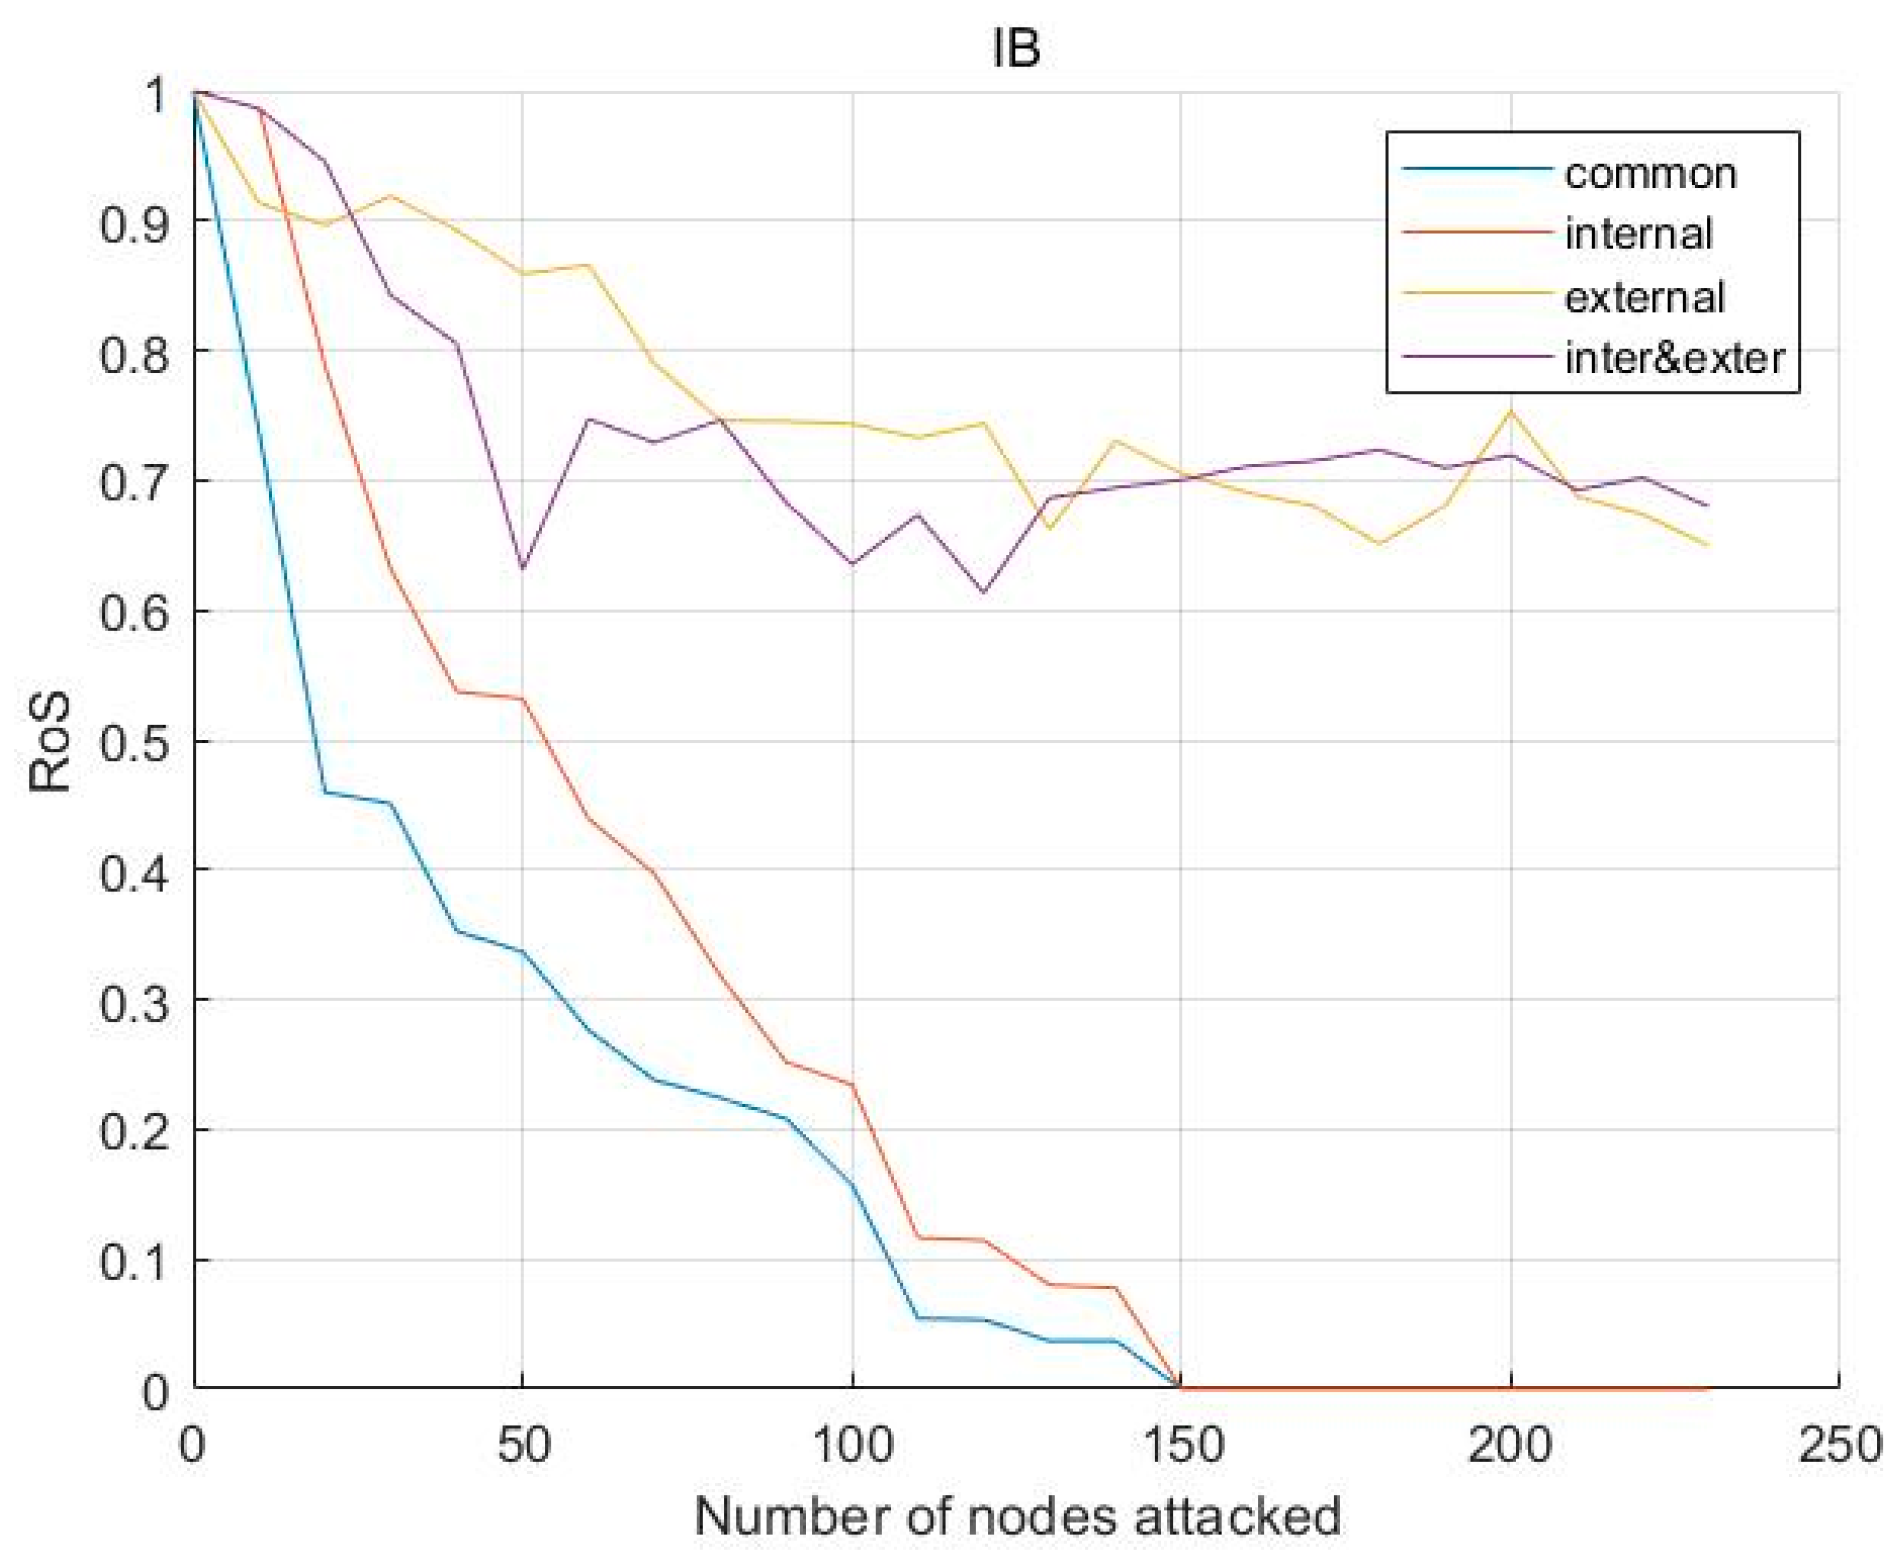
6.3.2. Process Robustness Comparison of Three Substitution Strategies under IB Failure Mode

As shown in Figure 12, (1) in the IB failure mode, the RoS values under the no-substitution strategy (“common”) and the three resource substitution strategies (“internal”, “external”, and “inter&exter”) all show a decreasing trend as the number of node failures increases (i.e., as the cloud order completion rate decreases). This indicates that from a multi-agent simulation perspective, the robustness of the CMP gradually decreases. (2) The curves of the three resource substitution strategies are all located above the curve of the no-substitution strategy (i.e., their RoS values are larger than the no-substitution strategy’s value, which means their order completion rates are higher). This indicates that all three resource substitution strategies can improve the robustness of the CMP in the face of initial node betweenness failure. (3) The “internal” curve is only slightly higher than the “common” curve, and when the number of node attacks is high, the RoS values of these two strategies decrease to 0, at which point all cloud orders fail to be processed. In contrast, the “external” and “inter&exter” curves are significantly higher than the “common” curve, and though the RoS values fluctuate when the number of node attacks is high, they still maintain a high level (above 0.6). This indicates that the external replacement strategy and the internal–external integration replacement strategy both offer more significant robustness enhancement than the initial replacement strategy under the IB failure mode. In particular, when the number of node attacks is high, the slight fluctuations in the RoS value indicate that the cloud order completion rate tends to be stable at this time, but different resource substitution strategies will lead to changes in the service time, cost, reliability, and other factors.

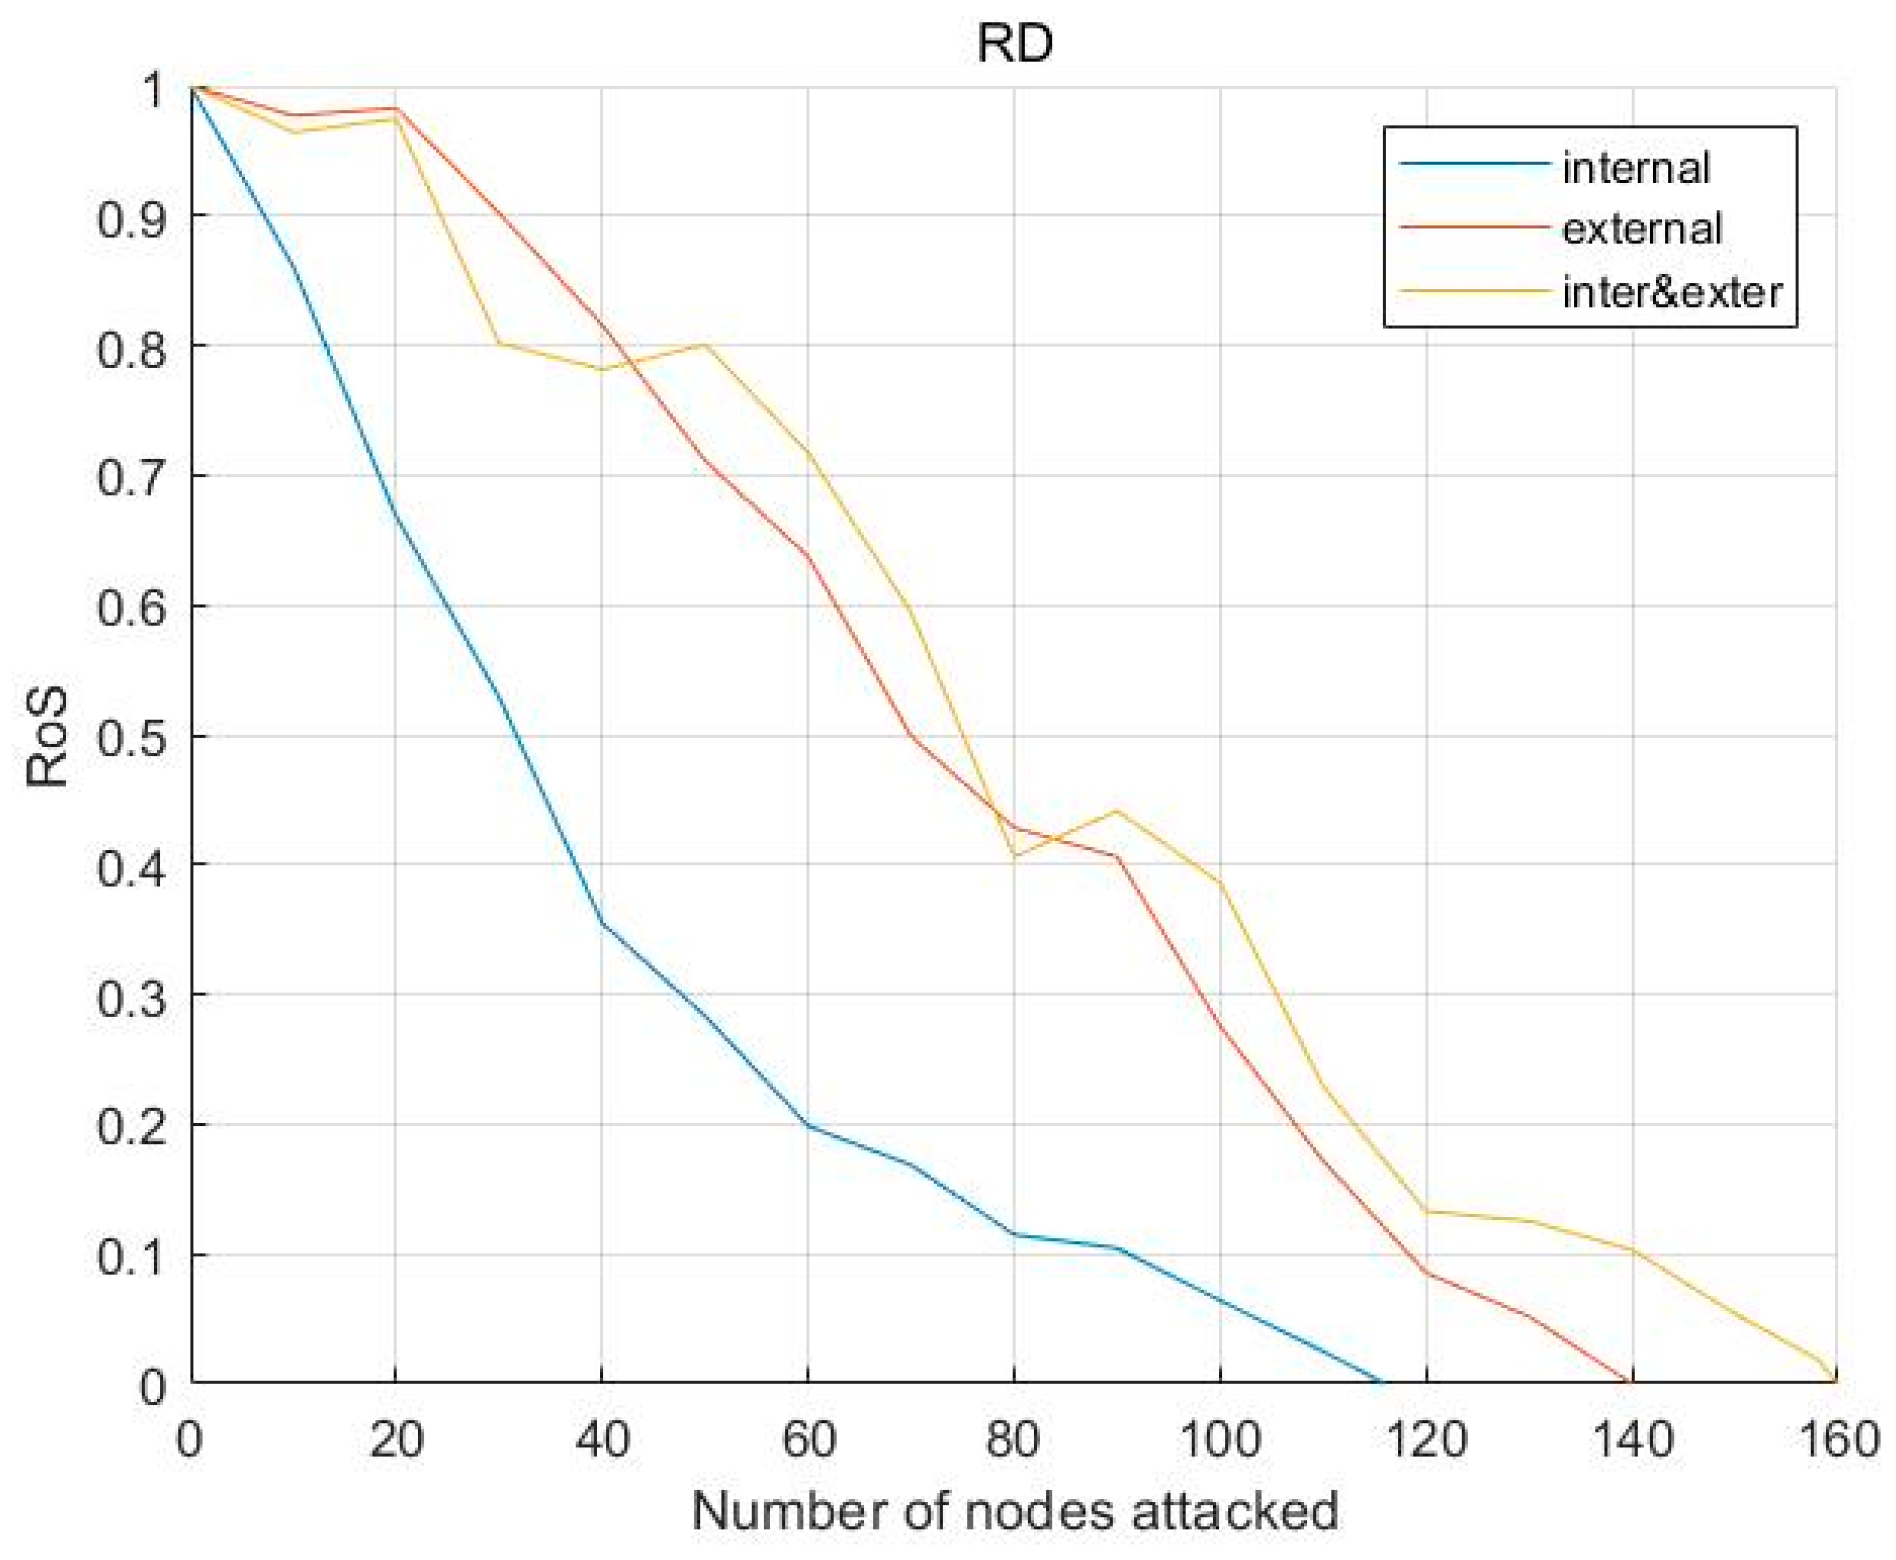
6.3.3. Process Robustness Comparison of Three Substitution Strategies under RD Failure Mode

As shown in Figure 13, (1) in the RD failure mode, as the number of node attacks increases, the RoS values under all three substitution strategies rapidly decline and finally decrease to 0, at which point all cloud orders fail to be processed. This indicates that the RD failure mode is more destructive to the robustness of the CMP than either the ID or IB modes. (2) The “external” curve is always located above the “internal” curve, and the “inter&exter” curve is nearly always located above the “external” curve. This indicates that the RoS value is largest under the internal–external integration replacement strategy, followed by the external substitution strategy, and then the internal substitution strategy. Further, under the three strategies, the numbers of node attacks required to make all cloud order processing fail (i.e., when the process robustness decreases to its lowest) are approximately 110 (“internal”), 140 (“external”), and 160 (“inter&exter”). Therefore, to attain robustness of the CMP under the RD failure mode: internal–external integration strategy > external substitution strategy > internal substitution strategy.

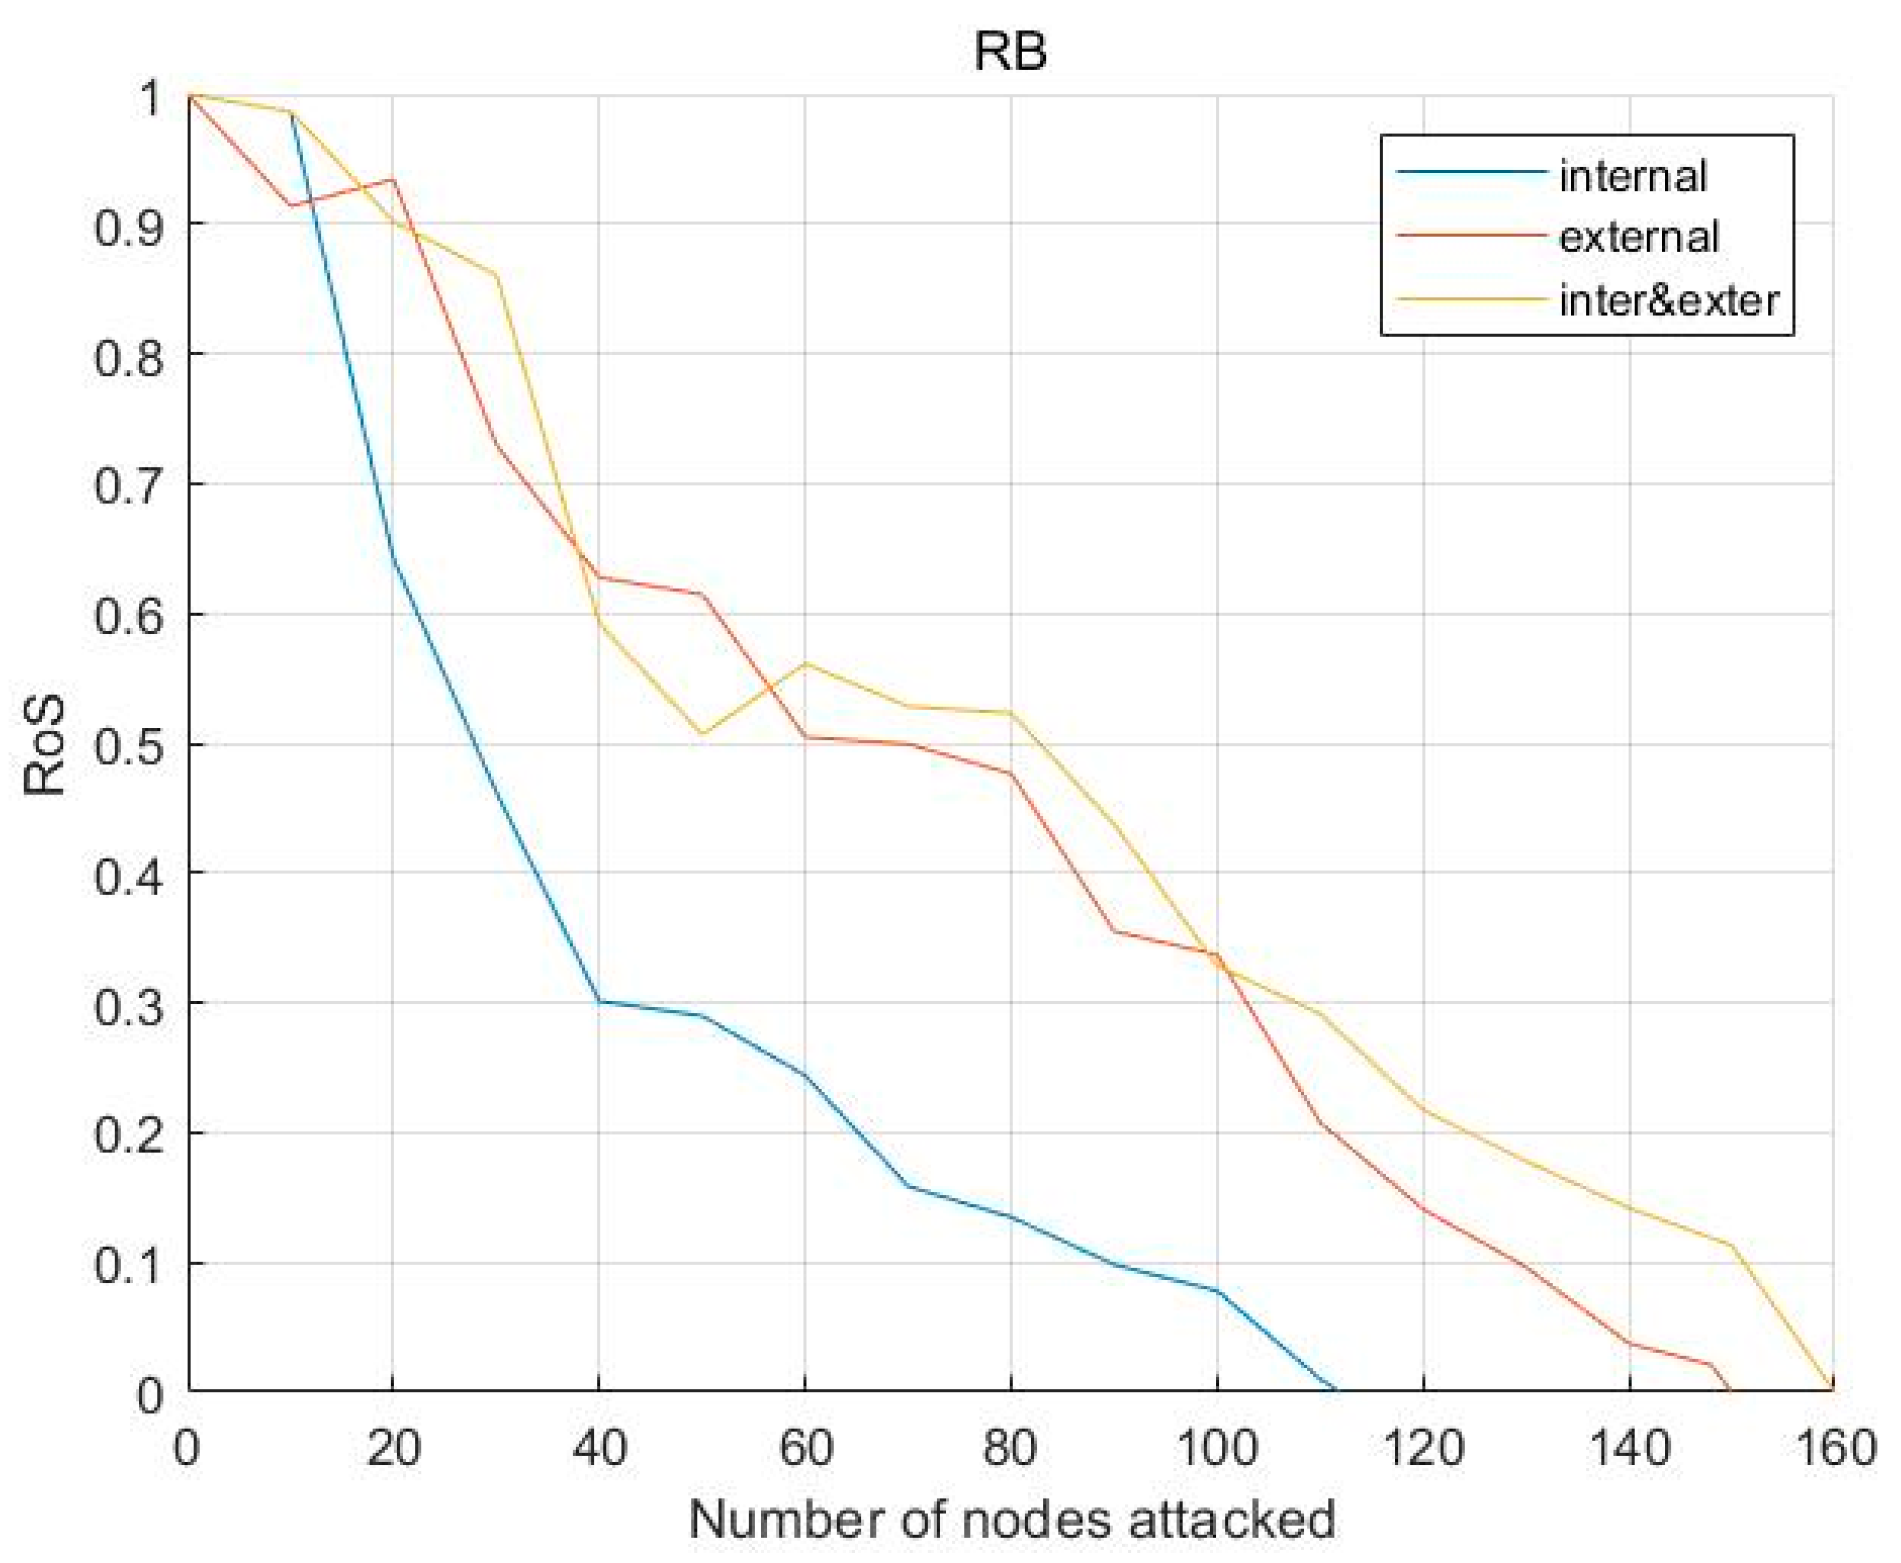
6.3.4. Process Robustness Comparison of Three Substitution Strategies under RB Failure Mode

As shown in Figure 14, (1) in the RB failure mode, as the number of node attacks increases, the RoS values under all three substitution strategies rapidly decline and finally decrease to 0, at which point all cloud orders fail to be processed. This indicates that the RB failure mode is more destructive to the robustness of the CMP than either the ID or IB modes. (2) The “external” curve is always located above the “internal” curve, and the “inter&exter” curve is nearly always located above the “external” curve. This indicates that the RoS value is largest under the internal–external integration replacement strategy, followed by the external substitution strategy, and then the internal substitution strategy. Further, under the three strategies, the number of node attacks required to make all cloud order processing fail (i.e., when the process robustness decreases to its lowest) are 110 (“internal”), 150 (“external”), and 160 (“inter&exter”). Therefore, to obtain robustness of the CMP under the RB failure mode: internal–external integration strategy > external substitution strategy > internal substitution strategy.
In summary, from the perspective of multi-agent simulation, all three resource substitution strategies significantly improved the process robustness of the CMS. In the four failure modes (i.e., ID, IB, RD, and RB), the process robustness levels under all three strategies were higher than those with no strategy. Further, the internal–external integration replacement strategy brought the greatest robustness enhancement, followed by the external replacement strategy, and then the internal replacement strategy. This is reasonable because the three strategies provided different amounts of alternative resources: the internal substitution strategy can provide fewer alternative resources, which corresponds to lower robustness; the external substitution strategy can provide five resources of the same type because five external cloud service providers are involved in this paper; and the internal–external integration replacement strategy can provide more than five resources of the same type or alternative resources, which corresponds to higher robustness. In addition, in the failure modes based on the initial topology (i.e., ID and IB), only the process robustness under the no-replacement strategy and the internal replacement strategy significantly decreased. In contrast, in the failure modes based on the recomputed topology (i.e., RD and RB), the process robustness under all strategies significantly decreased, indicating that the failure modes based on the recomputed topology were more destructive to process robustness. However, for all four failure modes, all three resource substitution strategies could protect the process robustness of the CMS to some extent.

6.4. Management Suggestion

Based on the analysis results in Section 6.2 and Section 6.3, the following management suggestions were obtained. First, focus should be placed on protecting the resource nodes with a larger degree and larger betweenness (i.e., the important nodes in the CMS). The structural robustness and process robustness of the CMS decreased rapidly in the failure modes based on the node degree (i.e., ID and RD) and node betweenness (i.e., IB and RB), indicating that nodes with a larger degree and betweenness are crucial to maintaining system robustness. More specifically, nodes with a large degree are closely connected with other nodes, so they can play an important role in maintaining system connectivity, and nodes with a large betweenness have greater control over the logistics and information flow in the system, so they can play an important role in maintaining the information transmission rate of the system. Second, alternative resources must be provided to ensure that when the original resources fail, alternative resources can replace them to complete their tasks. These alternative resources can be set up within (1) the same service provider, (2) other external service providers, or (3) a combination of both, and all these methods can protect the robustness of the CMS to a certain extent.

7. Conclusions

This study combined the complex network with multi-agent simulation to propose a new analysis method for the structural robustness and process robustness of the CMS. To target the frequent failure of resource nodes in the cloud manufacturing environment, three resource substitution strategies were proposed to better ensure the stability and robustness of the system. First, a multi-agent simulation model was constructed to study the dynamic process robustness of the CMS. Here, RoS was proposed as a robustness measure, and the behavior characteristics and modeling methods of several key types of CMP agents were detailed. Second, a complex network model of cloud manufacturing resources was established through the order–task relationship and task–resource relationship to study the static topological robustness of the CMS. Here, the maximum connectivity subgraph was proposed as a robustness measure. Regarding attack strategies, four failure modes (i.e., ID, IB, RD, and RB) were defined, and regarding robustness enhancement strategies, three resource substitution strategies (i.e., internal replacement, external replacement, and internal–external integration replacement) were proposed. Third, a case study of a cloud manufacturing project of a new energy vehicle was conducted. The results of this show that (1) the proposed RoS index was effective at portraying the variations of CMP robustness, (2) the three resource substitution strategies could improve both the structural robustness and process robustness of the CMS (with the internal–external integration strategy being most effective, followed by the external substitution strategy, and then the internal substitution strategy), and (3) the two node failure modes based on the recalculated topology were more destructive to the robustness of the CMP than the two node failure modes based on the initial topology. However, for all four failure modes, all three resource substitution strategies could protect the robustness of the CMS to some degree.
In combining the complex network with multi-agent simulation, the robustness analysis object of the CMS is extended from the CMN to the CMP, which provides a new perspective with two dimensions (i.e., structure and process). Moreover, the three proposed recovery strategies (elastic measures) are designed based on the idea of adding redundant nodes, which is of great significance to the implementation and deployment of cloud manufacturing projects. This research will be furthered by investigating the robustness of cloud path interruption, cloud logistics interruption, city lockdowns, and other phenomena, to provide a quantitative and dynamic decision-making basis for improving the robustness of the CMS.

Author Contributions

Conceptualization, X.Z. (Xin Zheng); methodology, X.Z. (Xiaodong Zhang).; software, X.Z. (Xin Zheng); formal analysis, X.Z. (Xin Zheng); investigation, X.Z. (Xin Zheng); resources, X.Z. (Xin Zheng); data curation, X.Z. (Xin Zheng) and Y.W.; writing—original draft preparation, X.Z. (Xin Zheng); writing—review and editing, X.Z. (Xin Zheng) and X.Z. (Xiaodong Zhang); visualization, X.Z. (Xin Zheng) and Y.W.; supervision, X.Z. (Xiaodong Zhang); project administration, X.Z. (Xiaodong Zhang). All authors have read and agreed to the published version of the manuscript.

Funding

This research was supported by the National Natural Science Foundation of China (No. 71871018).

Institutional Review Board Statement

Not applicable.

Informed Consent Statement

Not applicable.

Data Availability Statement

The used and analyzed datasets during the present study are available from the corresponding author on reasonable request.

Conflicts of Interest

The authors declare no conflict of interest. The funders had no role in the design of the study; in the collection, analyses, or interpretation of data; in the writing of the manuscript; or in the decision to publish the results.

References

  1. Li, B.; Chai, X.; Hou, B.; Li, T.; Zhang, Y.; Yu, H.; Han, J.; Di, Y.; Huang, J.; Song, C.; et al. Networked Modeling & Simulation Platform Based on Concept of Cloud Computing—Cloud Simulation Platform. J. Syst. Simul. 2009, 21, 5292–5299. [Google Scholar]
  2. Li, B.; Zhang, L.; Wang, S.; Tao, F.; Cao, J.; Jiang, X.; Song, X.; Chai, X. Cloud manufacturing: A new service-oriented networked manufacturing model. Comput. Integr. Manuf. Syst. 2010, 16, 1–7. [Google Scholar]
  3. Zhao, C.; Zhang, L.; Liu, Y.; Zhang, Z.; Yang, G.; Li, B.H. Agent-based simulation platform for cloud manufacturing. Int. J. Model. Simul. Sci. Comput. 2017, 8, 1742001. [Google Scholar] [CrossRef]
  4. Jacob, I.; Lu, Y.; Xun, X. Cloud Manufacturing–An Overview of Developments In Critical Areas, Prototypes, and Future Perspectives. IFAC-Pap. 2022, 55, 643–648. [Google Scholar] [CrossRef]
  5. Narayan Rane, T. System and Risk Analysis of Cloud-Manufacturing System. Int. J. Comput. Sci. Eng. Surv. 2022, 13, 13–27. [Google Scholar] [CrossRef]
  6. Zeng, Z.; Wu, Q.; Yan, Y. Analysis of Influencing Factors on Cloud Service Composition Flexibility: Based on Perspective of Cloud Manufacturing Service Platform. Sci. Technol. Manag. Res. 2019, 39, 234–239. [Google Scholar]
  7. Zhang, Y.; Zhang, L.; Liu, Y.; Luo, X. Proof of service power: A blockchain consensus for cloud manufacturing. J. Manuf. Syst. 2021, 59, 1–11. [Google Scholar] [CrossRef]
  8. Zhu, X.; Shi, J.; Huang, S.; Zhang, B. Consensus-oriented cloud manufacturing based on blockchain technology: An exploratory study. Pervasive Mob. Comput. 2020, 62, 101113. [Google Scholar] [CrossRef]
  9. Laili, Y.; Lin, S.; Tang, D. Multi-phase integrated scheduling of hybrid tasks in cloud manufacturing environment. Robot Comput.-Int. Manuf. 2020, 61, 101850. [Google Scholar] [CrossRef]
  10. Wang, Y.; Wang, S.; Kang, L.; Wang, S. An effective dynamic service composition reconfiguration approach when service exceptions occur in real-life cloud manufacturing. Robot Comput. Int. Manuf. 2021, 71, 102143. [Google Scholar] [CrossRef]
  11. Liang, H.; Wen, X.; Liu, Y.; Zhang, H.; Zhang, L.; Wang, L. Logistics-involved QoS-aware service composition in cloud manufacturing with deep reinforcement learning. Robot Comput. Int. Manuf. 2021, 67, 101991. [Google Scholar] [CrossRef]
  12. Tao, F.; Zhang, L.; Guo, H.; Luo, Y.; Ren, L. Typical characteristics of cloud manufacturing and several key issues of cloud service composition. Comput. Integr. Manuf. Syst. 2011, 17, 477–486. [Google Scholar]
  13. Gao, Z.; Zhu, Q.B.; Song, T.X. In Analysis and research on dynamic models of complex manufacturing network cascading failures. In Proceedings of the 2014 Sixth International Conference on Intelligent Human-Machine Systems AND Cybernetics (IHMSC), Hangzhou, China, 26–27 August 2014; Volume 1, pp. 388–391. [Google Scholar]
  14. Su, Y.; Chai, G.; Liu, P. Topological Structure and Vulnerability of Cloud Manufacturing Network. In Proceedings of the International Conference on Artificial Intelligence and Communication Technology (AICT 2020), Chongqing, China, 7–9 October 2020; p. 5. [Google Scholar]
  15. Cauvin, A.C.A.; Ferrarini, A.F.A.; Tranvouez, E.T.E. Disruption management in distributed enterprises: A multi-agent modelling and simulation of cooperative recovery behaviours. Int. J. Prod. Econ. 2009, 122, 429–439. [Google Scholar] [CrossRef]
  16. Li, P.; Cheng, Y.; Tao, F. Failures detection and cascading analysis of manufacturing services collaboration toward industrial internet platforms. J. Manuf. Syst. 2020, 57, 169–181. [Google Scholar] [CrossRef]
  17. Lachenmaier, J.F.; Lasi, H.; Kemper, H. Simulation of Production Processes Involving Cyber-physical Systems. Procedia CIRP 2017, 62, 577–582. [Google Scholar] [CrossRef]
  18. Galaske, N.; Anderl, R. Disruption Management for Resilient Processes in Cyber-physical Production Systems. Procedia CIRP 2016, 50, 442–447. [Google Scholar] [CrossRef] [Green Version]
  19. Hou, Y. Study on Robust Scheduling of Flexible Job Shop based on Process Relationship Network under Machine Failure. Master’s Thesis, Xinjiang University, Urumqi, China, 2020. [Google Scholar]
  20. Zhang, Z. Research on Robustness of Manufacturing Product Warranty Network. Master’s Thesis, Hangzhou Dianzi University, Hangzhou, China, 2012. [Google Scholar]
  21. Beygelzimer, A.; Grinstein, G.; Linsker, R.; Rish, I. Improving network robustness by edge modification. Phys. A Stat. Mech. Its Appl. 2005, 357, 593–612. [Google Scholar] [CrossRef]
  22. Ma, C. Research on Robustness Evaluation of Urban Gas Pipeline Network based on Cascade Failure. Master’s Thesis, North China University of Technology, Beijing, China, 2022. [Google Scholar]
  23. Ji, X.; Wang, B.; Liu, D.; Chen, G.; Tang, F.; Wei, D.; Tu, L. Improving interdependent networks robustness by adding connectivity links. Phys. A Stat. Mech. Its Appl. 2016, 444, 9–19. [Google Scholar] [CrossRef]
  24. Li, X. Study on the Robustness of Complex Production Process under Disturbing Environment. Master’s Thesis, Xinjiang University, Urumqi, China, 2018. [Google Scholar]
  25. Wang, S. Robust Analysis of Production Supply Chain Network. Master’s Thesis, Hangzhou Dianzi University, Hangzhou, China, 2021. [Google Scholar]
  26. Wang, X.; Cao, J.; Li, R.; Zhao, T. A preferential attachment strategy for connectivity link addition strategy in improving the robustness of interdependent networks. Phys. A Stat. Mech. Its Appl. 2017, 483, 412–422. [Google Scholar] [CrossRef]
  27. Chen, C.; Zhao, Y.; Qin, H.; Meng, X.; Gao, J. Robustness of interdependent scale-free networks based on link addition strategies. Phys. A Stat. Mech. Its Appl. 2022, 604, 127851. [Google Scholar] [CrossRef]
  28. Kazawa, Y.; Tsugawa, S. Effectiveness of link-addition strategies for improving the robustness of both multiplex and interdependent networks. Phys. A Stat. Mech. Its Appl. 2020, 545, 123586. [Google Scholar] [CrossRef]
  29. Bachmann, I.; Valdés, V.; Bustos-Jiménez, J.; Bustos, B. Effect of adding physical links on the robustness of the Internet modeled as a physical–logical interdependent network using simple strategies. Int. J. Crit. Infr. Prot. 2022, 36, 100483. [Google Scholar] [CrossRef]
  30. Cao, X.; Hong, C.; Du, W.; Zhang, J. Improving the network robustness against cascading failures by adding links. Chaos Solitons Fractals 2013, 57, 35–40. [Google Scholar] [CrossRef]
  31. Zhu, L.; Li, P.; Yang, X.; Shen, G.; Zhao, Y. EE-RJMTFN: A novel manufacturing risk evaluation method for alternative resource selection in cloud manufacturing. Concurr. Eng. 2019, 27, 3–13. [Google Scholar] [CrossRef]
  32. Barbosa, J.; Leitão, P.; Adam, E.; Trentesaux, D. Dynamic self-organization in holonic multi-agent manufacturing systems: The ADACOR evolution. Comput. Ind. 2015, 66, 99–111. [Google Scholar] [CrossRef] [Green Version]
  33. Dobrescu, R.; Merezeanu, D.; Mocanu, S. Process simulation platform for virtual manufacturing systems evaluation. Comput. Ind. 2019, 104, 131–140. [Google Scholar] [CrossRef]
  34. Chen, T.; Chiu, M. Development of a cloud-based factory simulation system for enabling ubiquitous factory simulation. Robot Comput. Int. Manuf. 2017, 45, 133–143. [Google Scholar] [CrossRef]
  35. Zhang, L.; Zhou, L.; Ren, L.; Laili, Y. Modeling and simulation in intelligent manufacturing. Comput. Ind. 2019, 112, 103123. [Google Scholar] [CrossRef]
  36. Zhao, C.; Luo, X.; Zhang, L. Modeling of service agents for simulation in cloud manufacturing. Robot Comput. Int. Manuf. 2020, 64, 101910. [Google Scholar] [CrossRef]
  37. Zhao, C.; Wang, L.; Zhang, X. Service agent networks in cloud manufacturing: Modeling and evaluation based on set-pair analysis. Robot Comput. Int. Manuf. 2020, 65, 101970. [Google Scholar] [CrossRef]
  38. Eisa, M.; Younas, M.; Basu, K.; Awan, I. Modelling and Simulation of QoS-Aware Service Selection in Cloud Computing. Simul. Model Pract. Theory 2020, 103, 102108. [Google Scholar] [CrossRef]
  39. Zhou, L.; Zhang, L.; Ren, L. Modelling and simulation of logistics service selection in cloud manufacturing. Procedia CIRP 2018, 72, 916–921. [Google Scholar] [CrossRef]
  40. Vespoli, S.; Grassi, A.; Guizzi, G.; Santillo, L.C. Evaluating the advantages of a novel decentralised scheduling approach in the Industry 4.0 and Cloud Manufacturing era. IFAC Pap. 2019, 52, 2170–2176. [Google Scholar] [CrossRef]
  41. Li, B.; Zhang, L.; Ren, L.; Chai, X.; Tao, F.; Luo, Y.; Wang, Y.; Yin, C.; Huang, G.; Zhao, X. Further discussion on cloud manufacturing. Comput. Integr. Manuf. Syst. 2011, 17, 449–457. [Google Scholar]
  42. Zheng, X.; Zhang, X. Robustness of Cloud Manufacturing System Based on Complex Network and Multi-Agent Simulation. Entropy 2023, 25, 45. [Google Scholar] [CrossRef] [PubMed]
  43. Wang, Y.; Wang, S.; Gao, S.; Guo, X.; Yang, B. Adaptive multi-objective service composition reconfiguration approach considering dynamic practical constraints in cloud manufacturing. Knowl. Based Syst. 2021, 234, 107607. [Google Scholar] [CrossRef]
  44. Yang, B.; Wang, S.; Cheng, Q.; Jin, T. Scheduling of field service resources in cloud manufacturing based on multi-population competitive-cooperative GWO. Comput. Ind. Eng. 2021, 154, 107104. [Google Scholar] [CrossRef]
  45. Huang, B.; Li, C.; Tao, F. A chaos control optimal algorithm for QoS-based service composition selection in cloud manufacturing system. Enterp. Inf. Syst. 2014, 8, 445–463. [Google Scholar] [CrossRef]
  46. Zhou, H. Research on Dynamic Robustness of Knowledge Collaboration Network of Open Source Product Community. Ph.D. Thesis, University of Science and Technology Beijing, Beijing, China, 2018. [Google Scholar]
  47. Lei, S. Robustness of Open-Source Community Knowledge Collaboration Network based on Multiple Failure Modes. Ph.D. Thesis, University of Science and Technology Beijing, Beijing, China, 2022. [Google Scholar]
  48. Zhao, Q. Supply Chain Modeling and Robustness Analysis in the Perspective of Complex Network-a Case Study of Smartphone Supply Chain. Master’s Thesis, Beijing University of Posts and Telecommunications, Beijing, China, 2021. [Google Scholar]
Figure 1. Schematic diagram of CMP.
Applsci 13 07418 g001
Figure 2. Cloud task agent’s internal workflow.
Applsci 13 07418 g002
Figure 3. Schematic depiction of (a) the CMS’s internal relationships and (b) the cloud resource network.
Applsci 13 07418 g003
Figure 4. Logical flow diagram of resource substitution strategy.
Applsci 13 07418 g004
Figure 5. Layout of the cloud resource network in space.
Applsci 13 07418 g005
Figure 6. Cloud resource network degree distribution.
Applsci 13 07418 g006
Figure 7. Variation of S under ID failure mode.
Applsci 13 07418 g007
Figure 8. Variation of S under IB failure mode.
Applsci 13 07418 g008
Figure 9. Variation of S under RD failure mode.
Applsci 13 07418 g009
Figure 10. Variation of S under RB failure mode.
Applsci 13 07418 g010
Figure 11. Variation of RoS under ID failure mode.
Applsci 13 07418 g011
Figure 12. Variation of RoS under IB failure mode.
Applsci 13 07418 g012
Figure 13. Variation of RoS under RD failure mode.
Applsci 13 07418 g013
Figure 14. Variation of RoS under RB failure mode.
Applsci 13 07418 g014
Table 1. Resource failure based on initial topology and recomputed topology.
Failure Mode
Description
Failure Mode Calculation Process
Resource failure based on
initial topology
Initial node degree
loss (ID)
Sort the resource nodes in the initial network (Network-0) by degree, from largest to smallest. Remove one node at a time, and repeat n times until all nodes in the network are removed.
Initial node
betweenness
loss (IB)
Sort the resource nodes in the initial network (Network-0) by betweenness, from largest to smallest. Remove one node at a time, and repeat n times until all nodes in the network are removed.
Resource failure based on
recomputed
topology
Recomputed node degree
loss (RD)
Sort the resource nodes in the initial network (Network-0) by degree, from largest to smallest. Remove the first node and generate a new network (Network-1). Recalculate and sort the resource nodes in the new network (Network-1) by degree, from largest to smallest. Remove the first node and generate a new network (Network-2) … and so on, until all nodes in the network are removed.
Recomputed node
betweenness
loss (RB)
Sort the resource nodes in the initial network (Network-0) by betweenness, from largest to smallest. Remove the first node and generate a new network (Network-1). Recalculate and sort the resource nodes in the new network (Network-1) by betweenness, from largest to smallest. Remove the first node and generate a new network (Network-2) … and so on, until all nodes in the network are removed.
Note: The removal of nodes is handled differently in the complex network model and the multi-agent model: (1) In the complex network model, the corresponding resource nodes and all connected edges on the nodes are deleted. (2) In the multi-agent model, the corresponding resource agent is changed to a “fault” state, which means the resource is unable to provide services.
Table 2. Order and cloud service route correspondence.
Order TypeCloud Service RouteOrder TypeCloud Service Route
Order 11Applsci 13 07418 i001Order 12Applsci 13 07418 i002
Order 13Applsci 13 07418 i003Order 14Applsci 13 07418 i004
Order 15Applsci 13 07418 i005Order 16Applsci 13 07418 i006
Order 21Applsci 13 07418 i007Order 22Applsci 13 07418 i008
Order 23Applsci 13 07418 i009Order 24Applsci 13 07418 i010
Order 25Applsci 13 07418 i011Order 26Applsci 13 07418 i012
Order 31Applsci 13 07418 i013Order 32Applsci 13 07418 i014
Order 33Applsci 13 07418 i015Order 34Applsci 13 07418 i016
Order 41Applsci 13 07418 i017Order 42Applsci 13 07418 i018
Order 43Applsci 13 07418 i019Order 44Applsci 13 07418 i020
Order 51Applsci 13 07418 i021Order 52Applsci 13 07418 i022
Order 53Applsci 13 07418 i023Order 54Applsci 13 07418 i024
Table 3. Task and resource correspondence.
TaskResourceTaskResourceTaskResourceTaskResource
t1(r1)t2(r3)t3(r2)t4(r4)
t5(r11, r30)t6(r5)t7(r12, r29)t8(r6)
t9(r12, r29)t10(r31)t11(r11, r30)t12(r67)
t13(r32)t14(r1)t15(r7)t16(r1)
t17(r2)t18(r8)t19(r2)t20(r5)
t21(r5)t22(r41)t23(r6)t24(r6)
t25(r71)t26(r42)t27(r33)t28(r9)
t29(r9)t30(r34)t31(r10)t32(r10)
t33(r9)t34(r7)t35(r9)t36(r7)
t37(r10)t38(r8)t39(r10)t40(r8)
t41(r13, r14)t42(r61)t43(r21, r23)t44(r51, r52)
t45(r15, r16)t46(r62)t47(r22, r24)t48(r53, r54)
t49(r21, r23)t50(r47, r48)t51(r47, r48)t52(r33)
t53(r35, r37)t54(r63)t55(r43, r45)t56(r22, r24)
t57(r49, r50)t58(r49, r50)t59(r34)t60(r36, r38)
t61(r64)t62(r44, r46)t63(r35, r37)t64(r41)
t65(r41)t66(r39)t67(r25, r27)t68(r65)
t69(r13, r14)t70(r36, r38)t71(r42)t72(r42)
t73(r40)t74(r26, r28)t75(r66)t76(r15, r16)
t77(r47, r48)t78(r51, r52)t79(r57, r58)t80(r47, r48)
t81(r49, r50)t82(r53, r54)t83(r68)t84(r59, r60)
t85(r49, r50)t86(r57, r58)t87(r17, r19)t88(r63)
t89(r55)t90(r59, r60)t91(r18, r20)t92(r69)
t93(r64)t94(r70)t95(r56)
Table 4. Substitution relationships among internal resources.
ResourceAlternative ResourceRe-SourceAlternative ResourceRe-SourceAlternative ResourceRe-SourceAlternative Resource
r1r2r2r1r3r4r4r3
r5r6r6r5r7r8r8r7
r9r10r10r9r11r12r12r11
r13r16r14r15r15r14r16r13
r17r20r18r19r19r18r20r17
r21r24r22r23r23r22r24r21
r25r28r26r27r27r26r28r25
r29r30r30r29r31r32r32r31
r33r34r34r33r35r38r36r37
r37r36r38r35r39r40r40r39
r41r42r42r41r43r44r44r43
r45r46r46r45r47r49r48r50
r49r47r50r48r51r53r52r54
r53r51r54r52r55r56r56r55
r57r59r58r60r59r57r60r58
r61r62r62r61r63r64r64r63
r65r66r66r65r67r68r68r67
r69r70r70r69r71r72r72r71
Table 5. Properties of cloud demanders and cloud servers.
IDCityLocation
(Latitude, Longitude)
IDCityLocation
(Latitude, Longitude)
S1Beijing(39.91, 116.41)d5Jinan(36.4, 117)
S2Shanghai(31.21, 121.43)d6Lanzhou(36.03, 103.73)
S3Chengdu(30.66, 104.06)d7Wulumuqi(43.76, 87.68)
S4Hangzhou(30.26, 120.2)d8Changsha(28.21, 113)
S5Shenzhen(22.61, 114.06)d9Nanchang(28.68, 115.9)
d10Fuzhou(26.08, 119.3)
d1HaErbin(45.75, 126.63)d11Nanning(22.48, 108.19)
d2ShenYang(41.8, 123.38)d12Lasa(29.6, 91)
d3Baotou(40.39, 109.49)d13Lianyungang(34.36, 119.1)
d4Tianjin(39.13, 117.2)d14Hefei(31.52, 117.17)
Table 6. Topological parameters of initial cloud resource network.
Topological ParameterNumber of NodesAverage DegreeDensityAverage Path Length
Cloud resource
network
23121.2080.0874.231
Disclaimer/Publisher’s Note: The statements, opinions and data contained in all publications are solely those of the individual author(s) and contributor(s) and not of MDPI and/or the editor(s). MDPI and/or the editor(s) disclaim responsibility for any injury to people or property resulting from any ideas, methods, instructions or products referred to in the content.

