Article

Numerical Modeling of Cross-Transmission of Airborne Pollutants in a High-Rise Building Induced by Elevator Car Movement

1
Tianjin Key Laboratory of Indoor Air Environmental Quality Control, School of Environmental Science and Engineering, Tianjin University, Tianjin 300072, China
2
School of Civil Engineering, Dalian University of Technology, Dalian 116024, China
*
Author to whom correspondence should be addressed.
Appl. Sci. 2023, 13(13), 7400; https://doi.org/10.3390/app13137400
Submission received: 27 April 2023 / Revised: 13 June 2023 / Accepted: 16 June 2023 / Published: 22 June 2023
(This article belongs to the Topic Computational Fluid Dynamics (CFD) and Its Applications)

Abstract

:

Featured Application

Revealing the airflow exchange mechanism between different floors generated by the up and down movements of elevator cars is significant guidance for building airflow environment design and preventing infectious disease transmission.

Abstract

An elevator shaft provides passage for air exchange across floors and thus imposes infectious disease transmission risk. The moving elevator car generates positive air pressure in the shaft section to which the car approaches, while negative air pressure is generated in the section where the car leaves away. This investigation adopted computational fluid dynamics (CFD) to model the exchange airflow between the lobbies of each floor and the shaft accompanying the car movement. Dynamic distributions of the air pressure, velocity, and airborne pollutant concentration inside both the shaft and the lobbies were solved. The modeling results were verified with some experimental test data. The results revealed that the alternatively changed air pressures inside the shaft while the car was moving caused significant airflow exchange via the clearances of the protecting doors and, thus, the transmission of airborne pollutants across floors. The sudden changes in the airflow rates could be due to the elevator car passing by the protecting door’s opening on the concerned floor or the generated water hammer when the car was parked. To minimize the transmission of airborne pollutants across floors, the pressures inside the shaft must be better controlled, and the clearance of the elevator’s protecting doors shall be further minimized.

1. Introduction

The transmission of respiratory infectious diseases [1,2,3,4] is mainly due to the inhalation of aerosol particles containing bacteria and/or viruses [5]. The typical size range of viral particles is between 0.02 and 0.3 μm [6]. When a patient coughs or sneezes, a large number of aerosol particles are generated [7], and over 60% of viruses attach to aerosol particles with diameters smaller than 4 μm [8]. The viruses may remain infectious in droplet nuclei for a long time [9,10,11]. The maximum range of virus transmission through aerosols can even exceed 6 km [12].
Several epidemiological studies [13,14,15,16] revealed that the COVID-19 patients in some buildings were distributed on different floors, and the patients had no direct contact with each other. A possible transmission route was through vertical airborne transmission. However, previous investigations [13,14,15] mainly analyzed the cross-floor transmission of virus aerosols through drainage and air conditioning systems. Few investigations have explored the potential transmission due to the elevator system. However, in our previous research [17], we found that a sufficient viral load is still present in the cabin when dwellers take the elevator at different times due to limited ACH.
Modern high-rise buildings are typically equipped with elevators. The elevator shaft and the protecting doors’ clearances connect floors with each other [18]. Even without considering the elevator car motion, a modeling study showed that significant transmission of pollutants across different floors occurred through the elevator shaft and the protecting doors’ clearances [19]. The pollutant transmission was merely due to the airflow exchange across floors via the elevator shaft.
The airflow exchange through elevators is ascribed to the connection of each floor through the shaft and the generated pressure variation and strong airflow in the shaft due to the elevator car movement. The passengers accessing each floor can also cause air exchange between the lobby and the internal compartment of the elevator car, though such airflow exchange does not fall within the scope of this investigation. On the one hand, the shaft in buildings can enhance the chimney effect due to the buoyancy flow resulting from temperature differences [20]. The shaft can promote ventilation inside the building [21] and thus may carry bioaerosols for transport across floors [16]. Numerical modeling [21,22] and reduced-scale model tests [23,24] have been adopted for studying the spread of smoke in the shaft during fire accidents. The smoke can rise quickly along the shaft due to the chimney effect [25]. Pressurizing the shaft [26,27] can suppress the upward spread of smoke. To minimize the chimney effect, the shaft can be ventilated and cooled [28]. However, these studies mainly focused on the chimney effect itself without consideration of the movement of elevator cars.
The movement of the elevator car can generate piston flow [29]. Commonly, elevator cars move at a constant speed [29,30,31] except in the very short acceleration or deacceleration stage [32]. The motion of the elevator car has an obvious impact on the distribution of pressure and air velocity in the shaft and lobby [33]. The faster the elevator moves, the greater pressure difference is generated between the lobby and the shaft [34]. Empirical formulas were developed to predict the maximum pressure difference [29], and the accuracy of the models was verified by experimental tests. Both numerical simulation and reduced-scale model tests [35] were adopted to investigate variations in the pressures due to the high-speed elevator car movement.
The elevator car movement can impact the smoke dispersion during fires. The up-movement of the elevator car can accelerate smoke dispersion in the shaft [31], while the downward movement of the elevator car can reduce the spread of smoke to other floors to some extent [36]. These studies investigated only an isolated single movement direction of the elevator car. Few studies focused on the parking process of an elevator car. The parking of an elevator car may generate a water hammer [37], which reverses the flow in the shaft, similar to the parking of a subway train in the tunnel [38].
The generated piston flow and pressure difference due to the elevator car movement could drive airflow exchange between the shaft and the lobbies. Such exchange airflow might carry virus aerosols for transport across floors. However, the dynamic processes of airflow exchange, the exact airflow exchange rate, and the caused possible airborne pollution transmission across floors remained unclear. This investigation carried out computational fluid dynamics (CFD) modeling of air pressure, velocity, and pollutant concentrations in the elevator shaft and lobbies on different floors in a building while considering the elevator car movement.

2. Materials and Methods

In this section, the geometric model, the case design, and the numerical solution strategy are briefly introduced.

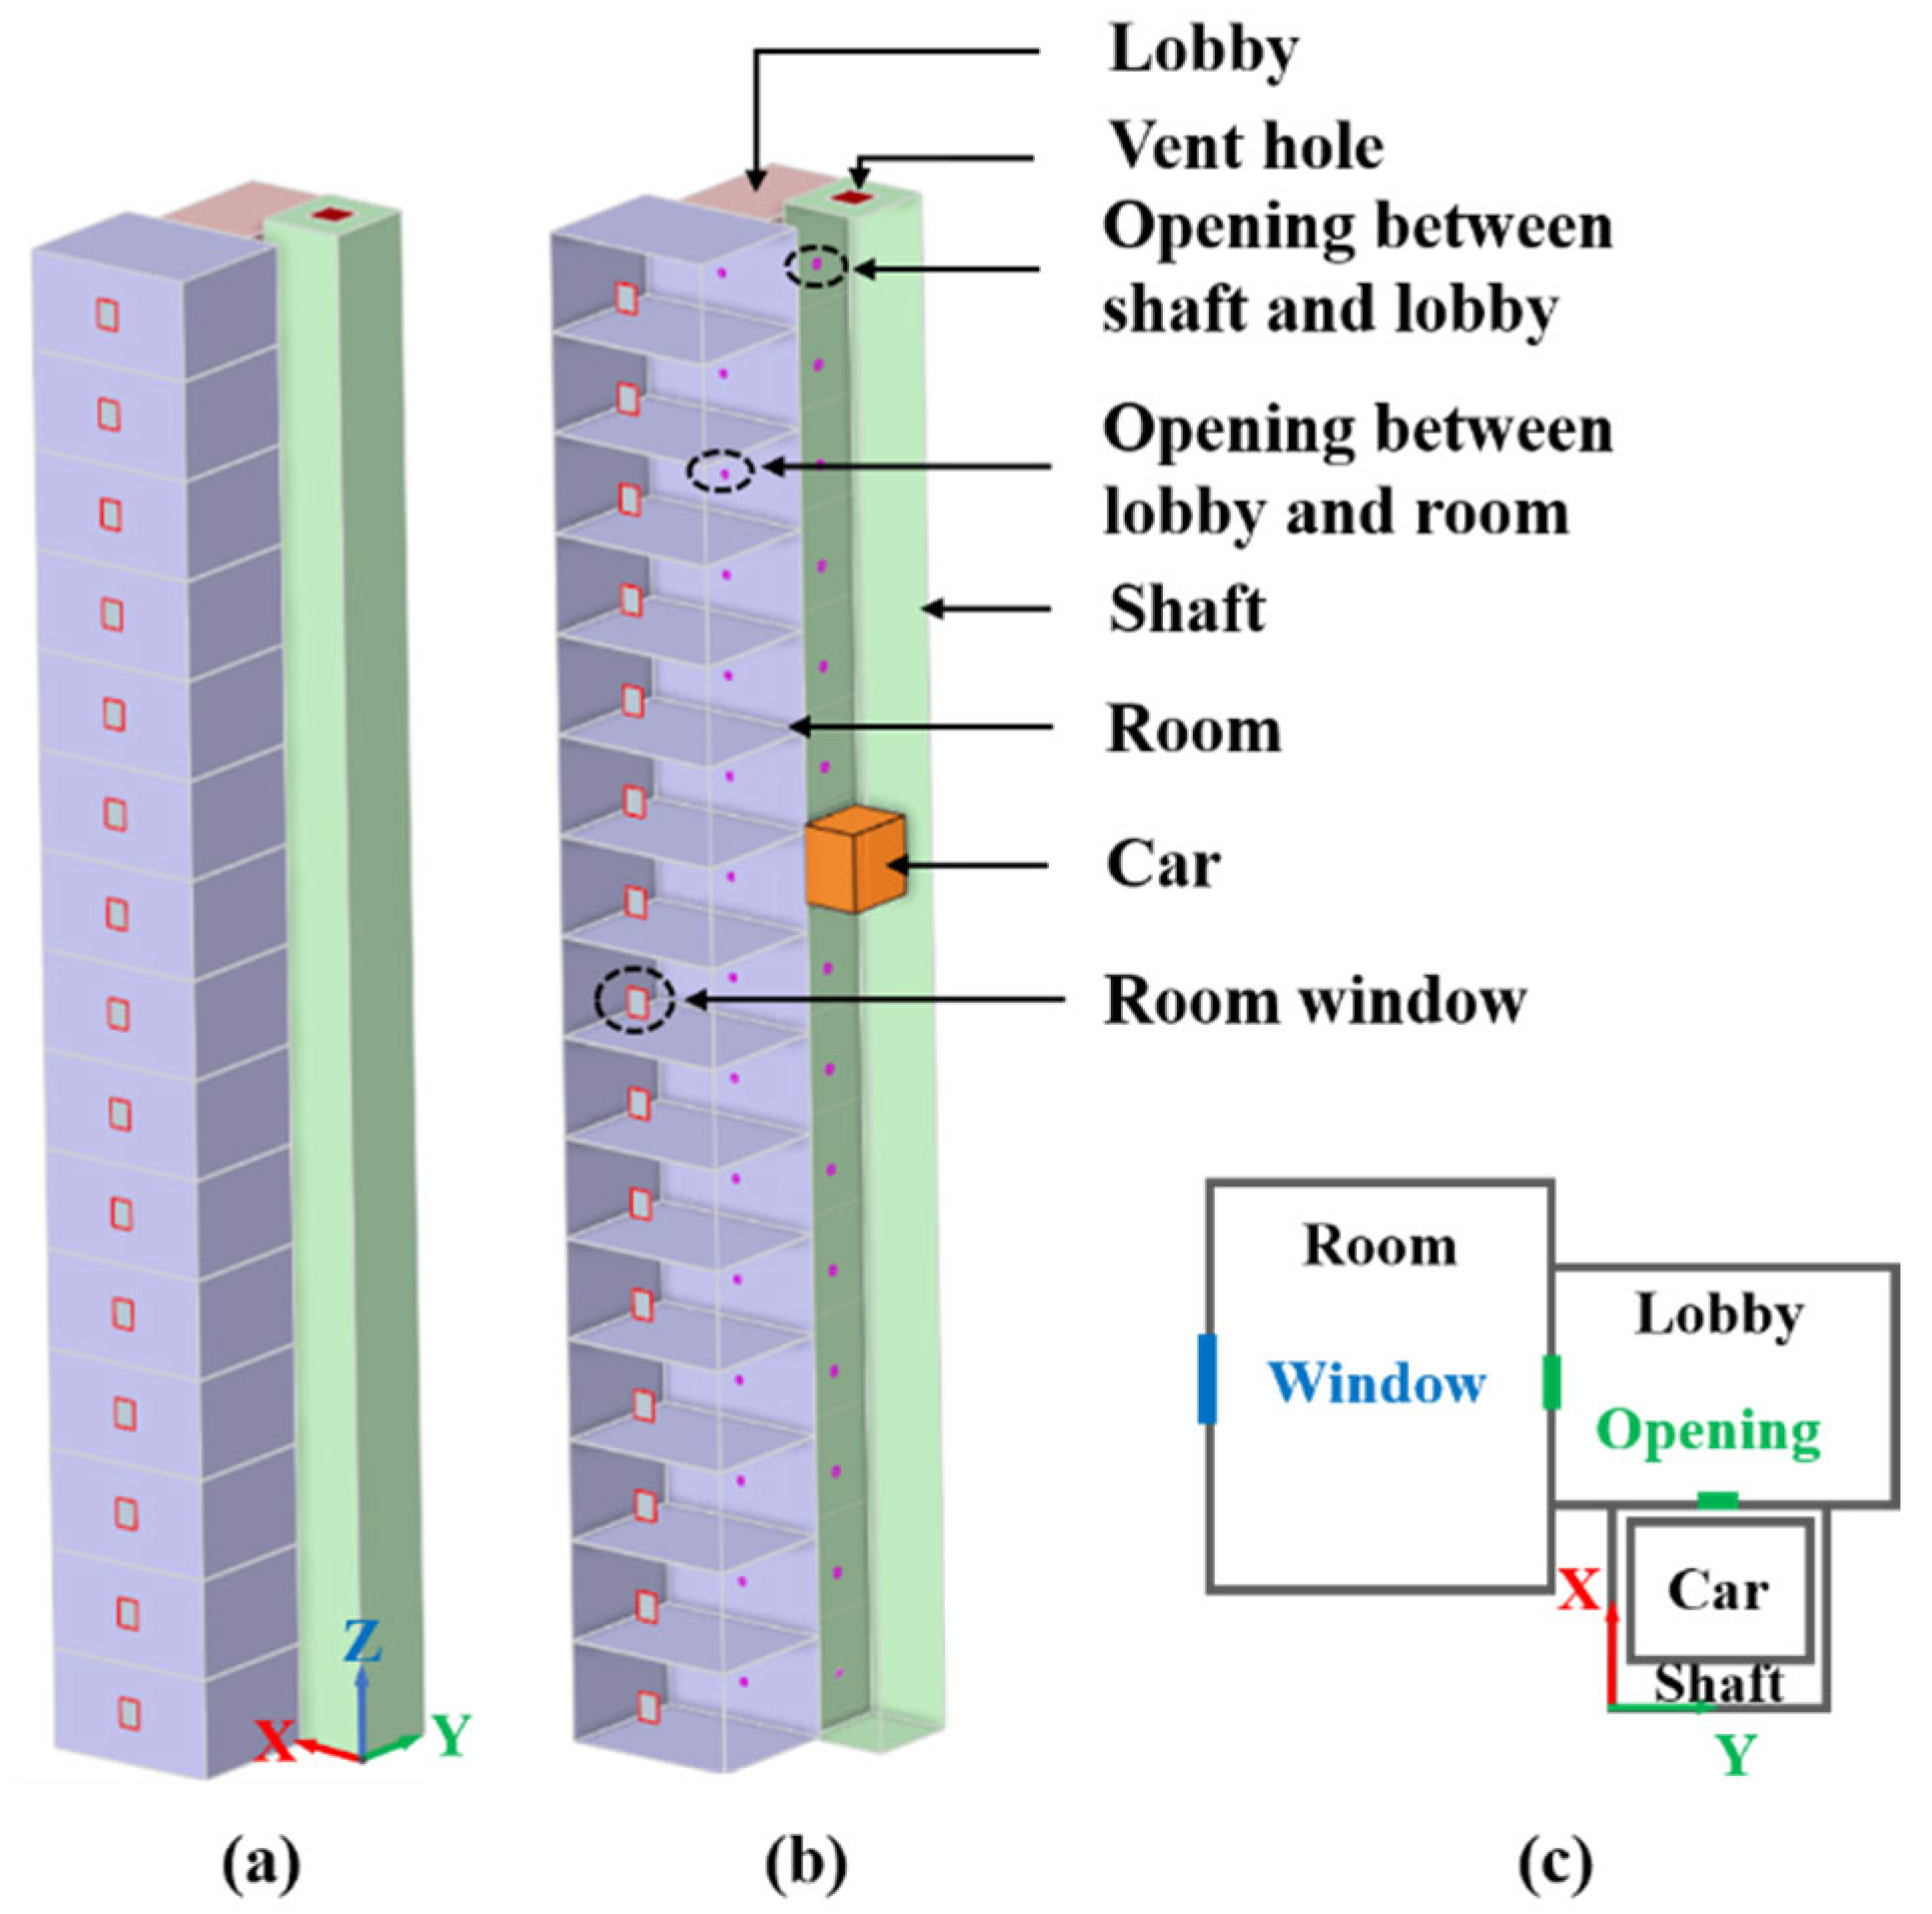
2.1. Geometric Model

This study investigated a simplified building with 15 floors, and the height of each floor was 2.7 m. Figure 1 shows schematics of the building, which included an elevator shaft, a lobby, and a room. No furnishing in both the lobby and the room was considered. We assumed the windows of the room were kept open. In the elevator shaft, only the elevator car was accounted for. There were clearances between the elevator and the lobby and between the lobby and the room. For simplification, all of the clearances were approximated into square openings located at the center of the interface but bearing the same area as the realistic situations. Such simplification has been widely adopted in previous studies [29,30,35,36]. The opening between the shaft and the lobby had an area of 0.04 m2, while the opening between the lobby and the room had an area of 0.0225 m2. Each room was connected to the outside via a window with an area of 0.45 m2. Moreover, there was a vent with 1 m2 at the top of the shaft. The dimensions of the elevator car (in orange) were 1.6 m long, 2.1 m wide, and 2.3 m high. Figure 1c presents the planar view of the building to further illustrate the relative positions of different parts. Table 1 summarizes the geometric parameters of each component in the building.

2.2. Case Design and Boundary Conditions

To investigate the impacts of the elevator car movement on the driven airflow and pollutant transmission across floors, a total of five cases considering different car movement scenarios were designed, as shown in Figure 2. Case 0 was a reference case in which the elevator car was omitted. The pollutant marked in purple was assumed to be emitted from the lobby on the first floor. The pollutant transmission in Case 0 was merely due to molecular diffusion.
Case 1 involved 2 stages, as shown in Figure 2b. In the 1st stage of Case 1, the elevator car moved upward from the 1st floor to the 15th floor at a speed of 1.5 m/s, and the total movement time was 25.2 s. The first stage was designed to study the impact of upward car motion on the driven airflow and pollutant transmission. In the 2nd stage, the car was parked on the 15th floor for 8 s, which was the typical time duration when the car stopped at the destination. The second stage was designed to explore the influence of car parking on both the flow and pollutant transmission.
In Case 2, the elevator car moved downward from the 15th floor to the 1st floor with the same movement speed of 1.5 m/s and parked for 8 s on the 1st floor. The total time duration in Case 2 was 33.2 s. This case was designed to study the resulting impacts of the downward car movement. Apparently, Case 2 addressed the aftermath of Case 1 and concerned the impacts of the downward movement of the elevator car.
In Case 3, the elevator car was assumed to start from the 1st floor from a stationary status and then moved to the 3rd floor and parking there. Case 4 resembled Case 3 but would park on the 8th floor. The two cases were designed to explore the impacts of the elevator parking on different floors on both the flow and pollutant transmission.
Table 2 summarizes the boundary conditions used in the CFD modeling. Air could flow in or out of the building through the windows and the vent hole, which were set as zero-pressure openings. The clearance openings on the protecting doors and the room doors were treated as internal openings that would allow for air passage. The isothermal airflow was solved so that the temperature-driven buoyancy flow was neglected. This investigation employed a tracer gas SF6 as a surrogate for aerosol particles, and the mass fraction of SF6 released to the lobby of the first floor was 0.5%.

2.3. Numerical Procedure

Transient pressure, airflow, and concentration distribution were solved. The CFD software ANSYS Fluent (version 2019) [39] was adopted to resolve the airflows. The RNG kε model, together with the standard wall functions [40], was adopted to model the turbulent flow considering its generally good performance [41]. The governing equations were solved by means of the finite volume method. The numerical method used the SIMPLE (semi-implicit method for pressure-linked equations) algorithm for coupling the velocity and continuity equations. The second-order upwind schemes were employed for discretizing the convection and viscous terms of the governing equations. The iterations were terminated when the relative residuals of all of the solution variables were less than 10−6.
The ICEM software (version 2019) was adopted to create the geometry and generate grid cells. Tetrahedral grid cells were generated to be compatible with the dynamic mesh simulation. The grid cell size was set to 0.3 m, and the cell size was refined to 0.1 m near the clearance openings of the protecting doors and room doors, windows, and the vent hole. The grid cell size was shifted at a growth rate of 1.2. The overall grid cell number was 1.015 million. To check the grid-independence, the finer grids with a total grid cell number of 3.09 million were also tested but did not obtain meaningful differences.
This investigation used the smoothing and dynamic re-meshing scheme in ANSYS Fluent to realize the elevator car movement. The spring-based smoothing method was adopted. The re-meshing sizing options were based on local cells and faces. The time step was set to 0.02 s to prevent negative volumes in the generated grid cells.
In this study, we utilized the CFD-Post software (version 2019) to extract the data for further analysis. The collected data were processed and visualized. Moreover, we used Python (version 3.6.2) to fit the data and generate graphs.

3. Results

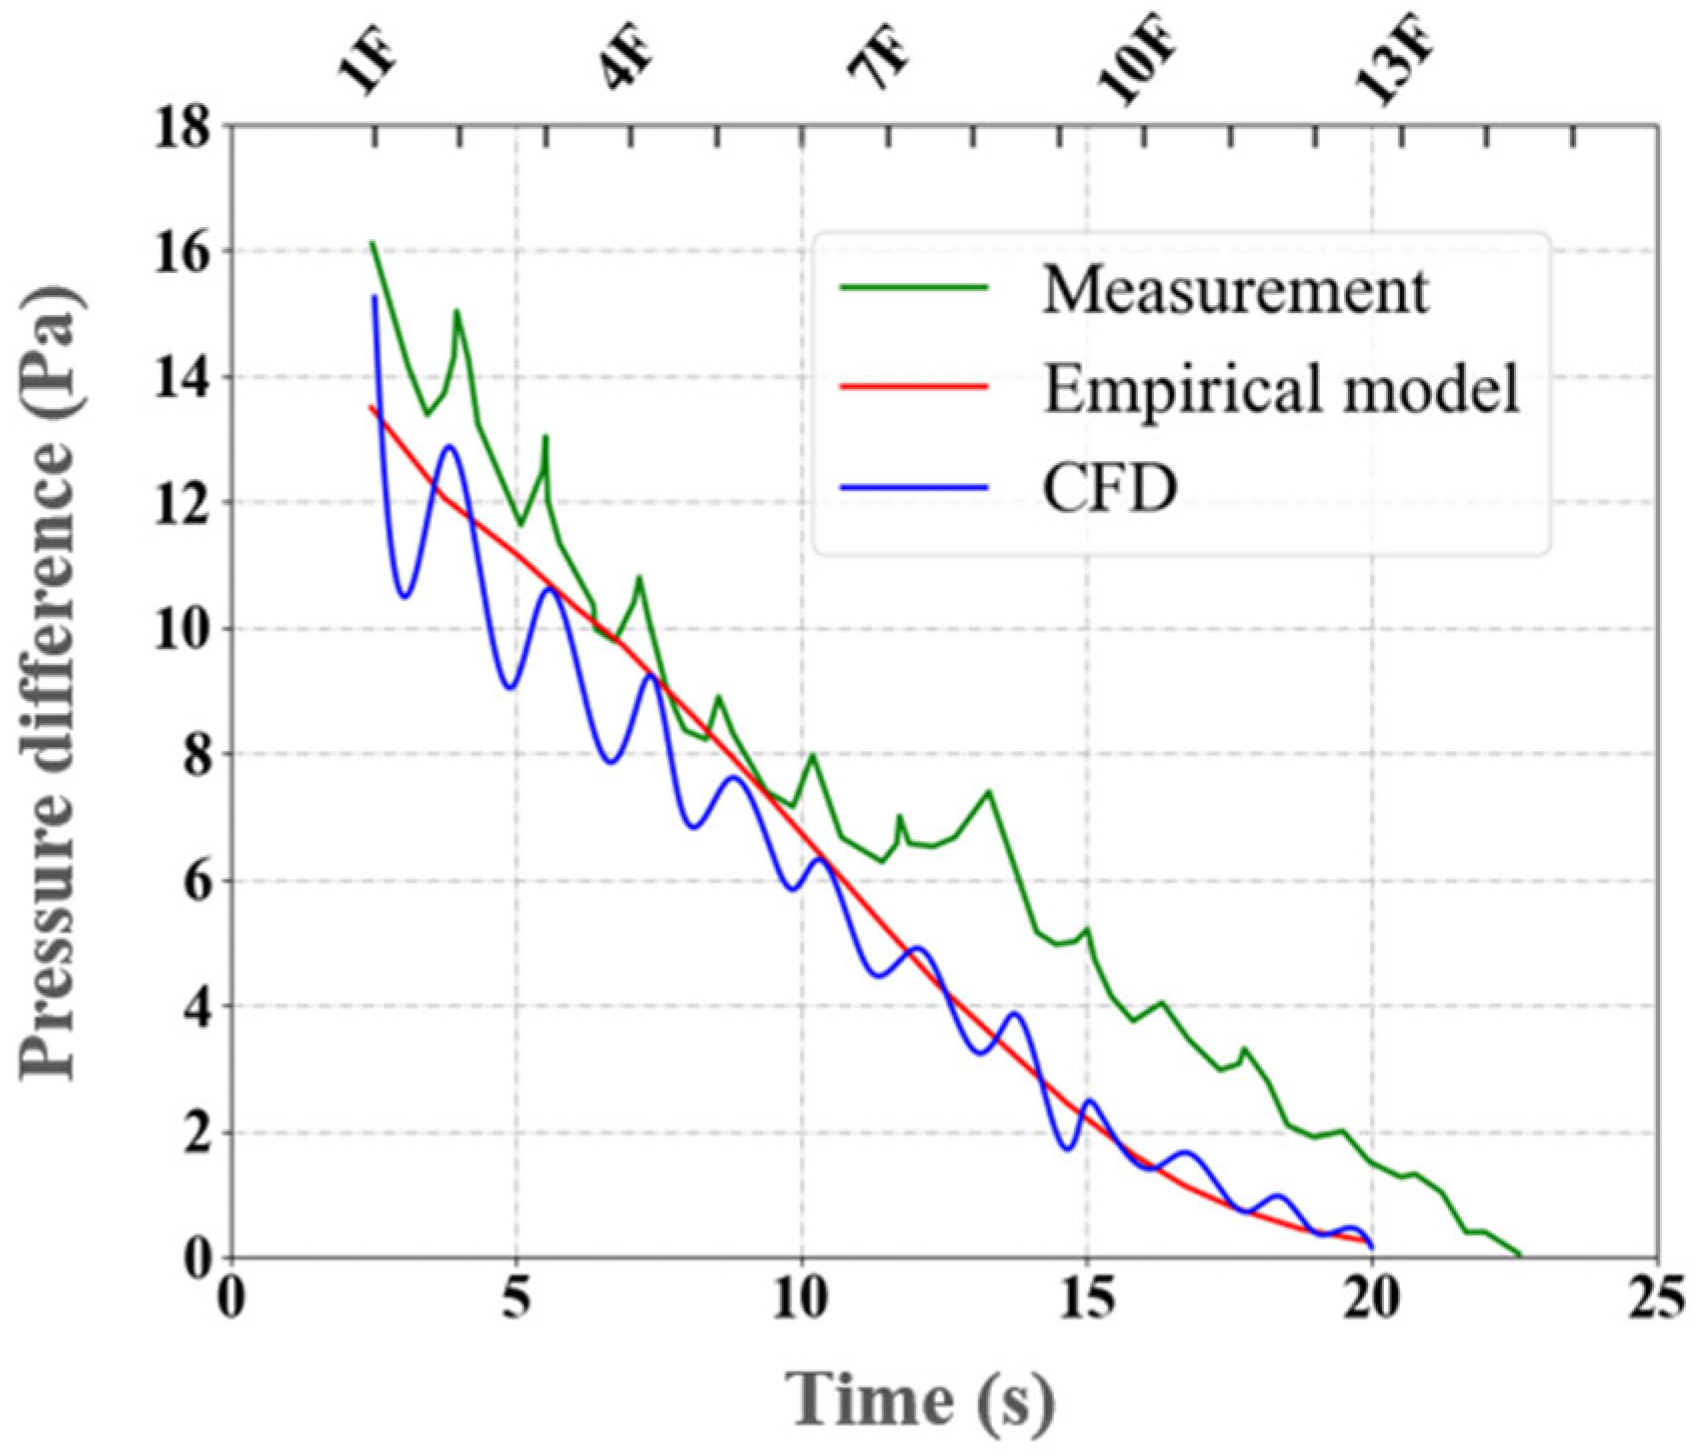
3.1. CFD Modeling Validation

This study validated the CFD modeling with the experimental data and empirical model from previous study [29]. Figure 3 illustrates the investigated hotel building located in Toronto, Canada, which contained an elevator, a lobby, and a room, which was similar to the model in this study but with different dimensions. Table 3 provides the geometric parameters of the building. The pressure difference between the central lobby and the central room on the 15th floor was measured. The elevator car was initially located on the 15th floor, and the car was moved down to the 1st floor at a speed of 1.73 m/s.
An empirical model [29] was derived for the pressure difference between the lobby and the room, in which the buoyancy, the wind, and the HVAC system were omitted. The pressure difference was calculated as [29]
P l i = ρ 2 A s V A e A l i N a C A e + C c A f 1 + ( N a N b ) 2 2
where ρ is the density of the air inside the shaft; A s is the cross-sectional area of the shaft; V is the speed of the elevator car; N a and N b are the floor numbers above and below the car, respectively; C is the flow coefficient related to the internal structure of the building; C c is the flow coefficient in the annular space around the car, which is 0.83 for a single elevator shaft; A f is the difference between the area of the shaft and the elevator car; A e is the equivalent area composed of the leakage area between the shaft and the lobby; A s l is the leakage area between the lobby and the internal structure of the building; and A l i is the leakage area between the internal and outside of the building.
In this study, a geometric model was created in CFD. The generated grid cell number was 0.71 million. All of the settings were similar to those described in the previous section. Figure 4 compares the results provided by the measurement, the empirical model as Equation (1), and the CFD modeling. The position of the elevator car was also plotted on the upper boundary of this figure. As the elevator car started and left away from the 15th floor, the pressure difference gradually decreased to zero. Both the empirical model and CFD underpredicted the pressure difference. There was no pressure fluctuation in the empirical model because the model could not consider the elevator car passing the clearance openings between the shaft and the lobbies on each floor. In general, both the empirical model and CFD provided pressures in agreement with each other. The measured maximum pressure difference was 16.1 Pa when the car started, while the empirical model calculated 13.5 Pa, and the CFD reported 15.25 Pa. The above revealed that the CFD modeling had obtained reasonably good results in agreement with both the measurement and the empirical model.

3.2. Reference Case (Case 0)

Figure 5 illustrates the concentration distribution of the pollutant in the middle of the shaft and lobbies over time in Case 0. Due to no car motion and no wind, the air inside the shaft and lobbies were nearly stationary. The pollutant was only spread by molecular diffusion. At t = 0.1 s, no pollutant was dispersed into the shaft. At t = 25.2 s, some of the pollutant was dispersed into the shaft. At t = 58.4 s, the SF6 inside the shaft dropped down slightly due to the heavier SF6 than the air. At t = 300 s, the SF6 inside the shaft was spread to the bottom shaft. The SF6 was spread over a little bit larger region, but still in the bottom shaft no higher than the 2nd floor within 10 min. This implied that the transmission of the airborne pollutant by means of molecular diffusion was quite slow. No pollutant was spread across floors within 10 min.

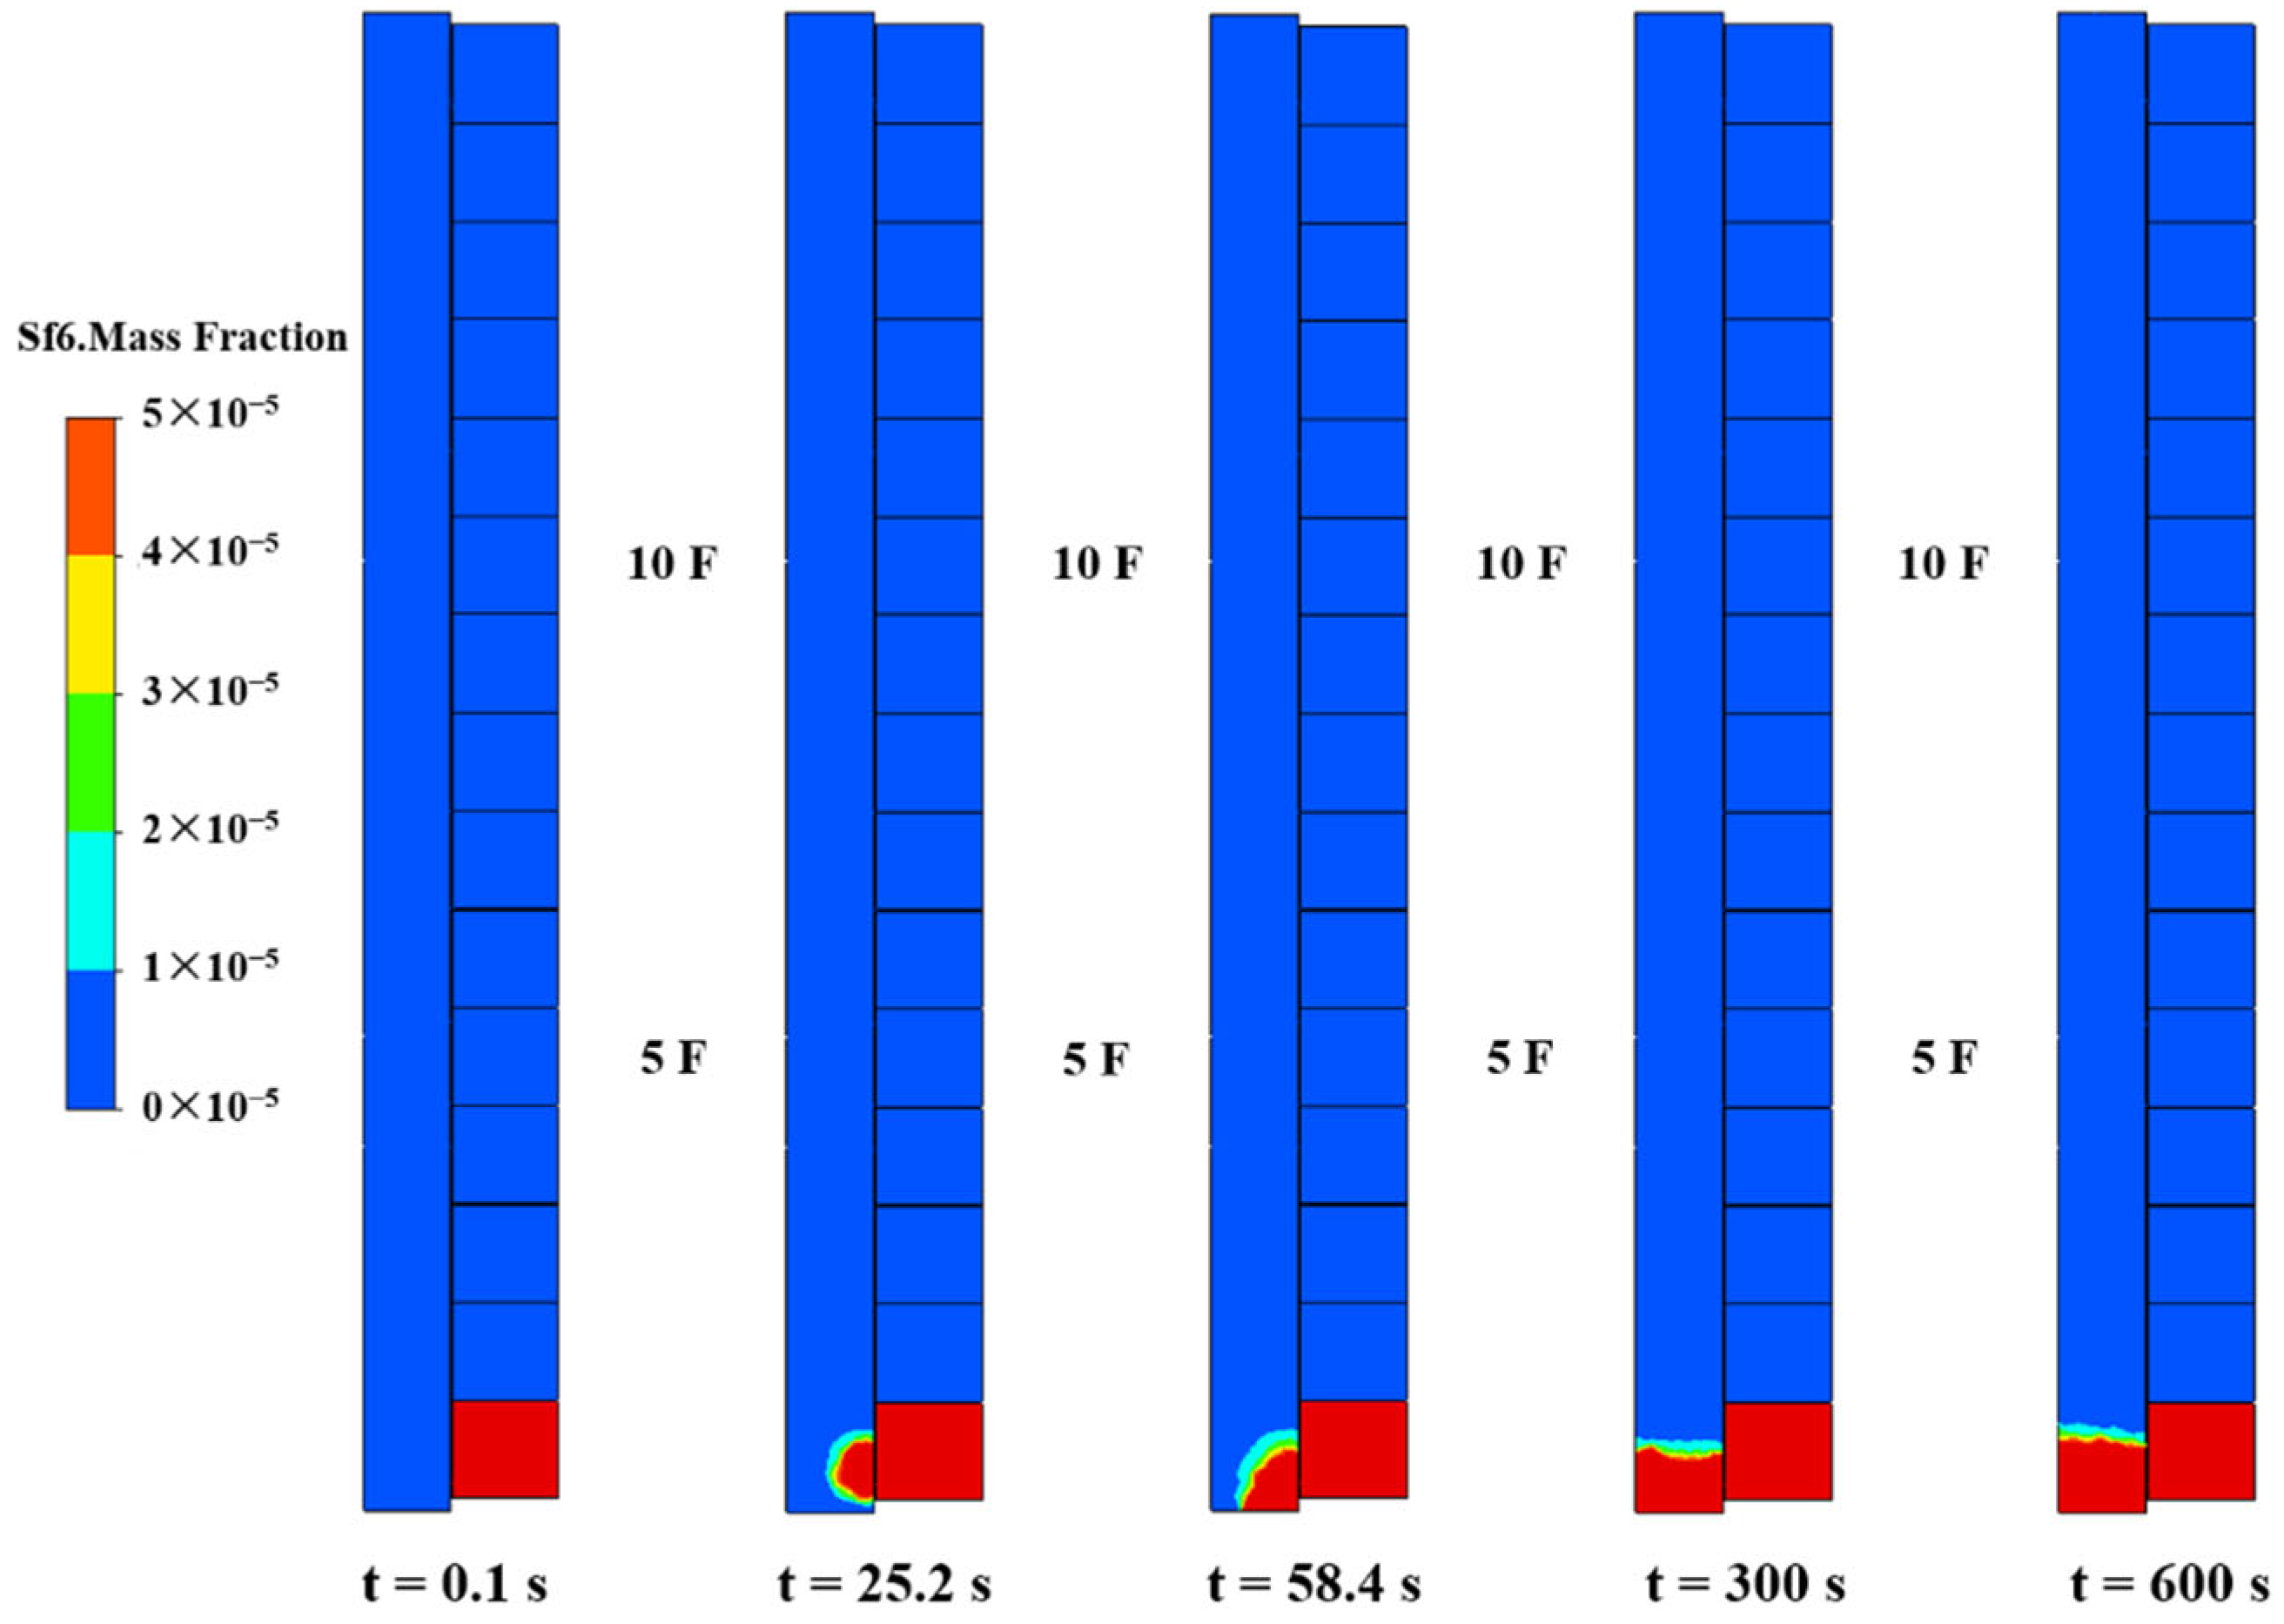
3.3. Impacts of the Elevator Car Upward Motion

Figure 6 displays the changes in pressure distribution when the car moved from the first floor to different floors in the first stage of Case 1. It can be seen that the air above the car was compressed, forming a positive pressure zone above, while a negative pressure zone was created below the car in the shaft. Because of the clearance openings between the shaft and the lobbies, the positive pressures or negative pressures in the lobbies of each floor were well correlated with the pressures in the shaft. Consequently, the pressures in the lobbies higher than the elevator car were positive, while the pressures in the lobbies lower than the car were negative. However, there were some pressure differences between the shaft and the lobbies on each floor, which caused air exchange between the shaft and the lobbies.
Figure 7 presents the velocity field in the middle section of the shaft and lobbies when the elevator car was just lifted upward and when the car reached the 5th floor, 10th floor, and 15th floor, respectively. As shown in Figure 7a, the air in the shaft moved upward towards the vent hole at the top due to the positive pressure. Some of the air was pressed out of the shaft into the lobbies on each floor. Below the elevator car, air circulation was formed in the shaft. The air in the region neighboring the lobbies went upward, while the air in the opposite region went downward. The air in the lobbies was sucked into the shaft due to the negative pressure inside the shaft below the elevator car. The air pressed out of the shaft, and the air sucked in could be viewed clearly in the enlarged sub-figures shown in Figure 7c. The air exchange between the shaft and the lobbies corresponded well with the presented pressure distribution shown in Figure 6.
Figure 8 depicts the distribution of the pollutant released from the lobby on the first floor. Accompanying the upward motion of the elevator car and the suction of the air into the shaft from the lobbies on each floor, the pollutant was transported upward and diluted inside the shaft. The pollutant concentration inside the shaft decreased with the height. The presented pollutant concentration distribution could be well explained by the presented airflow, as shown in Figure 7. There was no pollutant at all in the lobbies of each floor, which implied that the pollutant released below the elevator car would only be confined to the shaft and would not be spread to the lobbies when the elevator car moved upward.

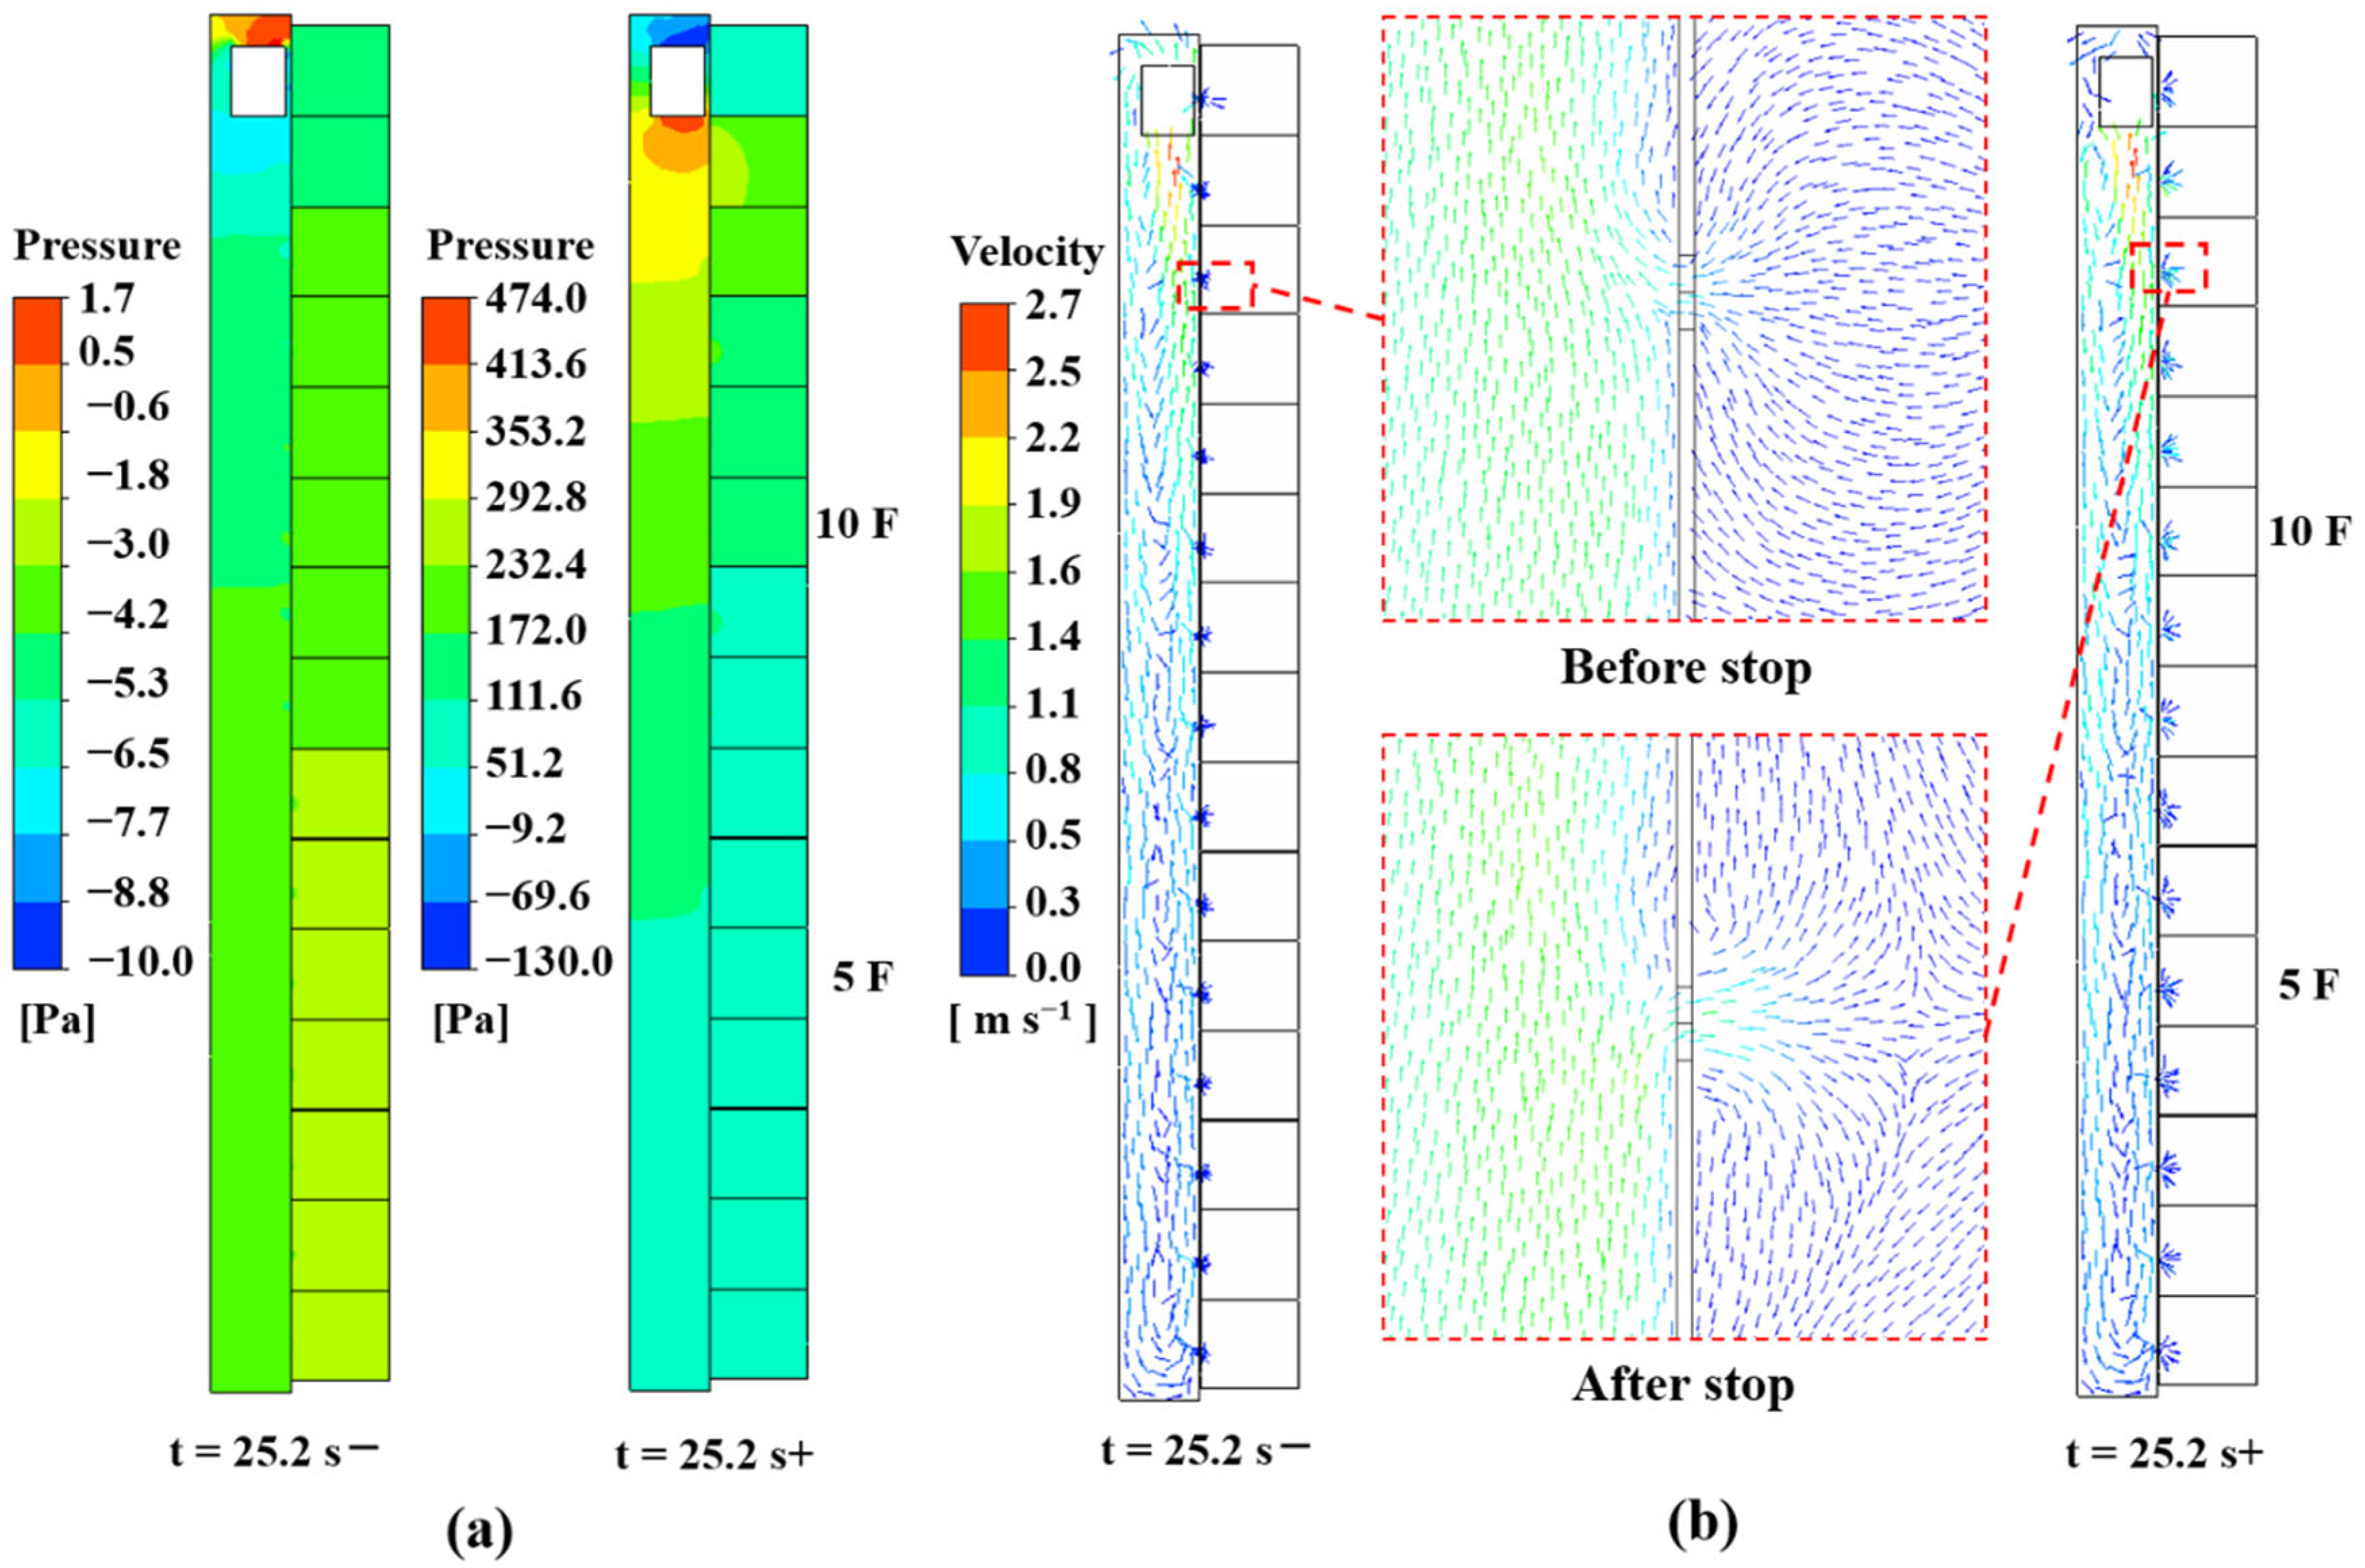
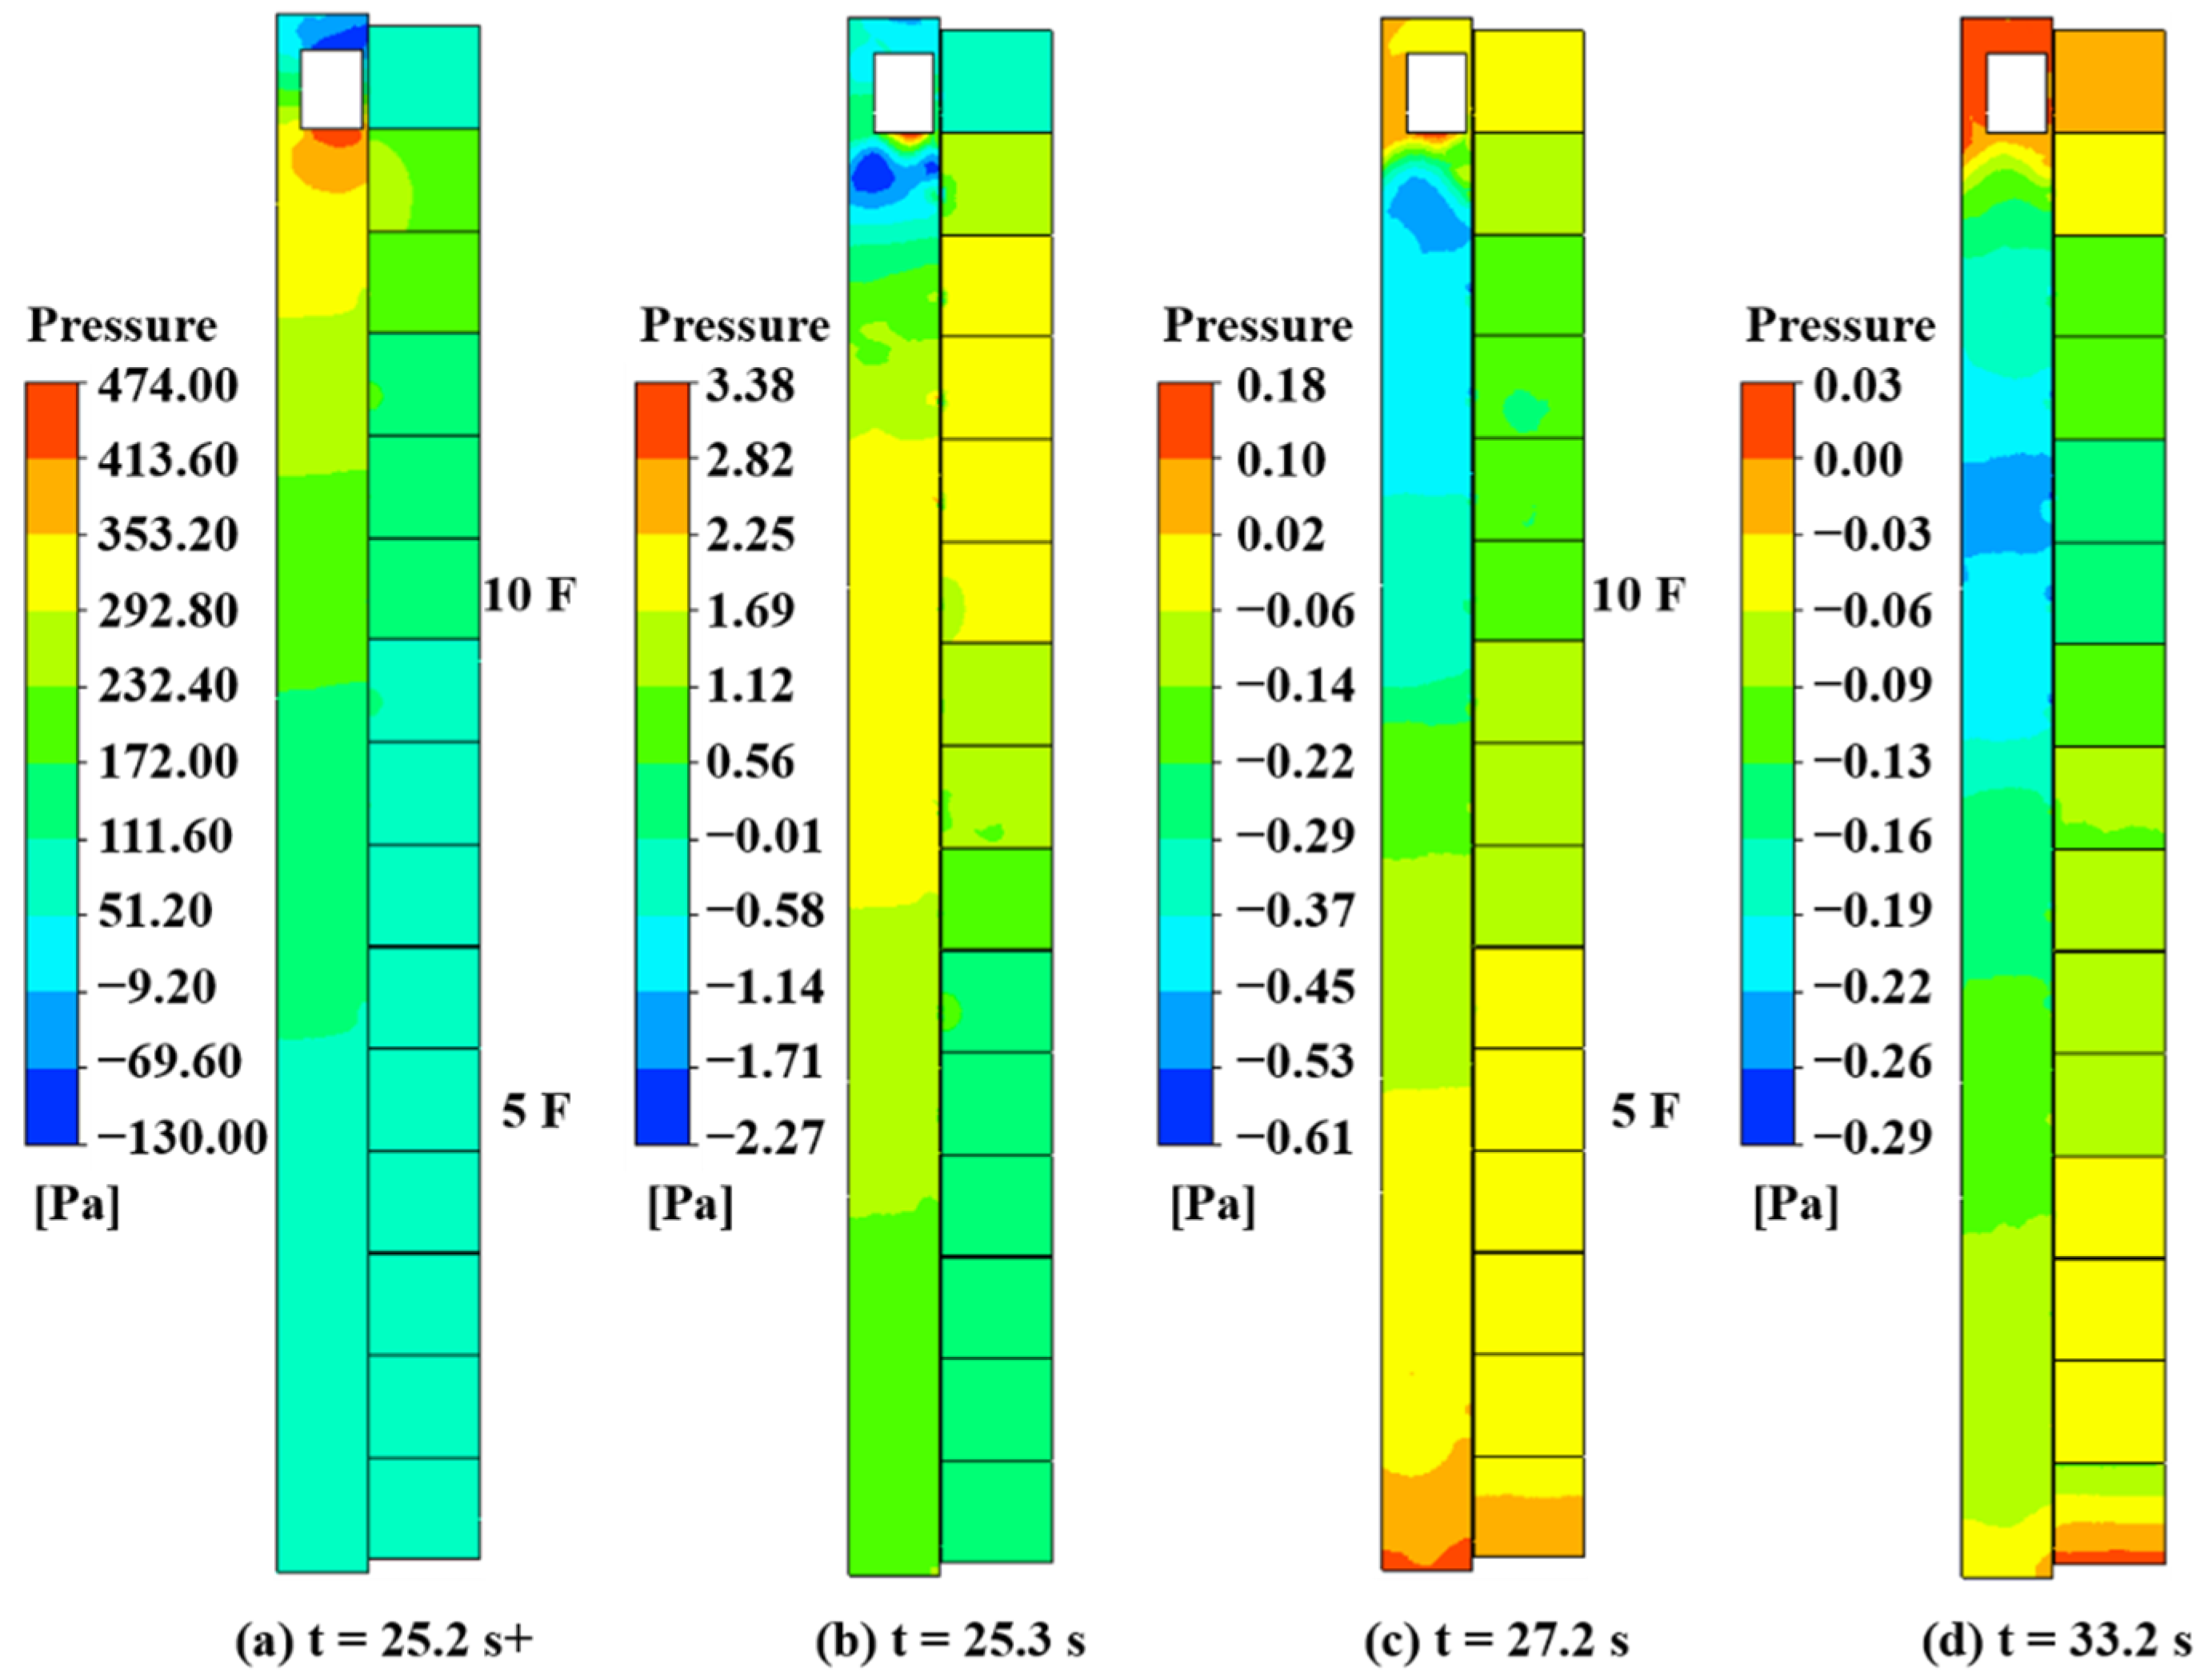
3.4. Impacts of the Elevator Car Parking

When the elevator car reached the destination floor, it stopped and parked for a while. Figure 9a shows the pressure distribution in the middle section just before and just after the elevator car stopped on the 15th floor in the second stage of Case 1. Before halting, negative pressure prevailed in the elevator shaft and lobbies beneath the elevator car. However, immediately after halting, the pressure above the elevator car became negative, while the pressure below the elevator car became positive, resulting in a change in the direction of airflow, as shown in Figure 9b. The stopping of the elevator car created a water hammer [37] and resulted in a very large positive pressure below the elevator car and a very low negative pressure above the car. The maximum positive pressure was approximately 474 Pa, and the minimum negative pressure was approximately −130 Pa. The sudden high pressure below the elevator car reversed the flow direction through the clearance openings between the shaft and the lobbies on each floor.
Figure 10 further illustrates the pressure distribution after parking the elevator car on the 15th floor. At t = 25.3 s, i.e., 0.1 s after parking the car, the pressures were greatly reduced as compared with those at t = 25.2 s+. The maximum positive pressure was 3.38 Pa right below the car at t = 25.3 s and a minimum negative pressure of −2.27 Pa in the shaft with a height corresponding to the 14th floor. At t = 27.2 s, i.e., 2 s after parking the car, the pressure difference inside the shaft was smaller than 0.8 Pa and smaller than 0.4 Pa at t = 33.2 s, i.e., 8 s after parking the car. The above implied that although the water hammer created a large pressure difference right after parking the elevator car, the large pressure difference lasted for a very short while.
Figure 11a shows the pollutant distribution at t = 27.2 s, i.e., 2 s after the parking of the elevator car on the 15th floor. Some of the pollutant was pressed into the lobbies of each floor. Because the concentration inside the shaft decreased with height, the amount of the pollutant pressed into each floor also decreased with height. Figure 11b,c present the pollutant distribution when the elevator car was parked on the 3rd and the 8th floor in Case 3 and Case 4, respectively. Similarly, the created water hammer also pressed the air from the shaft to the lobbies beneath the elevator car, which carried the pollutant from the lobby of the first floor to the lobbies of the remaining floors.

3.5. Impacts of the Elevator Car Downward Motion

Figure 12 illustrates the pressure distribution in the middle section when the elevator car moved downward from the 15th floor to the 1st floor in Case 2. The pressure in the region below the elevator car was positive, while the pressure above the car was negative. The maximum positive pressure was in the small region just below the elevator car. The positive pressure decreased with the height, and the pressure inside the shaft was higher than that in the lobbies of each floor below the elevator car. The negative pressure above the elevator car also increased with the height. The pressures in the lobbies were higher than those inside the shaft above the elevator car.
Figure 13 presents the velocity distributions when the elevator car moved downward from the 15th floor to the 1st floor. Inside the shaft, evident flow circulations were formed in both the region below and above the elevator car. Due to negative pressure inside the shaft above the elevator car, some of the air was sucked into the shaft from the lobbies on floors above the elevator car. The flow in the region close to the lobbies in the shaft went downward with the car’s downward motion, while the flow in the region opposite to the lobbies went upward, which formed the clockwise circulated flow inside the shaft based on Figure 13. The flow in the region opposite to the lobbies in the shaft below the elevator car went downward due to the compression of the air, while the flow in the region neighboring the lobbies went upward. Some of the air was pressed into the lobbies from the shaft. The general counterclockwise flow circulation below the elevator car was formed based on Figure 13.
Figure 14 illustrates the distributions of the pollutant when the elevator car moved downward from the 15th floor to the 1st floor. Due to the formed positive pressure inside the shaft below the elevator car, some of the pollutant that was lifted to the shaft when the car moved upward was pressed out of the shaft to the lobbies on each floor. At t = 33.3 s, the highest concentration in the lobbies, excluding the first floor, was on the second floor. With the flow circulated inside the shaft, as shown in Figure 13, the pollutant in the bottom part of the shaft was diluted, which also diluted the pollutant concentration in the lobby of the second floor, as shown at t = 42.3 s. When the elevator car reached the fifth floor, the peak concentration inside the shaft was concentrated to the region two floors beneath the elevator car. The pollutant in the shaft was much diluted by the sucked air into the shaft from the lobbies on each floor at t = 58.4 s.
The above results clearly showed that due to the intermittent pressing of the air from the shaft to the lobbies and suction of the air from the lobbies into the shaft, the air exchange between the shaft and lobbies on each floor could have resulted from the accompanying elevator car motion. Consequently, pollutant transmission across the floors was formed.

3.6. Exchange Airflow Rate through the Protecting Door’s Clearance Opening

Figure 15 presents variation in the airflow rates at the protecting door’s clearance opening on two representative floors. The elevator car moved from the 1st floor to the 15th floor and then was parked on the 15th floor for 8 s, which corresponds to Case 1. After that, the elevator car moved downward from the 15th floor to the 1st floor and was parked on the 1st floor for another 8 s, which corresponds to Case 2. The position of the elevator car was also plotted on the upper boundary of each subfigure. A positive airflow rate represents the flow from the shaft to the lobbies, while a negative airflow rate for the flow from the lobbies to the shaft.
As shown in Figure 15a, when the elevator car moved from the first floor from t = 0 to t = 1.0 s, the clearance opening on the second floor was above the elevator car, which resulted in positive flow from the shaft to the lobby. Once the car passed the protecting door’s opening, the airflow rate was reduced sharply from a positive flow rate to a negative one. The airflow rate swung with time due to the intermittent passing of the door’s opening on each floor, which generated pressure fluctuations in the shaft. The airflow rate was suddenly increased to a positive value due to the created water hammer in the shaft at t = 25.2 s when the car was parked on the 15th floor. After that, the airflow decreased gradually to a slightly negative value. At t = 33.2 s, the elevator car started to move downward, and the created positive pressure in the shaft pressed the air from the shaft to the lobbies. The airflow rate was relatively stable until t = 56.6 s, though some fluctuations in the airflow rates existed. When the car passed the protecting door’s clearance opening on the second floor, the airflow rate decreased from a positive value to a negative one. Once the elevator car was parked on the first floor at t = 58.4 s, the water hammer was created again. The water hammer generated a sudden positive pressure in the shaft region above the elevator car, which pressed the air from the shaft into the lobby of the second floor. Then the airflow rate decreased to a negative value. After that, the airflow rate gradually increased and approached zero.
Figure 15b presents the variation in the airflow rate at the protecting door’s clearance opening on the seventh floor. The airflow rates with fluctuations corresponded to a stage with the motion of the elevator car. A positive airflow rate occurred when the elevator car was below the seventh floor, and the car moved upward, or when the elevator was above the seventh floor, but the car moved downward, and vice versa for the negative airflow rates. The sudden changes in the airflow rates were due to the elevator car passing the protecting door’s opening on the seventh floor or because of the generated water hammers. The impact of the water hammer on the airflow rates was quite minimal eight seconds later since the parking of the elevator car.
The above implied that the motion of the elevator car pressed the air from the shaft to the lobbies or sucked the air from the lobbies to the shaft, subjected to the created pressure in the shaft. The airflow rates swung with time due to the fluctuating pressure in the shaft when the elevator car intermittently passed the clearance opening on the protecting door on each floor. The sudden changes in the airflow rates could be due to the elevator car passing by the protecting door’s opening on the concerned floor or the generated water hammer when the elevator car was parked on a specific floor.

4. Discussion

In this study, the clearances of the elevator’s protecting doors were simplified into a square opening with the same area. Such a simplification has been widely adopted in previous studies [29,30,35,36], though it may be different from reality. However, such a simplification would not alter the direction of the exchanged airflow between the shaft and the lobby. The aim of this investigation was to study the elevator-car-induced airflow exchange and the resulting cross-floor transport of airborne pollutants. Hence, the simplification made this study easier and should be acceptable.
This study did not consider temperature differences between indoor and outdoor environments, resulting in a negligible chimney effect. However, when the temperature difference is large, the chimney effect may allow more pollutant exchange between the shaft and the lobbies [19]. The resulting airflow exchange may be more severe when the elevator car motion is accompanied by a strong chimney effect, though the above awaits a further, more in-depth investigation.
There are various potential ways for the transmission of respiratory infectious diseases caused by passengers riding in elevators. For example, healthy passengers may ride in the same elevator as infected passengers [17], healthy passengers may inhale residual viral aerosols in the elevator car, and elevator movement may cause viral aerosols to spread to other floors. This study focused only on the exposure risk of viral aerosols spreading through the shaft to other floors due to elevator car movement and did not consider the viral load of infected patients riding the elevator. In future studies, more potential transmission modes can be simulated and compared for their relative importance.

5. Conclusions

This study adopted CFD to investigate the dynamic air exchange between the shaft and the lobby on each floor of a typical 15-story building accompanied by the motion of the elevator car. The transmission of a tracer gas pollutant continuously released in the lobby of the first floor was adopted as an example to illustrate cross-floor pollutant transport. Based on the obtained results, the following conclusions can be drawn:
(1) Motion of the elevator car created positive pressure in the approaching region of the shaft, which pressed the air from the shaft to the lobbies of the corresponding floors. The elevator car created negative pressure in the leaving region of the shaft, which sucked the air from the lobbies to the shaft. The intermittent air exchange caused airborne pollutant transmission across the floors.
(2) The airflow rates through the protecting door’s clearance opening swung with time due to the fluctuating pressure in the shaft when the elevator car intermittently passed by the clearance opening on each floor. The sudden changes in the airflow rates could be due to the elevator car passing by the protecting door’s opening on the concerned floor or the generated water hammer when the elevator car was parked on a specific floor. However, the water hammer effect lasted only for a short while.
(3) To minimize the transmission of airborne pollutants across floors, the pressures inside the shaft must be better controlled, and the clearance of the elevator’s protecting doors could be further minimized.

Author Contributions

Conceptualization, T.Z.; methodology, T.Z. and S.L.; software, G.W.; validation, G.W.; investigation, G.W.; writing—original draft preparation, G.W.; writing—review and editing, T.Z. and S.L.; visualization, G.W.; project administration, T.Z. All authors have read and agreed to the published version of the manuscript.

Funding

This study was partially supported by the National Natural Science Foundation of China (NSFC) through Grant No. 52108084.

Institutional Review Board Statement

Not applicable.

Informed Consent Statement

Not applicable.

Data Availability Statement

Not applicable.

Conflicts of Interest

The authors declare that they have no known competing financial interests or personal relationships that could have appeared to influence the work reported in this paper.

References

  1. Stadler, K.; Masignani, V.; Eickmann, M.; Becker, S.; Abrignani, S.; Klenk, H.-D.; Rappuoli, R. SARS—Beginning to understand a new virus. Nat. Rev. Microbiol. 2003, 1, 209–218. [Google Scholar] [CrossRef]
  2. Rewar, S.; Mirdha, D.; Rewar, P. Treatment and prevention of pandemic H1N1 influenza. Ann. Glob. Health 2015, 81, 645–653. [Google Scholar] [CrossRef]
  3. Mackay, I.M.; Arden, K.E. MERS coronavirus: Diagnostics, epidemiology and transmission. Virol. J. 2015, 12, 1–21. [Google Scholar] [CrossRef] [Green Version]
  4. Shi, Y.; Wang, G.; Cai, X.-p.; Deng, J.-w.; Zheng, L.; Zhu, H.-h.; Zheng, M.; Yang, B.; Chen, Z. An overview of COVID-19. J. Zhejiang Univ. Sci. B 2020, 21, 343–360. [Google Scholar] [CrossRef] [PubMed]
  5. Anderson, E.L.; Turnham, P.; Griffin, J.R.; Clarke, C.C. Consideration of the Aerosol Transmission for COVID-19 and Public Health. Risk Anal. 2020, 40, 902–907. [Google Scholar] [CrossRef] [PubMed]
  6. Morawska, L. Droplet fate in indoor environments, or can we prevent the spread of infection? Indoor Air 2006, 16, 335–347. [Google Scholar] [CrossRef] [PubMed] [Green Version]
  7. Nicas, M.; Nazaroff, W.W.; Hubbard, A. Toward understanding the risk of secondary airborne infection: Emission of respirable pathogens. J. Occup. Environ. Hyg. 2005, 2, 143–154. [Google Scholar] [CrossRef] [PubMed]
  8. Lindsley, W.G.; Blachere, F.M.; Thewlis, R.E.; Vishnu, A.; Davis, K.A.; Cao, G.; Palmer, J.E.; Clark, K.E.; Fisher, M.A.; Khakoo, R.; et al. Measurements of airborne influenza virus in aerosol particles from human coughs. PLoS ONE 2010, 5, e15100. [Google Scholar] [CrossRef] [PubMed]
  9. Cai, J.; Sun, W.; Huang, J.; Gamber, M.; Wu, J.; He, G. Indirect virus transmission in cluster of COVID-19 cases, Wenzhou, China, 2020. Emerging Infect. Dis. 2020, 26, 1343. [Google Scholar] [CrossRef]
  10. Lin, K.; Marr, L.C. Humidity-Dependent Decay of Viruses, but Not Bacteria, in Aerosols and Droplets Follows Disinfection Kinetics. Environ. Sci. Technol. 2020, 54, 1024–1032. [Google Scholar] [CrossRef]
  11. Pyankov, O.V.; Bodnev, S.A.; Pyankova, O.G.; Agranovski, I.E. Survival of aerosolized coronavirus in the ambient air. J. Aerosol Sci. 2018, 115, 158–163. [Google Scholar] [CrossRef]
  12. Nhu Nguyen, T.M.; Ilef, D.; Jarraud, S.; Rouil, L.; Campese, C.; Che, D.; Haeghebaert, S.; Ganiayre, F.; Marcel, F.; Etienne, J. A community-wide outbreak of legionnaires disease linked to industrial cooling towers—How far can contaminated aerosols spread? J. Infect. Dis. 2006, 193, 102–111. [Google Scholar] [CrossRef] [PubMed] [Green Version]
  13. Han, T.; Park, H.; Jeong, Y.; Lee, J.; Shon, E.; Park, M.S.; Sung, M. COVID-19 Cluster Linked to Aerosol Transmission of SARS-CoV-2 via Floor Drains. J. Infect. Dis. 2022, 225, 1554–1560. [Google Scholar] [CrossRef]
  14. Wang, Q.; Li, Y.; Lung, D.C.; Chan, P.T.; Dung, C.H.; Jia, W.; Miao, T.; Huang, J.; Chen, W.; Wang, Z.; et al. Aerosol transmission of SARS-CoV-2 due to the chimney effect in two high-rise housing drainage stacks. J. Hazard. Mater. 2022, 421, 126799. [Google Scholar] [CrossRef] [PubMed]
  15. Lyu, K.; Feng, S.; Li, X.; Wang, Q.; Zhao, X.; Yu, S.; Zheng, P.; Ji, J.; Chen, G.; Liang, J. SARS-CoV-2 Aerosol Transmission through Vertical Sanitary Drains in High-Rise Buildings—Shenzhen, Guangdong Province, China, March 2022. China CDC Wkly. 2022, 4, 489–493. [Google Scholar] [PubMed]
  16. Hwang, S.E.; Chang, J.H.; Oh, B.; Heo, J. Possible aerosol transmission of COVID-19 associated with an outbreak in an apartment in Seoul, South Korea, 2020. Int. J. Infect. Dis. 2021, 104, 73–76. [Google Scholar] [CrossRef]
  17. Liu, S.; Deng, Z. Transmission and infection risk of COVID-19 when people coughing in an elevator. Build. Environ. 2023, 238, 110343. [Google Scholar] [CrossRef]
  18. Black, W. Smoke movement in elevator shafts during a high-rise structural fire. Fire Saf. J. 2009, 44, 168–182. [Google Scholar] [CrossRef]
  19. Lee, B.H.; Yee, S.W.; Kang, D.H.; Yeo, M.S.; Kim, K.W. Multi-zone simulation of outdoor particle penetration and transport in a multi-story building. Build. Simul. 2017, 10, 525–534. [Google Scholar] [CrossRef]
  20. Tamura, G.; Wilson, A. Building pressures caused by chimney action and mechanical ventilation. ASHRAE Trans. 1967, 73, 1–12. [Google Scholar]
  21. Wong, N.H.; Heryanto, S. The study of active stack effect to enhance natural ventilation using wind tunnel and computational fluid dynamics (CFD) simulations. Energy Build. 2004, 36, 668–678. [Google Scholar] [CrossRef]
  22. Yang, J.; Yang, Y.; Chen, Y. Numerical simulation of smoke movement influence to evacuation in a high-rise residential building fire. Procedia Eng. 2012, 45, 727–734. [Google Scholar] [CrossRef] [Green Version]
  23. Su, C.; Bai, J. Measurement of the neutral plane of an internal fire whirl using the background-oriented Schlieren technique for a vertical shaft model of a high-rise building. Measurement 2016, 78, 151–167. [Google Scholar] [CrossRef]
  24. Gao, Y.-J.; Li, Z.-s.; Luo, Y.-y.; Guo, H.-w. Experimental study on smoke characteristics of tunnel fire under effects of longitudinal ventilation and vertical shaft natural smoke exhaust. Fire Sci. Technol. 2022, 41, 185–190. [Google Scholar]
  25. Tamm, G.; Jaluria, Y. Flow of hot gases in vertical shafts with natural and forced ventilation. Int. J. Heat Mass Transf. 2017, 114, 337–353. [Google Scholar] [CrossRef]
  26. Black, W.Z. Computer modeling of stairwell pressurization to control smoke movement during a high-rise fire. ASHRAE Trans. 2011, 117, 786. [Google Scholar]
  27. Miller, R.S. Elevator shaft pressurization for smoke control in tall buildings: The Seattle approach. Build. Environ. 2011, 46, 2247–2254. [Google Scholar] [CrossRef]
  28. Song, D.; Lim, H.; Lee, J.; Seo, J. Application of the mechanical ventilation in elevator shaft space to mitigate stack effect under operation stage in high-rise buildings. Indoor Built Environ. 2014, 23, 81–91. [Google Scholar] [CrossRef]
  29. Klote, J.H.; Tamura, G. Elevator piston effect and the smoke problem. Fire Saf. J. 1986, 11, 227–233. [Google Scholar] [CrossRef]
  30. Klote, J.H. An Analysis of the Influence of Piston Effect on Elevator Smoke Control; Center for Fire Research: Berkeley, CA, USA, 1988. [Google Scholar]
  31. Chen, Y.; Yang, L.; Fu, Z.; Chen, L.; Chen, J. Gas flow behavior and flow transition in elevator shafts considering elevator motion during a building fire. Build. Simul. 2018, 11, 765–771. [Google Scholar] [CrossRef]
  32. Strakosch, G.R. Vertical Transportation: Elevators and Escalators; Wiley: Hoboken, NJ, USA, 1983. [Google Scholar]
  33. Qiao, S.; Zhang, R.; He, Q.; Zhang, L. Theoretical modeling and sensitivity analysis of the car-induced unsteady airflow in super high-speed elevator. J. Wind Eng. Ind. Aerodyn. 2019, 188, 280–293. [Google Scholar] [CrossRef]
  34. Joung, S.; Oh, W. Analyzing Piston Effect via Superposition Principle and Controlling Pressure Difference. Fire Sci. Eng. 2022, 36, 35–42. [Google Scholar] [CrossRef]
  35. Zhu, Y.; Zhao, Y. Numerical simulation of the smoke movement in the high-rise building elevator shaft and the lobby impacted by the elevator piston effect. Build. Sci. 2011, 27, 20–23. [Google Scholar]
  36. Park, Y.; Na, J.; Sung, K.H.; Ryou, H.S. Numerical study on the effect of elevator movement on pressure difference between vestibule and living room in high-rise buildings. Build. Simul. 2019, 12, 313–321. [Google Scholar] [CrossRef]
  37. Ghidaoui, M.S.; Zhao, M.; McInnis, D.A.; Axworthy, D.H. A review of water hammer theory and practice. Appl. Mech. Rev. 2005, 58, 49–76. [Google Scholar] [CrossRef] [Green Version]
  38. Kim, J.; Kim, K. Experimental and numerical analyses of train-induced unsteady tunnel flow in subway. Tunn. Undergr. Space Technol. 2007, 22, 166–172. [Google Scholar] [CrossRef]
  39. Fluent, A. 19.0. User’s and Theory Guide; ANSYS, Inc.: Canonsburg, PA, USA, 2018. [Google Scholar]
  40. Shih, T.-H.; Liou, W.W.; Shabbir, A.; Yang, Z.; Zhu, J. A new k-ε eddy viscosity model for high reynolds number turbulent flows. Comput. Fluids 1995, 24, 227–238. [Google Scholar] [CrossRef]
  41. Chen, Q. Comparison of different k-ε models for indoor air flow computations. Numer. Heat Transf. Part B Fundam. 1995, 28, 353–369. [Google Scholar] [CrossRef]
Figure 1. Geometric model of a building chosen for study: (a) outer appearance; (b) perspective view; (c) planar view.
Applsci 13 07400 g001
Figure 2. Schematics of the 5 studied cases (purple virus: pollutant source; orange rectangle: elevator car; P: car parking floor; green arrow: car movement direction): (a) Case 0; (b) Case 1; (c) Case 2; (d) Case 3; (e) Case 4.
Applsci 13 07400 g002
Figure 3. Illustration of the building model used for model validation [29]: (a) planar view; (b) sectional view and the schematic of the elevator car from the 15th floor to the 1st floor.
Applsci 13 07400 g003
Figure 4. Comparison of the pressure difference provided from the measurement, the empirical model, and the CFD modeling.
Applsci 13 07400 g004
Figure 5. SF6 concentration distribution at different times in Case 0, in which the elevator car was omitted.
Applsci 13 07400 g005
Figure 6. Pressure distribution at different times when the elevator car moved upward, i.e., in the 1st stage of Case 1: (a) at t = 0.1 s when the car was on the 1st floor; (b) at t = 7.3 s when the car was on the 5th floor; (c) at t = 16.2 s when the car was on the 10th floor; (d) at t = 25.2 s when the car was on the 15th floor.
Applsci 13 07400 g006
Figure 7. Velocity distributions at different times when the elevator car moved upward, i.e., in the 1st stage of Case 1: (a) at t = 0.1 s when the car was just lifted; (b) at t = 7.3 s when the car just reached the 5th floor; (c) at t = 16.2 s when the car just reached the 10th floor; (d) at t = 25.2 s when the car just reached the 15th floor.
Applsci 13 07400 g007
Figure 8. Distribution of the pollutant released from the lobby of the first floor at different times when the elevator car moved upward, i.e., in the 1st stage of Case 1: (a) at t = 0.1 s when the car was just lifted; (b) at t = 7.3 s when the car just reached the 5th floor; (c) at t = 16.2 s when the car just reached the 10th floor; (d) at t = 25.2 s when the car just reached the 15th floor.
Applsci 13 07400 g008
Figure 9. Comparison of pressure and velocity distributions before and after the elevator car parked on the 15th floor, where “−” in time means infinitesimally ahead of the moment and “+” in time represents infinitesimally after the moment: (a) pressure distribution; (b) velocity distribution.
Applsci 13 07400 g009
Figure 10. Pressure distributions under different times after parking the elevator car on the 15th floor and illustration of the created water hammer, where “+” in time represents infinitesimally after the moment.
Applsci 13 07400 g010
Figure 11. Pollutant distribution 2 s after the parking of elevator car to different floors: (a) parking on the 15th floor; (b) parking on the 3rd floor; (c) parking on the 8th floor.
Applsci 13 07400 g011
Figure 12. Pressure distributions at different times when the elevator car moved down in Case 2: (a) at t = 33.3 s, i.e., 0.1 s after the car started to move downward from the 15th floor; (b) at t = 42.3 s when the car just reached the 10th floor; (c) at t = 51.2 s when the car just reached the 5th floor; (d) at t = 58.4 s when the car just reached the 1st floor.
Applsci 13 07400 g012
Figure 13. Velocity distributions at different times when the elevator car moved downward from the 15th floor to the 1st floor in Case 2: (a) at t = 33.3 s, i.e., 0.1 s after the car started to move downward from the 15th floor; (b) at t = 42.3 s when the car just reached the 10th floor; (c) at t = 51.2 s when the car just reached the 5th floor; (d) at t = 58.4 s when the car just reached the 1st floor.
Applsci 13 07400 g013
Figure 14. Pollutant distribution at different times when the elevator car moved downward from the 15th floor to the 1st floor in Case 2: (a) at t = 33.3 s, i.e., 0.1 s after the car started to move downward from the 15th floor; (b) at t = 42.3 s when the car just reached the 10th floor; (c) at t = 51.2 s when the car just reached the 5th floor; (d) at t = 58.4 s when the car just reached the 1st floor.
Applsci 13 07400 g014
Figure 15. Variation in the airflow rates through the clearance openings of protecting doors when accompanied by the elevator car movement in Cases 2 and 3: (a) at the door’s opening on the 2nd floor; (b) at the door’s opening on the 7th floor.
Applsci 13 07400 g015
Table 1. Geometric parameters of the investigated building.
StructureLength (m)—XWidth (m)—YHeight (m)—Z
Elevator shaft2.42.6540.5
Lobby342.7
Room542.7
Elevator car1.62.12.3
Vent hole11-
Window-0.60.75
Opening between shaft and lobby-0.20.2
Opening between lobby and room-0.150.15
Table 2. Boundary conditions in CFD modeling.
ItemBoundary TypeBoundary Values
Elevator carWall (dynamic mesh)Moving at 1.5 m/s
WindowPressure outletZero
Vent holePressure outletZero
Interior openingsInterfaceN/A
Table 3. Geometric parameters of the building for model validation [29].
StructureLength (m)—XWidth (m)—YHeight (m)—Z
Elevator shaft2.22.539
Lobby2.04.02.6
Room4.05.02.6
Elevator car1.7842.02.6
Window-0.60.75
Opening between shaft and lobby-0.40.3275
Opening between shaft and room-0.30.3
Disclaimer/Publisher’s Note: The statements, opinions and data contained in all publications are solely those of the individual author(s) and contributor(s) and not of MDPI and/or the editor(s). MDPI and/or the editor(s) disclaim responsibility for any injury to people or property resulting from any ideas, methods, instructions or products referred to in the content.

