Article

Numerical Study on the Bending Resistance of Lightweight Built-Up Steel-Concrete Composite Beams

Faculty of Civil Engineering, University of Zagreb, Fra Andrije Kačića-Miošića 26, 10000 Zagreb, Croatia
*
Author to whom correspondence should be addressed.
Appl. Sci. 2023, 13(13), 7397; https://doi.org/10.3390/app13137397
Submission received: 17 May 2023 / Revised: 16 June 2023 / Accepted: 20 June 2023 / Published: 22 June 2023

Abstract

:
This paper investigates the bending resistance of an innovative lightweight composite floor system, LWT-FLOOR. The system consists of built-up cold-formed steel elements that are spot-welded and connected to the concrete slab using demountable shear connectors. As the system under investigation is new, the existing standards do not provide guidelines for calculating its bending resistance. This paper gives an overview of different analytical approaches and a comparison of calculated results using bending capacities from the numerical parametric study. Within the numerical parametric study, the influence of the height of the steel beam, the type and degree of shear connection, the connection between the steel elements, and the thickness of the corrugated web used for the bending capacity are investigated. Numerical results for the full shear connections resulted in lower bending capacities than the analytically calculated plastic bending resistances. However, numerically obtained bending capacities for partial shear connections were found to exceed the calculated characteristic non-linear bending resistances and bending resistances for partial shear connections. The obtained results will comprise the basis for further experimental tests, which will support the search for an optimal analytical approach for the bending resistance of the proposed composite system.

1. Introduction

Cold-formed steel (CFS) elements are widely used and investigated due to their high stiffness and strength, ease of prefabrication and installation, and low transportation cost and handling [1]. On the other hand, the combination of CFS with concrete slabs can provide effective and lightweight composite floor systems. Apart from the low self-weight and the possibility of building larger spans, the use of CFS profiles also makes it possible to form various shapes of built-up open and closed cross-sections (e.g., from C and Z sections). The thickness of CFS profiles ranges from 1.2 mm to 6.4 mm [2] (the minimum thickness is 0.378 mm, according to [1]). The resistance of built-up sections and members can be increased by arranging profiles in different positions and arrangements.
Different built-up CFS profiles with closed sections, as well as open profiles and single profiles with holes, were presented in paper [3]. Back-to-back CFS profiles have also been investigated; for example, two bolted C profiles were studied in [4]. There are also innovative types of CFS profiles, such as the rectangular hollow flange beams where hollow flanges increase their buckling resistance [5]. To improve the buckling performance of the back-to-back steel system, Portioli et al. [6] placed reinforced plates inside the hollow flanges and studied cases with different spacings between the connections and different configurations of web beads. The results show that the profiled web reinforcement (beads) increases the ultimate load by 10%, whereas the spacings between the connections (150 mm and 300 mm) reduces the load-bearing capacity by 30%. Some other cross-section shapes from CFS C-sections are investigated in [7].
Regarding the applications of CFS in composite structures, Ref. [8] summarizes the strength of state-of-the-art composite beams made of CFS concrete. The results of the investigation show that the strength of the composite beam is maintained when a thin-walled CFS profile replaces the standard reinforcement with the same cross-sectional area. Furthermore, the development of the empirical equation, which aims to evaluate the ultimate shear bond capacity under bending conditions, and the interaction between shear connections and bending, is discussed. Ref. [2] predicts the moment resistance of the composite beam; the CFS box section was composed of two channel sections embedded in the concrete, in accordance with Eurocode 4 [9]. A CFS with hollow flanges was investigated in [10], wherein the hollow flanges of an I section were filled with normal and high-strength lightweight concrete. The results show that a lightweight infill, whether it is lightweight, normal, or lightweight high-strength concrete, positively affects the shear capacity because it delays shear buckling. Bolts were used for the connections between back-to-back C-profiles in the composite members studied by Bamaga et al. [11]. They considered three types of shear connections, under bending and shear resistance conditions, and they compared the experimental and theoretical results. Single channels and back-to-back channels in steel-concrete composite beams were also investigated in Ref. [12]. Considering that the degree and type of shear connection significantly influence the composite systems, different types and arrangements of shear connectors are studied in the existing literature. Among the other types of shear connectors [13], there are shear connectors which are permanently connected to steel beams [14] or that are demountable [15,16].
Guided by the idea of forming a composite system with built-up CFS profiles connected by spot welds and demountable shear connections, the LWT-FLOOR system is proposed [13]. The system consists of four cold-formed channel sections that are spot-welded to the corrugated web (CW) and reinforced by shear plates near the supports, whereas the concrete slab is connected to the steel beam with demountable shear connectors. Considering that this is an innovative system and the standards do not provide direct guidelines for the calculation of bending resistance, this paper reviews the analytical approaches available in the literature. Furthermore, the analytically calculated results are compared with the numerically obtained bending moment capacities. Numerical studies consider the height of the steel beam in relation to the system bending capacity, as well as the type and degree of the shear connection and the connections between the steel elements. The influence of the CW thickness on the bending capacity of the proposed system is also analyzed. The maximum values of numerically obtained bending capacities are compared with analytically calculated characteristic bending resistances.

2. Materials and Methods

2.1. Analytical Approaches for the Bending Resistance of Composite Beams

2.1.1. Literature Overview

In the available literature, different approaches for calculating the bending resistance of composite steel-concrete systems can be found, depending on which standards are used (e.g., American, Australian, European, or Chinese). The prediction of the flexural strength of the composite CFS section and the concrete slab, wherein the steel beam consists of two C-sections oriented ‘toe-to-toe’ to form a box section, is shown in [2]; the bending resistance is calculated using the elastoplastic theory, which is based on EN 1994-1-1:2004 [9]. The structural behavior of double CFS-lipped channel sections that are connected to a concrete slab as a composite beam was analyzed [11]; the channel sections were placed back-to-back and connected with bolts. The plastic theory was used to calculate the ultimate moment capacity of the full-scale composite beams. To compare the results, the experimental and theoretical load capacities (interpolation method, stress block method, and web crippling) were calculated in accordance with European [9] and British standards [17].
In addition to the interactions between steel and concrete, as presented in the aforementioned articles, the composite action between CFS beams and wood-based floorboards is shown in [18]. The theoretical plastic bending resistance was calculated and the full shear connection and plastic stress distribution was estimated in accordance with EN 1994-1-1 [9]. In [19], a comparison of two different standards of composite beam, European (EN 1994-1-1 [9]) and Chinese (JGJ 138 [20]), were used for a bending experiment wherein a novel configuration of cold-formed U-shaped steel-concrete composite beams was tested.
The flexural behavior of CFS composite beams was the subject of an article by Shi et al. [21]. The researchers investigated the simplified the method for calculating the flexural elastic capacity. Another comparison between European and Chinese standards was analyzed; it concerned the flexural behavior of rebar truss stiffened cold-formed U-shaped steel-concrete composite beams [22]. The test results showed that the ultimate bending capacity could be calculated using EC4 and JGJ 138 with three modification factors to account for the effective slab width, depth, and steel web, as well as the actual compressive strength of the concrete. The calculated bending resistances align well with the experimental results. The same modification was used in [23] to investigate the flexural behavior of rebar truss stiffened cold-formed U-shaped steel-concrete composite beams.
Güldür et al. [24] investigated a CFS floor truss with concrete-filled compression chords to show how external loading forces act on the trusses, and how they induce axial strain and bending strain on the chord elements. The total number of chord strains at the most critical cross-section can be calculated as the sum of the strains due to the two effects mentioned. Zhao et al. [25] analyzed the negative bending behavior of novel U-shaped composite steel and concrete beams. The whole procedure for calculating the negative bending capacity, which is the sum of the moments caused by the corresponding force of each part of the composite system, is explained. In addition, Yan et al. [26] also analyzed the U-shaped steel-encased concrete composite beams.
Haris et al. [7] conducted an experimental study on the bending behavior of double channels and hollow light gauge steel sections. An approach from the Australian–New Zealand standard for CFS structures [27] was used to calculate the nominal beam bending moment capacity. Nguyen [8] investigated the strength of a composite beam made of concrete and a thin-walled CFS stiffened channel section. In addition to the bending strength, the shear strength and the interactions between the shear and bending forces were also analyzed.
Dar et al. [4] investigated the behavior of partly stiffened CFS built-up beams and they compared the given experimental and numerical results with the analytical results. The characteristic bending strength of the beam was calculated in accordance with the design rules of EC3 [28] and the design rules of AISI-S100 [29]. It may be noted that the analytically determined strengths, calculated using the North American Specifications and the European Codes for CFS structures, were conservative compared with the numerical results.
Wehbe et al. [30] investigated the behavior of concrete/CFS–composite beams (experimental development of a novel structural system). This paper showed how a composite action could be achieved by attaching stand-off screws to the track and encapsulating the screw shank in the concrete slab.
Irwan et al. [31] analyzed a large-scale test of symmetrical CFS–concrete composite beams with bent-up triangular tabs to improve shear transfer. A composite beam with shear transfer enhancements was found to have an increased capacity for ultimate bending moments compared with specimens without enhancements.
In accordance with the research and their results mentioned above, it can be concluded that different approaches are used to calculate the bending resistance of composite beams made of CFS and concrete. The following section presents three commonly used approaches which will be used in this paper.

2.1.2. Analytical Bending Resistance of Composite LWT-FLOOR Beams

It was assumed that the analytical bending resistance of composite LWT-FLOOR beams could be calculated using three different approaches.
The first approach calculates the plastic bending resistance. To calculate the characteristic plastic bending resistance, finding the position of the plastic neutral axis is necessary, and can be calculated in accordance with Equation (1):
xpl,k = 4 × Aa × fyk/(beff × 0.85 × fck),
where Aa is the cross-section area of the CFS C profiles, fyk is the characteristic steel yield strength, beff is the width of the reinforced concrete slab, calculated in accordance with Chapter 5.4 of EN 1994-1-1 [9], and fck is the characteristic value of the cylinder compressive strength of concrete at 28 days.
In the analyzed LWT-FLOOR cross-section, as shown in Figure 1, the position of the plastic neutral axis (n.a.) is assumed to be in the concrete, and the full degree of shear connection is achieved. Therefore, the whole steel section was placed under tense conditions, which allowed for the utilization of its plastic resistance, although the CFS sections are usually taken as cross-sections of class 3 or 4.
Equation (2) enables the calculation of plastic bending resistance in the case of a full shear connection, in accordance with the first analytical approach:
Mpl,Rk = 2 × Aa × fyk × (ha/2 + hc + hp − xpl,k/2) + 2 × Aa × fyk × (h − ha/2 + hc + hp − xpl,k/2)
where ha is the height of the CFS C section, hc is the height of the concrete slab, and hp is the height of the metal sheet rib, which is positioned perpendicular to the direction of the composite beam (see Figure 1).
The calculated values for the characteristic plastic bending resistance in the case of a full shear connection for steel beam heights of 400 mm, 500 mm, and 600 mm, are 257.7 kNm, 299.7 kNm and 341.7 kNm, respectively.
The second analytical approach, comprising a partial shear connection, may be used when the bolts are arranged in such a way that a full shear connection between steel and concrete parts cannot be achieved. In this case, the bending resistance is calculated by modifying the equation from Eurocode 4 [9]; the plastic bending resistance of the structural steel section Mpl,a,Rk is replaced with the elastic bending resistance of the structural steel section, Mel,a,Rk, as shown in Equation (3) [13,18].
MRk = Mel,a,Rk + (Mpl,Rk − Mel,a,Rk) × η,
where Mpl,Rk is the bending resistance of the composite beam in the case of full shear connection; this was calculated in accordance with Equation (2), and η is the degree of shear connection, which may be calculated using Equation (4):
η = n/nfull.
To calculate the degree of shear connection, it is necessary to understand the number of shear connectors required to achieve a full shear connection, nfull. In Equation (4), n is the number of shear connectors used, and it is limited by the number of metal sheet ribs. In addition, the number of shear connectors can be varied by their position within the ribs; it is possible to use two bolts per rib or one bolt per rib, which are then placed in a staggered arrangement along the length of the beam. These two cases are considered in this paper, with the axial spacing of the metal sheet ribs being 240 mm. The quality of the bolts used as shear connectors is 8.8, which means that the tensile strength of the bolts is 800 N/mm2. This falls outside the scope of the European standard [9], where the equations for calculating the resistance of headed shear studs are valid for tensile strengths up to 500 N/mm2. Moreover, the used bolt diameter (12 mm) is smaller than specified in the European standard [9] (16 mm–25 mm). However, it was assumed that these equations are also valid for bolts used as shear studs.
In addition, according to EN 1994-1-1 [9], to calculate the resistance of the bolt when the ribs of the metal sheet are positioned perpendicular to the direction of the composite beam, it is necessary to apply the reduction coefficient, kt.
kt = 0.7/sqrt(nr) × b0/hp × (hsc/hp − 1) ≤ kt,max,
where b0 is a mean width of a concrete rib, hsc is the overall nominal height of a connector, nr is the number of stud connectors in one rib, hp is the overall depth of the profiled steel sheet (excluding embossments), and kt,max is the limit value, in accordance with the findings in [9].
EN 1994-1-1 [9] requires the minimum height of the shear connectors to be:
hsc = hp + 2 × d,
where d is the diameter of the shear connector.
The shear connector resistance is finally calculated as:
Pt,Rk = kt × PRk,
where PRk is the design value of the shear resistance of a single connector.
Table 1 shows the calculated bending resistances of composite CFS–concrete beams using the investigated steel beam heights in cases where shear connectors are arranged in pairs or are staggered, with and without the reduction coefficient, kt.
The third considered approach concerns the non-linear bending resistance, which is calculated in accordance with [9,32,33]. First, the elastic bending resistance of the cross-section must be found, which can be calculated by converting the concrete slab into a steel cross-section. To calculate the ideal area of the composite cross-section, the ideal area of the concrete slab cross-section must be found, as well as the distance between the center of gravity of the composite section and the concrete slab. The ideal area of the concrete slab is calculated by considering the thickness of the concrete slab above the center of gravity of the composite section. Then, it is possible to calculate the ideal moment of inertia for the concrete slab, and finally, for the composite section. The stiffness of the composite cross-section is possible to calculate using Equation (8):
EIL = Ea × Ii,L,
where Ea is the modulus of the elasticity of steel and Ii,L is the ideal second moment of the area.
Non-linear bending resistance can be considered for propped and unpropped systems.
In a propped system, regarding the criteria of the maximum stresses allowed in steel and concrete sections, two equations can be formulated (Equations (9) and (10)) to calculate the bending resistance; the lower result from the two equations should then be considered for further calculations.
σa = Ea × MRk,1/EIL × za,
σc = Ec × MRk,2/EIL × zc,
where MRk,1 is the maximum allowable moment that will cause stress in the steel section, and MRk,2 is the maximum allowable moment that will cause stress in the concrete section. To choose the right expression for elastic bending resistance, as demonstrated in [9], the value of a normal compressive force in a concrete slab which corresponds with MEl,Rk can be calculated as:
Nc,el = k × Mel,Rk/Ii,L × (Ac,L × zic,L),
zic,L = Aa × aa/Ai,L.
where k is the minimum value between ka, ks, and kc. These values are obtained from the edge fibers of the cross-section that has reached its limit in terms of stress. Ac,L is the area of the ideal composite cross-section, zic,L is the distance between the centers of gravity of the composite cross-section and the center of gravity of the concrete slab; aa is the distance between the center of gravity of the cross-section steel part and the center of gravity of the composite cross-section.
An unpropped system must be considered during the phases of construction. In phase I, the weight of the steel beam and concrete must be considered, and then the characteristic bending moment of the calculated load is used to calculate the stresses on the steel section. In phase II, the stress in the steel section is assumed to be limited by the yielded stress; this allows the remaining stress to be taken into account. Two bending moments were calculated using the equations that calculate stresses in the steel (Equation (13)) and in the concrete (Equation (14)); the minimum value is associated with MRk,II.
σa,II = Ea × MRk,II,a/EIL × za,
σc = Ec × MRk,II,c/EIL × zc,
The elastic bending resistance of the composite section is then calculated as follows:
Mel = MRk,I + k × MRk,II,
where MRk,I is the design bending resistance from phase I, and k is the lowest factor when a stress limit is reached.
Following the conditions given in EN-1994-1-1 [9], the characteristic value of the bending resistance of a composite section is calculated using Equations (16) and (17).
Nc ≤ Nc,el; MRk = Ma,Rk + (Mel,Rk − Ma,Rk) × Nc/Nc,el,
Nc,el ≤ Nc ≤ Nc,f; MRk = Mel,Rk + (Mpl,Rk − Mel,Rk) × ((Nc − Nc,el)/(Nc,f − Nc,el)),
Calculated values are shown in Figure 2.
In Figure 2, a simplified relationship between M and Nc is shown. In all diagrams in Figure 2, curves for propped (red lines) and unpropped (purple lines) construction are shown. Diagrams are defined in accordance with [9]. For both types of construction, propped and unpropped, one and two bolts in each rib are analyzed. Each line has three marked spots—one spot is used for both degrees of shear connection and is defined as MRk/Mpl,Rk and Nc/Nc,f, and two spots represent Mel,Rk/Mpl,Rk and Nc,el/Nc,f; these are related to the degree of shear connection. The calculated characteristic bending resistances align well with the non-linear approach of the propped system; the steel beam height of 400 mm, with bolts in pairs and a staggered arrangement, have resistances of 161.74 kNm and 112.55 kNm, respectively. The steel beam height of 500 mm, with bolts in pairs and a staggered arrangement, resulted in characteristic resistances of 194.42 kNm and 139.72 kNm, respectively. The steel beam height of 600 mm, with bolts in pairs and a staggered arrangement, resulted in characteristic resistances of 227.21 kNm and 167.27 kNm, respectively. In the case of the unpropped system, for the steel beam height of 400 mm, with bolts in pairs and a staggered arrangement, the values of non-linear resistances are 176.39 kNm and 134.71 kNm, respectively. The steel beam height of 500 mm, with bolts in pairs and a staggered arrangement resulted in characteristic resistances of 208.46 kNm and 161.69 kNm, respectively. Finally, the steel beam height of 600 mm, with bolts in pairs and a staggered arrangement, resulted in characteristic resistances of 240.83 kNm and 189.12 kNm, respectively.

2.2. Parametric Numerical Analyses

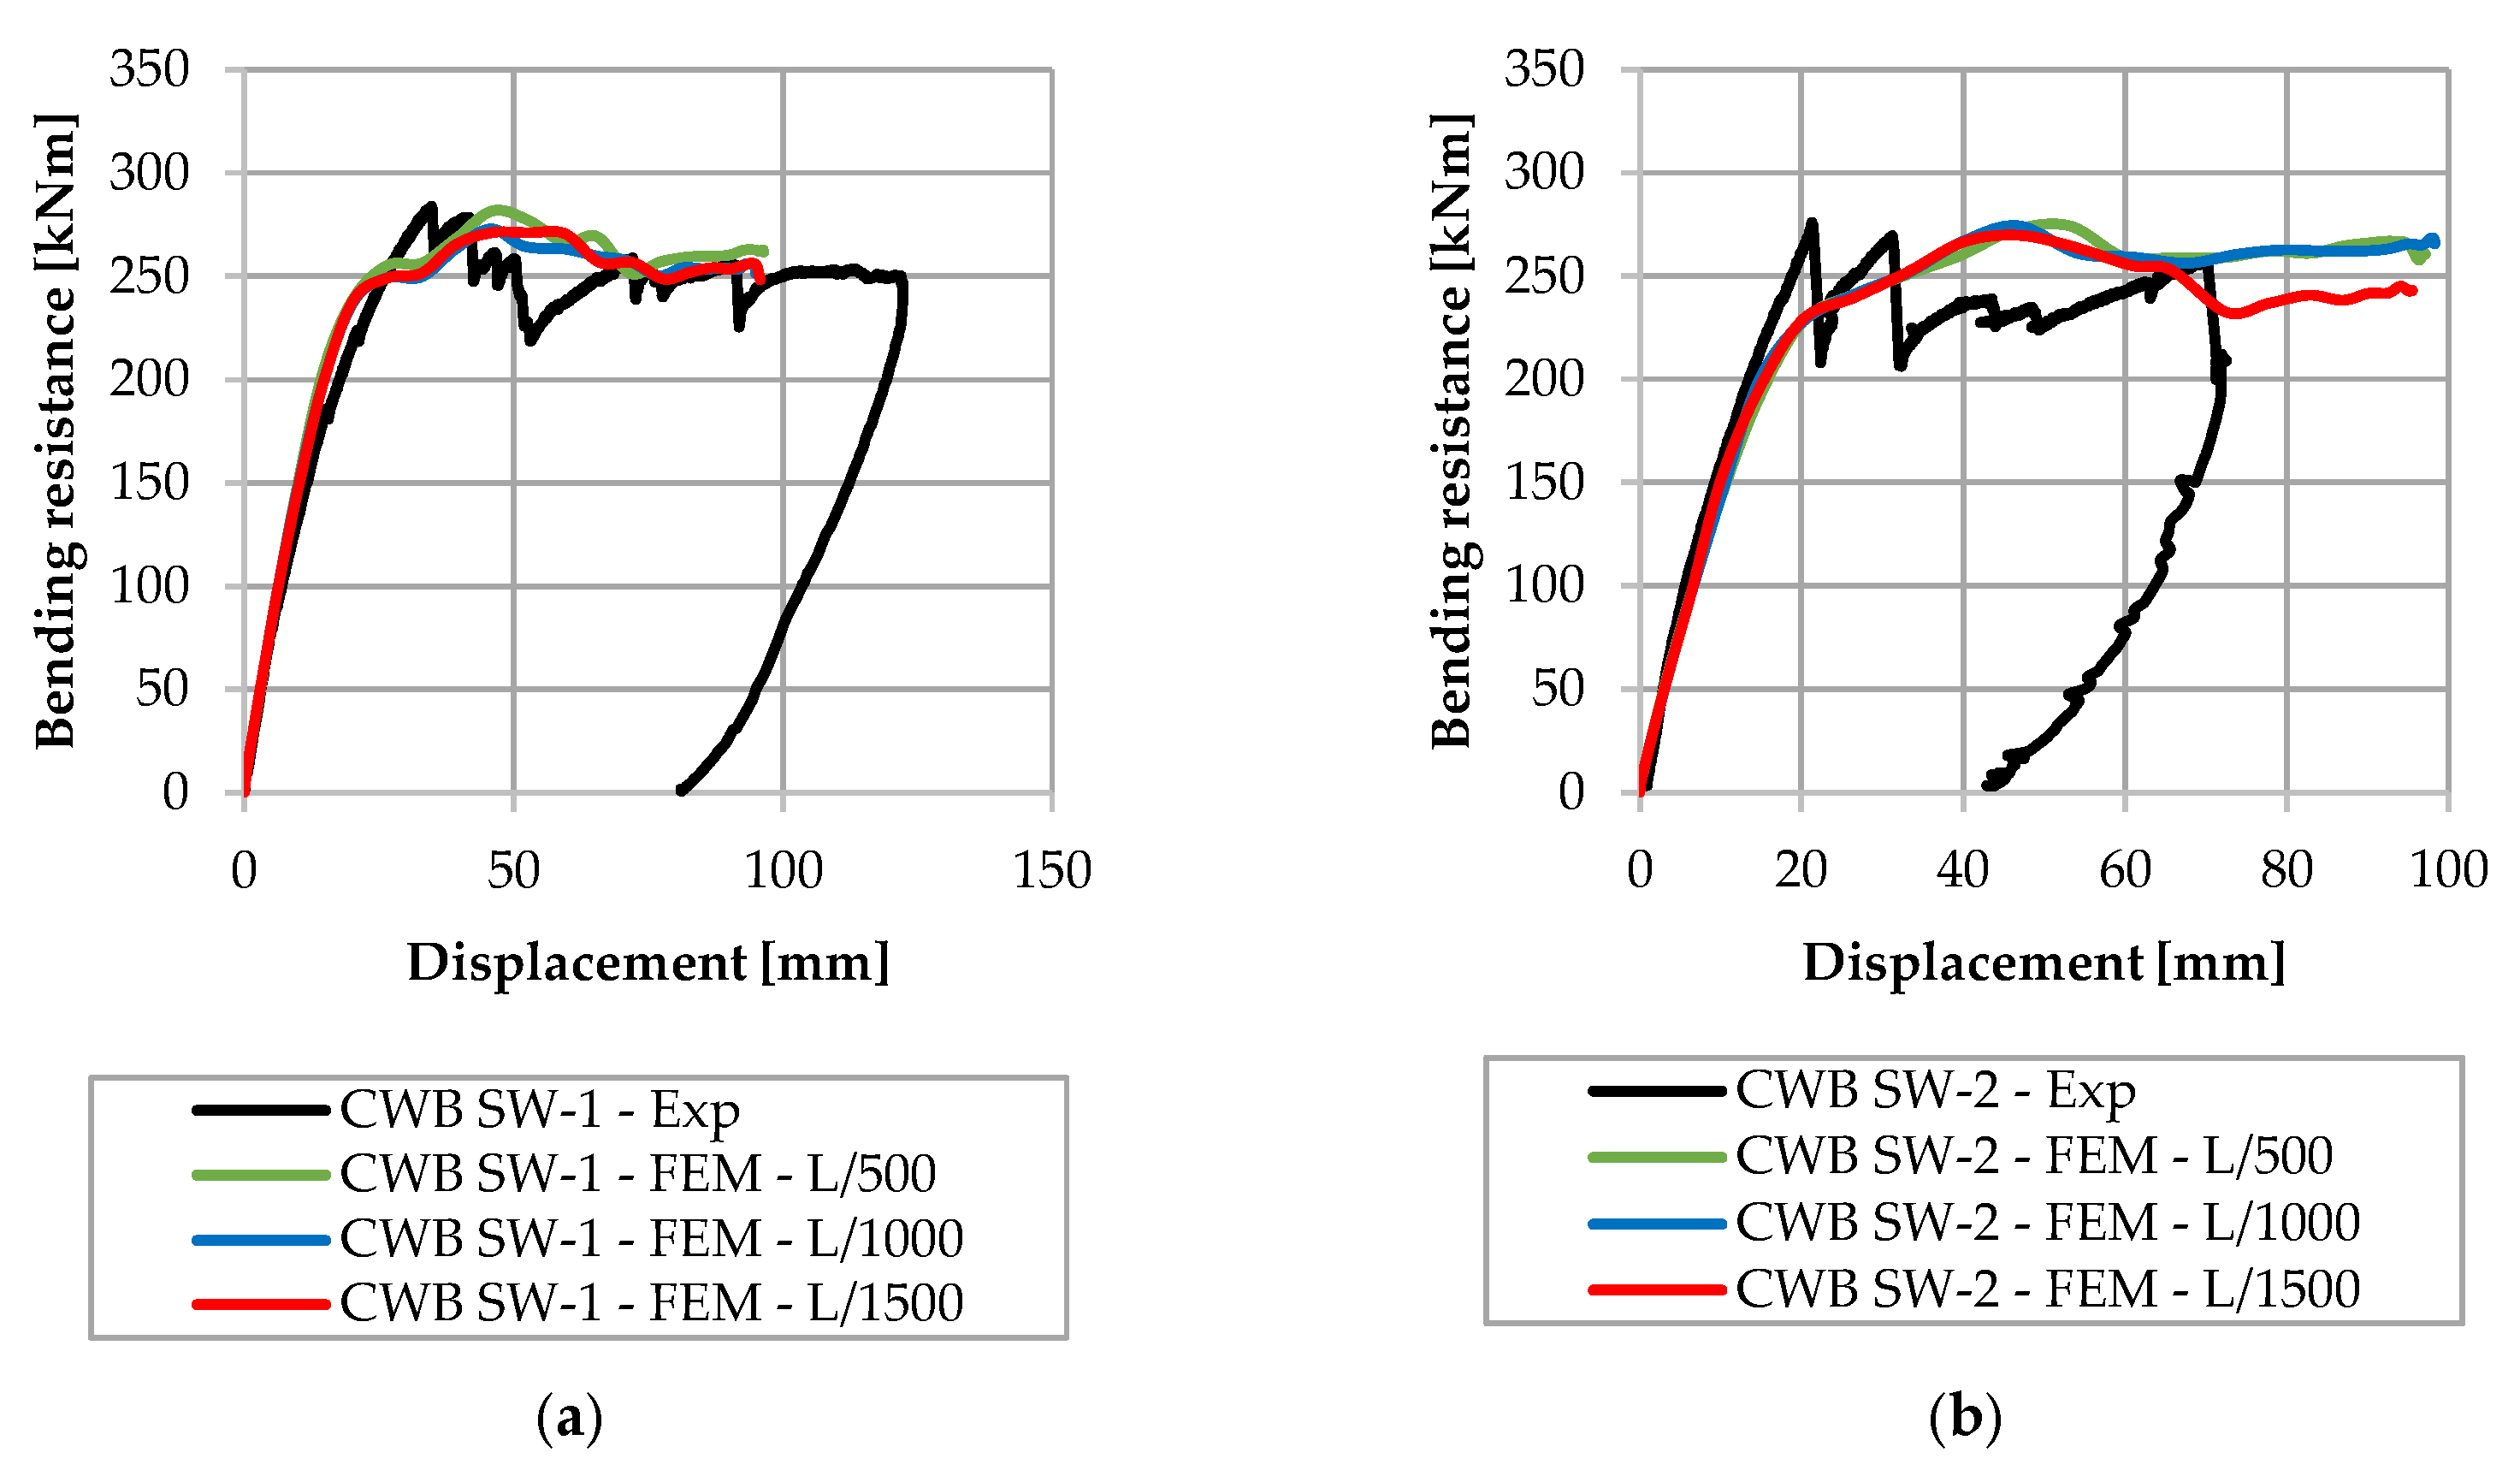
The numerical model was created using ABAQUS/CAE software [34]. The model is based on a calibrated numerical model of a corrugated web beam (CWB) [35]. Figure 3 shows a comparison of experimentally and numerically obtained results for different magnitudes of initial geometric imperfection (i.e., L/500, L/1000, and L/1500, where L is a CWB beam span).
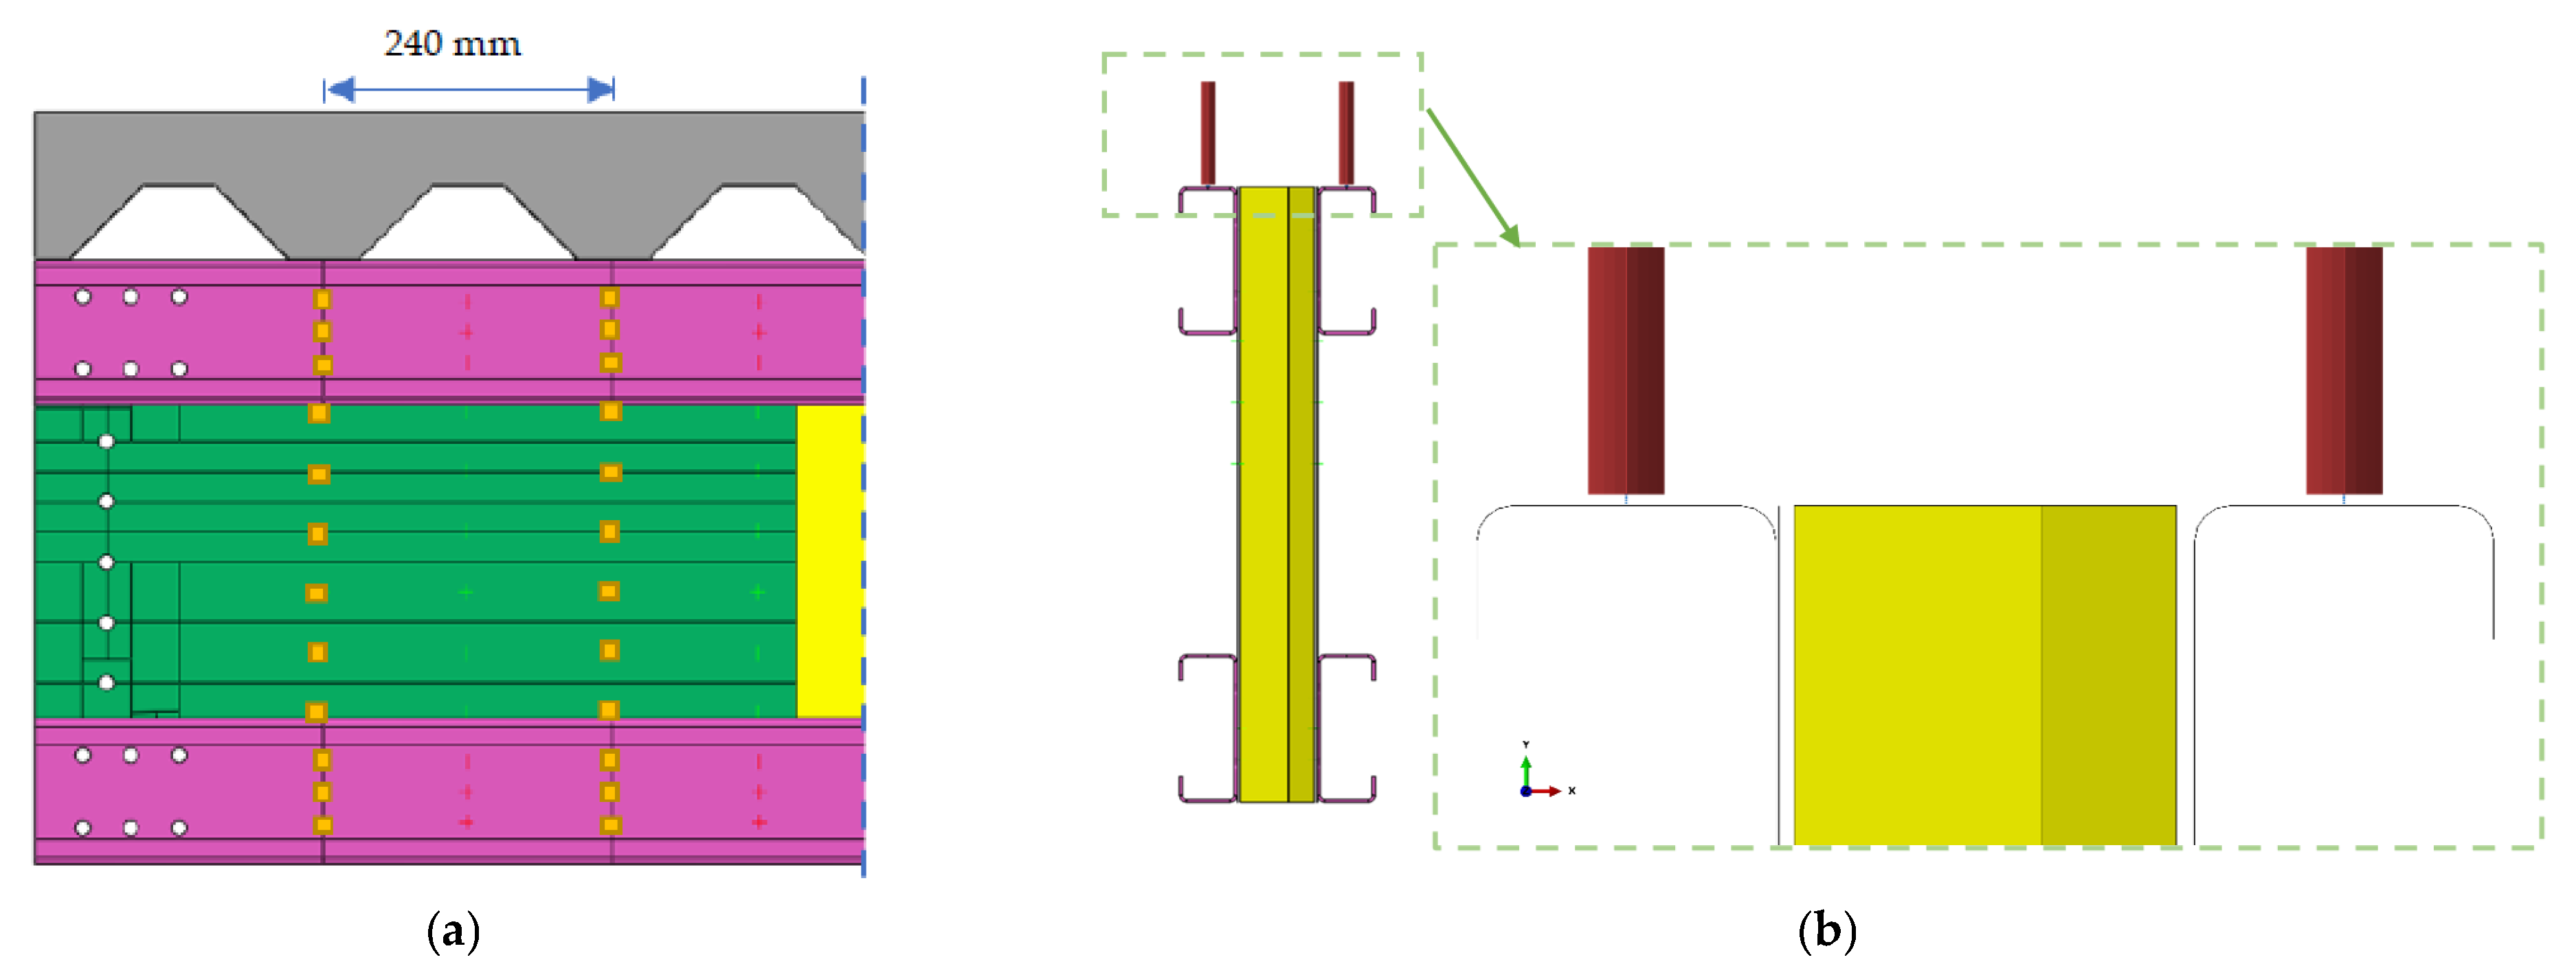
The system’s load is set as a vertical displacement of 100 mm in the middle of the span. The load is transferred using two constraints (MPC Beams) that are connected with a MPC Pin, which has a defined reference point (RP) where the load is assigned. Four loading points are used for transferring the load and are defined as kinematic couplings, as shown in Figure 4a. The model is formed as a simply supported beam whose ends are defined as coupling constraints, as shown in Figure 4b.
The span of the LWT-FLOOR composite CFS–concrete beam is 6 m. The loading points are located 750 mm from the ends and are 1500 mm apart. The numerical modelling process consists of two steps. First, the initial imperfections are modelled using a static analysis; this produces an imperfect shape with an initial geometric imperfection of L/1500. Next, an explicit dynamic analysis is performed.
The analyzed model consists of four CFS C-profiles which are connected to the CW and shear plates to form a unit of a steel beam. The concrete slab on a metal sheet is placed on the steel beam to form a composite beam. The total height of the concrete slab with ribs is 120 mm.
The mesh size of the concrete slab is 30 mm and the assigned element type is C3D8R (an 8-node linear brick with reduced integration). The mesh size of the C-profiles is 15 mm, and the mesh size of the shear plates and CW is 10 mm. The assigned element type for the aforementioned steel elements is S4R (a 4-node doubly curved thin or thick shell). The mesh size of the shear connectors is 8.4 mm, and the assigned element type is B31 (a 2-node linear beam in space).
The used concrete class is C25/30, in accordance with [36]. To define concrete damage behavior, different concrete damage plasticity (CDP) models can be found in the literature [37,38,39,40,41,42]. The CDP model (shown in Figure 5a), in accordance with [13,37,38], is used to model concrete. The used material for all steel elements is S350 GD (Figure 5b), and the bolt quality is 8.8 (Figure 5c).
General contact between all FE model parts occurred using the following parameters: normal direction–hard contact, transverse direction–friction contact with a friction coefficient of 0.1, and the free separation of elements to allow contact was permitted.
To ensure the joint behavior of steel parts, the connection between them is secured in two ways: tie connection and spot welds. In cases where a tie connection is used, the touching surfaces are connected using a tie constraint. When spot welds are used for connecting C-sections, two and three spot welds are used, in accordance with [43]. The spot welds are secured with attachment points using Point-Based Fasteners with assigned properties investigated in [44,45]. Each spot weld has defined elasticity, plasticity, damage and failure parameters. The connection section of the spot welds is secured using a bushing connector element that provides a connection between two nodes; this allows independent behavior to occur in three local Cartesian directions, following the system in both nodes, and it allows for different behaviors to occur in two flexural rotations and one torsional rotation. The arrangement of the spot welds between CFS C-sections and the CW, and between the CW and the shear plates, is determined by the arrangement of the ribs of the CW, as shown in Figure 6a. The spot welds between the C-sections and other steel elements are located 35 mm from the top and bottom edges of the flanges.
To create a connection between the steel beam and the concrete slab, the shear connection is secured with a tie connection, which produces a full shear connection, and by positioning the shear connectors in a different arrangement, a partial shear connection is produced. As previously mentioned, structural bolts were used as demountable shear connectors. The chosen height of 84 mm was defined in accordance with EN 1994-1-1 [9]. The diameter of the bolts used was 12 mm; for simplification’s sake, they are modelled as beam elements without heads. The bolts were embedded in the concrete slab and their lower end was connected to the upper flange of the C-profile with the wire comprising the MPC Beam connector section; thus, the joint behavior of the C-section and the bolts was ensured. Figure 6b shows how the lower edge of the shear connector and the upper edge of the channel profile were connected. The axial distance between the bolts in the cross-section, within the same rib, was 107 mm. The longitudinal arrangement is defined by the axial distance between the metal sheet ribs, which was 240 mm. Two different arrangements of bolts were analyzed in pairs or in a staggered arrangement.
The nomenclature for numerical model names used in this paper is explained in Figure 7.
Table 2 shows all analyzed parameters of this numerical study.

3. Parametric Numerical Analysis Results

The influence of the previously mentioned parameters is shown in the following sections. Firstly, individual influences are shown; then, the interactions between influences on the bending capacity of the composite LWT-FLOOR beam are shown.

3.1. Influence of the Degree of Shear Connection

The degree of shear connection had a significant influence on the bending capacity of the composite beam. The influence of the degree of shear connection was taken into account by changing the way in which the connection between the steel beam and the concrete slab was forged.
Compared with the models that use tied steel elements, wherein the influence of the type of connection between the steel elements is not taken into account, the influence of the degree of shear connection is easier to observe (Figure 8a–c). Figure 8a shows the significant influence of shear connections on models with a steel beam height of 400 mm and a CW thickness of 0.8 mm. The difference in values between a full shear connection (400_SP10_CW08_TIE_TIE) and a partial shear connection when shear connectors are positioned in pairs (400_SP_CW08_SC12C_TIE) is approximately 50 kNm. Moreover, the difference between partial shear connections when shear connectors are in a staggered arrangement (400_SP10_CW08_SC12S_TIE) and when they are in pairs is approximately 45 kNm. The difference in value between model with full shear connection (400_SP10_CW08_TIE_TIE) and model with shear connectors, when they are in a staggered position (400_SP10_CW08 _SC12S_TIE), is approximately 95 kNm. Figure 8b shows the influence of the degree of shear connection on models when the steel beam height is 500 mm and the CW thickness is 1.0 mm. The difference in bending capacity between the model with tied steel beams and concrete slabs (500_SP10_CW10_TIE_TIE), and the model where bolts are positioned in pairs (500_SP10_CW10_SC12C_TIE), is approximately 40 kNm; the difference between models with shear connectors in a different arrangement is approximately 20 kNm. Figure 8c shows models with a steel beam height of 600 mm. The difference between the tied model (600_SP10_CW15_TIE_TIE) and the model wherein shear connectors are positioned in pairs (600_SP10_CW15_SC12C_TIE) is approximately 30 kNm; the model with shear connectors positioned in pairs has an increased bending capacity of 50 kNm compared with the model with a staggered arrangement of shear connectors (600_SP10_CW15_SC12S_TIE). All presented results show that the differences between the degrees of shear connection are heightened as the steel beam height decreases.

3.2. Influence of CW Thickness

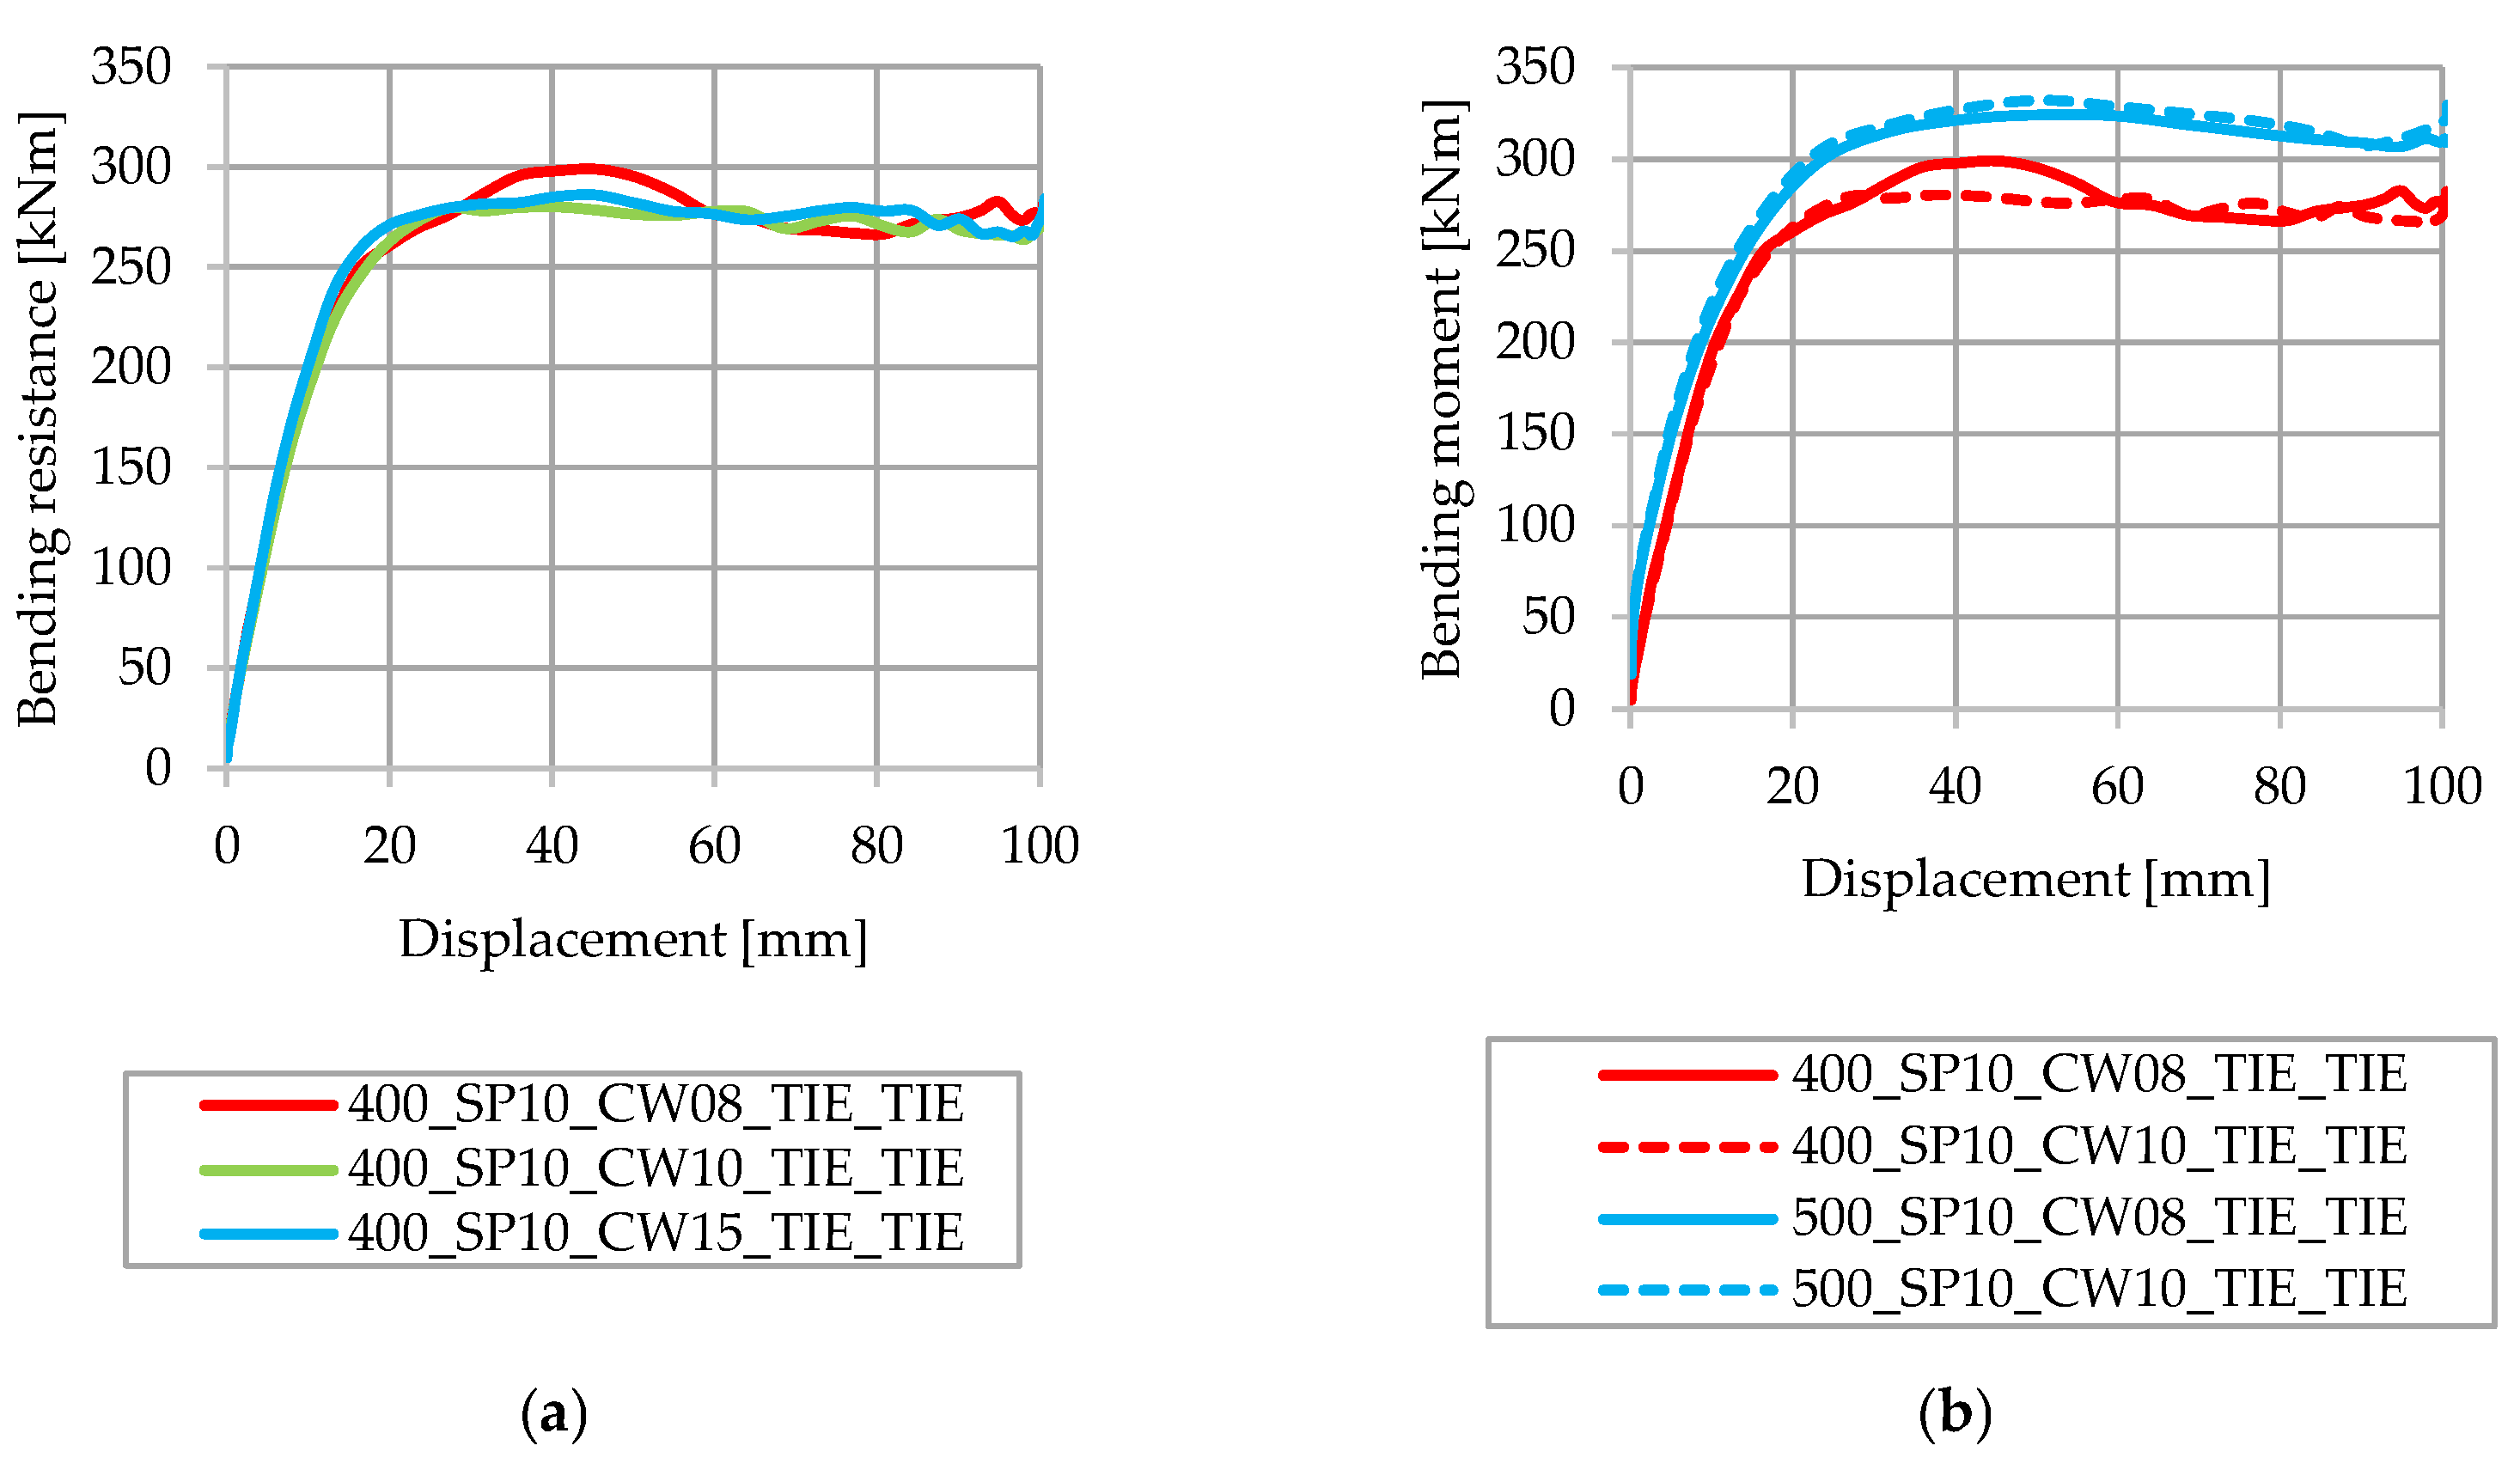
The influence of CW thickness on the bending capacity of the proposed composite system is shown in Figure 9 for models with a steel beam height of 400 mm and 500 mm, full shear connections, and tied steel elements; hence, the influence of the degree of shear connections and the number of spot welds will be eliminated. Three different thicknesses of CW are analyzed—0.8 mm, 1.0 mm, and 1.5 mm. Based on the given results from Figure 9, it is concluded that the influence of the corrugated web thickness is negligible in the analyzed models.

3.3. Influence of the Type of Connection between Steel Elements

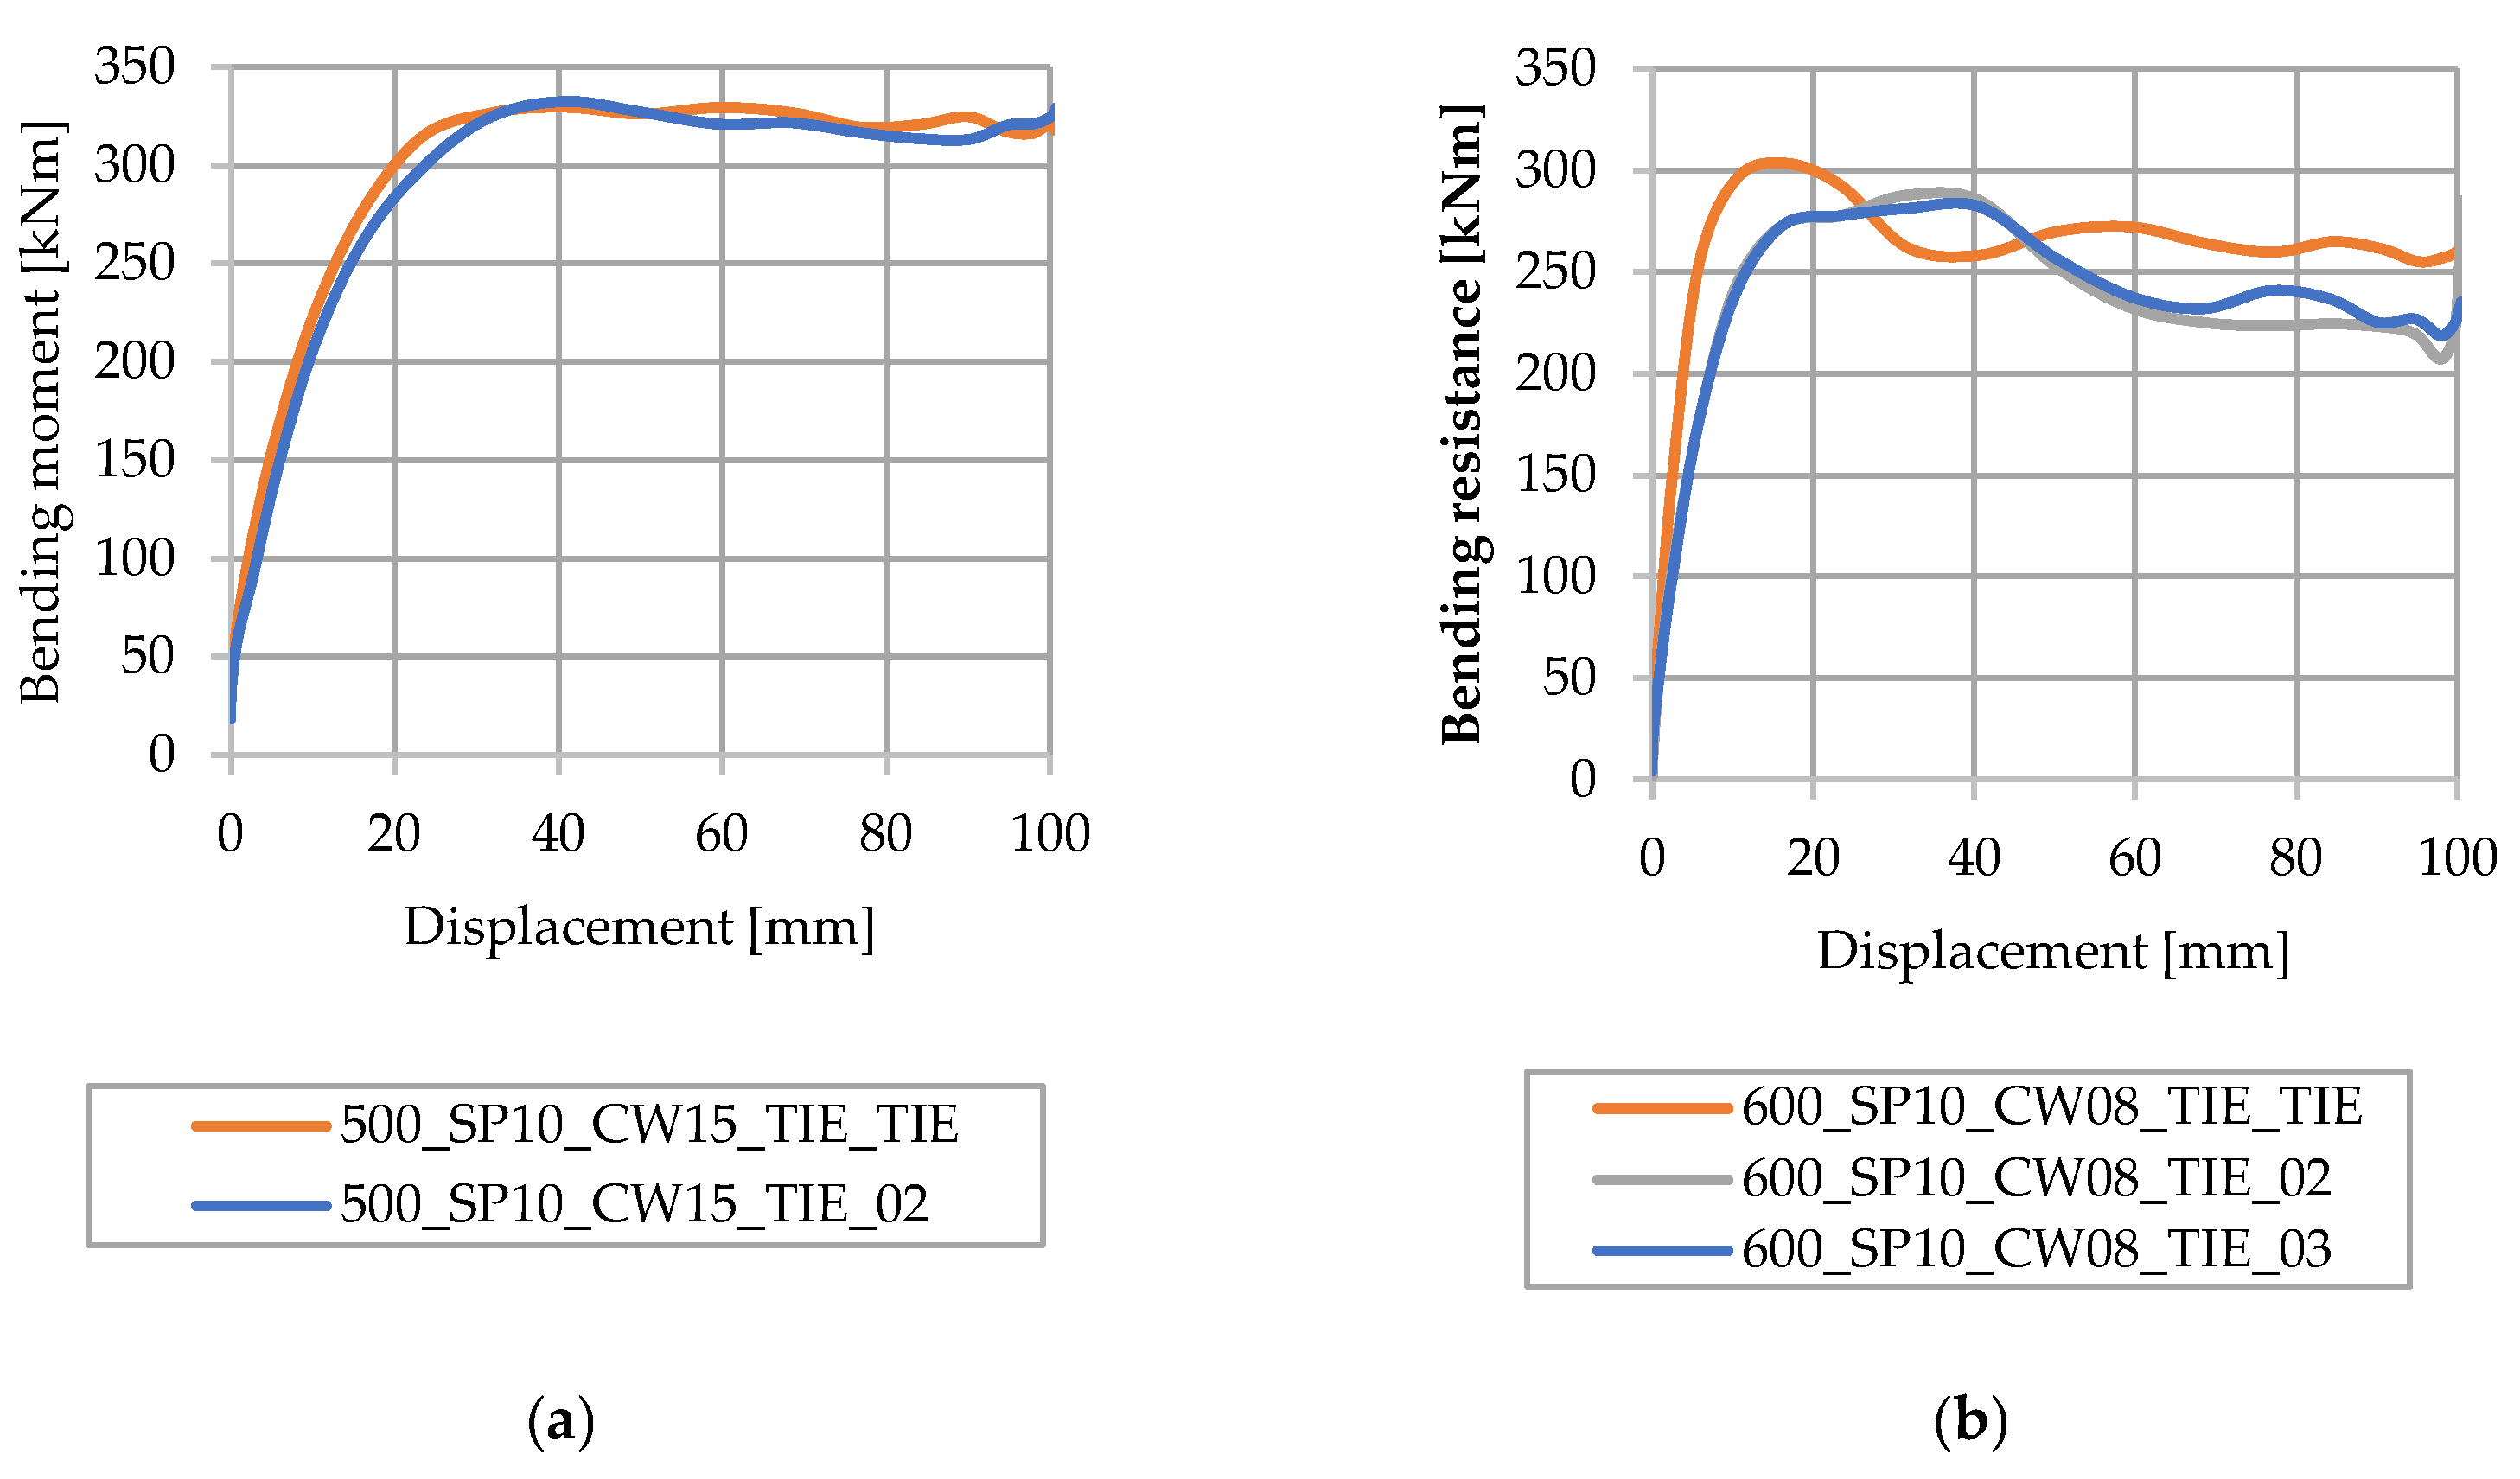
The connection between steel elements is observed in two different ways, as already mentioned in Section 3. When steel elements are tied, displacements between connected parts are prevented. Figure 10a shows the influence of the type of connections between steel elements on models with a steel beam height of 500 mm and a CW thickness of 1.5 mm. It also shows the influence of the type of connections in cases where the lowest bearing capacity is expected—with two spot welds between C profiles—and when other steel elements are in contact with one another (500_SP10_CW15_TIE_02), as well as in cases where the highest bending capacity is expected—in tied models (500_SP10_CW15_TIE_TIE). Figure 10b shows the difference between the tied model (600_SP10_CW08_TIE_TIE) and models with two (600_SP10_CW08_TIE_02) and three spot welds (600_SP10_CW08_TIE_03) between C profiles and other steel elements for a steel beam height of 600 mm and CW thickness of 0.8 mm. The results show that tied models do not have a higher bending capacity compared with spot welded models, or they are approximately 10 kNm higher; this equates to a difference in bending capacities of less than 5%. The difference in bending capacity for spot-welded models is negligible.

3.4. Influence of the Number of Spot Welds in the Cross-Section

The number of spot welds between C profiles and other steel elements that are in contact with C profiles is varied. One C profile in the composite beam with two spot welds has 48 spot welds along its length, which, for the whole composite beam, equates to 192 spot welds between C profiles and other steel elements. In cases where C profiles are connected using three spot welds, each C profile has 72 spot welds along its length. Therefore, within the model, C profiles are connected to other steel elements using 288 spot welds. Considering the steel beams of the same height, the number of spot welds in cases when two and three spot welds are used is approximately 96. Figure 11 shows the influence of the number of spot welds between C profiles and steel elements for different steel beam heights.
Analyzing the results shown in Figure 11, the number of spot welds does not significantly influence the bending resistance of the analyzed LWT-FLOOR composite CFS–concrete beam. In accordance with the presented results, it can be concluded that an increased number of spot welds, from two to three on the C profile, will result in a more expensive beam with a disproportionate improvement in bending capacity.

3.5. Influence of Steel Beam Height

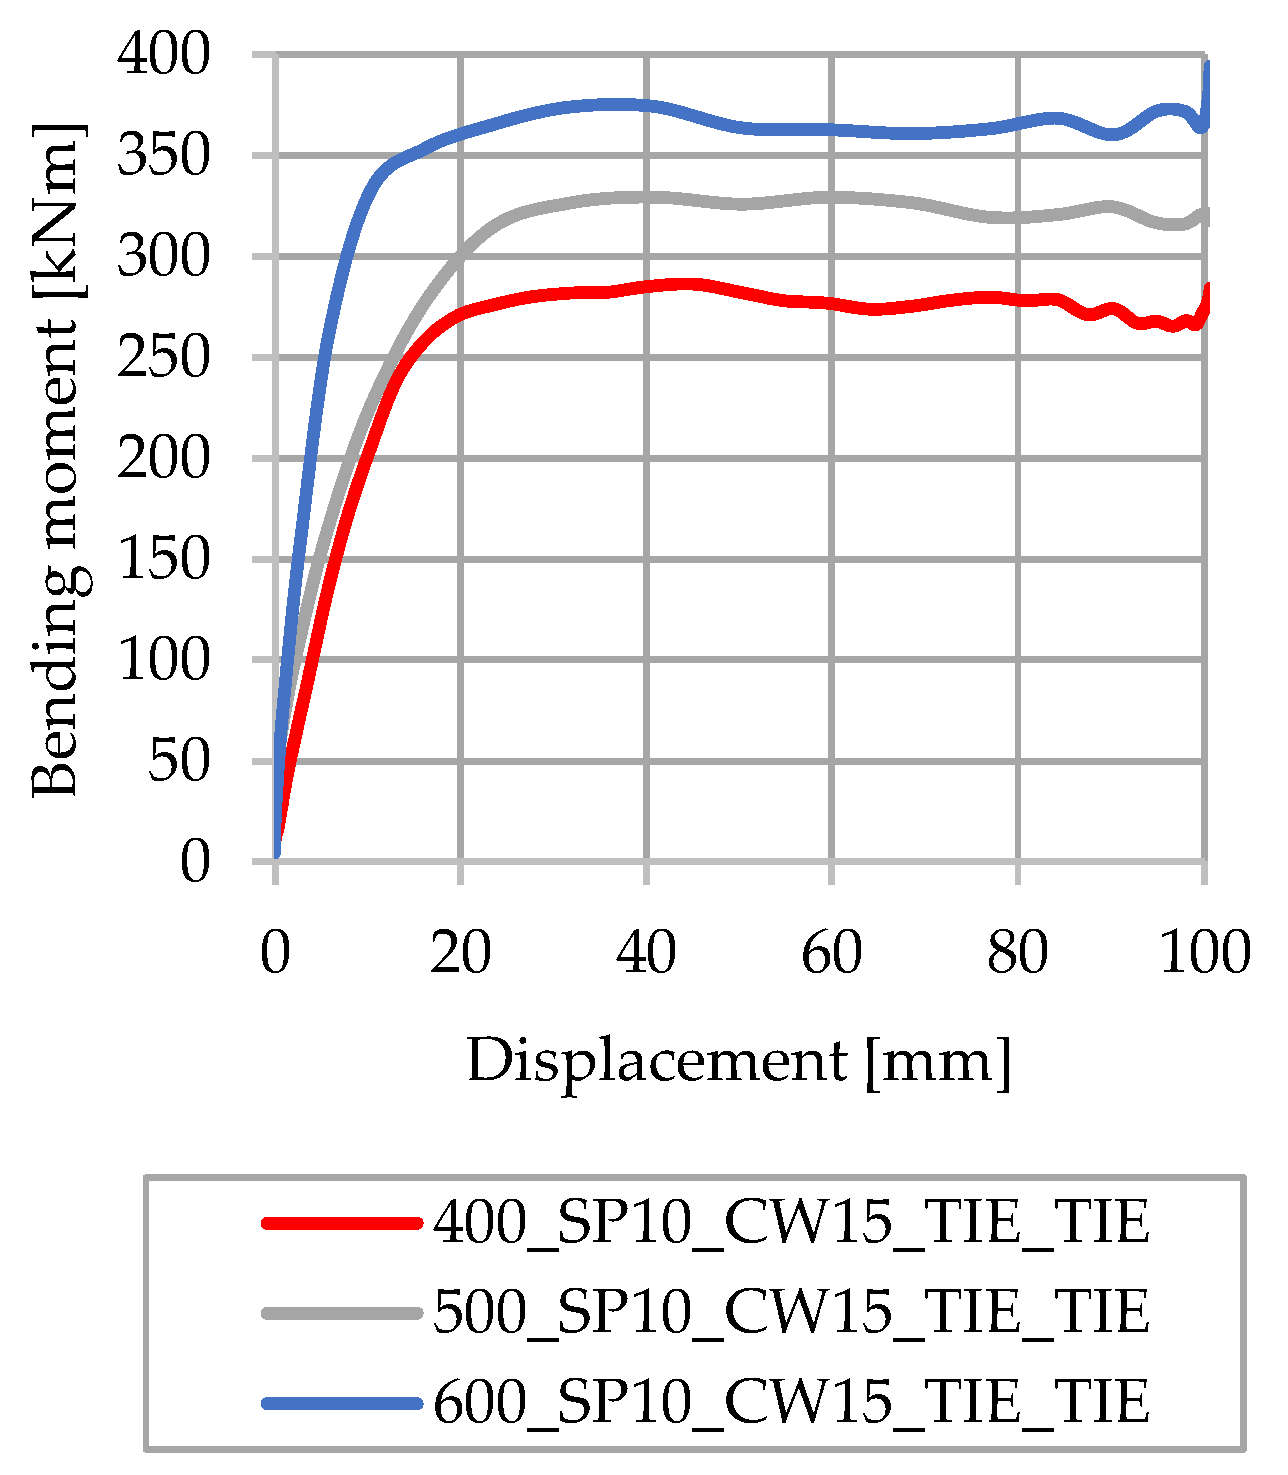
The influence of the steel beam height is analyzed for three different values—400 mm, 500 mm, and 600 mm. In Figure 12, the influence of the steel beam height on models with a full shear connection and when steel elements are tied is shown, (TIE_TIE). The analyzed models have a CW thickness of 1.5 mm. In accordance with the presented results of the numerical model, it is concluded that the influence of the steel beam height is significant. Increasing the steel beam height from 400 mm to 500 mm increases the bending capacity to approximately 60 kNm. The same difference is observed between models with a steel beam height of 500 mm and 600 mm. This leads to the conclusion that increasing the steel beam height to 200 mm increases the bending resistance to approximately 100 kNm.

3.6. Influence of the Degree of Shear Connection and CW Thickness

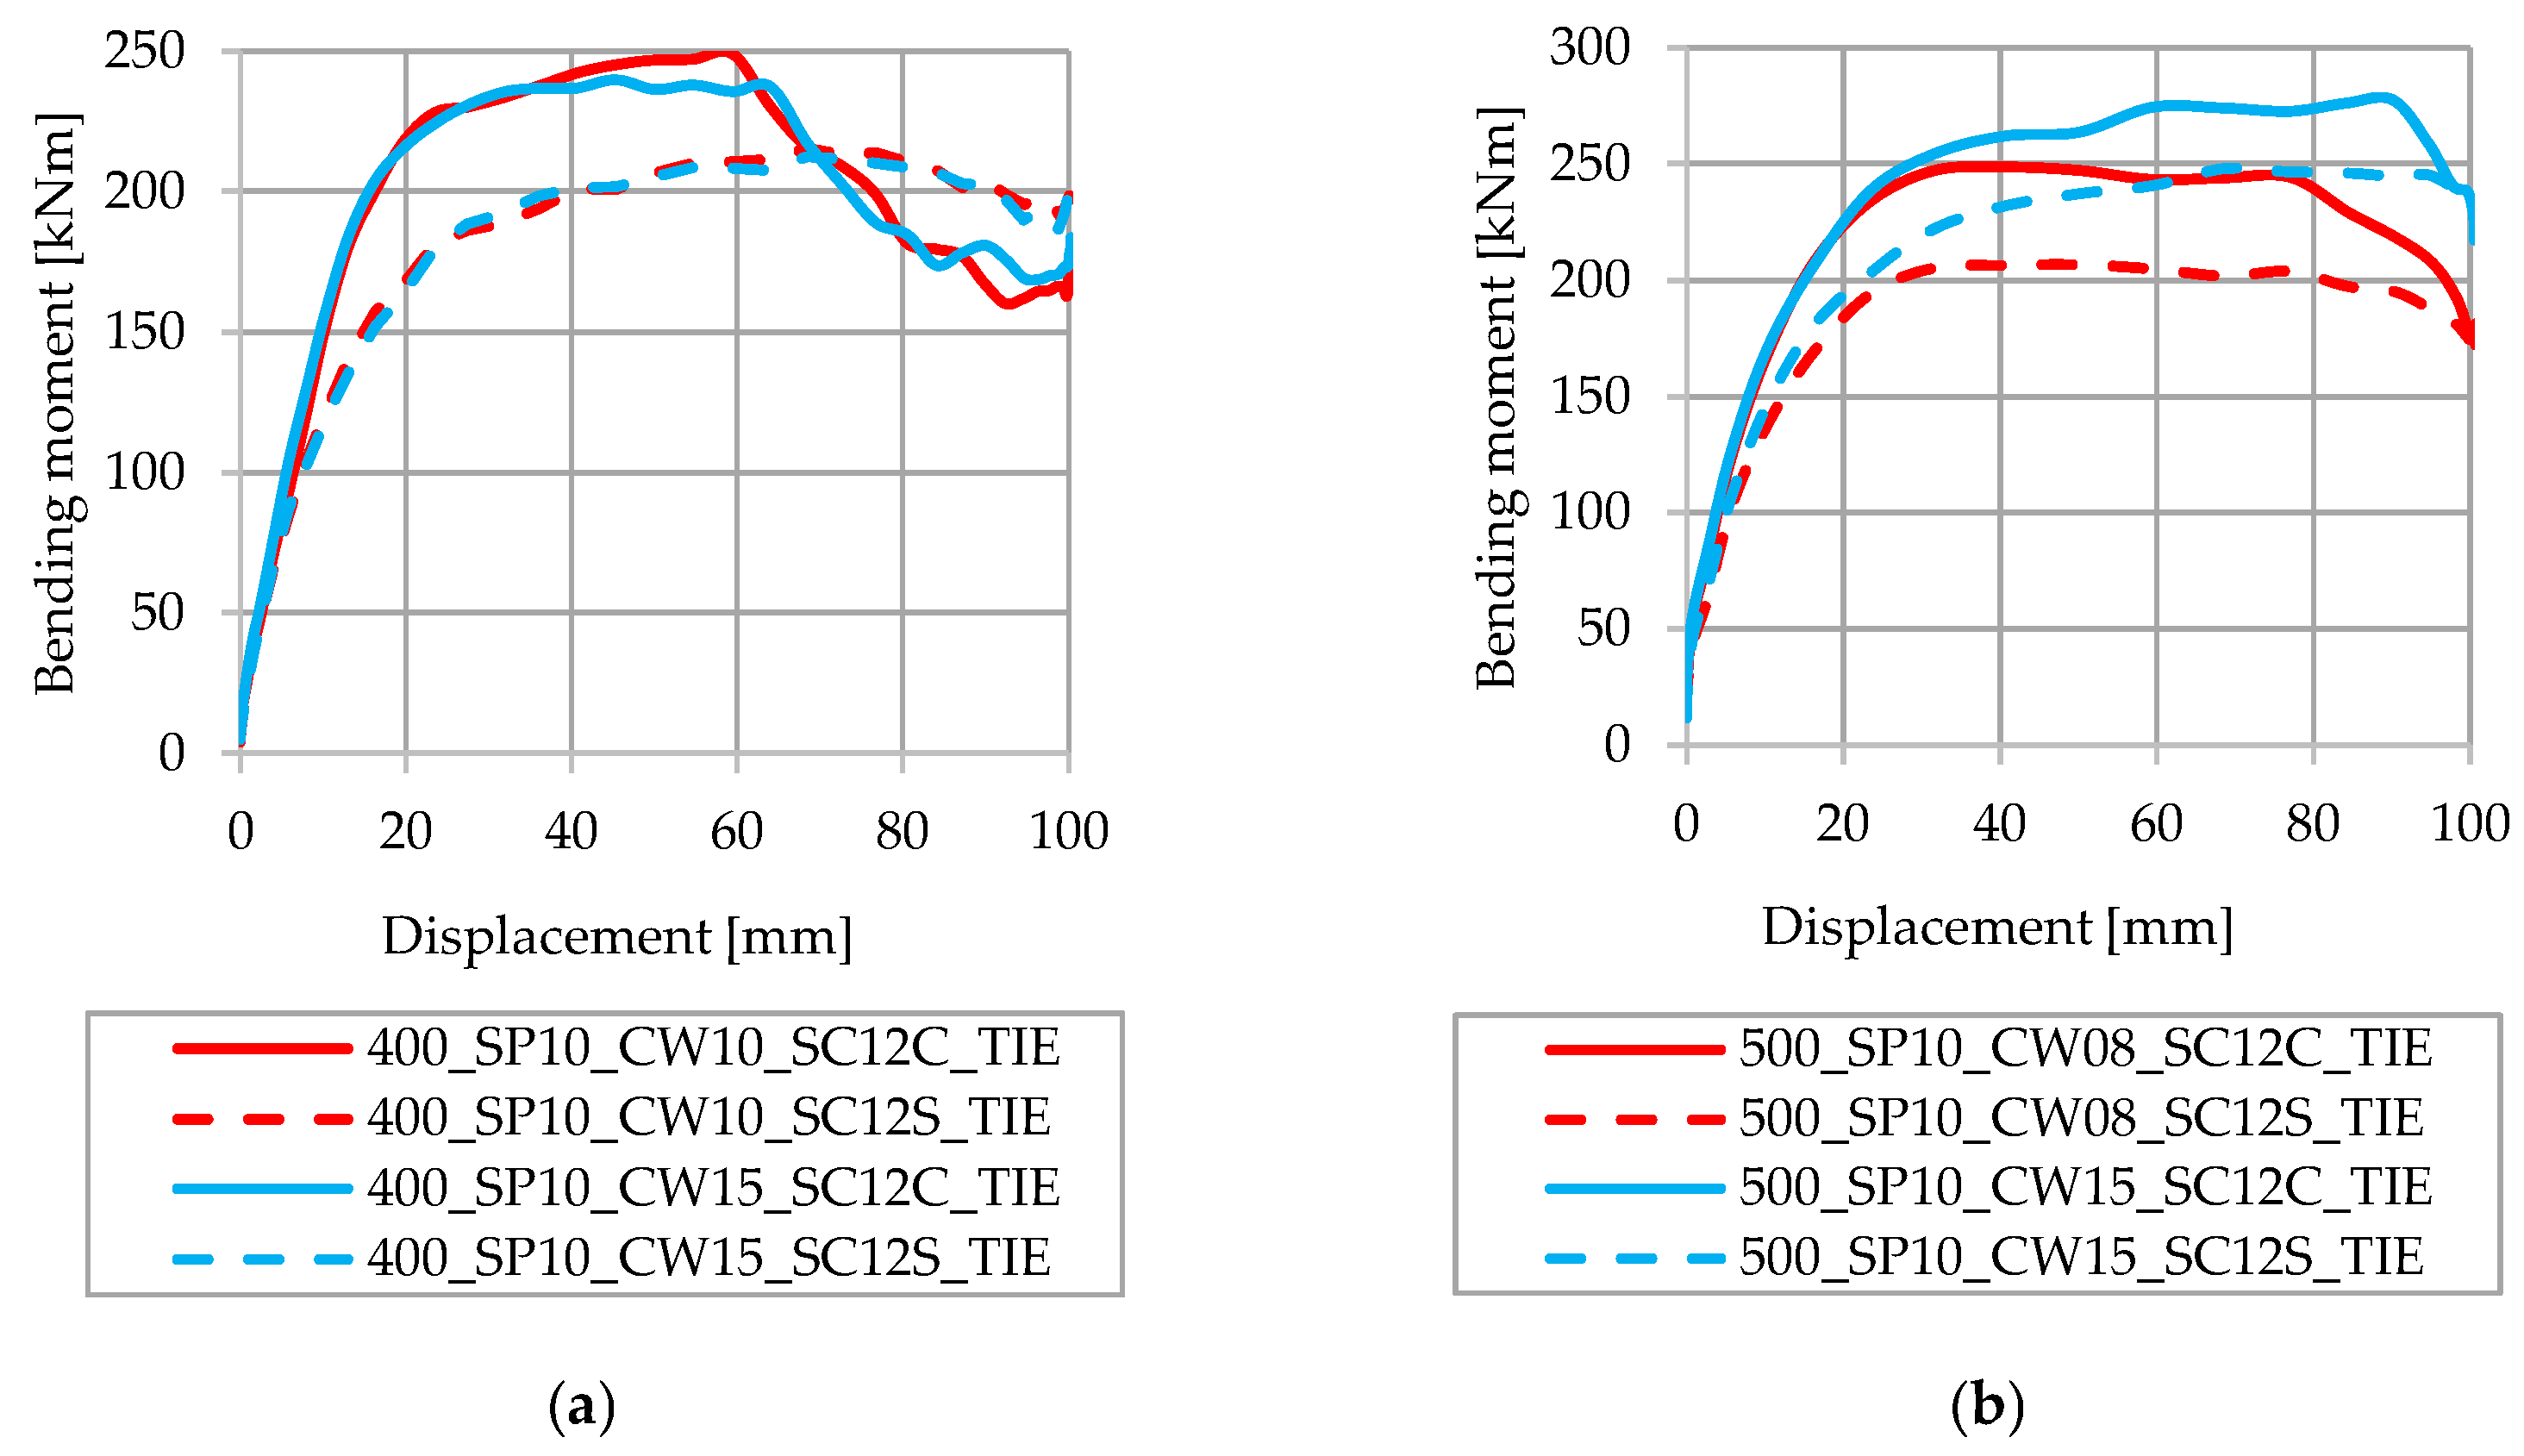
Figure 13 shows models with different corrugated web thicknesses and degrees of shear connection. Figure 13a shows models with a steel beam height of 400 mm and CW thicknesses of 1.0 mm (400_SP10_CW10) and 1.5 mm (400_SP10_CW15). After comparing models with the same degree of shear connection and different CW thicknesses, it is concluded that CW thickness does not impact models with a partial shear connection. Figure 13b shows models with a steel beam height of 500 mm and CW thicknesses of 0.8 mm (500_SP10_CW08) and 1.5 mm (500_SP10_CW15). A slightly greater difference in bending resistance is shown, and it is assumed that this is a consequence of the more significant difference in CW thicknesses, compared with the results shown in Figure 13a.

3.7. Influence of CW Thickness and Spot Weld Density

3.7.1. Full Degree of Shear Connection

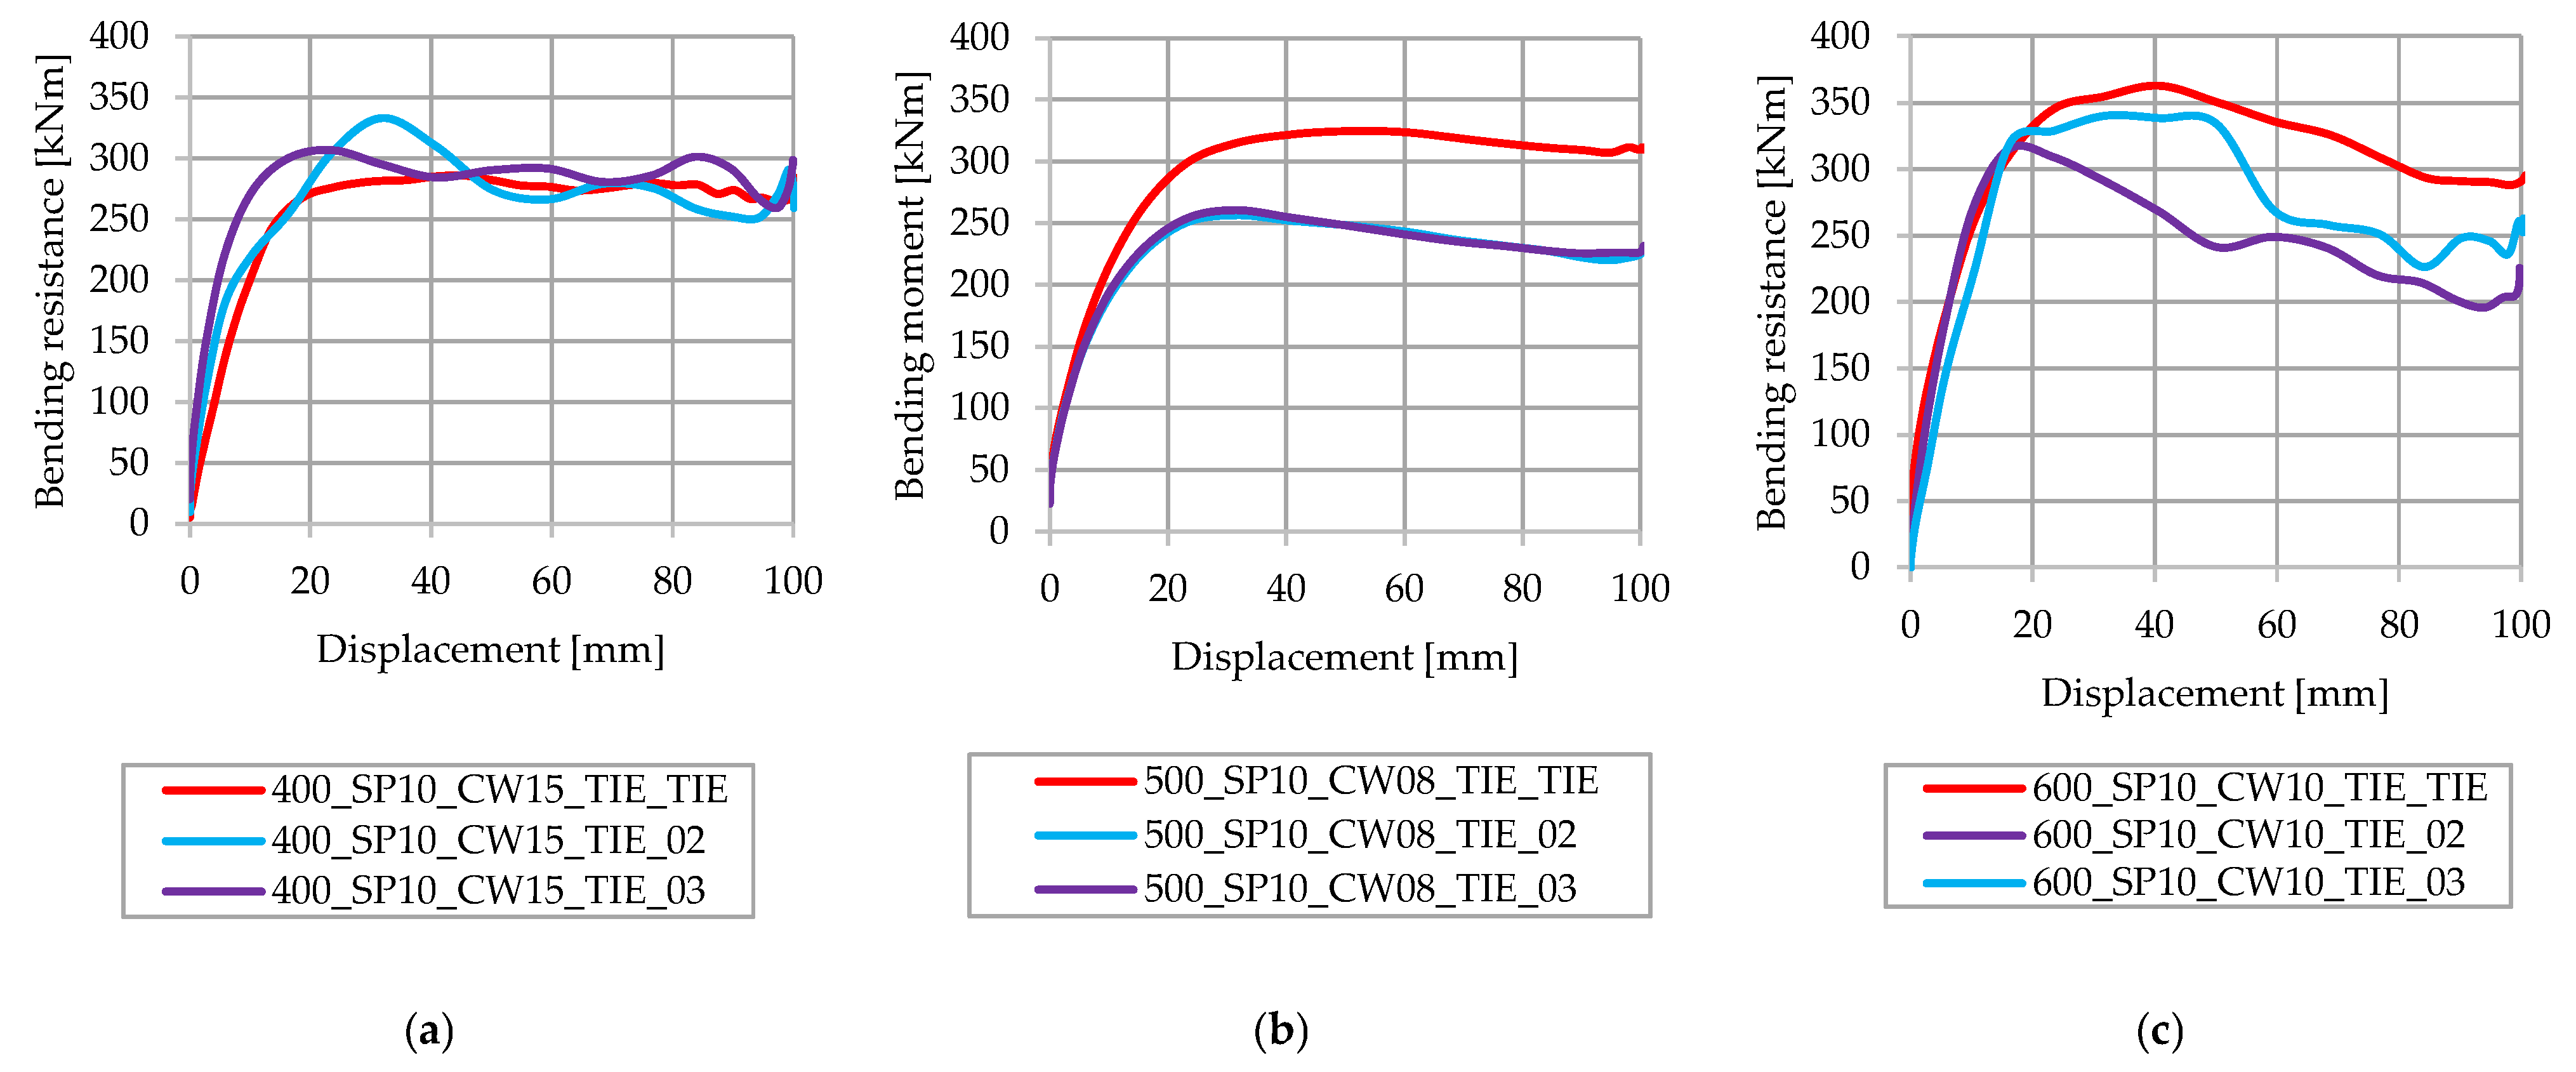
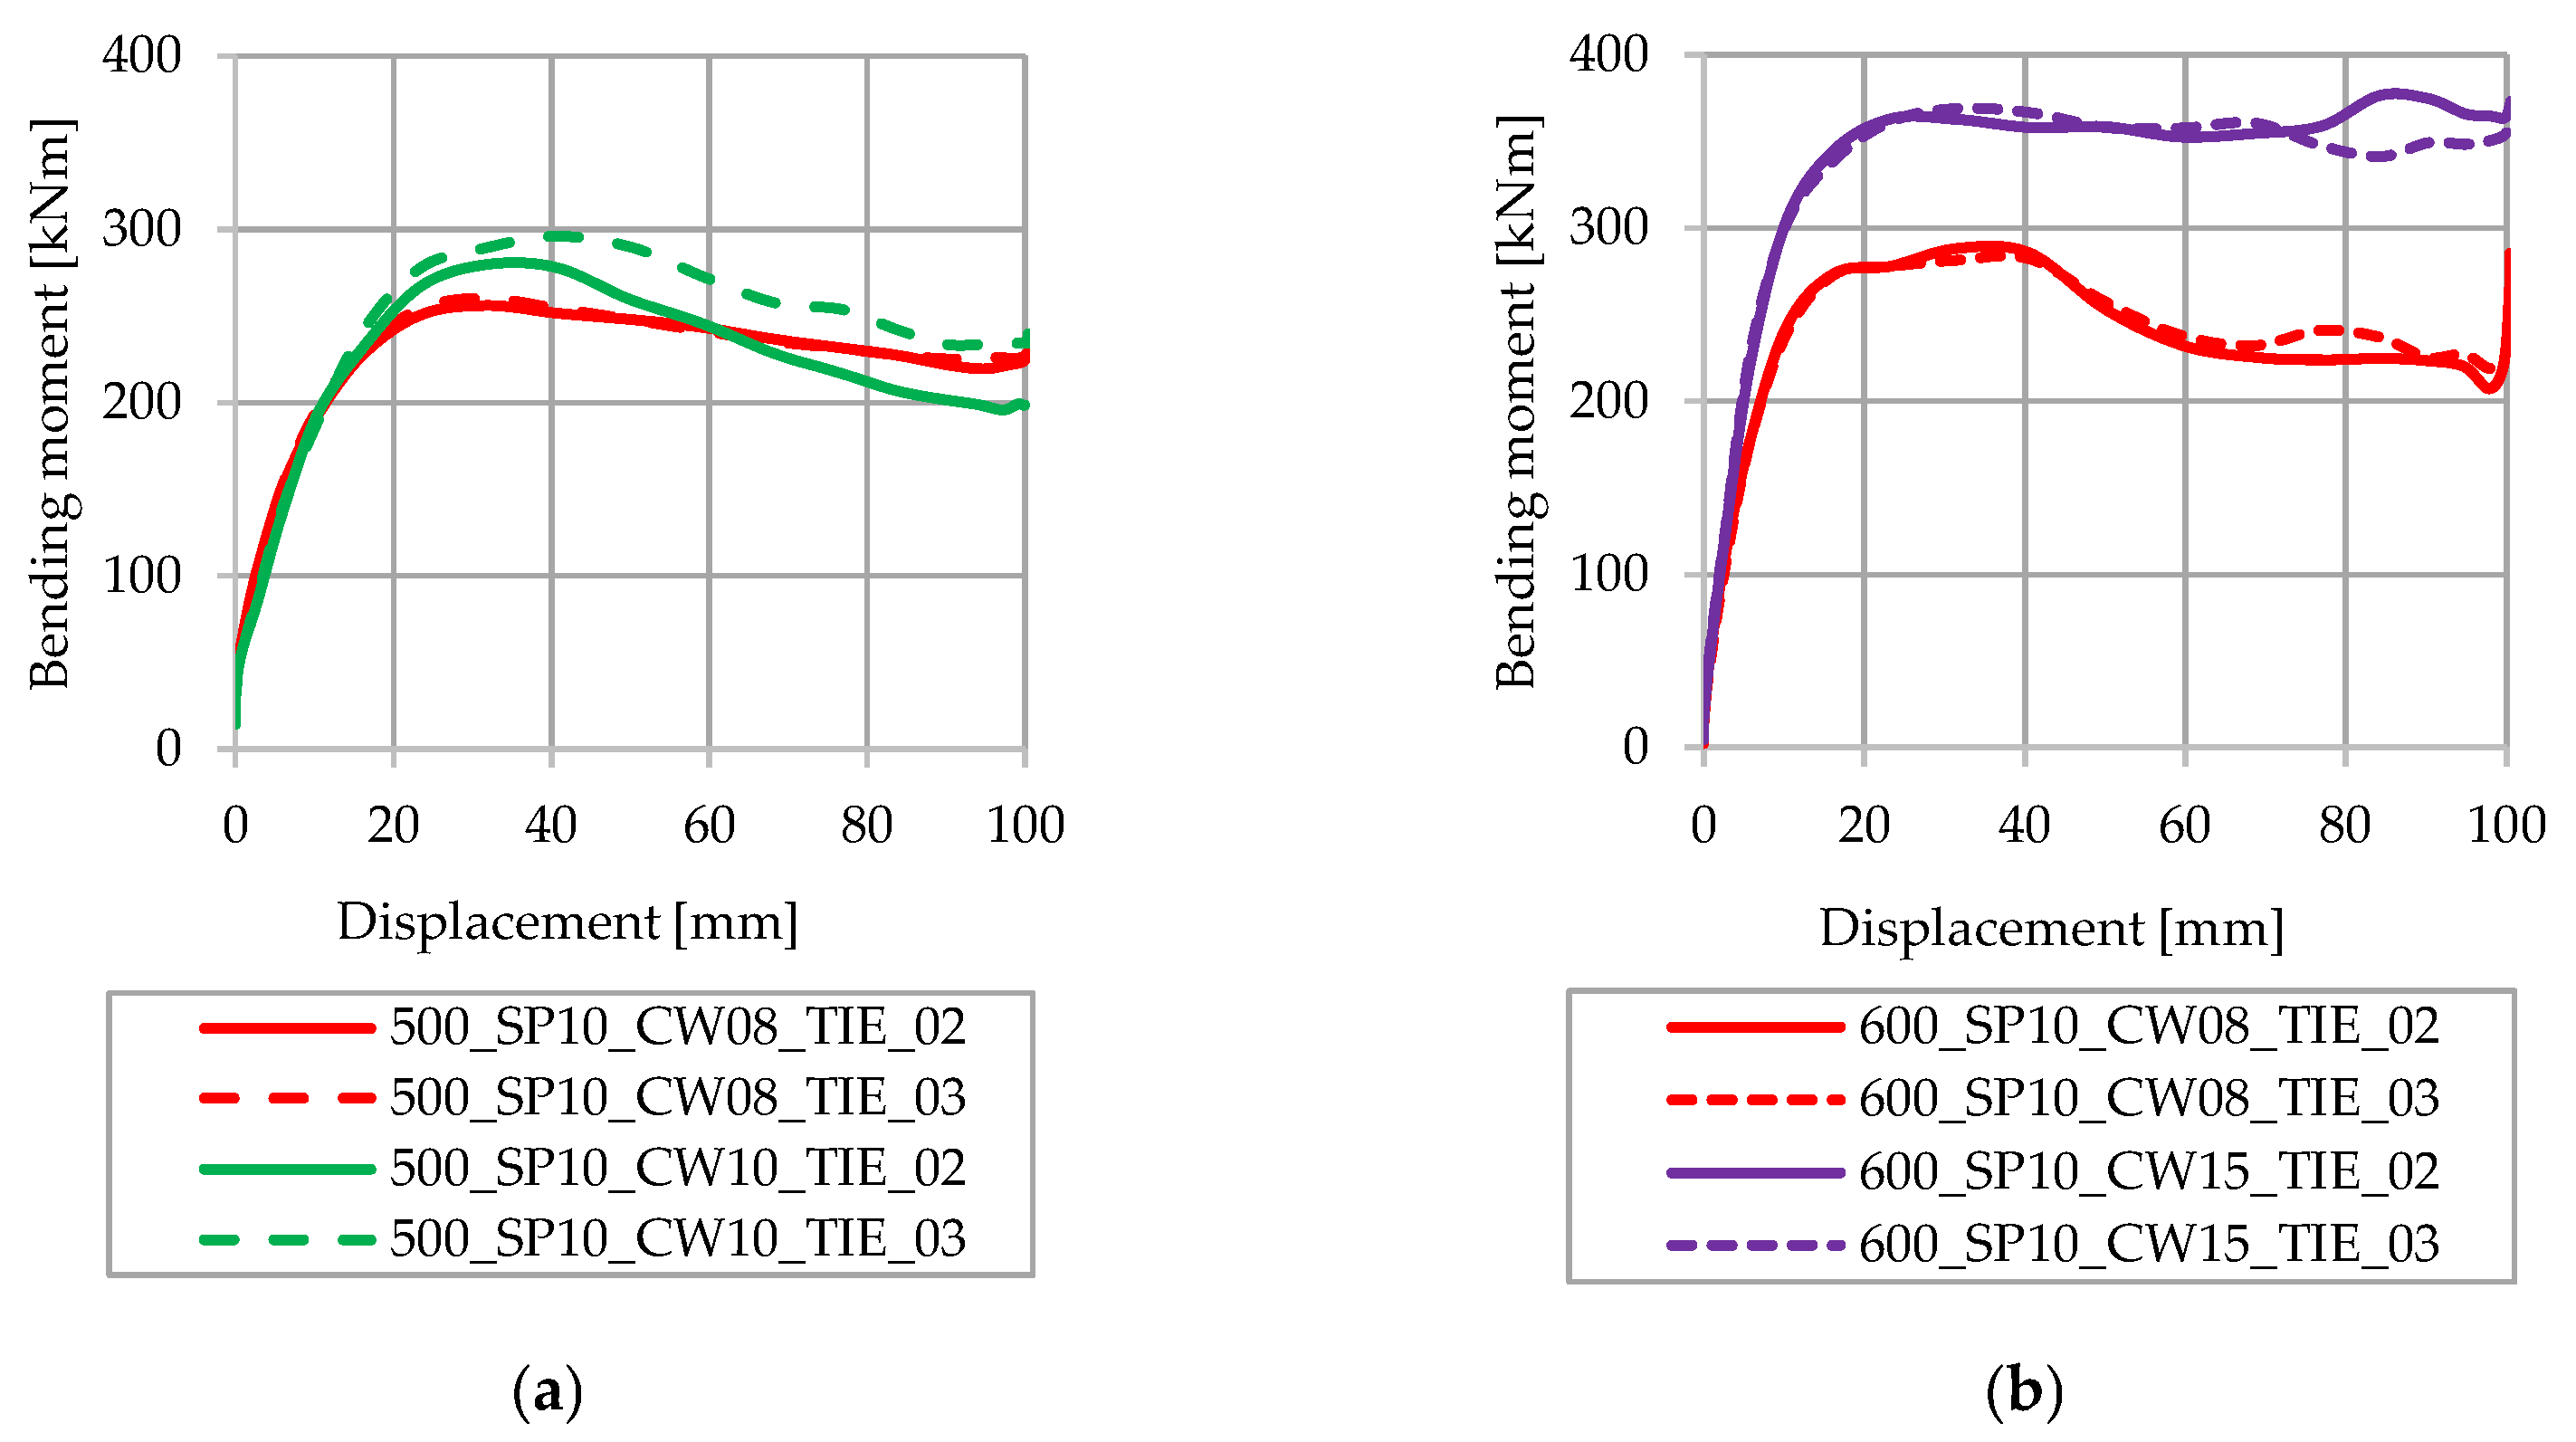
The influence of spot weld density in the case of a full degree of shear connection is shown in Figure 14 for models with steel beam heights of 500 mm and 600 mm. Figure 14a shows the results for a steel beam with a height of 500 mm and CW thicknesses of 0.8 mm (500_SP10_CW08) and 1.0 mm (500_SP10_CW10); Figure 14b shows the results for a steel beam with a height of 600 mm and CW thickness of 0.8 mm (600_SP10_CW08) and 1.5 mm (600_SP10_CW15). In Figure 14a, when comparing models with a CW thickness of 1.0 mm, a difference of 20 kNm is observed, and for the models with a CW thickness of 0.8 mm, a difference between models with different numbers of spot welds does not exist. In Figure 14b, the difference between models with the same CW thickness and different spot weld densities is negligible, but a greater difference is observed in models with the same spot weld density and different CW thicknesses, approximately 80 kNm. This difference can be explained by the fact that models in Figure 14b exhibit greater differences in terms of CW thickness.
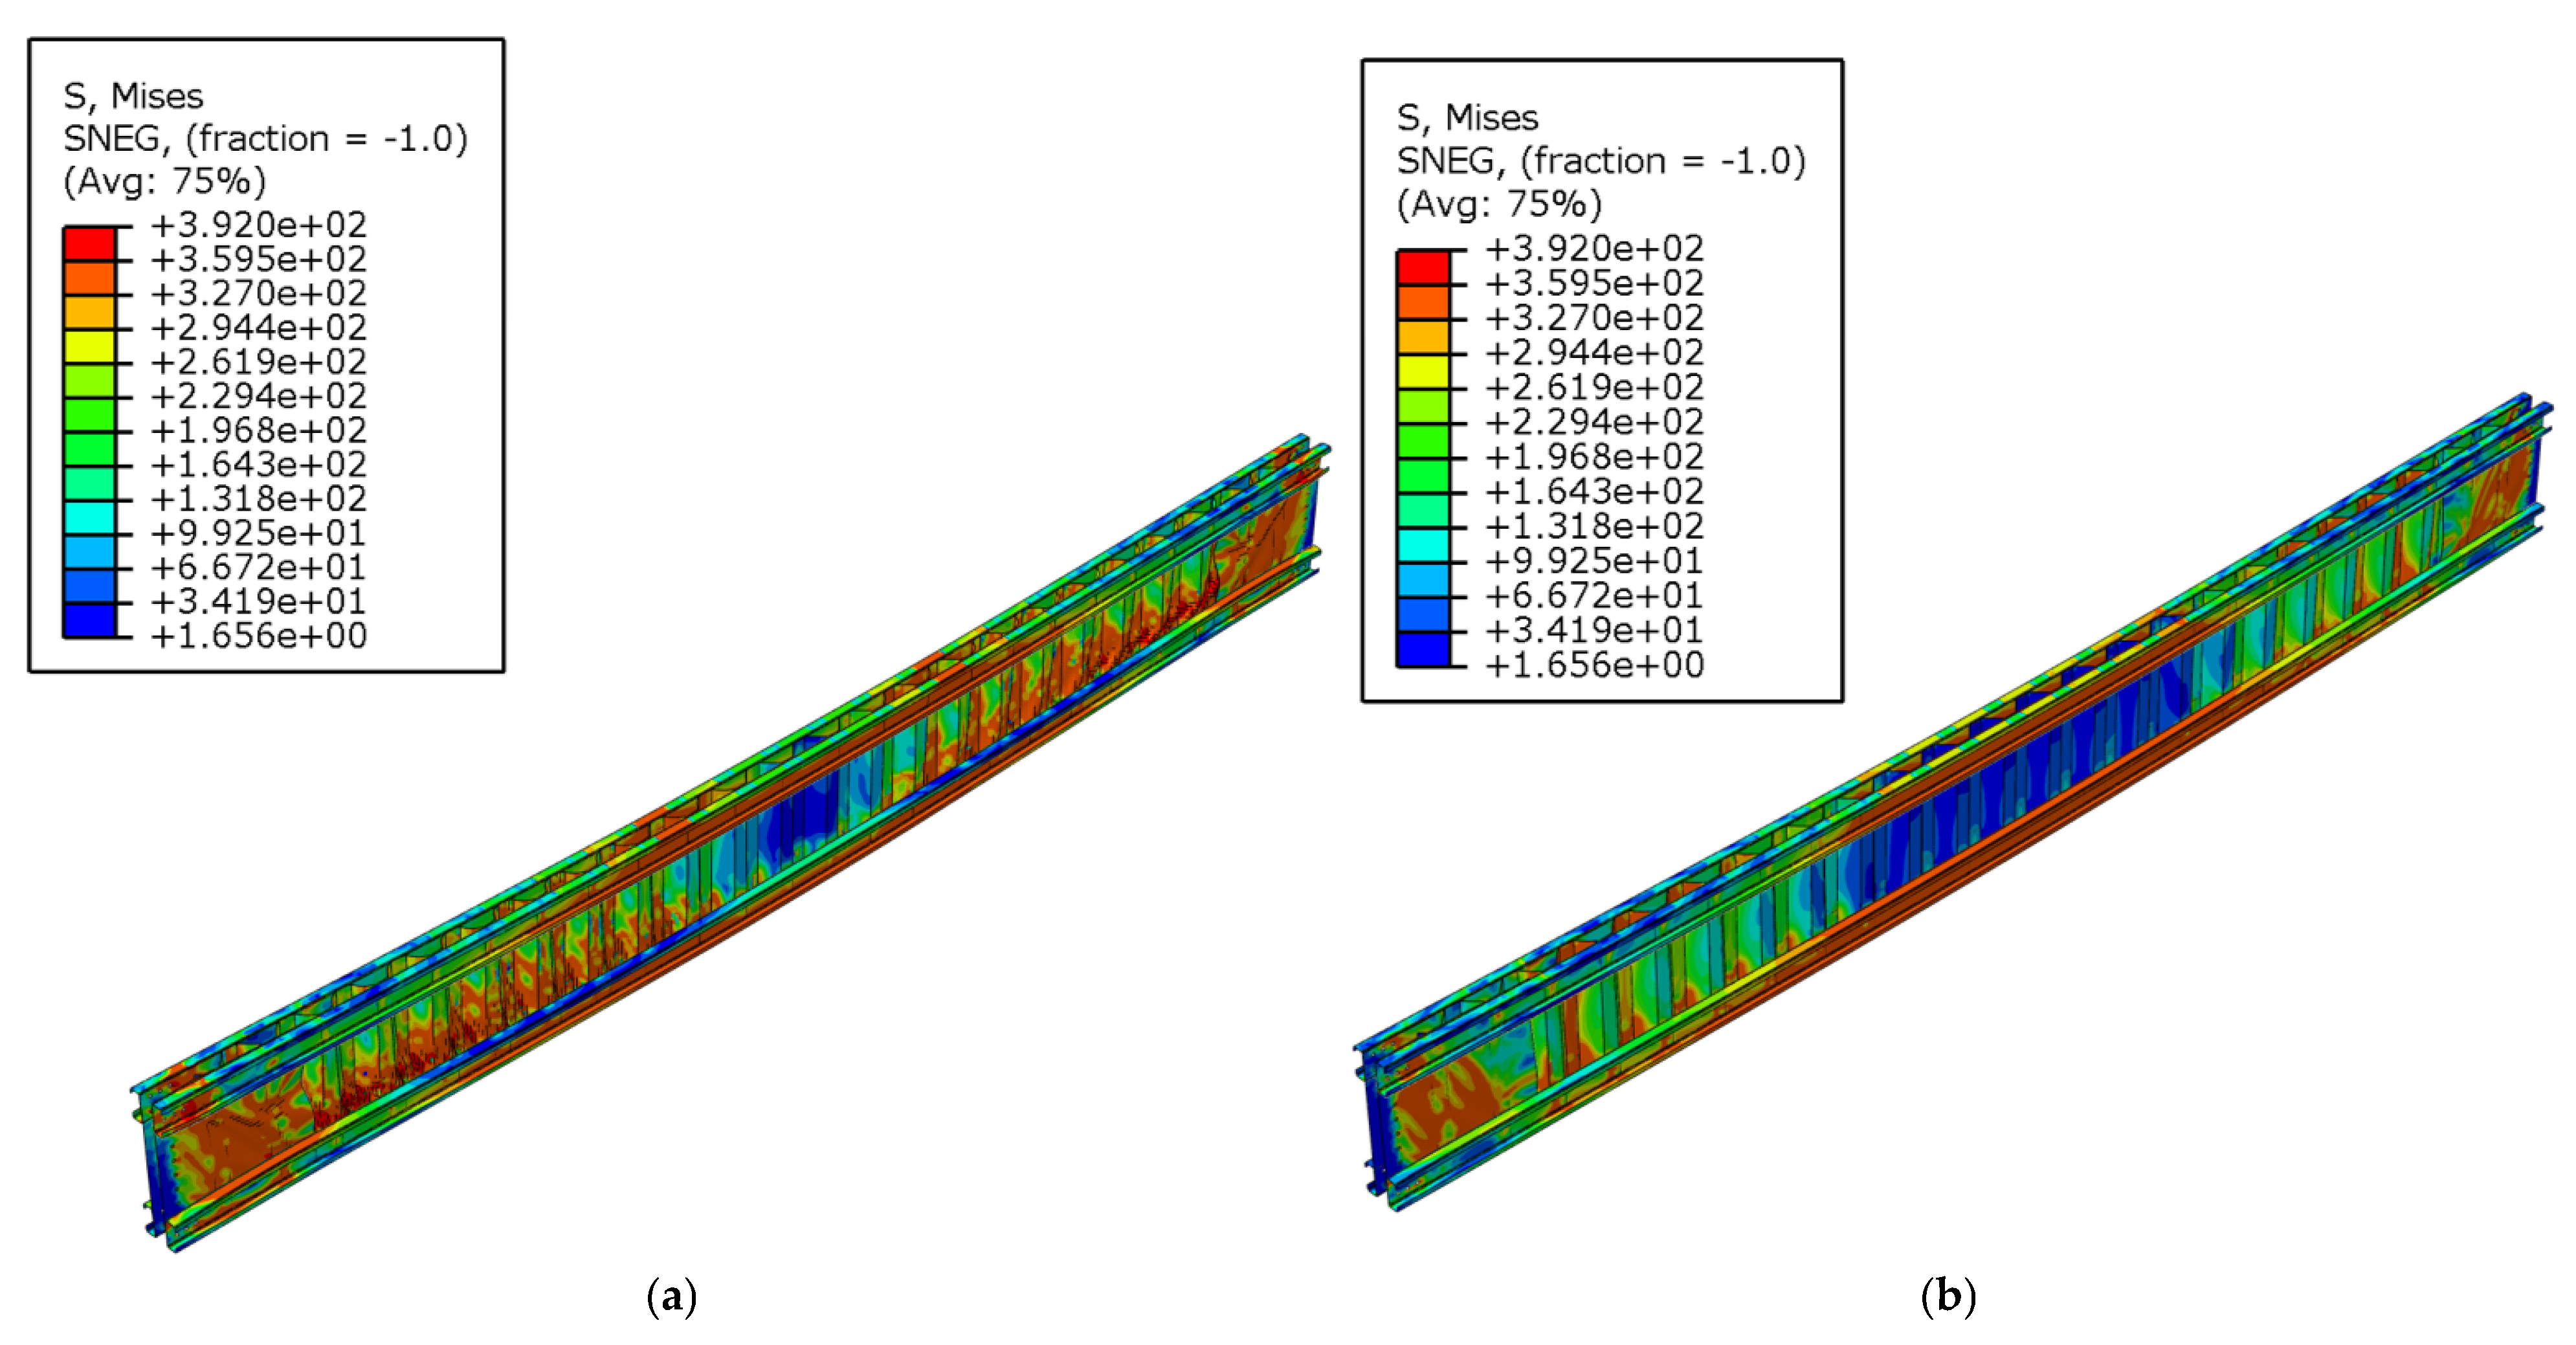
Figure 15a,b show the deformed shape and von Mises stress fields of the steel beams of the 600_SP10_CW08_TIE_02 and 600_SP10_CW15_TIE_02 models, respectively. Von Mises stresses are shown in the step when failure is observed. In Figure 15a, it is shown how stresses in the area of the CW are increased compared with the results in Figure 15b. The main reason for this concerns the differences between corrugated web thicknesses.

3.7.2. Partial Shear Connection

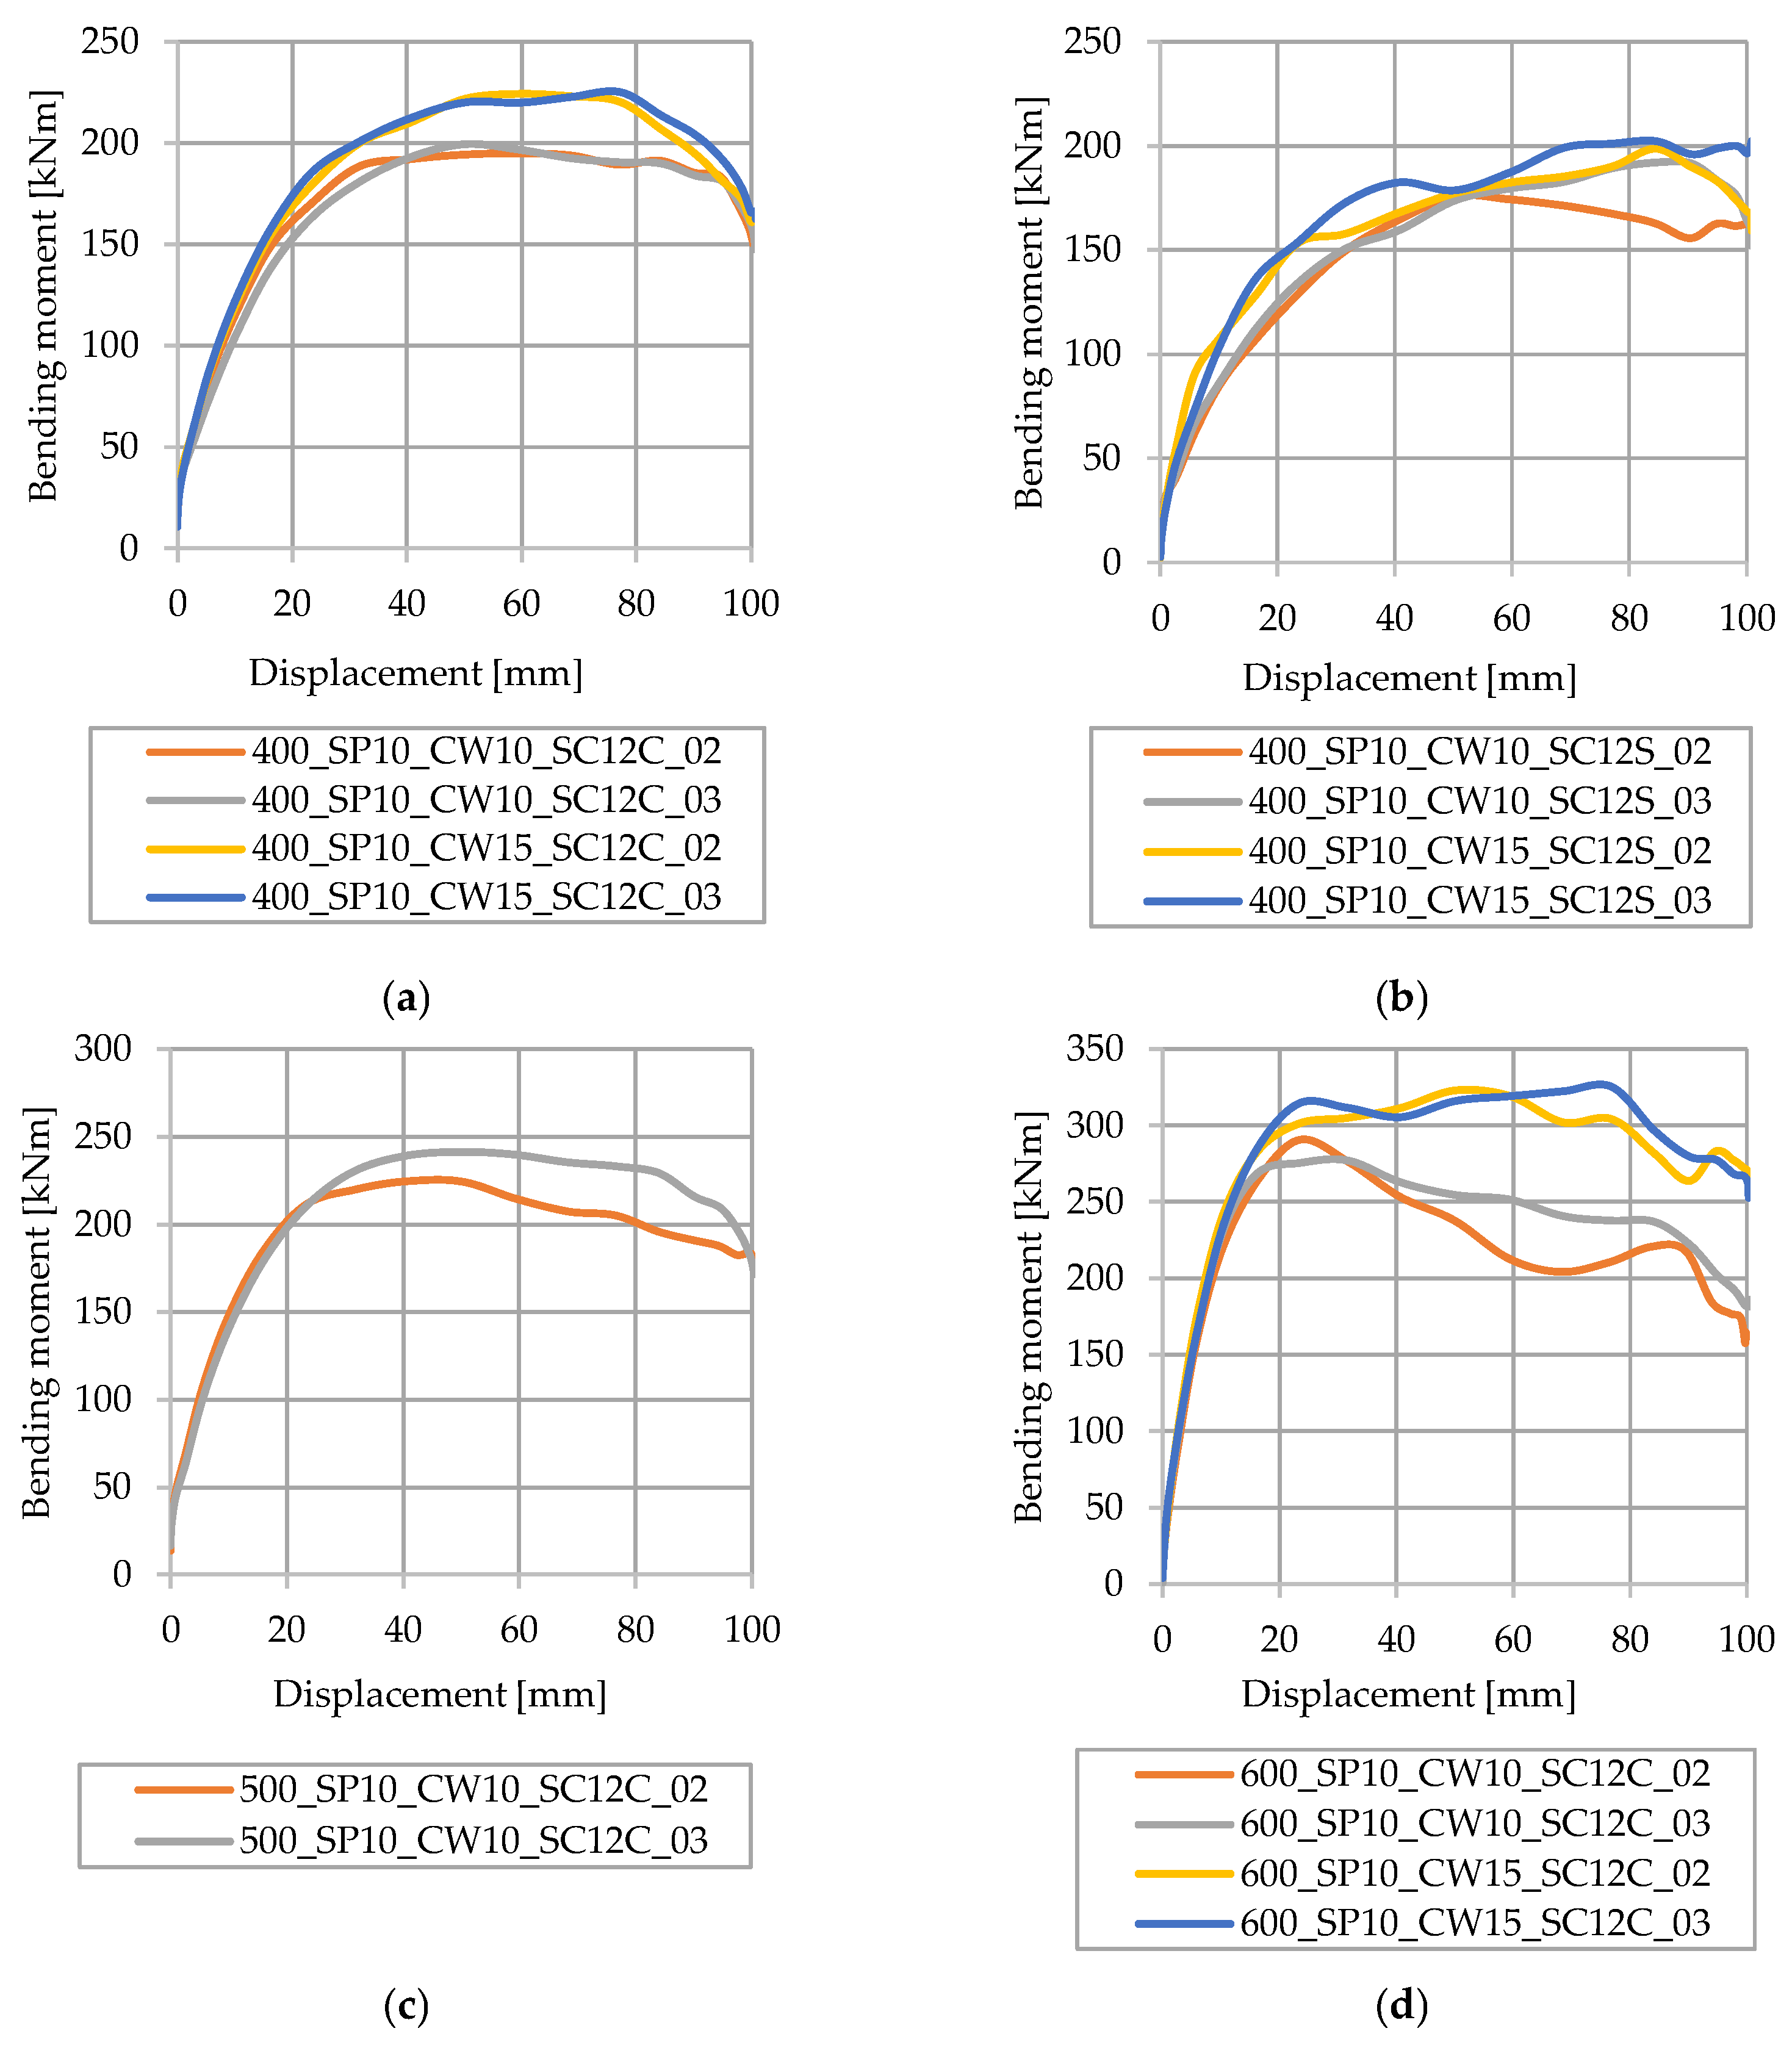
The influence of spot weld density in cases of partial shear connection is shown in Figure 16 with regard to models with steel beam heights of 400 mm, 500 mm, and 600 mm. Different CW thicknesses are analyzed for steel beams of the same height and with the same degree of shear connection. In accordance with the results in Figure 16a, where models with CW thicknesses of 1.0 mm (400_SP10_CW10) and 1.5 mm (400_SP10_CW15) are presented, and which have shear connectors positioned in pairs (SC12C) and steel beam heights of 400 mm, it is concluded that in the analyzed cases, the influence of the CW thickness is 25–30 kNm for the difference in thickness of 0.5 mm. The influence of the spot weld density in the analyzed models is negligible. In Figure 16b, the same thicknesses are analyzed, but the shear connectors are presented in a staggered arrangement (SC12S). Again, the bending capacity difference caused by spot weld density is negligible compared with the impact of CW thickness. In Figure 16c, only the influence of spot weld density is analyzed in models with a steel beam height of 500 mm and a CW thickness of 1.0 mm when the shear connectors are arranged in pairs (500_SP10_CW10_SC12C). The difference in bending capacity is approximately 20 kNm. Figure 16d shows the analyzed influence of a steel beam height of 600 mm, a CW thickness of 1.0 mm (600_SP10_CW10) and 1.5 mm (600_SP10_CW15), and an arrangement of shear connectors in pairs (SC12C). After observing models with the same CW thicknesses, the difference was found to be negligible, but after observing models with the same spot weld densities and different CW thicknesses, the difference is approximately 15%.
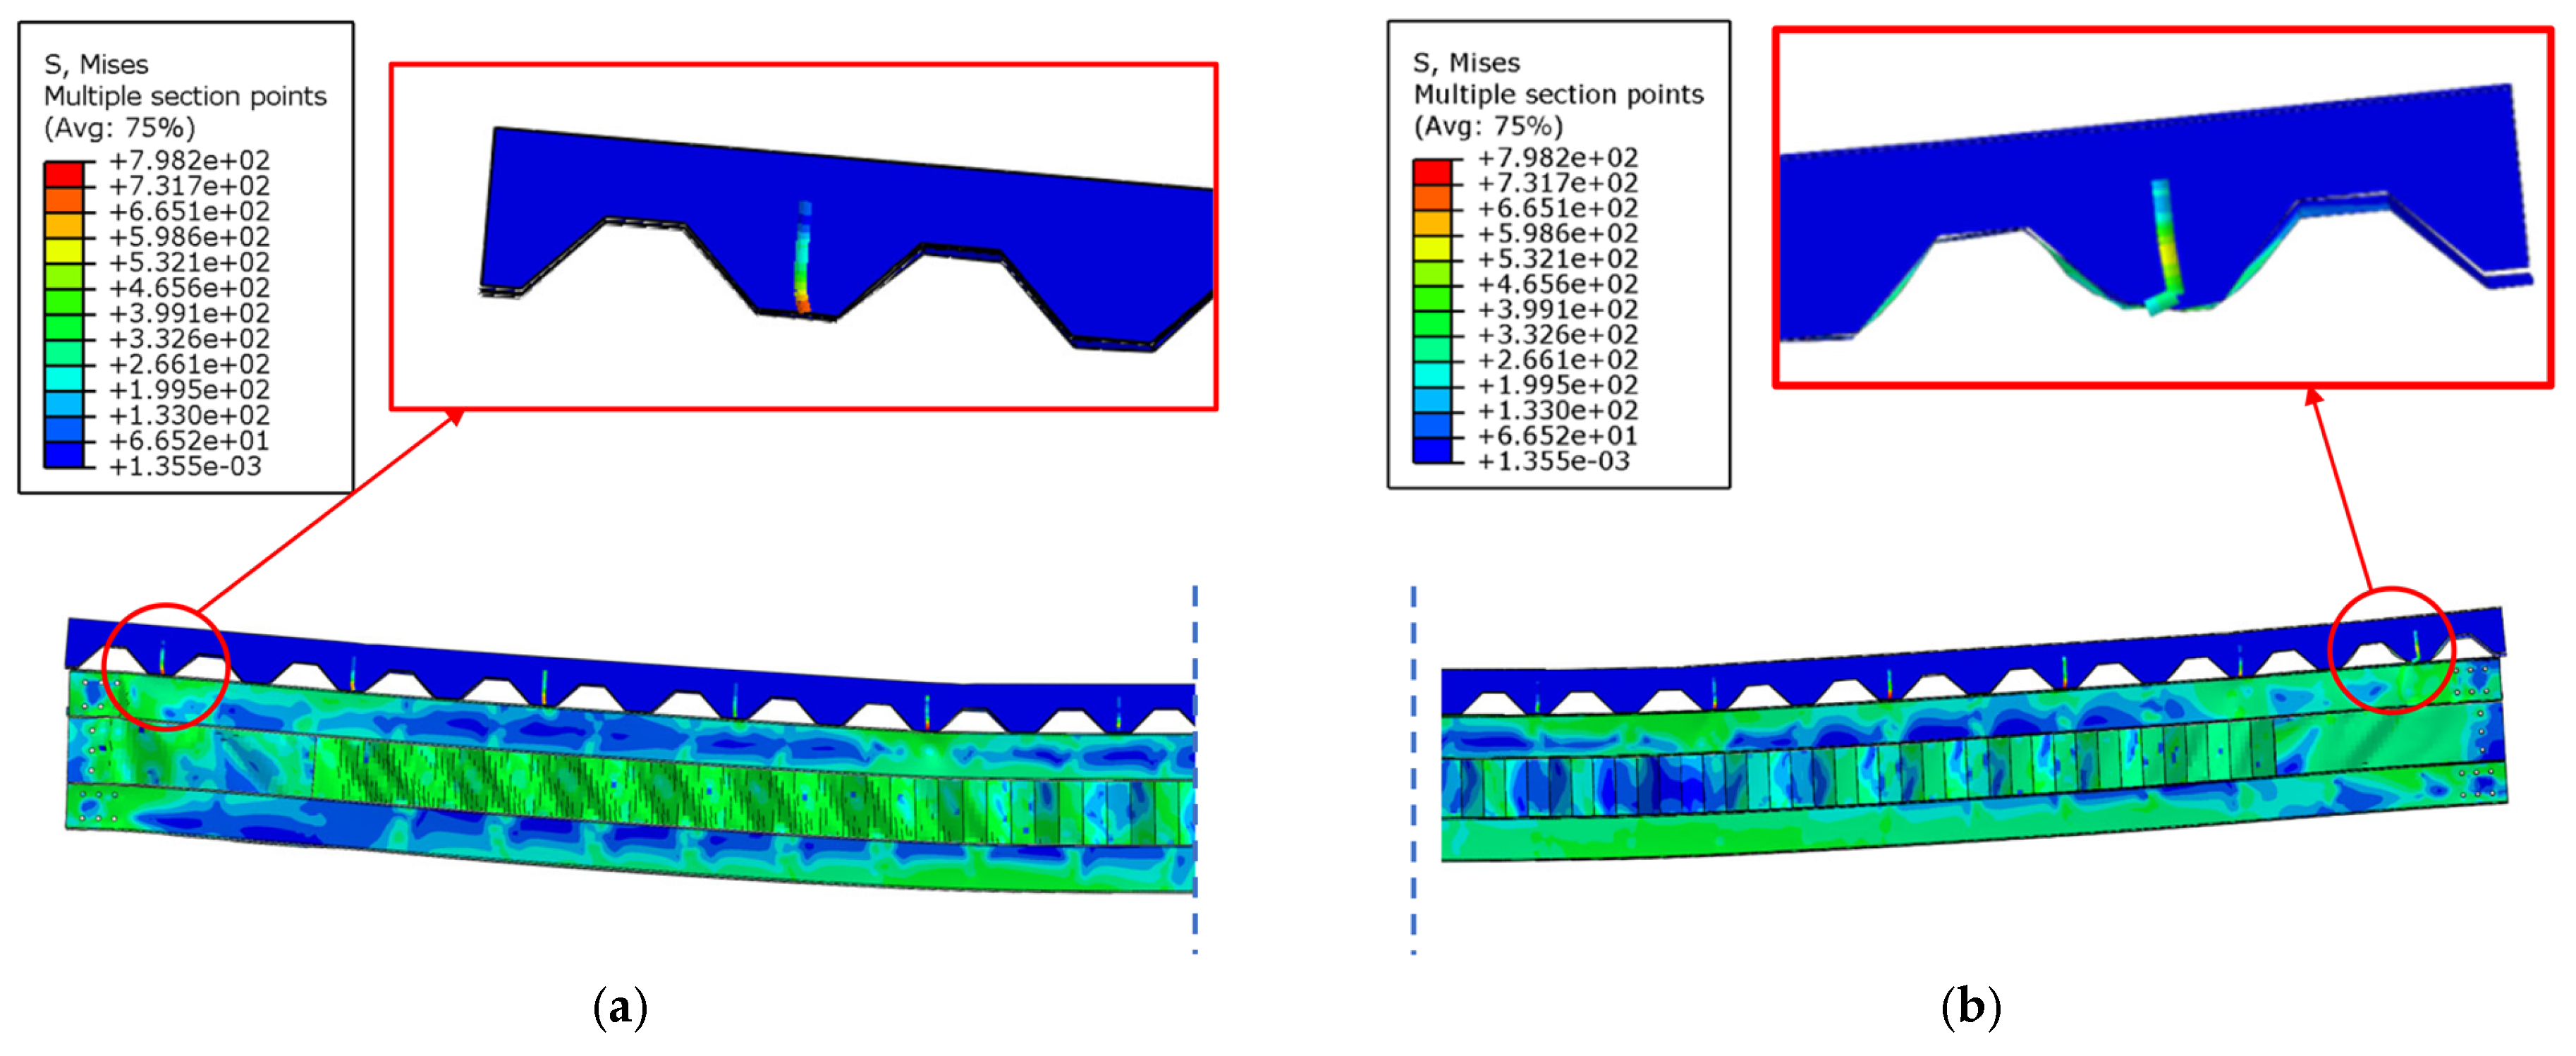
Figure 17 shows the deformed shape and von Mises stress in model 400_SP10_CW10_SC12S_02 during the last stage of analysis. The view cut was made in the longitudinal plane, wherein shear connectors were placed in a staggered arrangement. In Figure 17a, one side of the shear connectors is shown, and in Figure 17b, the other C profile with shear connectors is shown in its final stage. It is evident that the shear connector on one side of the beam failed.

3.8. Influence of the Steel Beam Height on Models with Partial Shear Connections and Different Spot Weld Densities

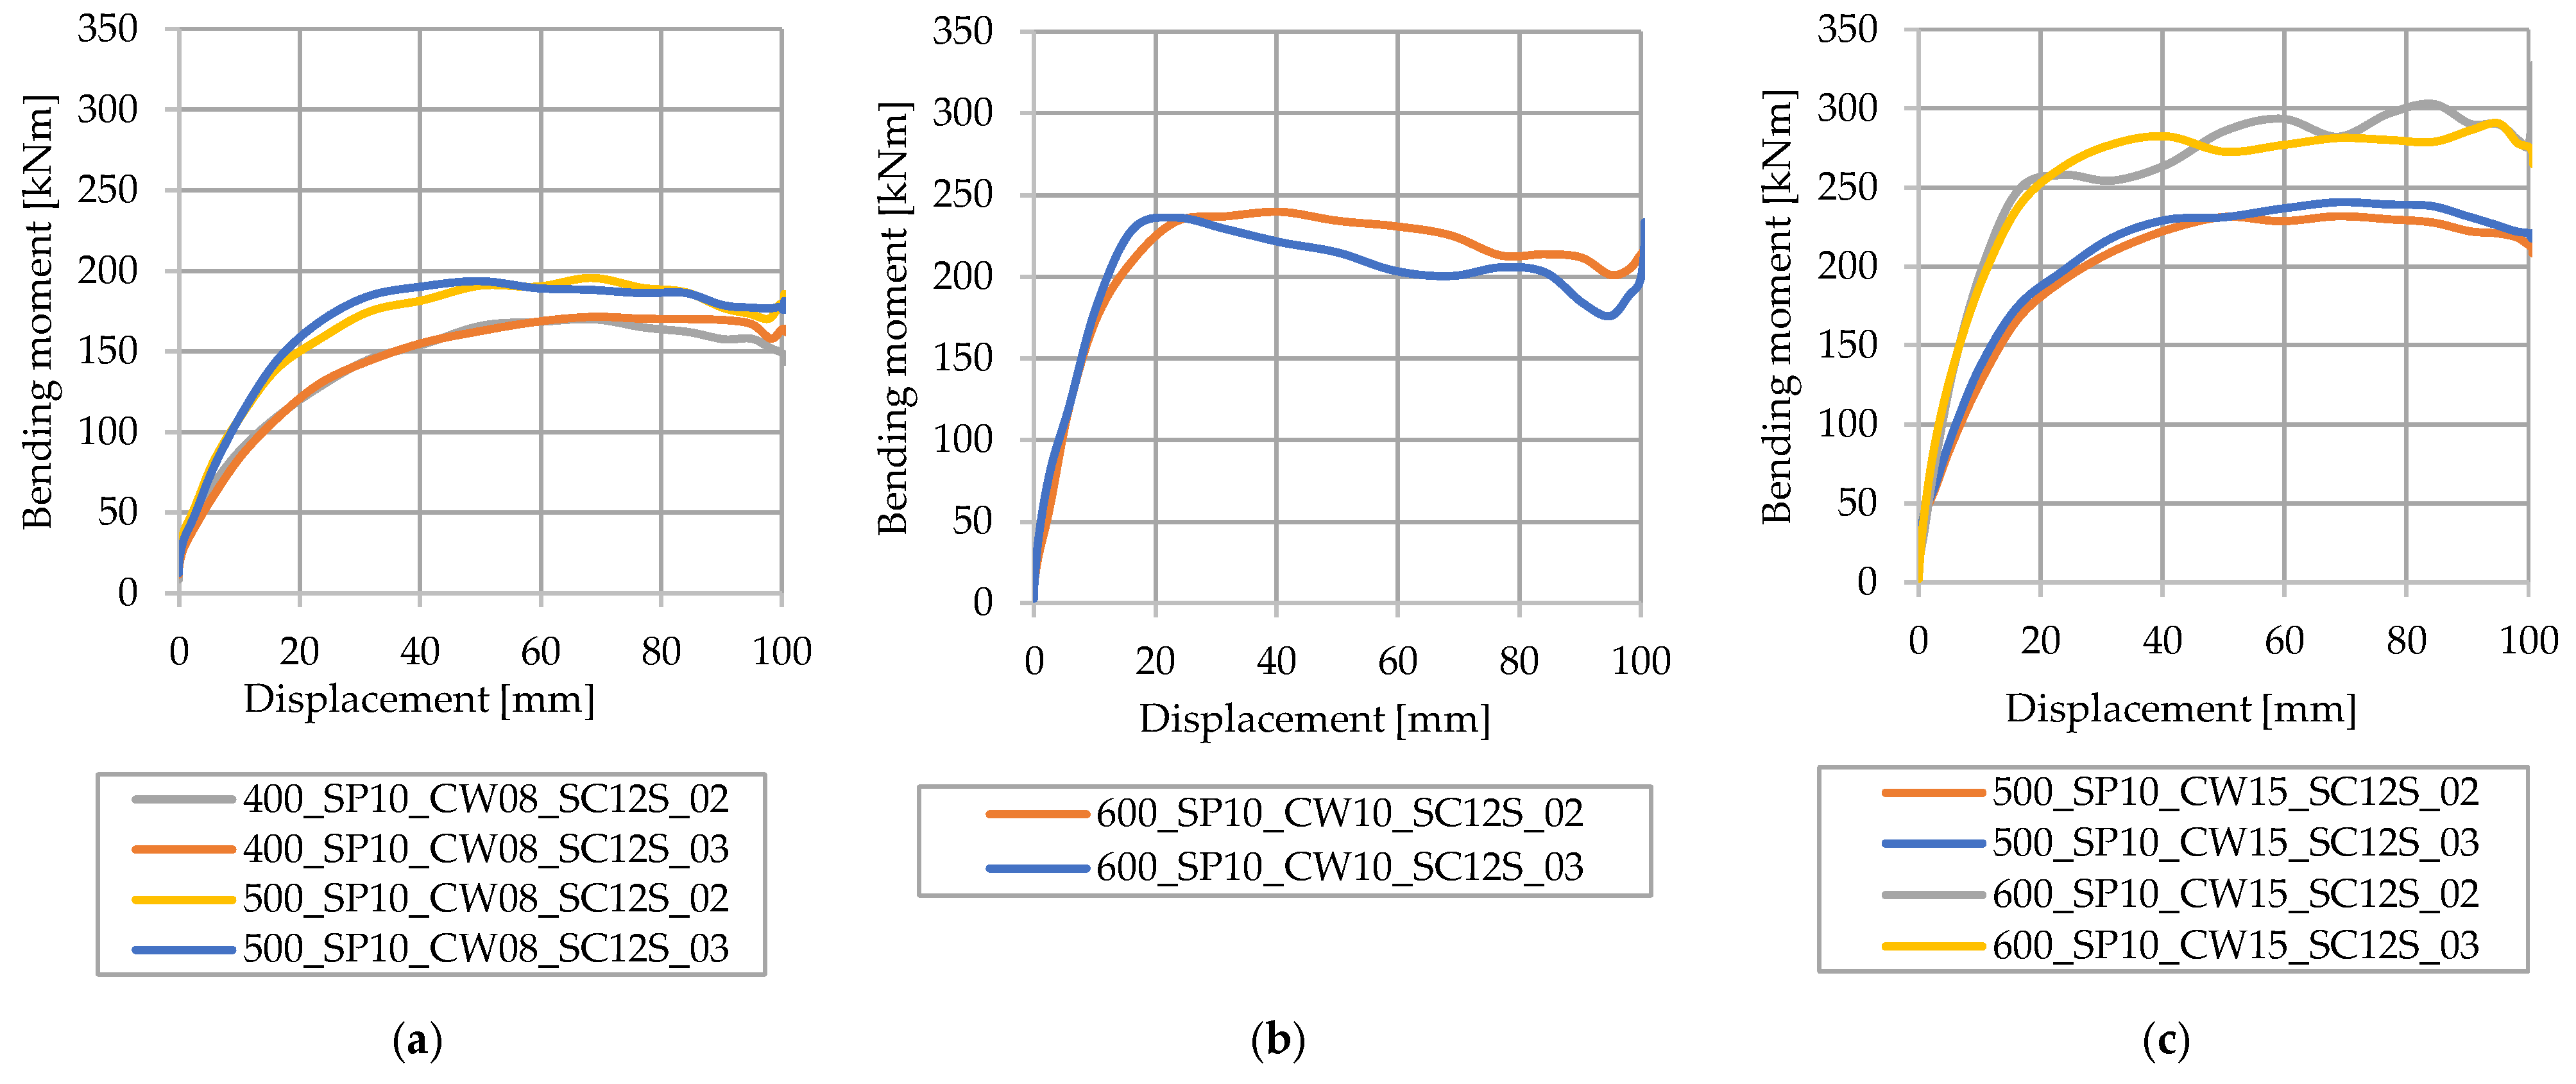
The influence of steel beam height on models with partial shear connections and different spot weld densities is shown in Figure 18.
A comparison of models with the same steel beam height is shown in Figure 18a; it is concluded that spot weld density does not have an influence on the bending capacity of the analyzed steel beam with a CW thickness of 0.8 mm. To confirm the aforementioned conclusion, Figure 18b shows results for the steel beam height of 600 mm and CW thickness of 1.0 mm. The impact of the spot weld density is still negligible. On the other hand, in Figure 18c, models with a CW thickness of 1.5 mm are shown, and some small differences in bending capacity, up to approximately 15%, between beams of the same heights, can be observed.

4. Comparison of Analytical and Numerical Results

Analytical approaches are divided into three categories depending on the degree of shear connection and propped/unpropped construction in non-linear bending resistance cases. It is necessary to emphasize the fact that in the analytical approaches, it is not possible to take into account the thickness of the CW, and it is not possible to consider the type of connection between steel elements, nor the number of spot welds. For that reason, in the comparison of analytical and numerical results, the decisive parameters for model selection are the steel beam height and the degree of shear connection. Results are divided into subchapters 4.1–4.3, in accordance with the steel beam height.
For models with a shear connection secured with a tie constraint (which constitutes a full shear connection), bending resistance is calculated in accordance with Equation (2) to ascertain the plastic resistance. For partial shear connections (when shear connectors are positioned in pairs or in a staggered arrangement), bending resistances are calculated in accordance with Equations (3), (16) and (17), to find the linear elastic–plastic or non-linear elastic resistance, respectively.

4.1. Steel Beam Height of 400 mm

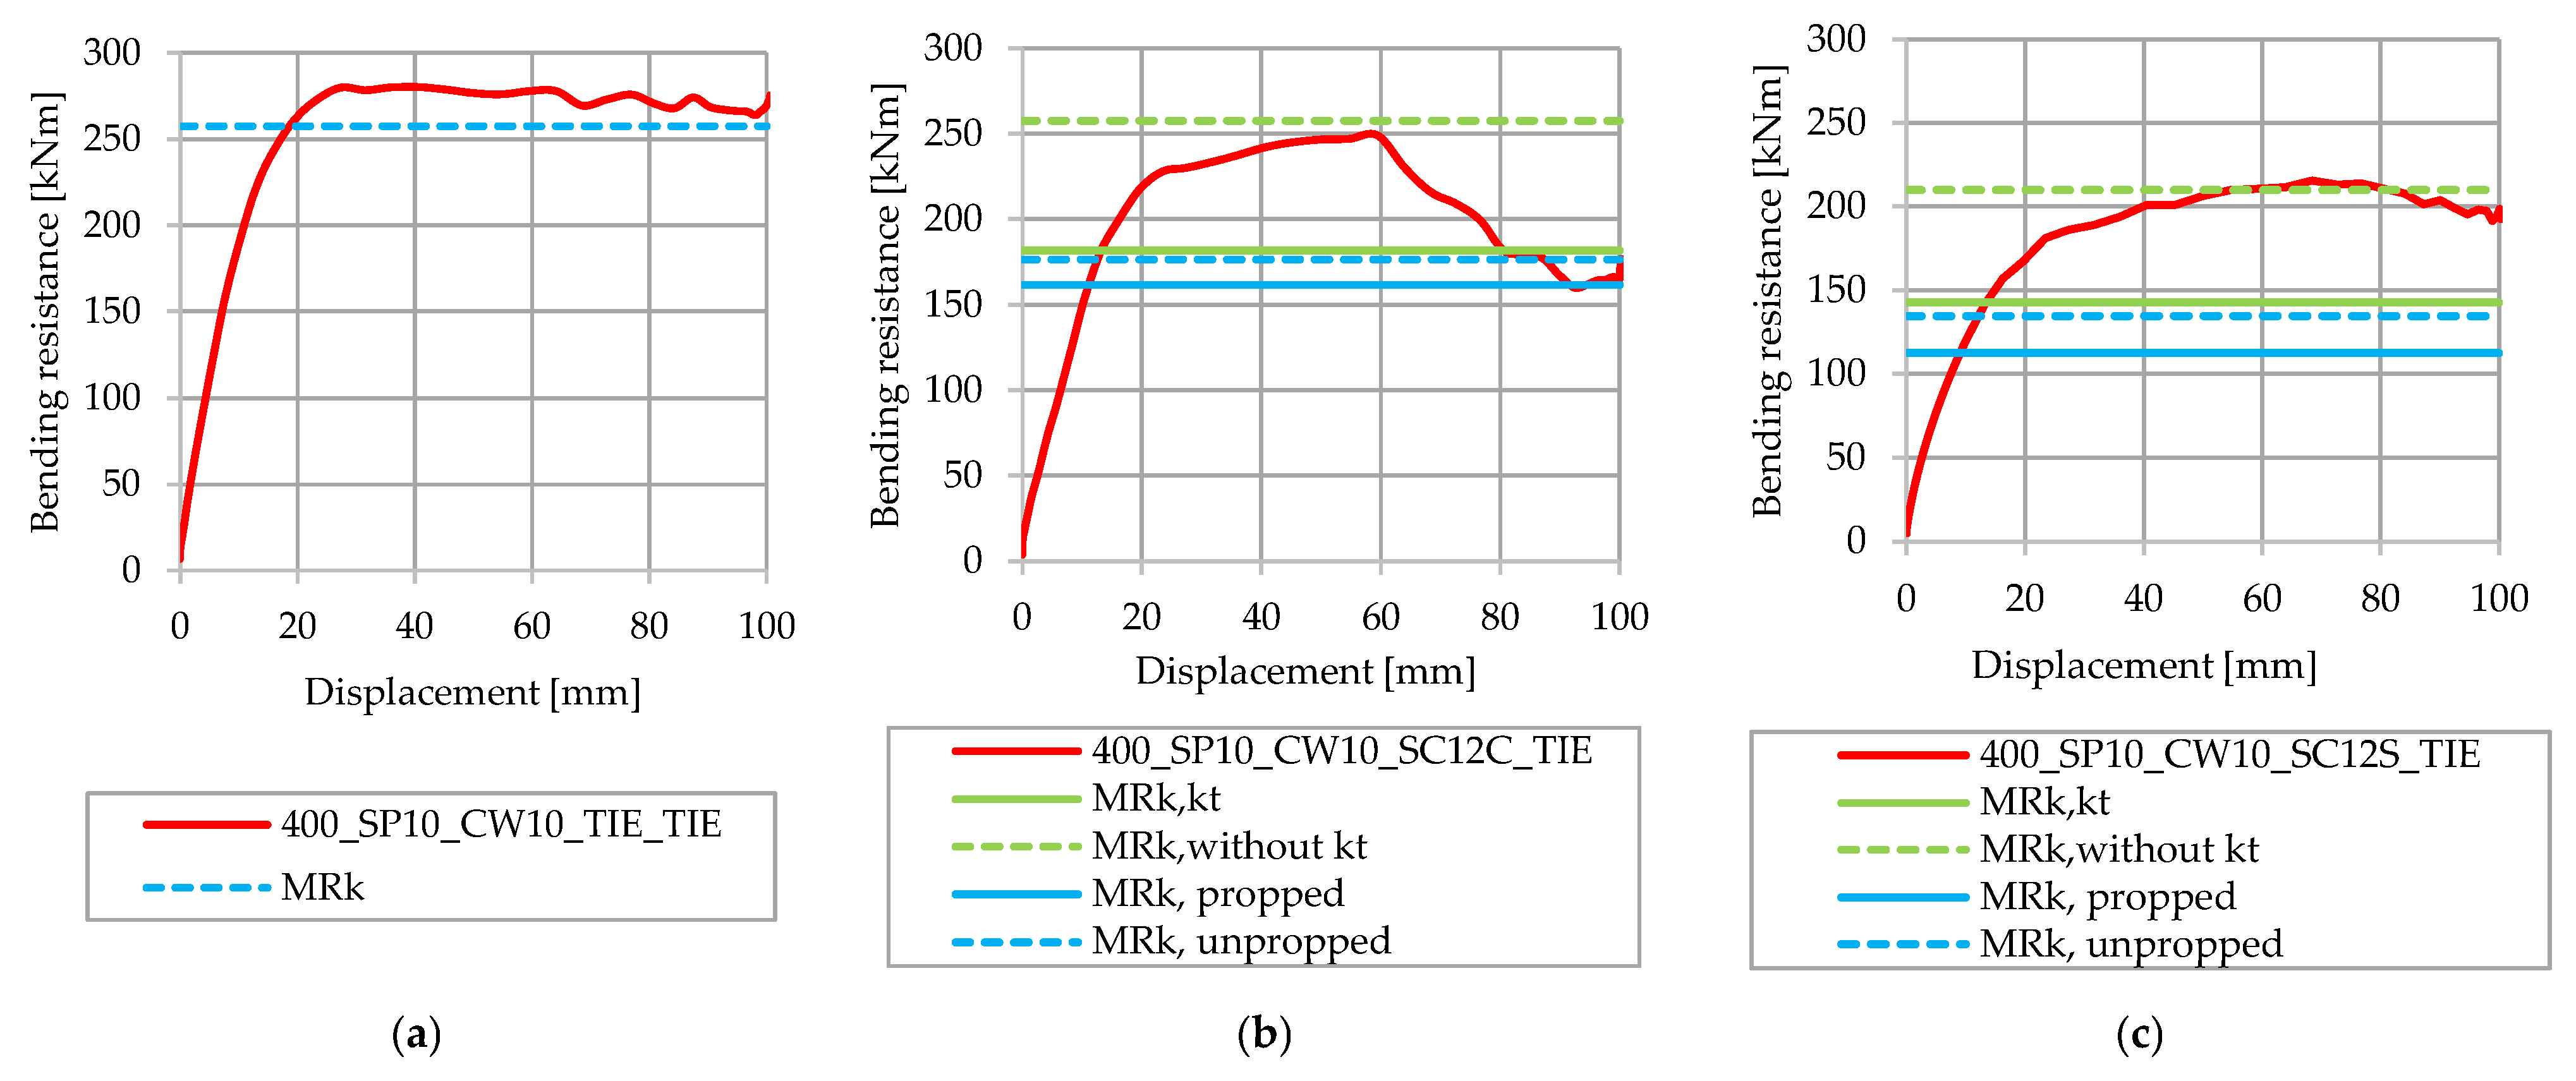
Figure 19 compares the analytically calculated results of different approaches with numerically obtained bending capacities for a steel beam height of 400 mm. In the analyzed models, steel elements were tied, and different degrees of shear connections were observed.
Figure 19a shows that the numerical model resulted in a bending capacity that exceeded the analytically calculated characteristic bending resistance, with a full shear connection, as shown in Table 1. Figure 19b,c show results that are in accordance with the analytical approaches, where MRk,kt and MRk,without kt are the values shown in Table 1. The bending resistance was calculated in accordance with Equations (16) and (17); the non-linear elastic resistance for the propped and unpropped constructions were MRk,propped and MRk,unpropped. For partial shear connection values calculated without considering the reduction factor, kt, give characteristic bending resistances close to bending capacities computed by numerical models Characteristic bending resistances that were calculated in accordance with the non-linear elastic resistance for both propped and unpropped constructions gave the lowest values; they were approximately 100 kNm lower than the numerically obtained capacities.

4.2. Steel Beam Height of 500 mm

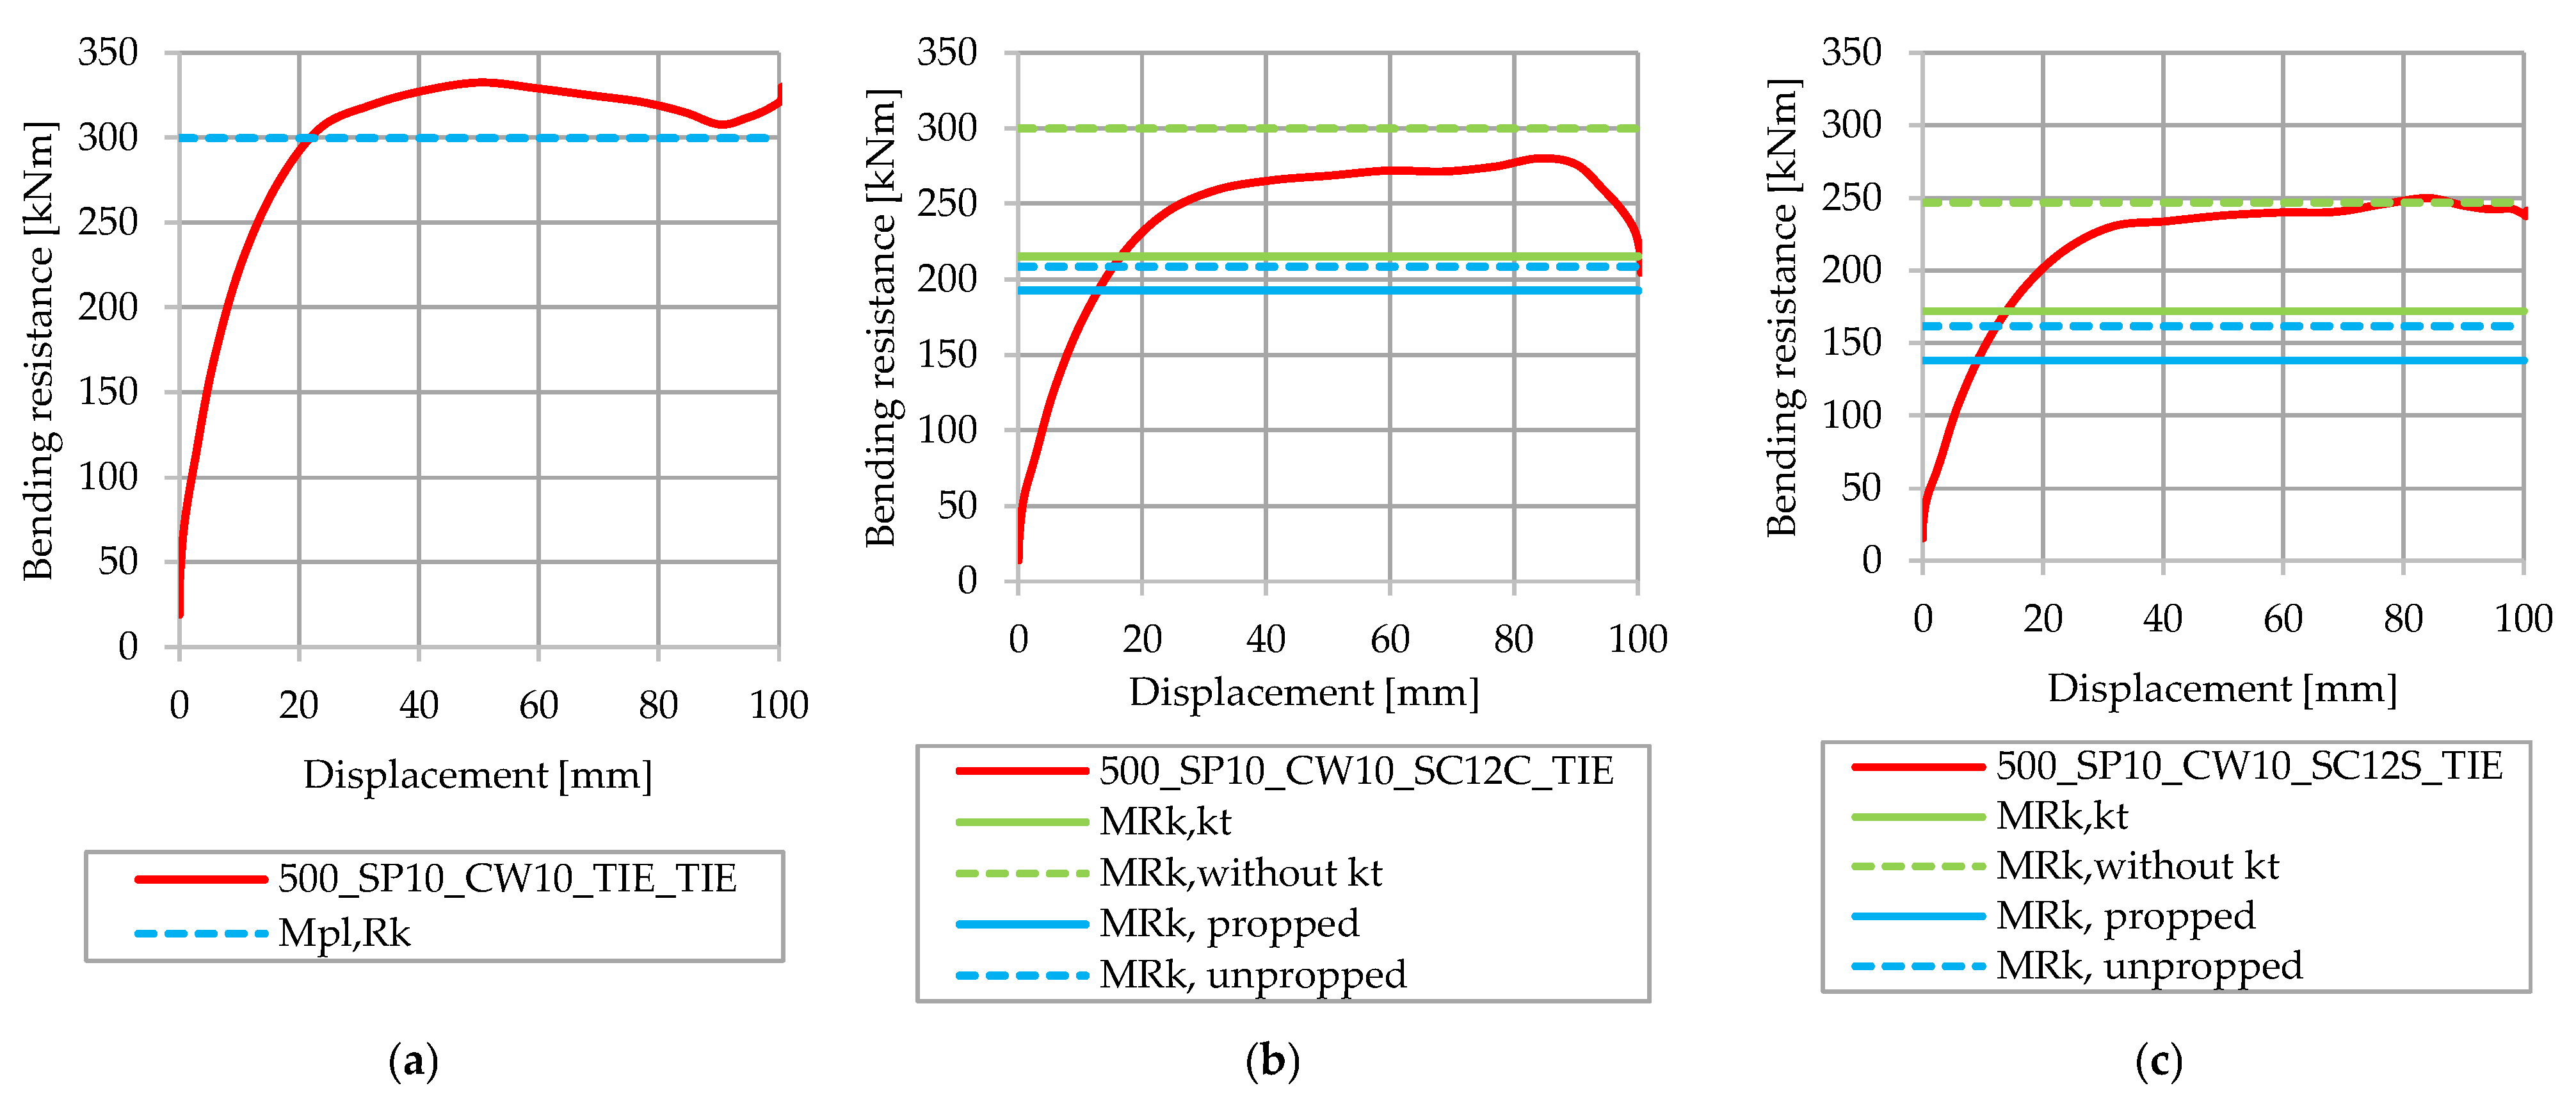
Figure 20 shows the comparison of the analytically calculated results for different approaches with numerically obtained bending capacities for a steel beam height of 500 mm. In the analyzed models, steel elements are tied, but CW thicknesses and the degrees of shear connection are different.
Figure 20 compares analytical and numerical results with full shear connections. Figure 20a shows that the FE-calculated bending capacity exceeds the analytically calculated plastic bending resistance for a full shear connection. For partial shear connections, when shear connectors are positioned in pairs, the value of the bending resistance that is calculated without kt is not reached by the FE-computed bending capacity; however, other analytically calculated values do reach that value.

4.3. Steel Beam Height of 600 mm

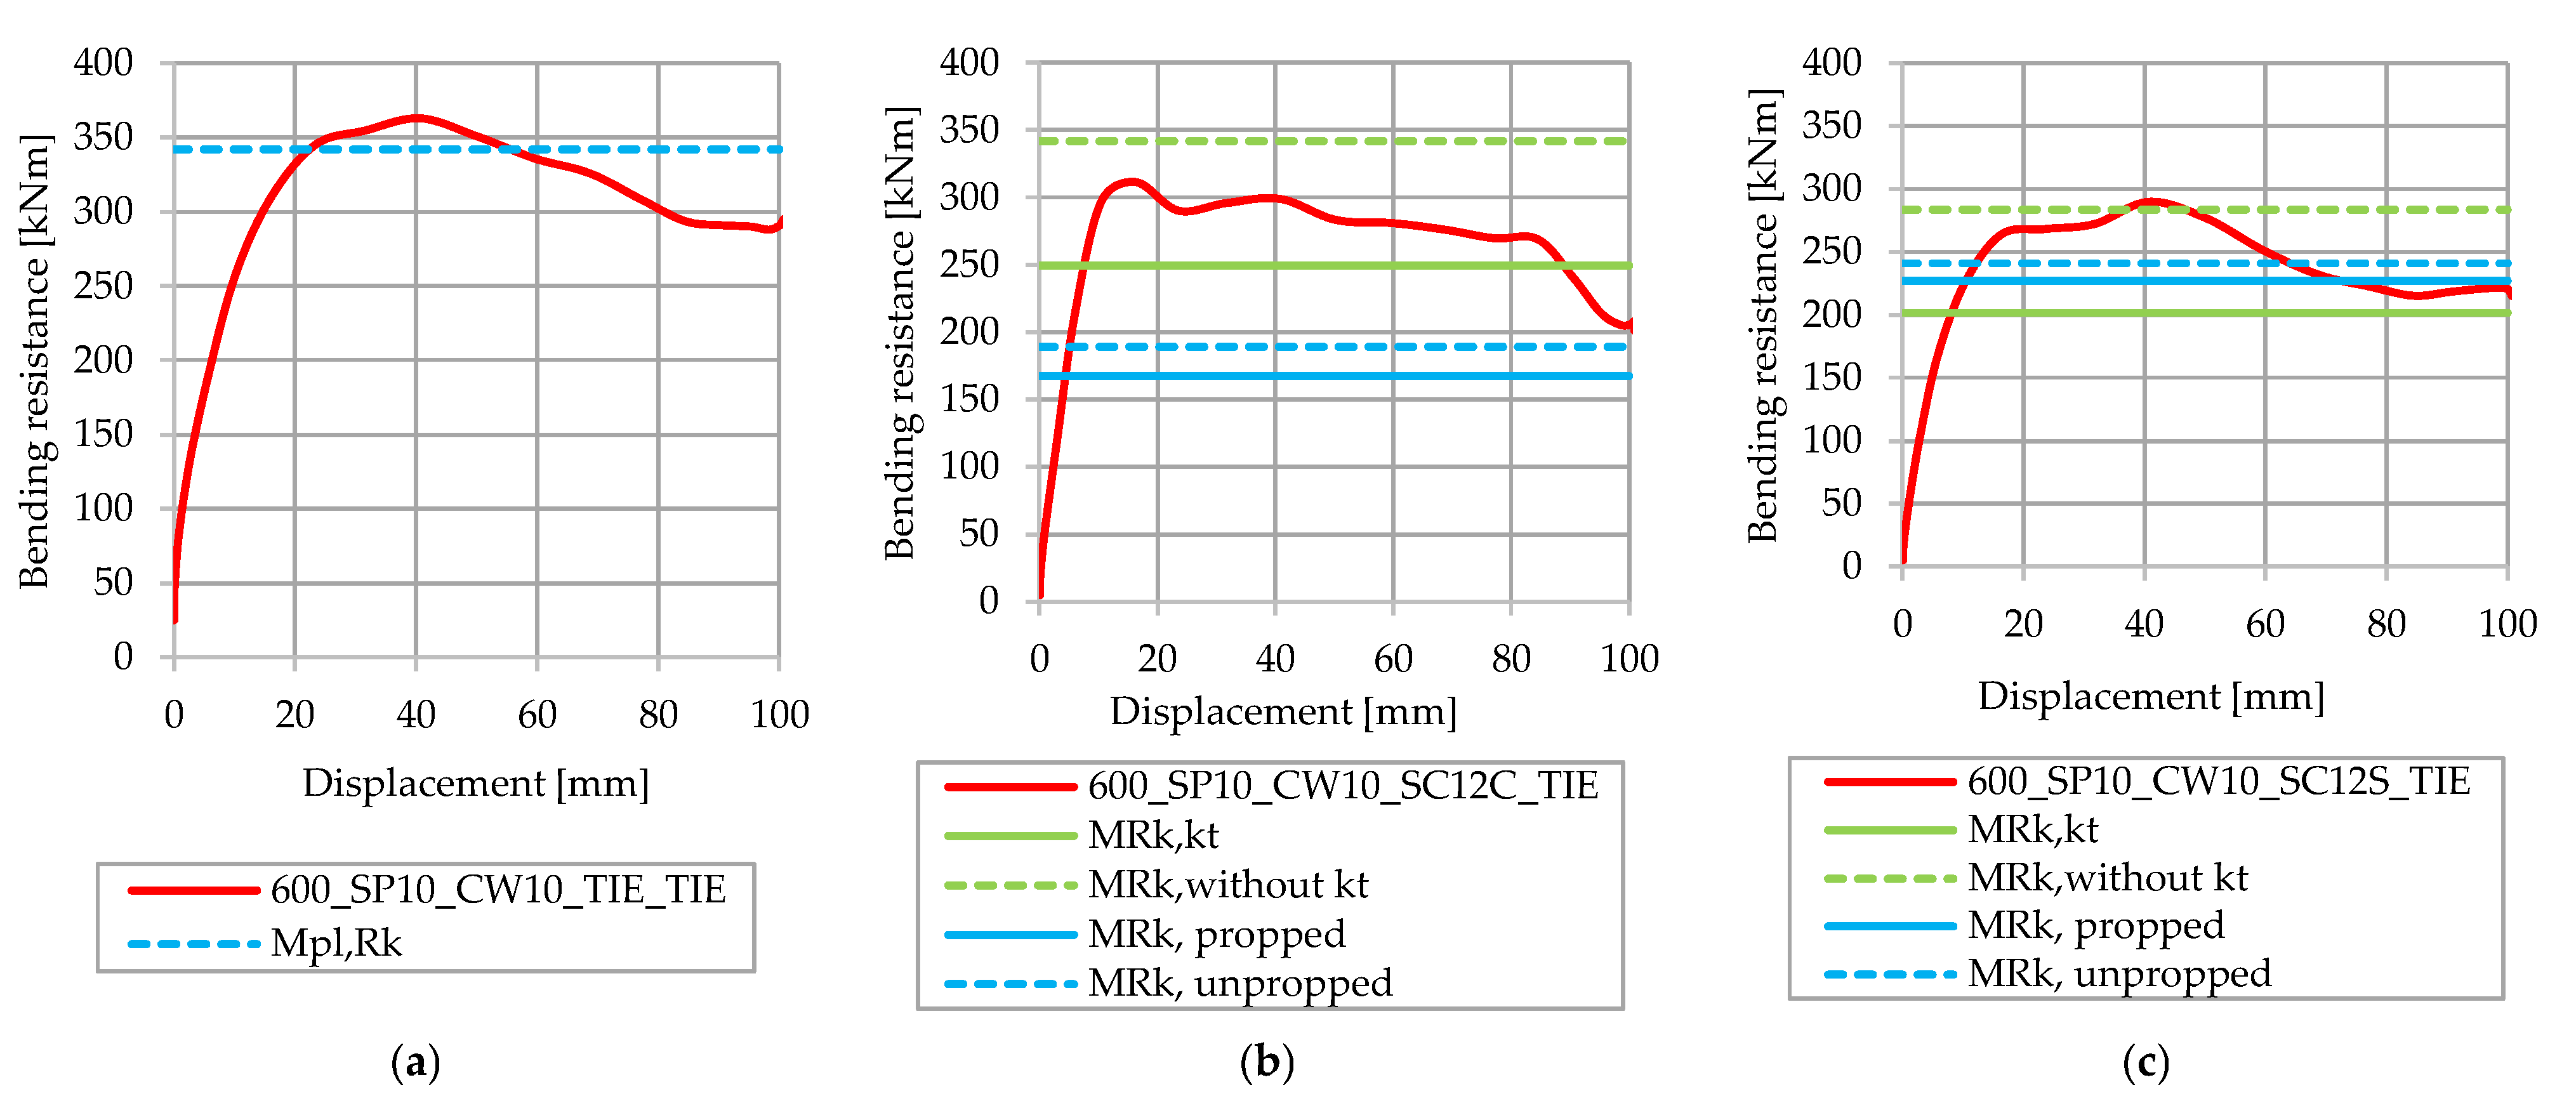
Figure 21 shows the comparison of analytically calculated results, for different approaches with numerically obtained bending capacities, of a steel beam height of 600 mm. In order to avoid the influence of spot welds, all steel elements are tied.
After observing the results shown in Figure 21a, it is evident that the values of the calculated characteristic bending resistances are reached using numerically computed capacities for full shear connections in cases when the shear connectors are in a staggered arrangement. In cases when shear connectors are positioned in pairs, Figure 21b shows that the value of the bending resistance calculated with kt is similar to the bending capacity calculated using the numerical model; however, the value of the bending resistance without kt was not reached. The values of the bending resistances calculated in accordance with non-linear elastic resistance are reached in cases of both partial shear connections in pairs and in staggered arrangements. In the case of staggered arrangements, as shown in Figure 21c, the value of the maximum bending capacity in the numerical model is the most similar to the analytical values calculated without kt.

5. Conclusions

This paper summarizes the analytical approaches for calculating the bending resistance of the analyzed CFS–concrete composite beam with built-up CFS profiles connected by spot welds. It compares the characteristic analytical results with the maximum values of numerically obtained bending capacities based on FE analyses. Furthermore, the influence of the steel beam height, the type and degree of the shear connection, the connection between the steel elements, and the CW thickness on the bending capacity of the composite system is analyzed. In accordance with the presented parametric numerical and analytical models, the following conclusions are obtained:
  • The degree of shear connection has a significant influence on the bending capacity of the composite CFS–concrete system. After changing the shear connection type from a staggered arrangement to a tie connection, the bending capacity increased to approximately 30–50%, depending on the analyzed height of the composite beam.
  • The CW thickness has a negligible influence on the bending capacity, which increased by 11% in models with CW thicknesses of 0.8 mm and 1.5 mm.
  • Models with tied steel elements showed higher bending capacities (6–16%) than when steel elements were connected with spot welds.
  • The number of spot welds between the C profile and other steel elements had a small influence on the bending capacity of the system (3–6%).
  • The steel beam height greatly influenced the bending capacity in all models, regardless of which type of connection between steel elements was used, or the degree of shear connection that was achieved (i.e., by increasing the steel beam height from 400 mm to 600 mm, the bending resistance will increase by approximately 30%).
  • When comparing the numerical and analytical results for the full degree of shear connection, it was found that the FE calculated bending capacities exceeded the characteristic bending resistance for all analyzed steel beam heights.
  • Analytically calculated characteristic bending resistances for partial shear connections without the reduction factor, kt, for steel beam heights of 400 mm (shear connectors in pairs and in staggered arrangements) and for steel beam heights of 600 mm (staggered arrangement), were reached using the bending capacities from FE models. For models with a steel beam height of 500 mm (arrangement in pairs) and a height of 600 mm (arrangement in pairs), the analytically calculated values were not reached. Analytically calculated characteristic bending resistances for partial shear connections with the reduction factor, kt, and characteristic non-linear bending resistances, were reached for all analyzed FE models.
All conclusions will be verified in future planned experimental research concerning CFS–concrete composite beams with built-up CFS profiles connected by spot welds; this research will comprise planned activities related to the LWT-FLOOR project. Furthermore, as it was not possible to take into account the CW thickness and arrangement, or the number of spot welds at the cross section of the analytical models, this topic will also be investigated in future research.

Author Contributions

Conceptualization, A.R. and I.L.; methodology, A.R. and I.L.; software, A.R. and I.L.; validation, I.L., D.S. and I.Ć.; formal analysis, A.R.; investigation, A.R. and I.L.; resources, A.R., I.L. and I.Ć.; data curation, A.R. and I.L.; writing—original draft preparation, A.R. and I.L.; writing—review and editing, A.R., I.L., I.Ć. and D.S.; visualization, A.R.; supervision, I.L., D.S. and I.Ć.; project administration, A.R., I.L. and I.Ć.; funding acquisition, A.R., I.L., I.Ć. and D.S. All authors have read and agreed to the published version of the manuscript.

Funding

This research was partially funded by the Croatian Science Foundation, grant number UIP-2020-02-2964 (LWT-FLOOR project—Innovative lightweight cold-formed steel–concrete composite floor system), project leader: Ivan Lukačević.

Institutional Review Board Statement

Not applicable.

Informed Consent Statement

Not applicable.

Data Availability Statement

The data presented in this study are available on request from the corresponding author.

Conflicts of Interest

The authors declare no conflict of interest. The funders had no role in the design of the study; in the collection, analyses, or interpretation of data; in the writing of the manuscript; or in the decision to publish the results.

References

  1. Yu, W.W. Cold-Formed Steel Structures; John Wiley and Sons: Hoboken, NJ, USA, 2005. [Google Scholar]
  2. Khadavi, K.; Tahir, M.M. Prediction on flexural strength of encased composite beam with cold-formed steel section. AIP Conf. Proc. 2017, 1903, 020016. [Google Scholar] [CrossRef] [Green Version]
  3. Vijayanand, S.; Gowshika, E.; Greevan, P.K.; Gunaseelan, P. Assessment on the behaviour of cold-formed steel built-up beams. Mater. Res. Proc. 2021, 19, 92–99. [Google Scholar] [CrossRef]
  4. Dar, M.A.; Subramanian, N.; Dar, A.R.; Anbarasu, M.; Lim, J.B.P.; Atif, M. Behaviour of partly stiffened cold-formed steel built-up beams: Experimental investigation and numerical validation. Adv. Struct. Eng. 2019, 22, 172–186. [Google Scholar] [CrossRef]
  5. Eid, N.; Joó, A.L. Analysis of cold-formed steel rectangular hollow flange beams. Pollack Periodica 2021, 16, 58–64. [Google Scholar] [CrossRef]
  6. Portioli, F.; Lorenzo, G.; Landolfo, R.; Mazzolani, F.M. Contact Buckling Effects in Built-up Cold-Formed Steel Beams. In Proceedings of the 6th International Conference on Coupled Instabilities in Metal Structures, Scotland, UK, 3–5 December 2012; Strathclyde University: Scotland, UK, 2012; pp. 1–8. [Google Scholar]
  7. Haris, S.; Prasetio, A.; Thamrin, R.; Herman, H. An experimental study of bending behaviour of double channel and hollow sections of light gauge steel. Int. J. Adv. Sci. Eng. Inf. Technol. 2018, 8, 882–888. [Google Scholar] [CrossRef] [Green Version]
  8. Nguyen, R.P. Strength of Composite Cold-formed Steel-concrete Beams. In Proceedings of the Ninth International Specialty Conference on Cold-Formed Steel Structures, St. Louis, MO, USA, 8–9 November 1988. [Google Scholar]
  9. EN 1994-1-1; Eurocode 4: Design of Composite Steel and Concrete Structures—Part 1-1: General Rules and Rules for Buildings. CEN: Brussels, Belgium, 2004.
  10. Sifan, M.; Gatheeshgar, P.; Nagaratnam, B.; Poologanathan, K.; Navaratnam, S.; Thamboo, J.; Corradi, M. Shear performance of lightweight concrete filled hollow flange cold-formed steel beams. Case Stud. Constr. Mater. 2022, 17, e01160. [Google Scholar] [CrossRef]
  11. Bamaga, S.O.; Tahir, M.M.; Ngian, S.P.; Mohamad, S.; Sulaiman, A.; Aghlara, R. Structural behaviour of cold-formed steel of double c-lipped channel sections integrated with concrete slabs as composite beams. Lat. Am. J. Solids Struct. 2019, 16, 1–15. [Google Scholar] [CrossRef]
  12. Qasim, T.M.; Al-Zaidee, S.R. Experimental Investigation for Non and Partially Composite Cold-Formed Steel Floor Beams. Civ. Eng. J. 2019, 5, 1407–1423. [Google Scholar] [CrossRef]
  13. Lukačević, I.; Ćurković, I.; Rajić, A.; Bartolac, M. Lightweight Composite Floor System—Cold-Formed Steel and Concrete—LWT-FLOOR Project. Buildings 2022, 12, 209. [Google Scholar] [CrossRef]
  14. Youns, M.A.; Hassaneen, S.A.; Badr, M.R.; Salem, E.S. Composite Beams of Cold Formed Steel Section and Concrete Slab. Int. J. Eng. Dev. Res. 2016, 4, 2321–9939. [Google Scholar]
  15. Elsawaf, S.A.; Bamaga, S.O. Strength capacity and failure mode of shear connectors suitable for composite cold formed steel beams: Numerical study. Materials 2021, 14, 3627. [Google Scholar] [CrossRef] [PubMed]
  16. Lawan, M.M.; Tahir, M.M.; Ngian, S.P.; Sulaiman, A. Structural performance of cold-formed steel section in composite structures: A review. J. Teknol. 2015, 74, 165–175. [Google Scholar] [CrossRef] [Green Version]
  17. BS5950-3-1; 1990 + A1:2010 Structural Use of Steelwork in Building: Part 3: Design in Composite Construction-Section 3.1 Code of Practice for Design of Simple and Continuous Composite Beams. British Standard Institute: London, UK, 2010.
  18. Kyvelou, P.; Gardner, L.; Nethercot, D.A. Design of Composite Cold-Formed Steel Flooring Systems. Structures 2017, 12, 242–252. [Google Scholar] [CrossRef]
  19. Zhou, X.; Zhao, Y.; Liu, J.; Chen, Y.F.; Yang, Y. Bending experiment on a novel configuration of cold-formed U-shaped steel-concrete composite beams. Eng. Struct. 2019, 180, 124–133. [Google Scholar] [CrossRef]
  20. JGJ 138-2016; Code for Design of Composite Structures. China Architecture & Building Press: Beijing, China, 2016. (In Chinese)
  21. Shi, Y.; Yang, K.; Guan, Y.; Yao, X.; Xu, L.; Zhang, H. The flexural behavior of cold-formed steel composite beams. Eng. Struct. 2020, 218, 110819. [Google Scholar] [CrossRef]
  22. Liu, J.; Zhao, Y.; Chen, Y.F.; Xu, S.; Yang, Y. Flexural behavior of rebar truss stiffened cold-formed U-shaped steel-concrete composite beams. J. Constr. Steel Res. 2018, 150, 175–185. [Google Scholar] [CrossRef]
  23. Liu, J.; Chen, G.; Chen, Y.F.; Xu, T. Experimental study on the flexural behavior of cold-formed U-shaped steel-encased confined prestressed RC beam. J. Constr. Steel Res. 2021, 182, 106656. [Google Scholar] [CrossRef]
  24. Güldür, H.; Baran, E.; Topkaya, C. Experimental and numerical analysis of cold-formed steel floor trusses with concrete filled compression chord. Eng. Struct. 2021, 234, 111813. [Google Scholar] [CrossRef]
  25. Zhao, Y.; Zhou, X.; Yang, Y.; Liu, J.; Chen, Y.F. Negative bending behavior of novel U-shaped steel and concrete composite beams. Eng. Struct. 2021, 237, 112217. [Google Scholar] [CrossRef]
  26. Yan, Q.; Zhang, Z.; Yan, J.; Laflamme, S. Analysis of flexural capacity of a novel straight-side U-shaped steel-encased concrete composite beam. Eng. Struct. 2021, 242, 112447. [Google Scholar] [CrossRef]
  27. AS/NZS 4600; Australian/New Zealand Standard for the Design of Cold-Formed Steel Structures. Standards Australia: Sydney, NSW, Australia; Standards New Zealand: Wellington, New Zealand, 2005.
  28. EN 1993-1-1; Eurocode 3: Design of Steel Structures—Part 1-1: General Rules and Rules for Buildings. CEN: Brussels, Belgium, 2005.
  29. AISI S-100; North American Specification for the Design of Cold-Formed Steel Structural Members (AISI Standard). AISI: Washington, DC, USA, 2016.
  30. Wehbe, N.; Bahmani, P.; Wehbe, A. Behavior of Concrete/Cold Formed Steel Composite Beams: Experimental Development of a Novel Structural System. Int. J. Concr. Struct. Mater. 2013, 7, 51–59. [Google Scholar] [CrossRef] [Green Version]
  31. Irwan, J.M.; Hanizah, A.H.; Azmi, I.; Koh, H.B. Large-scale test of symmetric cold-formed steel (CFS)concrete composite beams with BTTST enhancement. J. Constr. Steel Res. 2011, 67, 720–726. [Google Scholar] [CrossRef]
  32. Dujmović, D.; Androić, B.; Lukačević, I. Composite Structures According to Eurocode 4: Worked Examples; John Wiley and Sons: Berlin, Germany, 2015. [Google Scholar]
  33. Androić, B.; Dujmović, D.; Lukačević, I. Design of Composite Structures According to Eurocode 4; IA Projektiranje: Zagreb, Croatia, 2012. [Google Scholar]
  34. Dassault Systèmes Simulia Corp. ABAQUS, User’s Manual, Version 6.12; Dassault Systèmes Simulia Corp.: Providence, RI, USA, 2012. [Google Scholar]
  35. Ungureanu, V.; Lukačević, I.; Both, I.; Burca, M.; Dubina, D. Numerical investigation of built-up cold-formed steel beams without corrugated web. In The International Colloquium on Stability and Ductility of Steel Structures; Czech Technical University in Prague: Prague, Czech Republic, 2019; pp. 1–8. [Google Scholar]
  36. EN 1992-1-1; Eurocode 2: Design of Concrete Structures—Part 1-1: General Rules and Rules for Buildings. CEN: Brussels, Belgium, 2004.
  37. Jakovljević, I.; Spremić, M.; Marković, Z. Demountable composite steel-concrete floors: A state-of-the-art review. J. Croat. Assoc. Civ. Eng. 2021, 73, 249–263. [Google Scholar] [CrossRef]
  38. Ćurković, I.; Lukačević, I.; Žuvelek, V.; Rajić, A. Numerical Investigation of Shear Connection in Cold- formed Steel-concrete Composite Beam. Ce/Papers 2022, 5, 847–856. [Google Scholar] [CrossRef]
  39. Grassl, P.; Xenos, D.; Nyström, U.; Rempling, R.; Gylltoft, K. CDPM2: A damage-plasticity approach to modelling the failure of concrete. Int. J. Solids Struct. 2013, 50, 3805–3816. [Google Scholar] [CrossRef] [Green Version]
  40. Voyidjis, G.Z.; Taqieddin, Z.N.; Kattan, P.I. Anisotropic damage-plasticity model for concrete. Int. J. Plast. 2008, 24, 1946–1965. [Google Scholar] [CrossRef]
  41. Jankowiak, T.; Lodygowski, T. Identification of parameters of concrete damage plasticity constitutive model. In Foundations of Civil and Environmental Engineering; Poznan University of Technology: Poznan, Poland, 2005; pp. 53–69. [Google Scholar]
  42. Ding, F.; Wu, X.; Xiang, P.; Yu, Z. New Damage Ratio Strength Criterion for Concrete and Lightweight Aggregate Concrete. ACI Struct. J. 2021, 118, 165–178. [Google Scholar] [CrossRef]
  43. Lukačević, I.; Ćurković, I.; Rajić, A.; Žuvelek, V. Parametric Finite Element Analyses of Lightweight Cold- formed Steel-concrete Composite Floor Beams. Ce/Papers 2022, 5, 836–846. [Google Scholar] [CrossRef]
  44. Ungureanu, V.; Both, I.; Burcă, M.; Huang Nguyen, T.; Grosan, M.; Dubina, D. Experimental investigations on spot welded built-up cold-formed steel beams. Bul. Inst. Polit. Iaşi 2018, 64, 19–29. [Google Scholar] [CrossRef]
  45. Ungureanu, V.; Both, I.; Burca, M.; Radu, B.; Neagu, C.; Dubina, D. Experimental and numerical investigations on built-up cold-formed steel beams using resistance spot welding. Thin-Walled Struct. 2021, 161, 107456. [Google Scholar] [CrossRef]
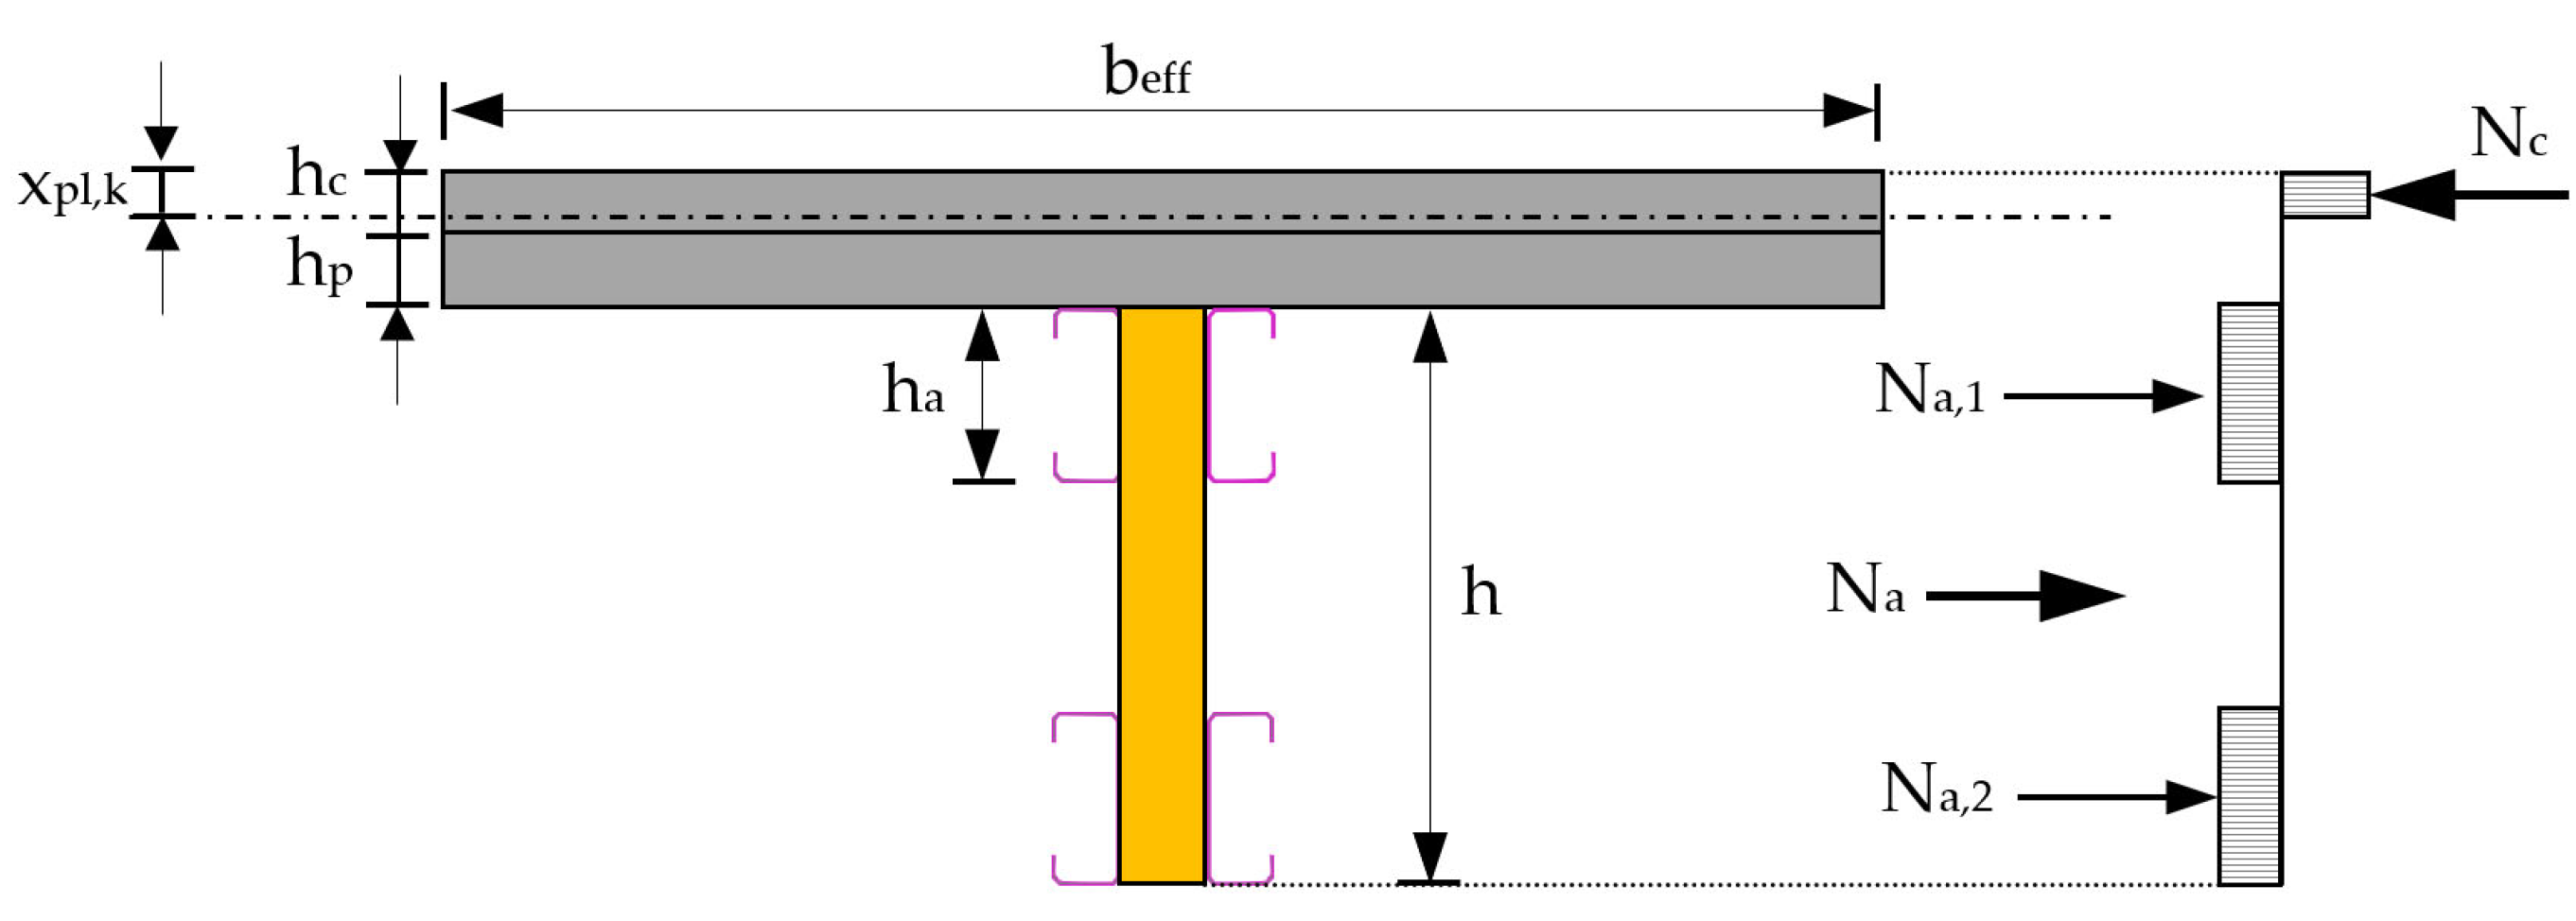
Figure 1. Cross section of the analyzed LWT-FLOOR composite beam.
Applsci 13 07397 g001
Figure 2. Simplified relationship between M and Nc: (a) steel beam height of 400 mm; (b) steel beam height of 500 mm; (c) steel beam height of 600 mm.
Applsci 13 07397 g002
Figure 3. Comparison of experimentally and numerically obtained results: (a) CWB SW-1; (b) CWB SW-2, in accordance with [35].
Applsci 13 07397 g003
Figure 4. Numerical model of the analyzed composite beam: (a) Load introduction; (b) Support conditions.
Applsci 13 07397 g004
Figure 5. Material definition: (a) stress-strain relation of C25/30 concrete, in accordance with [13,37,38]; (b) tensile stress–strain relationship for steel grade S350 GD; (c) tensile stress–strain relation for bolts 8.8.
Applsci 13 07397 g005
Figure 6. Spot welds and shear connections: (a) arrangement of spot-welds; (b) model shear connectors.
Applsci 13 07397 g006
Figure 7. Nomenclature for numerical model names.
Applsci 13 07397 g007
Figure 8. Influence of the degree of shear connection on tied steel elements: (a) height of 400 mm and CW thickness of 0.8 mm; (b) height of 500 mm and CW thickness of 1.0 mm; (c) height of 600 mm and CW thickness of 1.5 mm.
Applsci 13 07397 g008
Figure 9. Influence of CW thickness: (a) steel beam height of 400 mm; (b) steel beam heights of 400 mm and 500 mm.
Applsci 13 07397 g009
Figure 10. Influence of the type connection between steel elements: (a) steel beam height of 500 mm; (b) steel beam height of 600 mm.
Applsci 13 07397 g010
Figure 11. Influence of the number of spot welds between C profiles and other steel elements: (a) steel beam height of 400 mm; (b) steel beam height of 500 mm; (c) steel beam height of 600 mm.
Applsci 13 07397 g011
Figure 12. Influence of the steel beam height.
Applsci 13 07397 g012
Figure 13. Influence of the number of spot welds between C profiles and other steel elements: (a) steel beam height of 400 mm; (b) steel beam height of 500 mm.
Applsci 13 07397 g013
Figure 14. Influence of CW thickness and spot weld density on models with full shear connection: (a) steel beam height of 500 mm; (b) steel beam height of 600 mm.
Applsci 13 07397 g014
Figure 15. Influence of CW thickness on the deformed shape and von Mises stress fields of the steel beams: (a) 600_SP10_CW08_TIE_02; (b) 600_SP10_CW15_TIE_02.
Applsci 13 07397 g015
Figure 16. Influence of CW thickness and spot weld density on partial shear connections: (a) steel beam height of 400 mm and shear connectors positioned in pairs; (b) steel beam height of 400 mm and shear connectors positioned in a staggered arrangement; (c) steel beam height of 500 mm and shear connectors positioned in pairs; (d) steel beam height of 600 mm and shear connectors positioned in pairs.
Applsci 13 07397 g016
Figure 17. Deformed shape and von Mises stress filed for model 400_SP10_CW10_SC12S_02: (a) left end of the beam; (b) right end of the beam.
Applsci 13 07397 g017
Figure 18. Influence of steel beam height on models with partial shear connections and different spot weld densities: (a) steel beam heights of 400 mm and 500 mm; (b) steel beam height of 600 mm; (c) steel beam heights of 500 mm and 600 mm.
Applsci 13 07397 g018
Figure 19. Comparison of the analytical and numerical results of a steel beam height of 400 mm: (a) full shear connection; (b) shear connectors in pairs; (c) shear connectors in a staggered arrangement.
Applsci 13 07397 g019
Figure 20. Comparison of analytical and numerical results of a steel beam height of 500 mm: (a) full shear connection; (b) shear connectors in pairs; (c) shear connectors in a staggered arrangement.
Applsci 13 07397 g020
Figure 21. Comparison of analytical and numerical results of a steel beam height of 600 mm: (a) full shear connection; (b) shear connectors-in pairs; (c) shear connectors in a staggered arrangement.
Applsci 13 07397 g021
Table 1. Bending resistances for steel beam heights of 400 mm, 500 mm, and 600 mm.
Bolt ArrangementBending Resistance [kNm]Degree of Shear Connection [–]
without ktwith ktwithout ktwith kt
h = 400 mm
In pairs257.7181.71.00.64
Staggered position210.0142.70.780.46
h = 500 mm
In pairs299.7215.31.00.64
Staggered position246.8171.90.780.46
h = 600 mm
In pairs341.7249.21.00.64
Staggered position283.7201.60.780.46
Table 2. Analyzed parameters.
ParameterDescriptionLabel
Steel height400 mm400
500 mm500
600 mm600
Shear plate thickness1.0 mmSP10
Corrugated web thickness0.8 mmCW08
1.0 mmCW10
1.5 mmCW15
Type of shear connectionfullTIE
Two shear connectors per ribSC12C
One shear connector per ribSC12S
Type of connection between C profiles and other steel elementstie constraintTIE
2 spot welds02
3 spot welds03
Disclaimer/Publisher’s Note: The statements, opinions and data contained in all publications are solely those of the individual author(s) and contributor(s) and not of MDPI and/or the editor(s). MDPI and/or the editor(s) disclaim responsibility for any injury to people or property resulting from any ideas, methods, instructions or products referred to in the content.