


The Effect of Brushing on Coffee Stainability of Ceramic Crowns Constructed from Repeatedly Processed Lithium Disilicate Ceramic Ingots: An In Vitro Study


Abstract
:1. Introduction
2. Materials and Methods
2.1. Sample Size Calculation
2.2. Preparation of the Sample
3. Results
3.1. Color Measurement (L, a, and b Values)
3.1.1. L Values
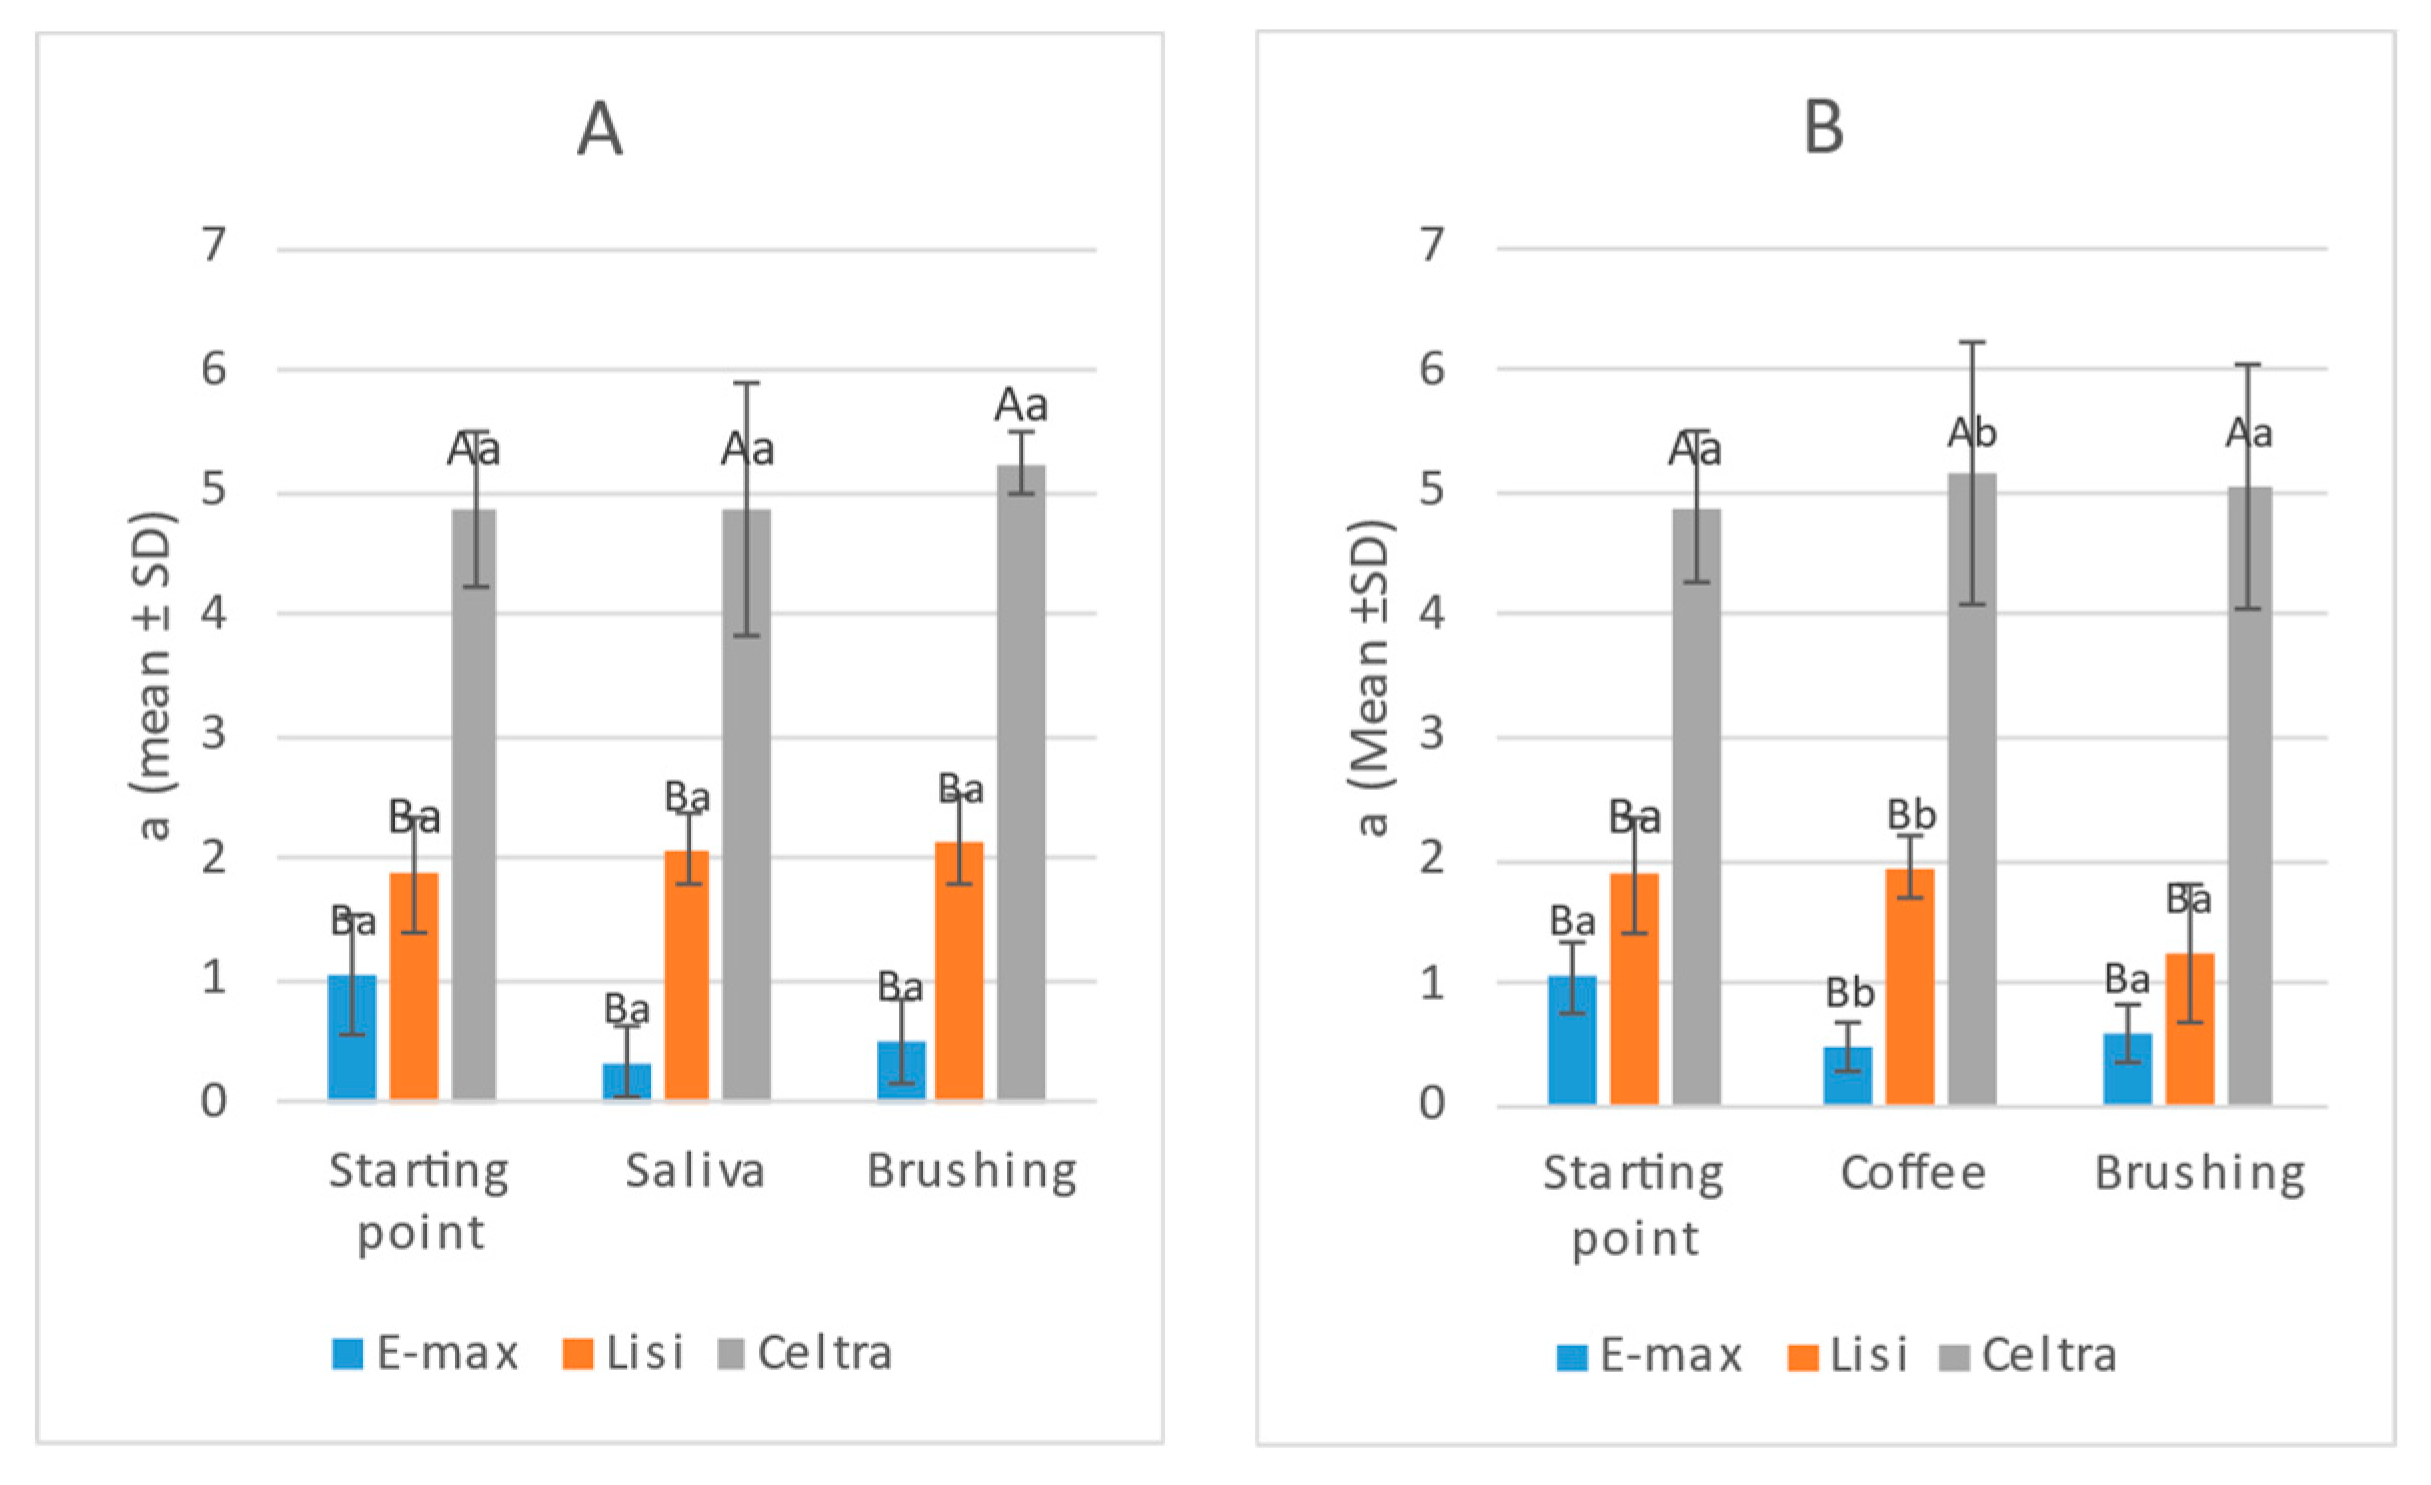
3.1.2. a Values
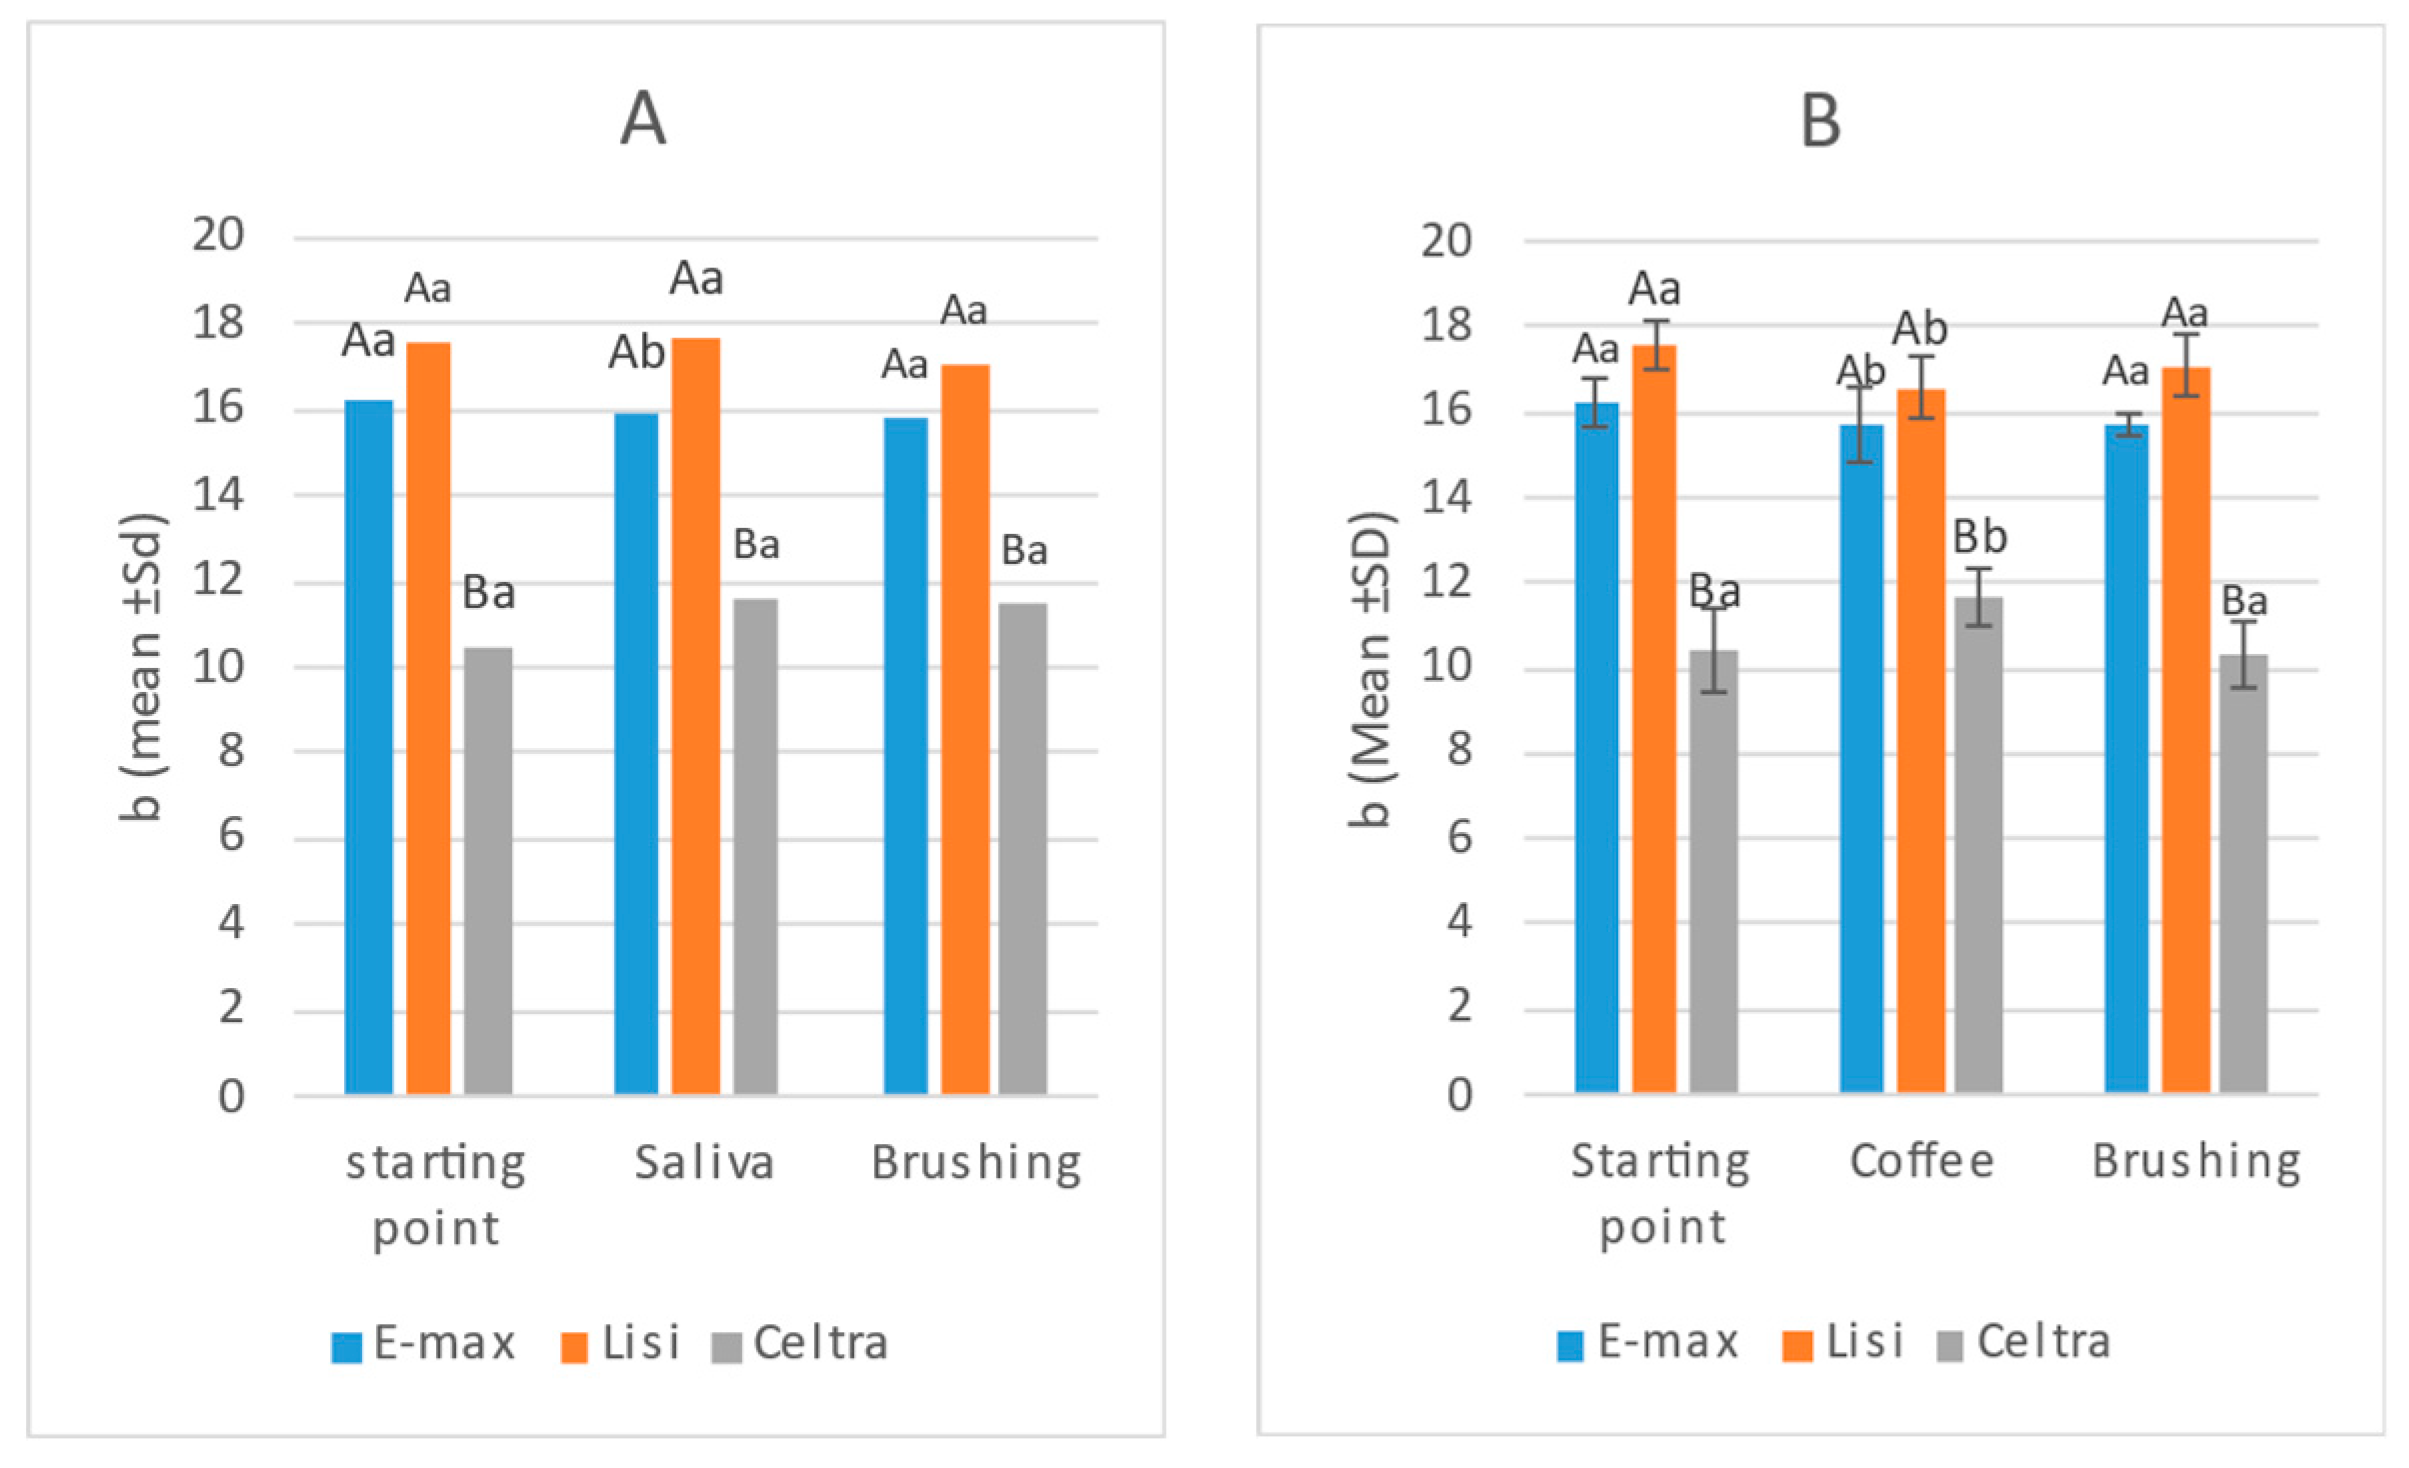
3.1.3. b Values
3.1.4. Color Change (ΔE, ΔL, Δa, and Δb)
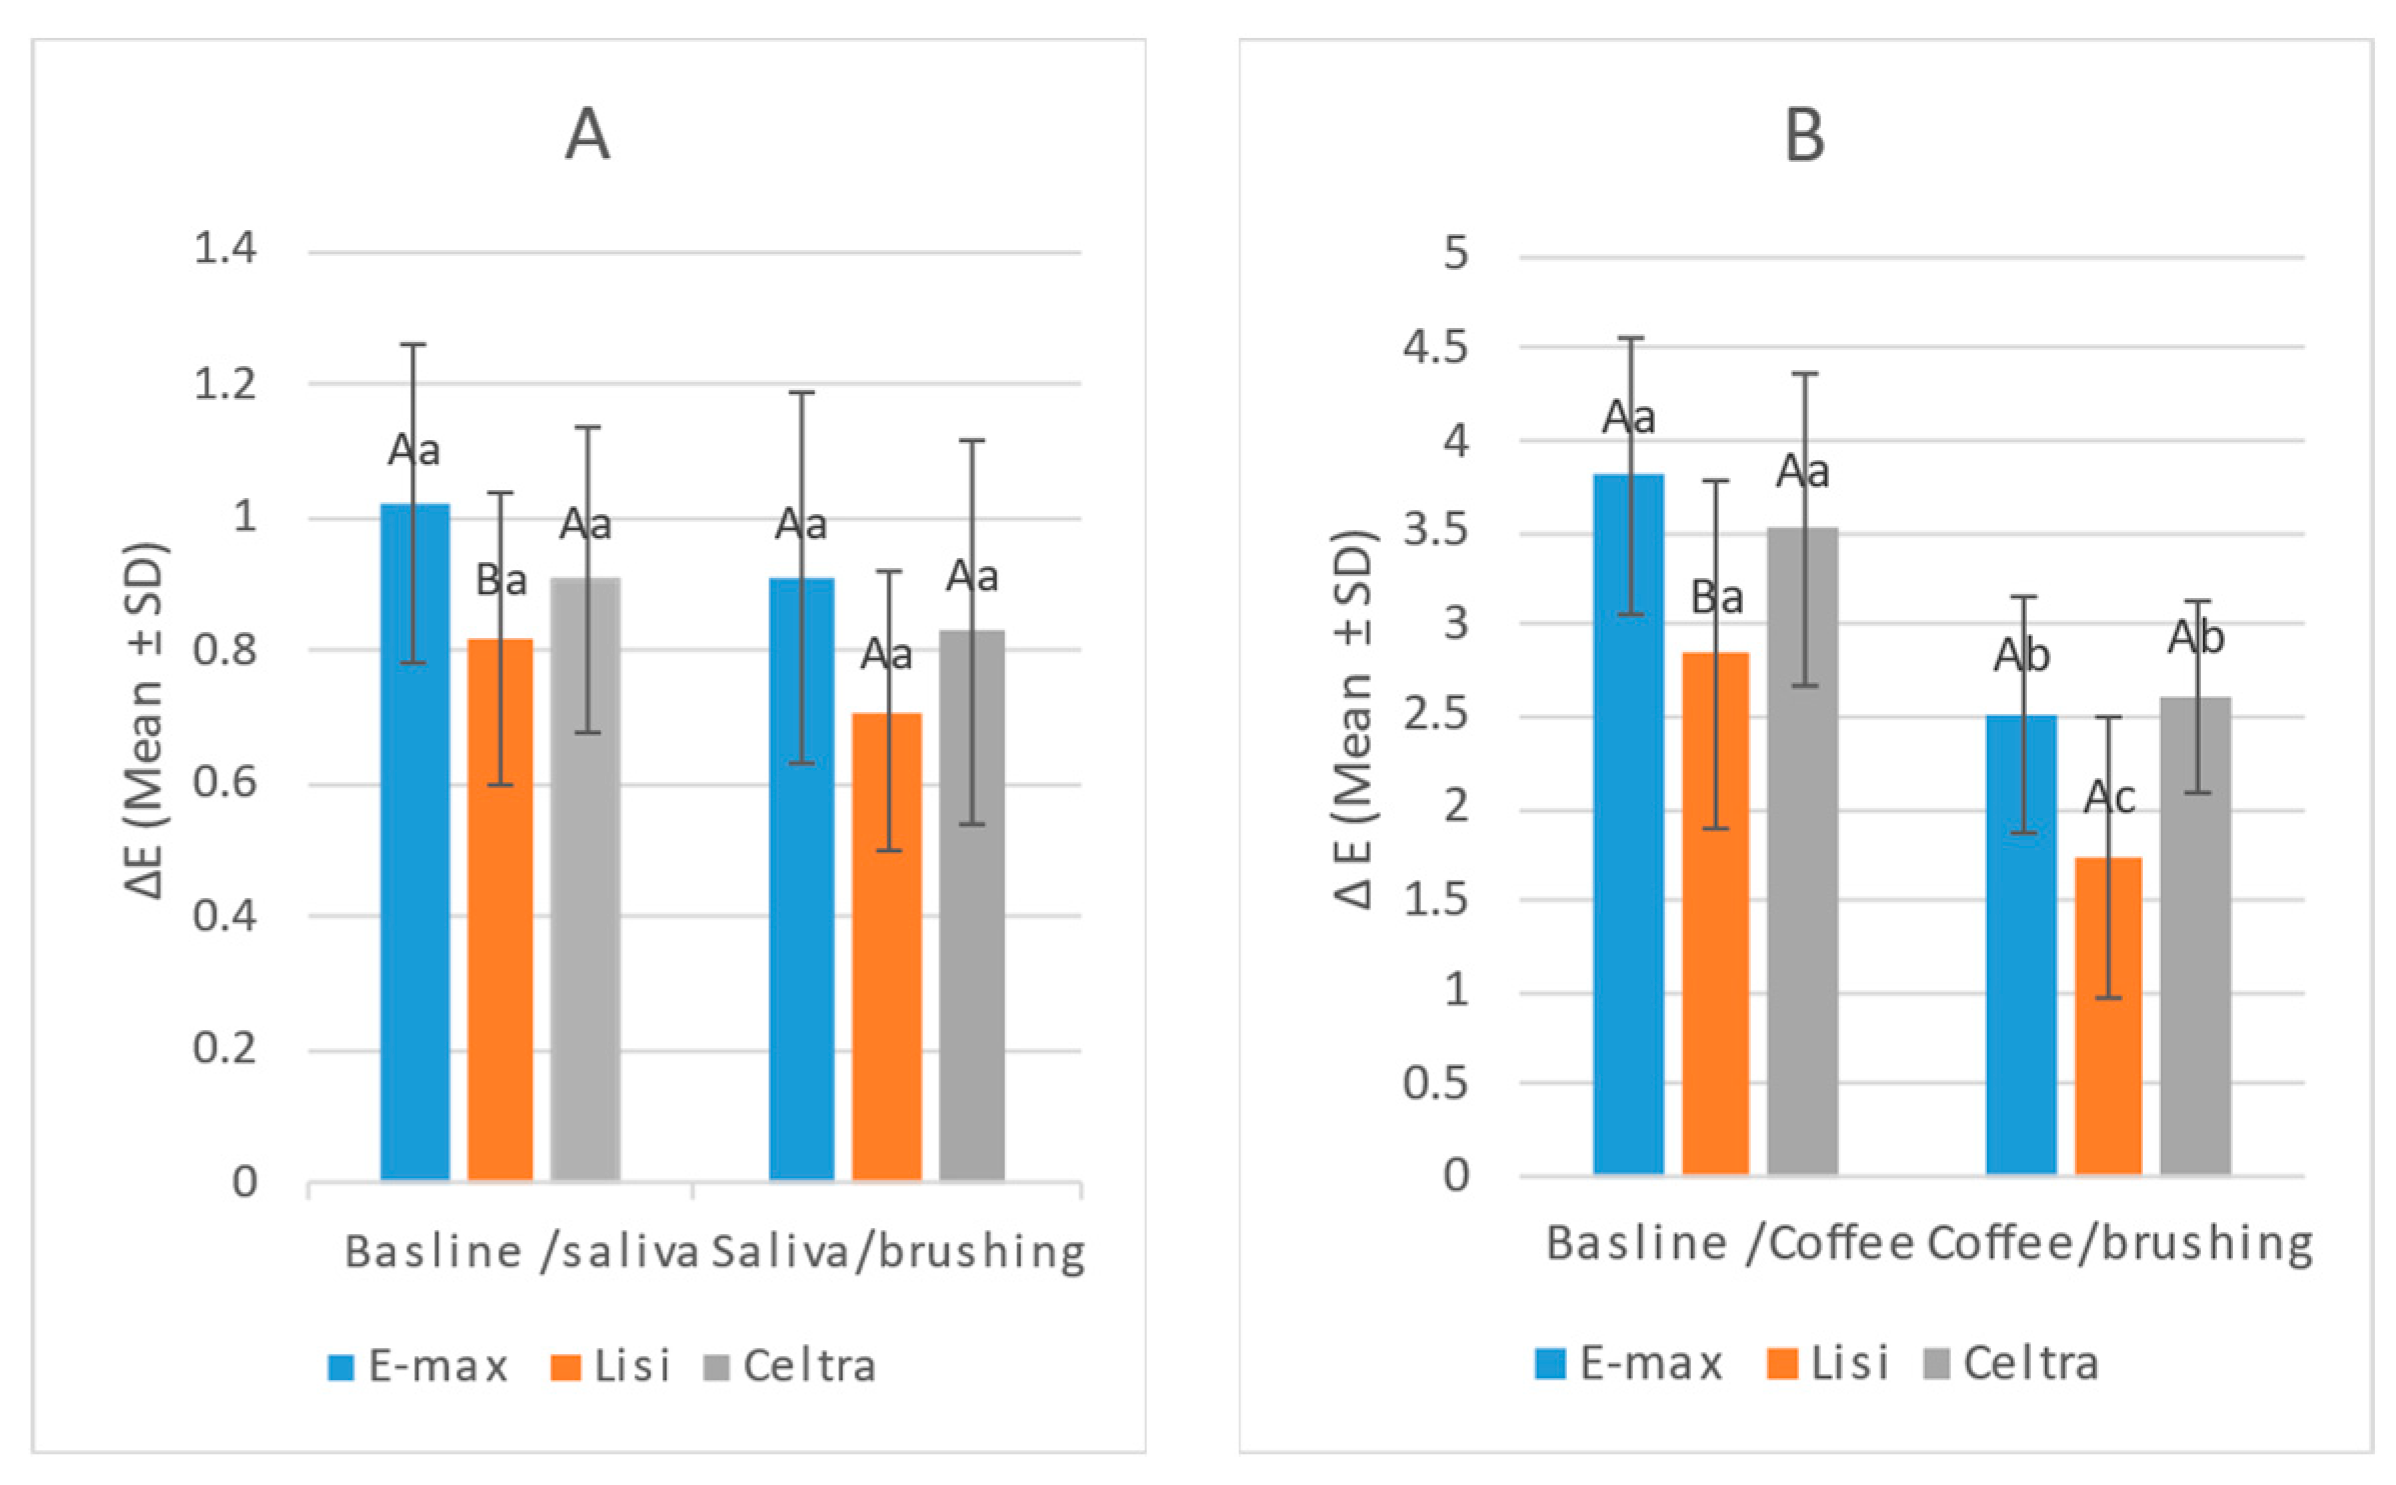
Overall Color Change (ΔE)
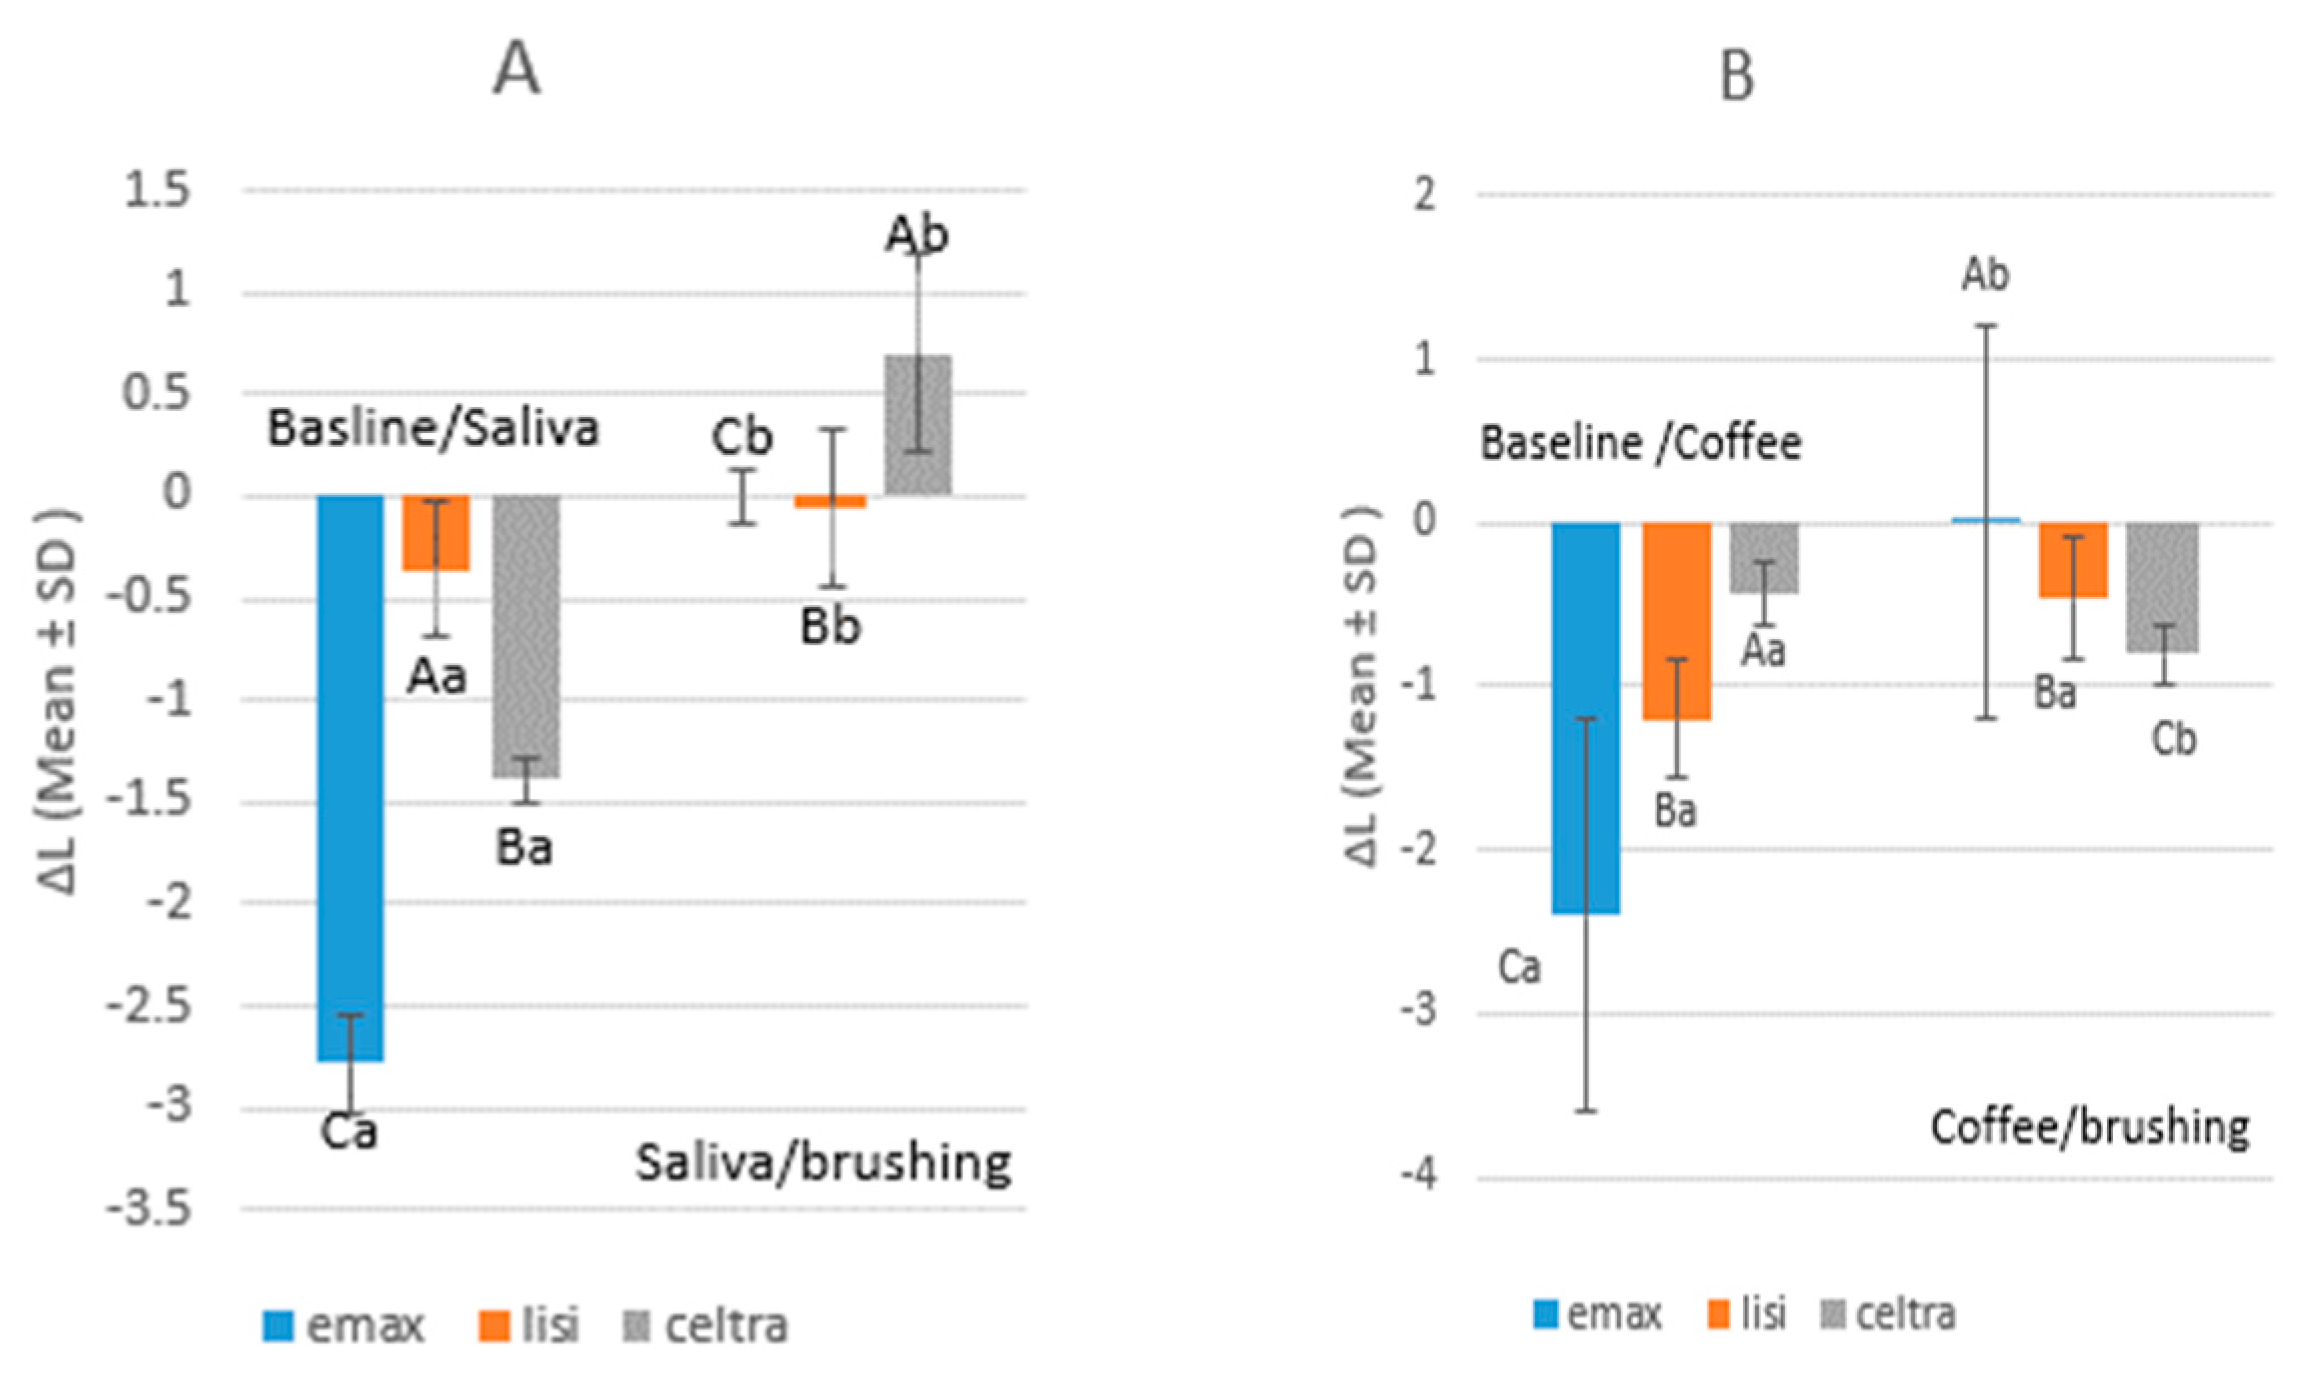
Lightness Difference (ΔL)
Redness-Greenness Difference (Δa)
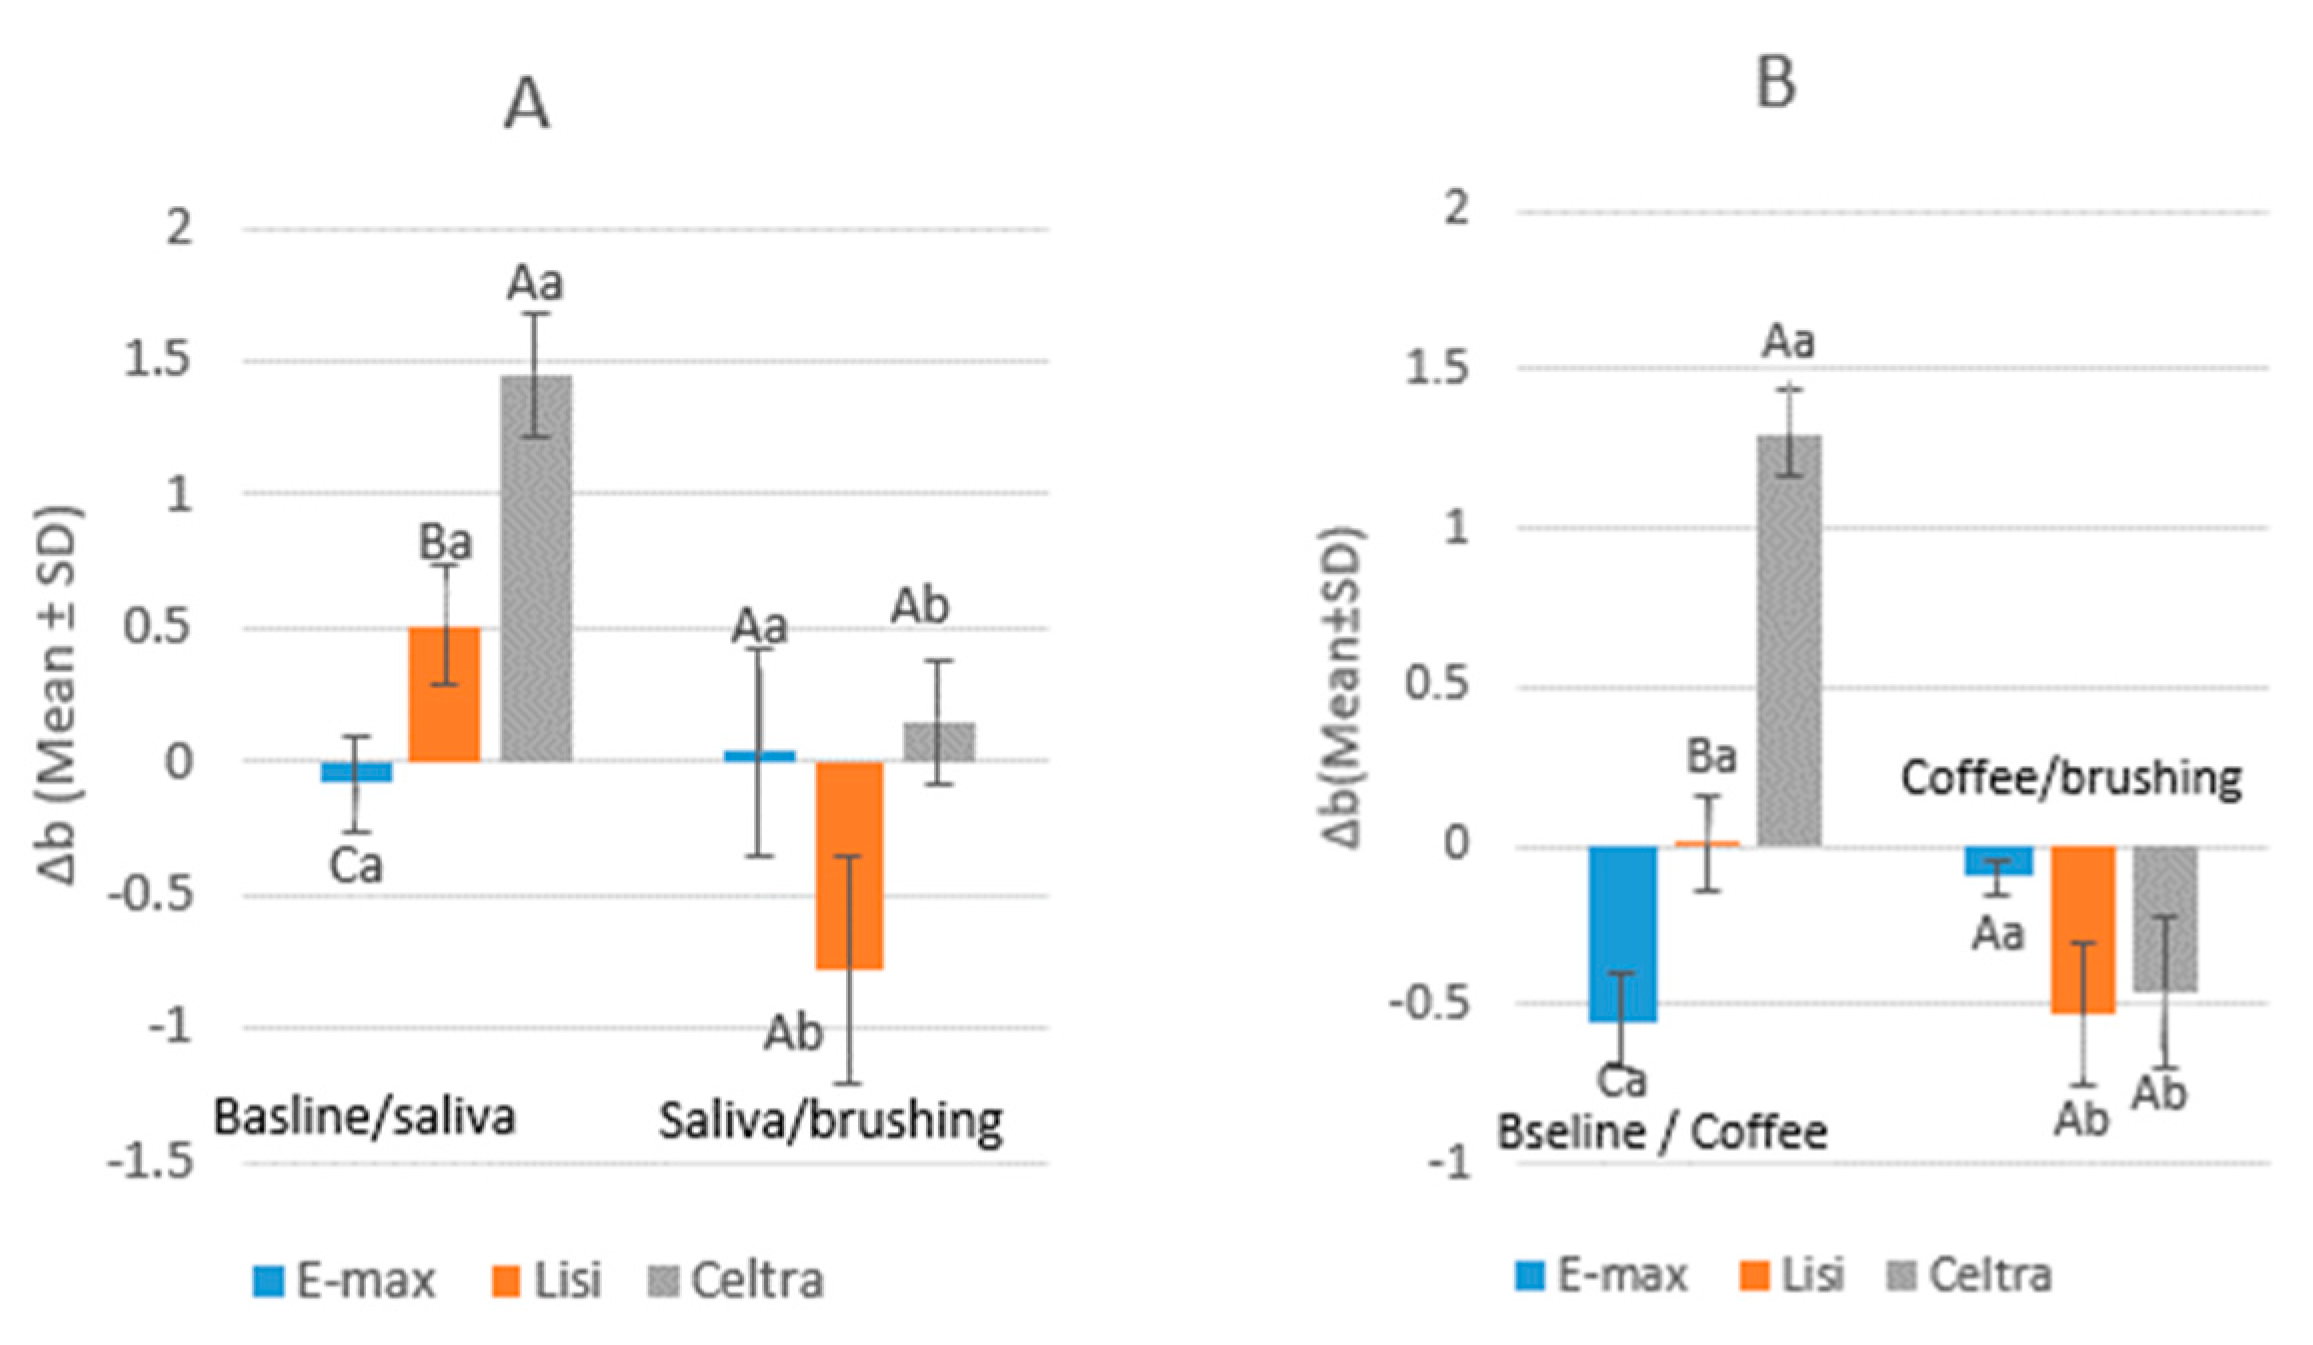
Yellowness-Blueness Difference (Δb)
4. Discussion
5. Conclusions
- The immersion of ceramic crowns constructed from repeated processed LDS, LDS-HDM, and ZLS into coffee resulted in perceivable color change.
- The clinically acceptable color of coffee-stained ceramic crowns constructed from repeated processed LDS-based ingots can be restored with routine tooth brushing.
Author Contributions
Funding
Institutional Review Board Statement
Informed Consent Statement
Data Availability Statement
Conflicts of Interest
References
- Culp, L.; McLaren, E.A. Lithium disilicate: The restorative material of multiple options. Compend. Contin. Educ. Dent. 2010, 31, 716-20, 722, 724-5. [Google Scholar] [PubMed]
- Ozturk, O.; Uludag, B.; Usumez, A.; Sahin, V.; Celik, G. The effect of ceramic thickness and number of firings on the color of two all-ceramic systems. J. Prosthet. Dent. 2008, 100, 99–106. [Google Scholar] [CrossRef] [PubMed]
- Kukiattrakoon, B.; Hengtrakool, C.; Kedjarune-Leggat, U. The effect of acidic agents on surface ion leaching and surface characteristics of dental porcelains. J. Prosthet. Dent. 2010, 103, 148–162. [Google Scholar] [CrossRef] [PubMed]
- Swain, M.V. Impact of oral fluids on dental ceramics: What is the clinical relevance? Dent. Mater. 2014, 30, 33–42. [Google Scholar] [CrossRef]
- Ccahuana, V.Z.; Ozcan, M.; Mesquita, A.M.; Nishioka, R.S.; Kimpara, E.T.; Bottino, M.A. Surface degradation of glass ceramics after exposure to acidulated phosphate fluoride. J. Appl. Oral. Sci. 2010, 18, 155–165. [Google Scholar] [CrossRef]
- Esquivel-Upshaw, J.F.; Dieng, F.Y.; Clark, A.E.; Neal, D.; Anusavice, K.J. Surface degradation of dental ceramics as a function of environmental pH. J. Dent. Res. 2013, 92, 467–471. [Google Scholar] [CrossRef] [Green Version]
- Minami, H.; Hori, S.; Kurashige, H.; Murahara, S.; Muraguchi, K.; Minesaki, Y.; Tanaka, T. Effects of thermal cycling on surface texture of restorative composite materials. Dent. Mater. J. 2007, 26, 316–322. [Google Scholar] [CrossRef] [Green Version]
- Bai, X.D.; Yan, Y.Z.; Li, Q. Spectrophotometric evaluation of color errors generated in the visual color duplication procedure for current ceramic veneers. J. Dent. Sci. 2021, 16, 145–153. [Google Scholar] [CrossRef]
- Paravina, R.D.; Ghinea, R.; Herrera, L.J.; Bona, A.D.; Igiel, C.; Linninger, M.; Sakai, M.; Takahashi, H.; Tashkandi, E.; Perez Mdel, M. Color difference thresholds in dentistry. J. Esthet. Restor. Dent. 2015, 27 (Suppl. S1), S1–S9. [Google Scholar] [CrossRef]
- Ergün, G.; Mutlu-Sagesen, L.; Ozkan, Y.; Demirel, E. In vitro color stability of provisional crown and bridge restoration materials. Dent. Mater. J. 2005, 24, 342–350. [Google Scholar] [CrossRef] [Green Version]
- Assunção, W.G.; Barão, V.A.; Pita, M.S.; Goiato, M.C. Effect of polymerization methods and thermal cycling on color stability of acrylic resin denture teeth. J. Prosthet. Dent. 2009, 102, 385–392. [Google Scholar] [CrossRef] [PubMed]
- Chu, S.J.; Trushkowsky, R.D.; Paravina, R.D. Dental color matching instruments and systems. Review of clinical and research aspects. J. Dent. 2010, 38 (Suppl. S2), e2-16. [Google Scholar] [CrossRef] [PubMed]
- Arif, R.; Yilmaz, B.; Johnston, W.M. In vitro color stainability and relative translucency of CAD-CAM restorative materials used for laminate veneers and complete crowns. J. Prosthet. Dent. 2019, 122, 160–166. [Google Scholar] [CrossRef] [PubMed]
- Conrad, H.J.; Seong, W.J.; Pesun, I.J. Current ceramic materials and systems with clinical recommendations: A systematic review. J. Prosthet. Dent. 2007, 98, 389–404. [Google Scholar] [CrossRef]
- Acar, O.; Yilmaz, B.; Altintas, S.H.; Chandrasekaran, I.; Johnston, W.M. Color stainability of CAD/CAM and nanocomposite resin materials. J. Prosthet. Dent. 2016, 115, 71–75. [Google Scholar] [CrossRef]
- Ghinea, R.; Pérez, M.M.; Herrera, L.J.; Rivas, M.J.; Yebra, A.; Paravina, R.D. Color difference thresholds in dental ceramics. J. Dent. 2010, 38 (Suppl. S2), e57-64. [Google Scholar] [CrossRef]
- Fujita, M.; Kawakami, S.; Noda, M.; Sano, H. Color change of newly developed esthetic restorative material immersed in food-simulating solutions. Dent. Mater. J. 2006, 25, 352–359. [Google Scholar] [CrossRef] [Green Version]
- Palla, E.S.; Kontonasaki, E.; Kantiranis, N.; Papadopoulou, L.; Zorba, T.; Paraskevopoulos, K.M.; Koidis, P. Color stability of lithium disilicate ceramics after aging and immersion in common beverages. J. Prosthet. Dent. 2018, 119, 632–642. [Google Scholar] [CrossRef]
- Schelkopf, S.; Dini, C.; Beline, T.; Wee, A.G.; Barão, V.A.R.; Sukotjo, C.; Yuan, J.C. The Effect of Smoking and Brushing on the Color Stability and Stainability of Different CAD/CAM Restorative Materials. Materials 2022, 15, 6901. [Google Scholar] [CrossRef]
- ElNaggar, Y.M.; Hammad, I.A.; Azer, A.S. Effect of additional pressing on the color and translucency of pressable ceramic materials: An in vitro study. J. Prosthet. Dent. 2021, 126, e581–e588. [Google Scholar] [CrossRef]
- Motro, P.F.; Kursoglu, P.; Kazazoglu, E. Effects of different surface treatments on stainability of ceramics. J. Prosthet. Dent. 2012, 108, 231–237. [Google Scholar] [CrossRef]
- Yuan, J.C.; Barão, V.A.R.; Wee, A.G.; Alfaro, M.F.; Afshari, F.S.; Sukotjo, C. Effect of brushing and thermocycling on the shade and surface roughness of CAD-CAM ceramic restorations. J. Prosthet. Dent. 2018, 119, 1000–1006. [Google Scholar] [CrossRef] [PubMed]
- Miyake, T.; Mashio, G.; Mori, D.; Fujimoto, T.; Yoshinaga, M.; Yokohara, H.; Hoshino, T.; Sato, T.; Kumagai, T. Evaluation of optical and physical properties for initial LiSi press. Dent. Mater. 2016, 1, e21. [Google Scholar] [CrossRef]
- Elsaka, S.E.; Elnaghy, A.M. Mechanical properties of zirconia reinforced lithium silicate glass-ceramic. Dent. Mater. Off. Publ. Acad. Dent. Mater. 2016, 32, 908–914. [Google Scholar] [CrossRef] [PubMed]
- Albakry, M.; Guazzato, M.; Swain, M.V. Biaxial flexural strength and microstructure changes of two recycled pressable glass ceramics. J. Prosthodont. 2004, 13, 141–149. [Google Scholar] [CrossRef] [PubMed]
- Haralur, S.B.; Raqe, S.A.N.; Alhassan Mujayri, F. Effect of Hydrothermal Aging and Beverages on Color Stability of Lithium Disilicate and Zirconia Based Ceramics. Medicina 2019, 55, 749. [Google Scholar] [CrossRef] [Green Version]
- Rosenstiel, S.F.; Land, M.F.; Walter, R. Contemporary Fixed Prosthodontics-e-Book; Elsevier Health Sciences: Amsterdam, The Netherlands, 2022. [Google Scholar]
- Joiner, A.; Hopkinson, I.; Deng, Y.; Westland, S. A review of tooth colour and whiteness. J. Dent. 2008, 36 (Suppl. S1), S2-7. [Google Scholar] [CrossRef]
- Almejrad, L.; Yang, C.C.; Morton, D.; Lin, W.S. The Effects of Beverages and Surface Treatments on the Color Stability of 3D-Printed Interim Restorations. J. Prosthodont. 2022, 31, 165–170. [Google Scholar] [CrossRef]
- Khazaal, G.; Daou, M.; Mahdi, S.S.; Ahmed, Z.; Maalouf, E.; Batteni, G.; Qasim, S.B.; Kassis, C.; Agha, D.; Haddad, H.; et al. In vitro evaluation of the color stability and surface roughness of a new composite flow. J. Clin. Exp. Dent. 2023, 15, e43–e50. [Google Scholar] [CrossRef]
- Neppelenbroek, K.H.; Urban, V.M.; de Oliveira, D.G.; Porto, V.C.; Almilhatti, H.J.; Campanha, N.H. Effect of potentially chromogenic beverages on shear bond strength of acrylic denture teeth to heat-polymerized denture base resins. J. Indian Prosthodont. Soc. 2016, 16, 271–275. [Google Scholar] [CrossRef]
- Bayindir, F.; Kürklü, D.; Yanikoğlu, N.D. The effect of staining solutions on the color stability of provisional prosthodontic materials. J. Dent. 2012, 40 (Suppl. S2), e41–e46. [Google Scholar] [CrossRef] [PubMed]
- Chu, F.C.; Chow, T.W.; Chai, J. Contrast ratios and masking ability of three types of ceramic veneers. J. Prosthet. Dent. 2007, 98, 359–364. [Google Scholar] [CrossRef] [PubMed]
- Jin, S.J.; Kim, D.Y.; Kim, J.H.; Kim, W.C. Accuracy of Dental Replica Models Using Photopolymer Materials in Additive Manufacturing: In Vitro Three-Dimensional Evaluation. J. Prosthodont. 2019, 28, e557–e562. [Google Scholar] [CrossRef] [PubMed] [Green Version]
- Comba, A.; Paolone, G.; Baldi, A.; Vichi, A.; Goracci, C.; Bertozzi, G.; Scotti, N. Effects of Substrate and Cement Shade on the Translucency and Color of CAD/CAM Lithium-Disilicate and Zirconia Ceramic Materials. Polymers 2022, 14, 1778. [Google Scholar] [CrossRef] [PubMed]
- Mutlu-Sagesen, L.; Ergün, G.; Ozkan, Y.; Bek, B. Color stability of different denture teeth materials: An in vitro study. J. Oral. Sci. 2001, 43, 193–205. [Google Scholar] [CrossRef]
- Sarac, D.; Sarac, Y.S.; Yuzbasioglu, E.; Bal, S. The effects of porcelain polishing systems on the color and surface texture of feldspathic porcelain. J. Prosthet. Dent. 2006, 96, 122–128. [Google Scholar] [CrossRef]
- Joiner, A. Colorimetric evaluation of tooth colour. In Colour Measurement; Elsevier: Amsterdam, The Netherlands, 2010; pp. 343–348. [Google Scholar]
- Akl, M.A.; Sim, C.P.C.; Nunn, M.E.; Zeng, L.L.; Hamza, T.A.; Wee, A.G. Validation of two clinical color measuring instruments for use in dental research. J. Dent. 2022, 125, 104223. [Google Scholar] [CrossRef]
- Pordeus Batista, L.A.; Vieira-Junior, W.F.; Pacheco, R.R.; Mori, A.A.; Sundfeld, D.; Pini, N.I.P. Color alteration with ceramic veneers according to the tooth type and preparation step: A clinical analysis. J. Prosthet. Dent. 2022, in press. [Google Scholar] [CrossRef]
- Noie, F.; O’Keefe, K.L.; Powers, J.M. Color stability of resin cements after accelerated aging. Int. J. Prosthodont. 1995, 8, 51–55. [Google Scholar]
- Park, J.K.; Kim, T.H.; Ko, C.C.; García-Godoy, F.; Kim, H.I.; Kwon, Y.H. Effect of staining solutions on discoloration of resin nanocomposites. Am. J. Dent. 2010, 23, 39–42. [Google Scholar]
- Kim-Pusateri, S.; Brewer, J.D.; Davis, E.L.; Wee, A.G. Reliability and accuracy of four dental shade-matching devices. J. Prosthet. Dent. 2009, 101, 193–199. [Google Scholar] [CrossRef] [PubMed]
- Dudea, D.; Gasparik, C.; Botos, A.; Alb, F.; Irimie, A.; Paravina, R.D. Influence of background/surrounding area on accuracy of visual color matching. Clin. Oral. Investig. 2016, 20, 1167–1173. [Google Scholar] [CrossRef] [PubMed]


Disclaimer/Publisher’s Note: The statements, opinions and data contained in all publications are solely those of the individual author(s) and contributor(s) and not of MDPI and/or the editor(s). MDPI and/or the editor(s) disclaim responsibility for any injury to people or property resulting from any ideas, methods, instructions or products referred to in the content. |
© 2023 by the authors. Licensee MDPI, Basel, Switzerland. This article is an open access article distributed under the terms and conditions of the Creative Commons Attribution (CC BY) license (https://creativecommons.org/licenses/by/4.0/).
Share and Cite
Anazi, A.A.; Sultan, S. The Effect of Brushing on Coffee Stainability of Ceramic Crowns Constructed from Repeatedly Processed Lithium Disilicate Ceramic Ingots: An In Vitro Study. Appl. Sci. 2023, 13, 7398. https://doi.org/10.3390/app13137398
Anazi AA, Sultan S. The Effect of Brushing on Coffee Stainability of Ceramic Crowns Constructed from Repeatedly Processed Lithium Disilicate Ceramic Ingots: An In Vitro Study. Applied Sciences. 2023; 13(13):7398. https://doi.org/10.3390/app13137398
Chicago/Turabian StyleAnazi, Amal Al, and Sherif Sultan. 2023. "The Effect of Brushing on Coffee Stainability of Ceramic Crowns Constructed from Repeatedly Processed Lithium Disilicate Ceramic Ingots: An In Vitro Study" Applied Sciences 13, no. 13: 7398. https://doi.org/10.3390/app13137398
APA StyleAnazi, A. A., & Sultan, S. (2023). The Effect of Brushing on Coffee Stainability of Ceramic Crowns Constructed from Repeatedly Processed Lithium Disilicate Ceramic Ingots: An In Vitro Study. Applied Sciences, 13(13), 7398. https://doi.org/10.3390/app13137398