Article

Temporal Variations Dataset for Indoor Environmental Parameters in Northern Saudi Arabia

1
Department of Information and Computer Science, College of Computer Science and Engineering, University of Ha’il, Ha’il 81481, Saudi Arabia
2
Computer Engineering Department, Faculty of Engineering, Cairo University, Giza 3725121, Egypt
3
School of Computing and Communications, Lancaster University, Lancaster LA1 4YW, UK
*
Authors to whom correspondence should be addressed.
Appl. Sci. 2023, 13(12), 7326; https://doi.org/10.3390/app13127326
Submission received: 25 May 2023 / Revised: 11 June 2023 / Accepted: 16 June 2023 / Published: 20 June 2023

Abstract

:
The advancement of the Internet of Things applications (technologies and enabling platforms), consisting of software and hardware (e.g., sensors, actuators, etc.), allows healthcare providers and users to analyze and measure physical environments at home or hospital. The measured physical environment parameters contribute to improving healthcare in real time. Researchers in this domain require existing representative datasets to develop machine-learning techniques to learn physical variables from the surrounding environments. The available environmental datasets are rare and need too much effort to be generated. To our knowledge, it has been noticed that no datasets are available for some countries, including Saudi Arabia. Therefore, this paper presents one of the first environmental data generated in Saudi Arabia’s environment. The advantage of this dataset is to encourage researchers to investigate the effectiveness of machine learning in such an environment. The collected data will also help utilize the machine learning and deep learning algorithms in smart home and health care applications based on the Saudi Arabia environment. Saudi Arabia has a special environment in each session, especially in the northern area where we work, where it is too hot in the summer and cold in the winter. Therefore, environmental data measurements in both sessions are important for the research community, especially those working in smart and healthcare environments. The dataset is generated based on the indoor environment from six sensors (timestamps, light, temperature, humidity, pressure, and altitude sensors). The room data were collected for 31 days in July 2022, acquiring 8910 records. The datasets include six columns of different data types that represent sensor values. During the experiment, the sensors captured the data every 5 min, storing them in a comma-separated value file. The data are already validated and publicly available at PLOMS Press and can be applied for training, testing, and validating machine learning algorithms. This is the first dataset developed by the authors for the research community for such an environment, and other datasets will follow it in different environments and places.

1. Introduction

Recent advancements in information and communication technology and the Internet of Things (IoT) have increased the number of sensors used in smart cities. Collecting and analyzing enormous amounts of data from connected devices in homes and cities has emerged as a significant study area. At the same time, algorithms for machine learning have been deployed to learn and analyze data collected from various sensors to classify and predict trends in smart homes and cities. Several factors have contributed to the popularity of utilizing algorithms for machine learning in today’s society. Three primary aspects inspire the use of machine learning [1]: (a) computers have high performance and memory; (b) machine learning algorithms learn and train on behavioral patterns resembling the human brain; and (c) huge datasets available.
Therefore, collecting environmental datasets is essential for monitoring environmental conditions and gaining knowledge of the environment’s state in any country, including Saudi Arabia. Deserts, mountains, coastal regions, and marine environments are only a few of the ecosystems that may be found in Saudi Arabia. As a result, collecting data on the environment in Saudi Arabia is essential for various reasons. To begin, it might help identify environmental problems such as pollution, the degradation of habitats, conditions affecting healthcare, and the implications of climate change. Scientists and officials can comprehend the environment’s condition better and make informed decisions about how to handle environmental challenges if they acquire data on the quality of the air and water, changes in the environment, and the distribution of animals. Second, collecting data on the environment may assist in keeping track of the movement toward environmental objectives and targets. Researchers may improve their knowledge of the dynamics of ecosystems, their ability to anticipate changes in the environment, and their ability to recommend solutions to environmental issues by using environmental data. For instance, Saudi Arabia has vowed to drastically decrease its emissions of greenhouse gases by 2030 drastically and to significantly raise the percentage of its total energy supply that comes from renewable sources. Collecting energy use, emissions, and renewable energy generation data may help track progress toward these objectives and identify areas where extra action may be required. Last but not least, collecting environmental data may facilitate research and innovation in various sectors, such as healthcare, smart cities, ecosystem, climatology, and environmental engineering.
Collecting environmental data is a crucial component of environmental management and holds significant importance in Saudi Arabia, which is confronted with various environmental problems. The nation has been facing noteworthy air pollution challenges due to industrialization and urbanization, which have led to increased health and environmental concerns [2]. Furthermore, the nation depends mostly on wells in water supply [3]. Moreover, the climate varies from city to city. Temperatures may reach over 40 degrees in the summer season. At the same time, the temperature could reach below zero degrees in the northern cities. In response to the environmental challenges, Saudi Arabia has undertaken various environmental initiatives such as the Saudi Green Initiative and the Green Middle East Initiative. These initiatives are designed to mitigate greenhouse gas emissions, conserve natural resources, and enhance renewable energy production [4]. The efficacy of these endeavors is contingent upon the accurate and reliable collection of environmental data. Environmental data collection in Saudi Arabia is presently conducted by various governmental and non-governmental entities, such as the Ministry of Environment, Water, and Agriculture, the General Authority for Meteorology and Environmental Protection, and the Saudi Arabian Society for Environmental Sciences [5]. These entities gather ecological information on various parameters, including but not limited to the environment and water-based quality, soil and land use, and biodiversity.
Saudi Arabia has to deal with the problem of urbanization, as over 85% of its population resides in urban areas, as per the studies conducted by [6]. This is in addition to the environmental challenges that the country is dealing with. The nation is addressing the challenges of urbanization by creating intelligent cities, such as Neom and Riyadh, that strive to leverage technology and data to enhance the prosperity of citizens and promote sustainable development [7]. In addition, collecting environmental data is crucial in advancing smart city initiatives. Monitoring and mitigating urban heat island effects in cities can be facilitated by collecting air quality, temperature, and humidity data. According to [8], collecting energy usage and emissions data can optimize energy consumption and mitigate greenhouse gas emissions within smart urban areas. In addition, collecting environmental data is important for meeting healthcare needs in Saudi Arabia. Environmental factors such as air pollution, water contamination, and poor sanitation can substantially affect public health. Collecting environmental data can identify possible risk factors and provide valuable information for developing public health policies and interventions to mitigate these risks. An investigation was carried out to examine the effects of air pollution on public health in the city of Jeddah through the collection and analysis of relevant data [9]. The authors of [10] revealed that the prevalence of respiratory and cardiovascular diseases was linked to elevated levels of air pollutants in Jeddah. The above data was utilized to develop policies and interventions that focused on enhancing the air quality within the urban area. These measures included the mitigation of emissions from both transportation and industrial sources.
In light of the growing interest in smart homes and cities, researchers have attempted to incorporate different aspects of urban life into smart homes and cities through important technologies, including the IoT paradigm, wireless sensor networks, embedded systems, and other related technologies. Machine learning algorithms have various potential applications in smart home and city environments, including dealing with problems related to healthcare, power consumption, and automation. To effectively apply machine learning algorithms for various applications, it is necessary to have a dataset representative of the problem domain for training and testing purposes. The dataset demonstrates the potential for evaluating and validating the proposed method’s accuracy. Although many real-world datasets are publicly accessible, some lack adequate physical factors such as temperature, humidity, pressure, and altitude. It reads data from sensors that can be noisy, has poor network conditions, and is subject to several unknown variables, such as missing data and faulty sensors. Consequently, it is prone to errors that affect the accuracy of the data.
As seen from the previous discussion, there are some efforts either from the authorities or researchers in environmental data collection in Saudi Arabia. However, the focus was on the outdoor environment. There is a lack of indoor environment data collection; to our knowledge, no dataset is already available for researchers. Therefore, this paper is an essential effort toward the indoor dataset availability in the Saudi Arabia environment, especially in the northern area. The dataset was generated using the Arduino integrated development environment (IDE), an open-source electronics platform that uses hardware and software. It includes several sensors on a board that can generate data using light, temperature, humidity, and other sensors. The dataset was generated from real sensors to measure physical variables in a home for one month. The dataset contains five features representing temperature, humidity, pressure, light, and altitude. It records measurements of physical variables in real time.
To summarize, this paper makes several significant contributions to the field of environmental data collection, specifically within the context of indoor environments in Saudi Arabia:
  • Environmental dataset: This manuscript presents significant contributions to the domain of environmental data collection, particularly in the realm of indoor environments in Saudi Arabia. The dataset is publicly available at PLOMS Press [11].
  • Addressing a Research Gap: The paper aims to fill a gap in the existing research and data collection efforts in Saudi Arabia, which have predominantly concentrated on outdoor settings. This manuscript introduces one of the nation’s initial datasets of indoor environments.
  • Regional Specificity: The dataset holds significant value for research endeavors that concentrate on the northern region of Saudi Arabia, owing to its distinct environmental features.
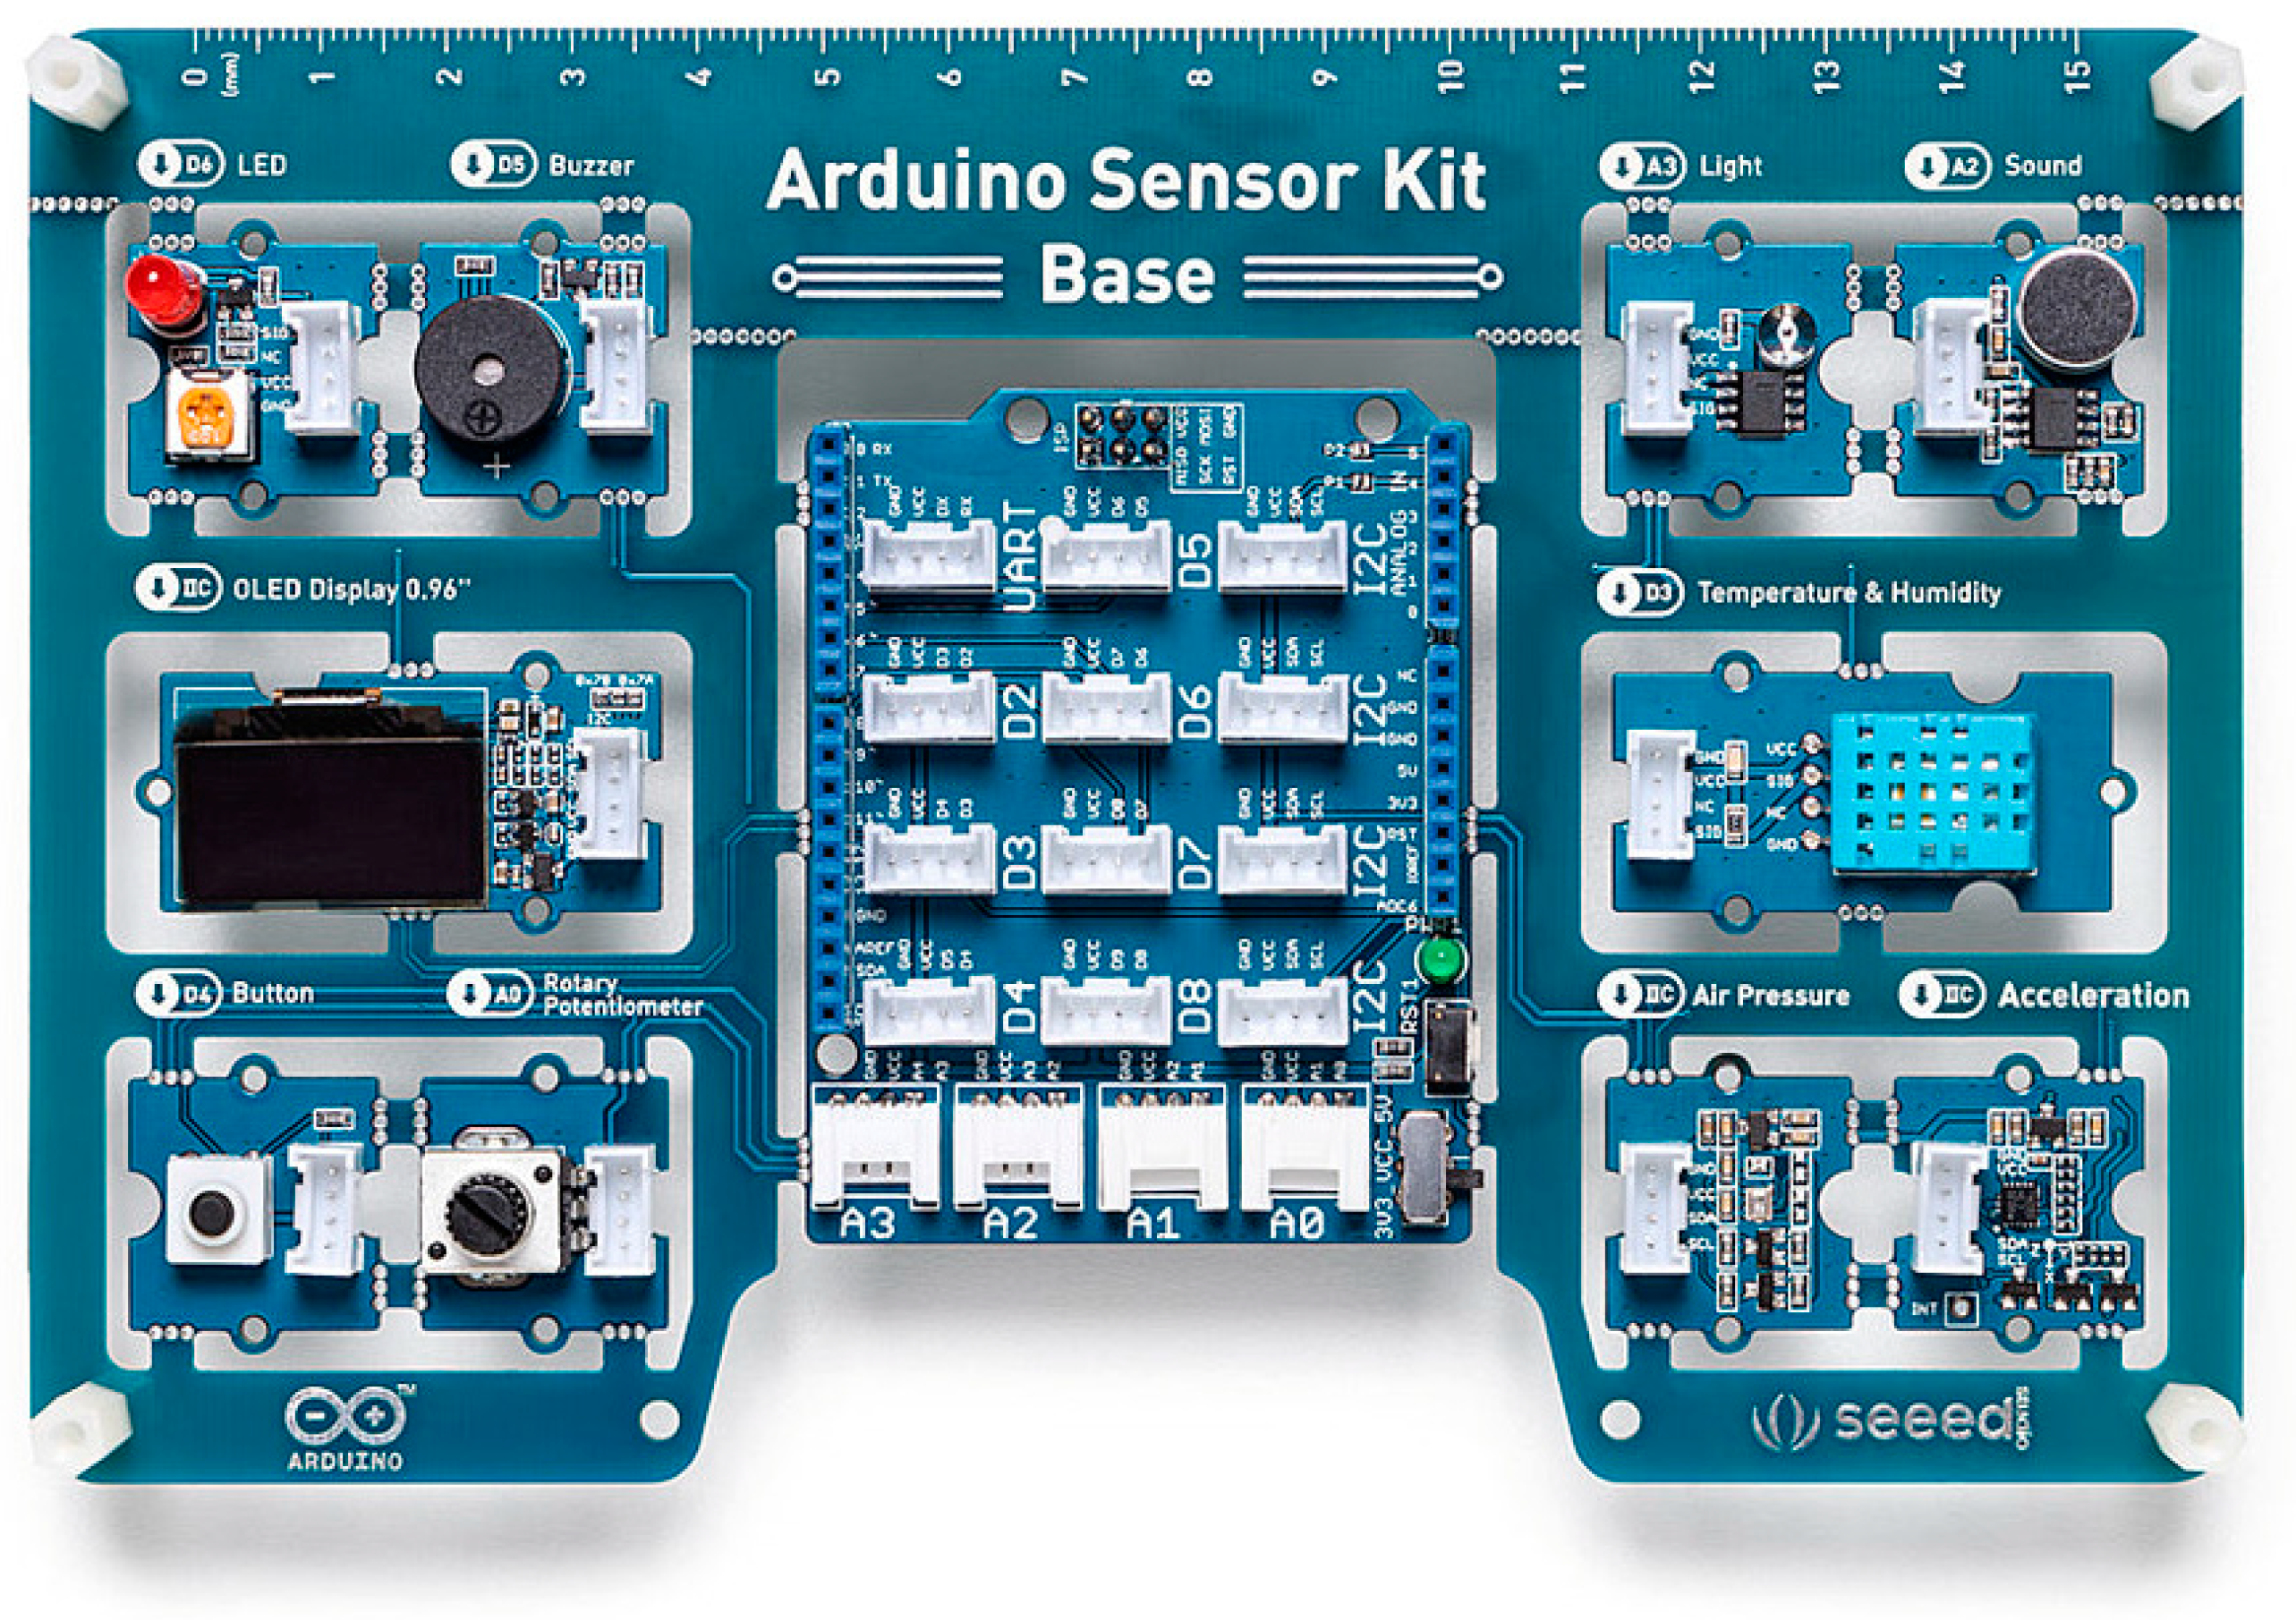
  • Use of Arduino IDE: The data was acquired through the use of the Arduino Integrated Development Environment (IDE), an open-source electronics platform that integrates both hardware and software. The implementation of this platform signifies a novel method for collecting indoor environmental data.
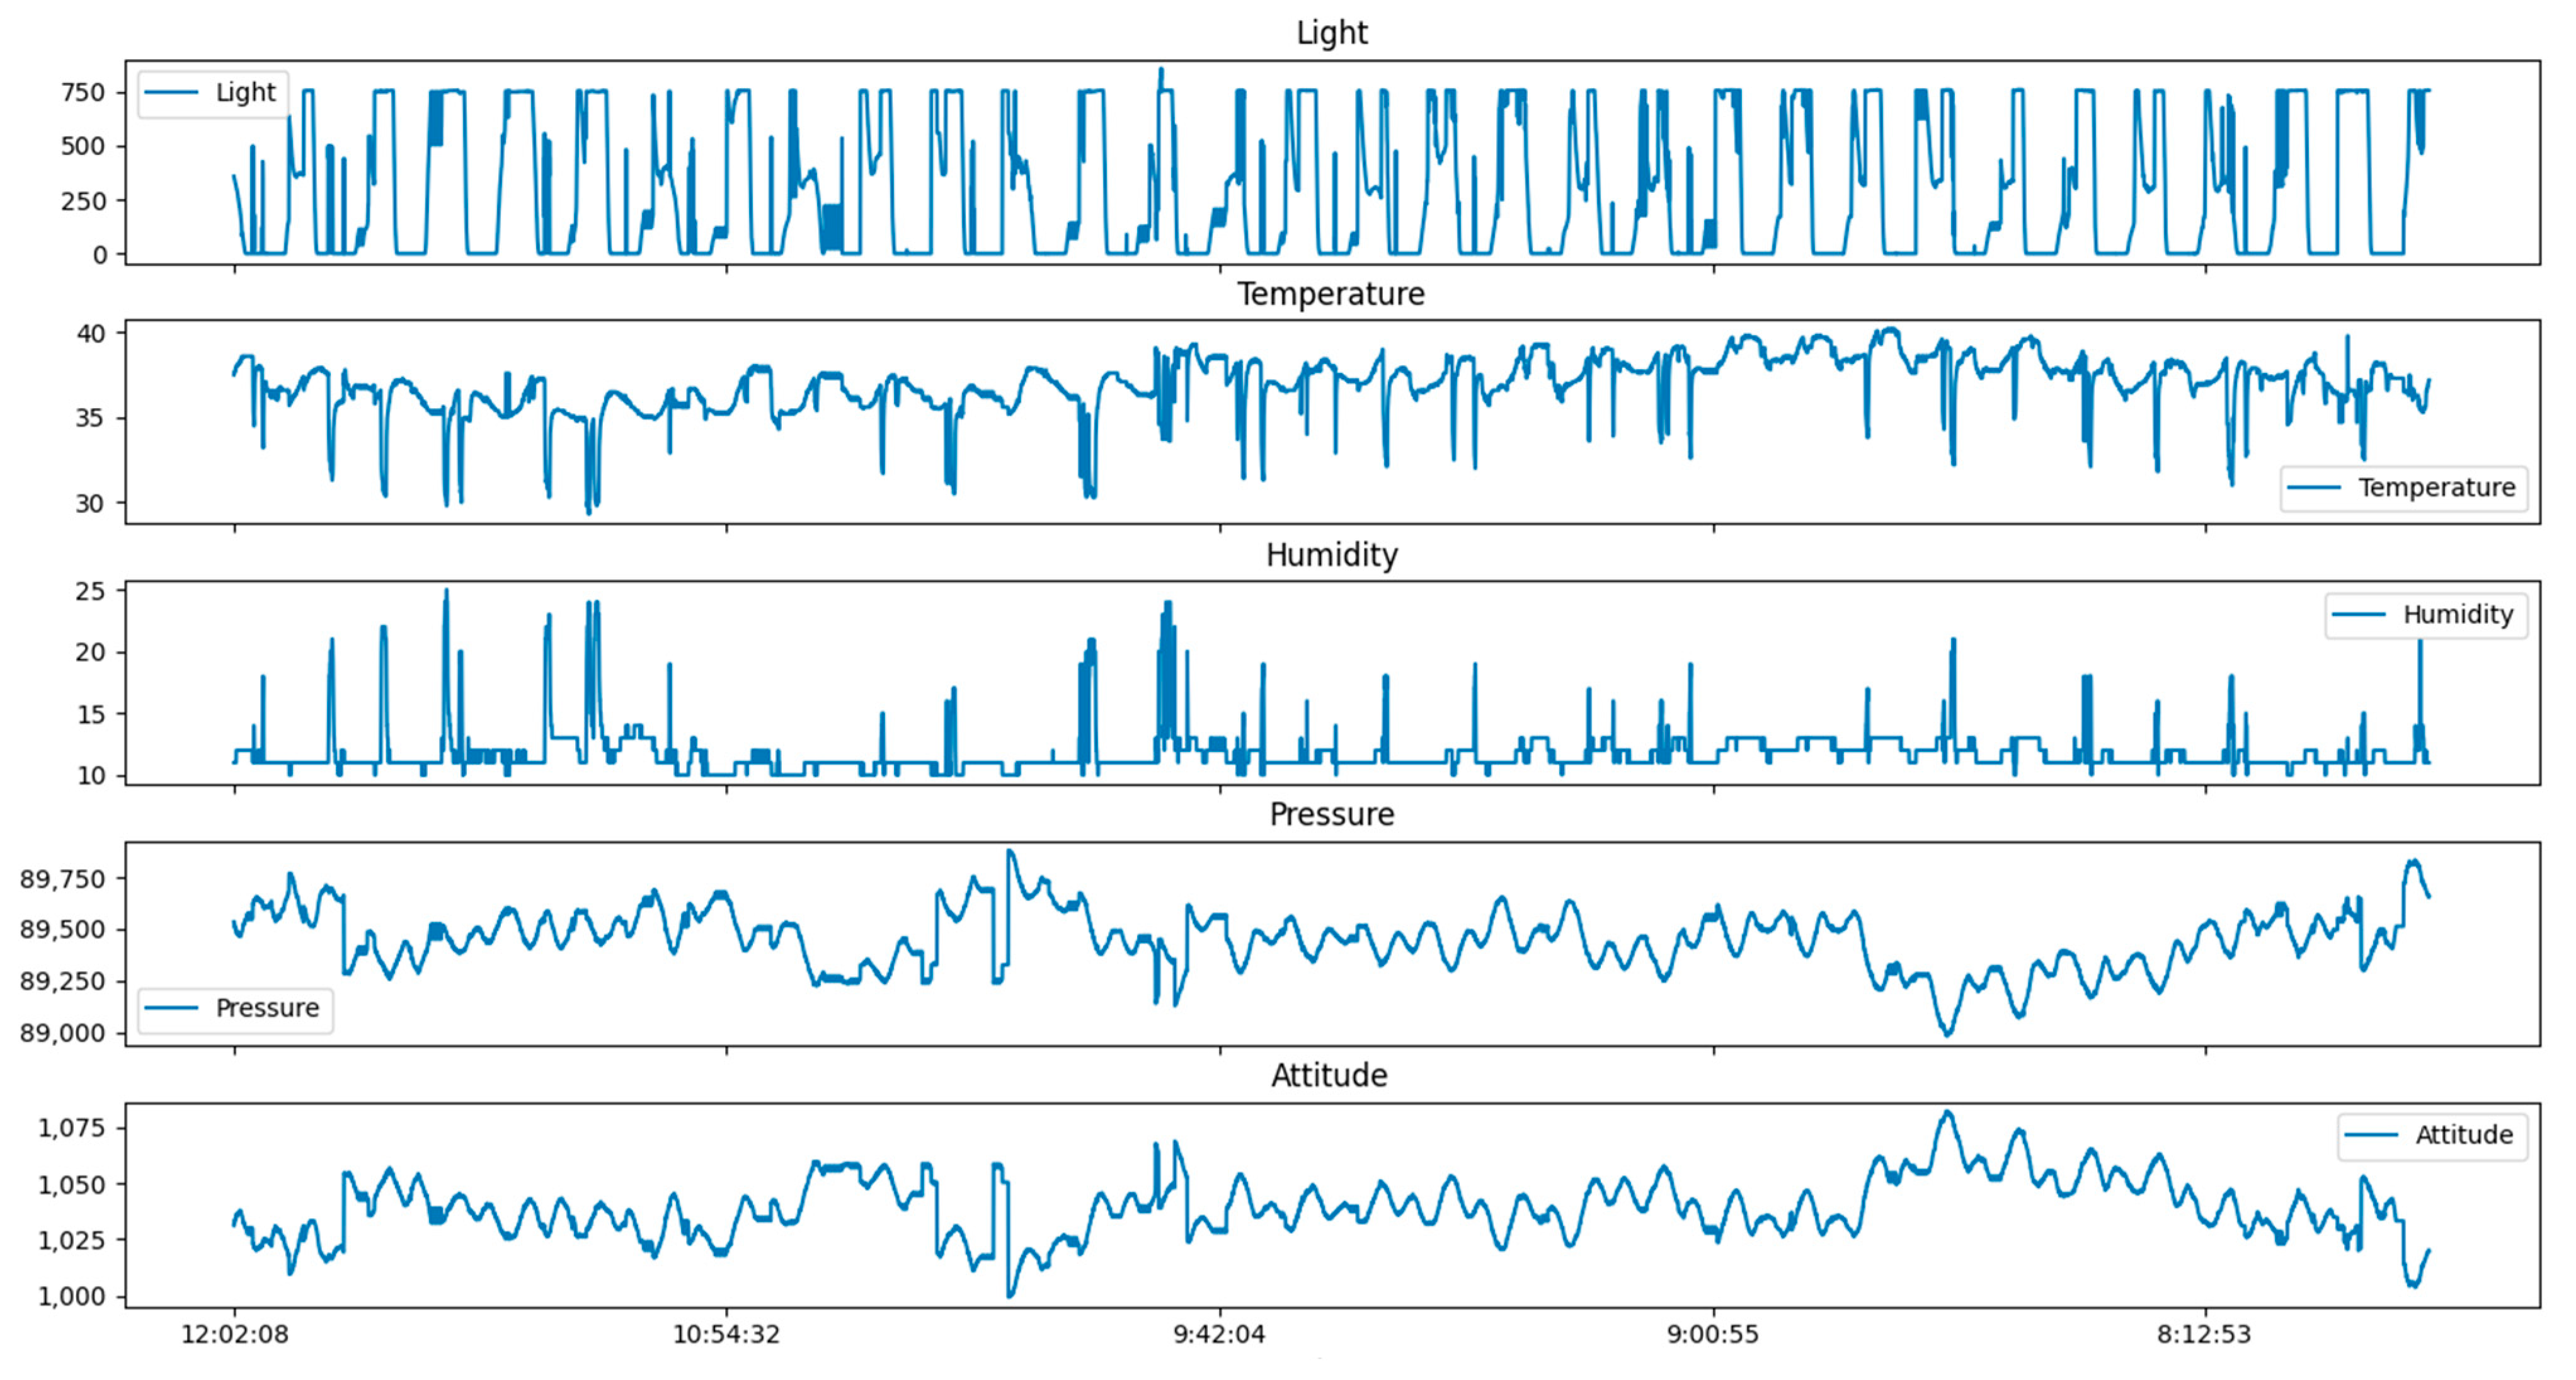
  • Wide Range of Variables: The dataset comprises measurements from various sensors that capture data on light, temperature, humidity, pressure, and altitude. The diverse range of data points can offer a comprehensive overview of the indoor environment.
  • Real-time Data Collection: Real-time data collection was conducted by generating a dataset from sensor readings taken over one month. The collected data provides a rich temporal perspective for analysis.
  • Practical Application: This dataset holds significant value for researchers investigating indoor environments, their effects on health and well-being, and the advancement of smart home technologies. It is suitable for training, testing, and validating machine learning algorithms within these domains.
The paper is structured as follows. Section 2 presents the related work in the literature. Section 3 clarifies the architecture and how to use the Arduino IDE and sensor devices to measure physical variables and generate datasets. Section 4 presents the methodology for acquiring the data from sensor devices to generate datasets. Section 5 describes the datasets.

2. Related Work

The collection and availability of environmental datasets are essential for making accurate choices regarding environmental management, sustainability, and public health. Research has indicated that open environmental datasets can substantially benefit research, policymakers, and decision-making processes [12]. Notwithstanding, challenges exist in enhancing the accessibility of environmental data sets, such as concerns regarding data quality, privacy, and ownership. Effective management of big data for environmental sustainability requires adopting data integration, standardization, and quality control strategies, as Hřebíček and Hejč [13] highlighted. Implementing environmentally sustainable practices heavily relies on data-driven decision-making, which involves systematically collecting, analyzing, and visualizing data to inform policies and interventions to foster environmental sustainability [14,15]. Understanding the availability and accessibility of environmental data is crucial for proficient environmental governance. Refs. [15,16] conducted a study on the availability of environmental data in the United States. The study revealed that despite the abundance of environmental data sources, limited access to data remains, with certain data remaining inaccessible to the public.
Furthermore, collecting indoor environmental parameters is crucial for maintaining a healthy and comfortable indoor environment. The indoor environmental parameters involve various factors such as temperature, humidity, air quality, lighting, and noise levels. The parameters above have the potential to influence indoor air quality, thereby leading to consequential negative health effects, especially for vulnerable populations such as children and elderly people. Collecting and monitoring indoor environmental parameters can aid in identifying potential sources of indoor air pollution and promote effective interventions to improve indoor air quality. Collecting indoor environmental parameters is crucial for optimizing energy efficiency and enhancing building performance. Through monitoring and controlling indoor environmental factors, facility managers and residents can enhance energy efficiency and reduce energy consumption. Modifying the temperature and lighting parameters per occupancy patterns can yield considerable conservation of energy benefits while maintaining optimal indoor comfort levels. In addition, collecting indoor environmental parameters is essential for implementing intelligent buildings and integrating the Internet of Things (IoT). Sensors and monitoring devices that rely on the Internet of Things (IoT) can gather runtime data on indoor environmental parameters and communicate this information to a central control system. Subsequently, the control system can examine the data and regulate the building systems correspondingly, aiming to enhance energy efficiency and improve indoor comfort. The implementation of this approach has the potential to mitigate energy expenses, optimize building functionality, and boost occupant satisfaction.
Many academic studies have highlighted the significance of collecting indoor environmental parameters. Figure 1 shows the number of publications related to indoor environments in a 10-year range. As can be seen from the figure, the number of publications increased drastically in 2021, where the smart cities trend has been a hot topic. However, we believe that due to the lack of datasets, the number of publications has been reduced. Table 1 also shows some of the research done in the environment based on the country and the collected parameters.
The collection of accurate indoor environmental parameters requires the utilization of suitable monitoring equipment and data analysis software. Sophisticated monitoring equipment, such as sensors and data loggers, can facilitate the collection of precise and up-to-date indoor environmental data. Using data analysis tools, such as statistical models and machine learning algorithms, can facilitate the identification of patterns and trends within the data. This, in turn, can enable the implementation of effective interventions aimed at improving indoor air quality.
The previous table illustrates that the studies were conducted in various cities and regions worldwide, emphasizing the importance of collecting indoor environmental parameters. These studies have shown that various factors, including outdoor air pollution, building materials, ventilation rates, and human activities, can influence indoor air quality. Through collecting and analyzing indoor environmental parameters, building managers and policymakers may develop successful strategies to enhance indoor air quality and preserve the well-being of building residents. An interesting dataset is generated by the authors of [32] that consists of timestamps, temperature, and humidity, including 4,164,267 records spanning over two months in Columbia, USA. A total of 12 sensors were installed within the laboratory to measure the temperature and humidity levels accurately. A dataset was produced to support Internet of Things (IoT) researchers. Machine learning algorithms were used to create and evaluate the models. Aside from the previous table, there is some related research related to Saudi Arabia’s environmental measures, such as [33,34]. Both papers proved the importance of country-specific environmental parameters in different fields.
Table 2 shows different environmental datasets that are available to the public. However, none of them are related to Saudi Arabia’s environment.
Furthermore, some other related research has been recently presented in the literature. Common approaches for time series forecasting include statistical methods, machine learning, and deep neural networks. Statistical methods use mathematical and probability analysis to model time series data based on past trends. Common time series forecasting techniques make up the autoregressive model, autoregressive moving average (ARMA) model, and differential autoregressive moving average (ARIMA) model. Zeng et al. [45], Wang et al. [46], and Chen [47] have investigated the integration of statistical models with backpropagation neural networks to enhance predictions for various applications, including wind power, cloud coverage, and power generation.
Machine learning techniques are better suited for nonlinear fitting problems because they adjust model parameters through internal iterations. Xiao [48] proposed a rough set backpropagation model for short-term load prediction, which mitigates the effect of noise on prediction accuracy. Multilayer perceptron (MLP) [49], support vector machine (SVM) [50], and hidden Markov models [51] are additional machine learning techniques used for time series forecasting. DNNs [52] also have facilitated the handling of intricate data. DNNs have exhibited exceptional performance in diverse applications, including fault detection, speech recognition, natural language processing (NLP), and disease diagnosis. RNNs have strong nonlinear fitting abilities due to their ability to establish connections in the hidden layers that consider the temporal aspects of the data. Traditional RNNs [53] encounter vanishing gradients, which hinder their ability to capture long-term dependencies. LSTMs and GRUs [54] have been introduced in recent years to address this limitation. LSTMs address gradient vanishing and long-term dependency issues in RNNs by using multiple gated structures.
The significant developments in statistical data-driven machine learning have revived notable interest in artificial intelligence. The success of AI can be due to two pervasive factors: the availability of extensive datasets and increasing computational power. Deep learning (DL) algorithms gained significant success in various industries and everyday life applications around 2010. Examples include Siri, Alexa, and DeepL. The recent resurgence of AI indicates the beginning of a second AI revolution. OpenAI’s ChatGPT [55] is a recent example of advanced natural language technology that demonstrates the outstanding potential of contemporary AI. The AI shows its capabilities while recognizing the absence of human senses.
The main objective of AI is to develop the theoretical basis for ML, which enables the creation of software that can learn independently from previous experiences without human involvement [56]. To achieve practical intelligence, specific steps must be taken. The process involves utilizing historical information, collecting knowledge, making generalizations, addressing issues related to high-dimensional data, and uncovering explanatory factors within the data. The objective of machine learning is to create algorithms that can learn from data, acquire knowledge, and improve their learning abilities over time in order to understand intelligence. The main challenge is recognizing relevant structural and temporal patterns, also known as “knowledge”, which are frequently hidden in complex spaces that have many dimensions, making them difficult for humans to access [57].
Nevertheless, there are known challenges in analyzing data within particular application domains. Data quality and relevant feature inclusion are essential. Previous research has shown that the optimal approach involves combining various low-level features with high-level contextual details [25]. However, the algorithms’ ability to reproduce results, interpret findings, and explain outcomes to domain experts limits the full potential of AI and ML.

3. Methodology

The popular open-source platform Arduino is used for creating and developing electrical products. A broad range of sensors is used for collecting data and generating datasets. Among the typical sensors used with Arduino are:
  • Temperature and Humidity Sensors: DHT11 and DHT22 are two common sensors used to monitor temperature and humidity in the environment. To provide precise measurements, these sensors make use of digital signals.
  • Light Sensors: For measuring the light level in the surrounding area, photodiodes and photoresistors may be used, such as the LDR (Light Dependent Resistor).
Using these sensors, we performed the following processes to create a dataset:
  • Select the sensors necessary for the project and attach them to the Arduino board in line with the wiring diagrams provided by the sensors.
  • Create an Arduino sketch and upload it to read data from the sensors. To simplify this process, utilize the built-in features or libraries unique to each sensor.
  • Collecting the sensor data regularly may transfer it to a computer or other storage device for long-term preservation, or you can temporarily store it in the Arduino’s memory.
  • Analyze and delete the information gathered. In this stage, outliers may be eliminated, noise may be filtered, or raw sensor results may be converted into useful units (for example, translating ADC values to temperature in Celsius).
  • To make analysis and visualization easier, arrange the cleaned data into an organized format, such as a CSV file or a relational database. Then, we can utilize this information for various things, including developing machine learning models, keeping an eye on trends, or generating predictions.
The next subsection describes the sensors used with the Arduino, followed by the generation of the dataset.

Data Acquisition

In this section, we describe the data acquisition process, which involves collecting and storing sensor data using the Arduino kit shown in Figure 2. The data acquisition system consists of multiple sensors connected to an Arduino board, which is responsible for reading sensor values and transmitting the data to a storage device or a computer for further analysis. The steps involved in the data acquisition process are as follows:
  • Sensor Selection and Integration:
We selected the appropriate sensors based on the project’s objectives to measure the required parameters. These sensors were built on the Arduino board. The dataset was collected from six sensors using the Arduino board. Arduino boards can control and manage home activities, such as reading input from temperature, humidity, and light sensors. This research used six sensors, measuring temperature, humidity, pressure, altitude, light, and timestamps. Arduino boards read the sensor data in real time with a timestamp column.
2.
Arduino Programming:
We developed an Arduino program to read data from the connected sensors. The program used built-in functions and libraries specific to each sensor for accurate and efficient data collection. The Arduino code was written in C++, leveraging the Arduino IDE to compile and upload the code to the board.
3.
Data Collection:
The Arduino board was programmed to collect sensor data at regular intervals. We chose an appropriate sampling rate to ensure sufficient data points were captured while avoiding excessive data storage requirements or potential sensor overloading. The data was temporarily stored in the Arduino’s memory before being transmitted to a computer or storage device.
4.
Data Transmission:
To transmit the data from the Arduino board to a computer or storage device, we used one of the following methods:
  • Serial Communication: We utilized Arduino’s built-in serial communication capabilities to send data directly to a computer via USB. This method allowed real-time monitoring and data collection using a serial monitor or a custom software interface. We imported the library and used a serial monitor, which begins at 9600, which is the speed. The sensor reads the temperature in Celsius, and we set a delay of 5 min before accessing the sensor to integrate these sensors.
  • Wireless Communication: In cases where a wired connection was not feasible, we employed wireless communication modules such as Bluetooth, Wi-Fi, or LoRa to transmit data to a nearby computer or a cloud-based storage solution.
5.
Data Storage and Organization:
Upon receiving the sensor data, we stored the information in a structured format, such as a CSV file. This allowed for easy access and analysis of the collected data. We also timestamped each data entry to provide a chronological context for the measurements.

4. Dataset Description

In this research, we generated a comprehensive dataset tailored for classification problems. The dataset comprises 31 individual files, each corresponding to a day in July 2022. To preserve the privacy of the data and people, several measures were taken while gathering data, which included anonymization of the data. There was no need to obtain informed consent from the participants since it was in one of the author’s homes and followed data minimization principles. These steps were taken to comply with General Data Protection Regulation (GDPR) [58] and local data protection laws [59].
To maintain consistency and ensure the relevance of the data, each file contains approximately 288 records, representing data collected over 24 h. The chosen sensors in the data acquisition system were programmed to capture data every 5 min. This sampling rate was determined through a thorough dataset analysis, revealing that most significant changes in the critical variables occur over extended periods. The 5 min intervals were sufficient for capturing relevant and meaningful data without overloading the system or generating excessive storage requirements. Once the data was collected, we combined all 31 files into a single, consolidated dataset containing 8910 records. This comprehensive dataset comprises six columns, each representing a different data type: time, integer, and decimal values. Including multiple data types allow for a more robust and versatile dataset that can be utilized across various classification problems.
Table 3 in the research paper presents a dataset sample, showcasing several records and their respective values across the six columns. This table offers a snapshot of the data’s structure and format, clearly representing the information collected during the research.
The following charts (Figure 3 and Figure 4) offer a comprehensive and detailed analysis of the changes in physical variables, specifically temperature and humidity, within an office room from the 1–31 July. Over this period, a distinct upward trend was observed in temperature, while humidity experienced a downward trend. Throughout the month, both temperature and humidity experienced fluctuations. At the beginning of the period, when the air conditioner was in operation, humidity levels were relatively low, leading to a decrease in temperature to approximately 29 °C. However, as time progressed, humidity levels gradually increased, reaching nearly 25% by the end of the month.
The standard range for temperature in the office room was between 29.3 °C and 40.2 °C, while relative humidity ranged from 10% to 25%. To ensure the accuracy and reliability of the data, the temperature and humidity sensors were calibrated with precision. The calibration process and its results are depicted in Figure 4, providing a clear understanding of the sensor’s performance and measurement capabilities. The data highlights the fluctuating nature of these physical variables and the impact of external factors such as air conditioning, providing valuable insights for further analysis and optimization of office environments.
The pressure variable averaged 89,448, and the altitude feature averaged 1039. The measurements were conducted in an office room, where the light is sometimes turned off, so the minimum degree of change in the sensor is zero. In contrast, the light sensor data collected during this research provided valuable insights into the illumination conditions within the monitored environment. The sensor used in this study could measure light intensity within a range of 0 to 820 lux. This range effectively captures various lighting conditions, from complete darkness to bright indoor lighting scenarios. Throughout data collection, the light sensor recorded illumination levels at regular intervals, enabling us to analyze fluctuations and trends in the lighting conditions. By examining these data points, we could identify periods of low and high illumination, which may correspond to different times of the day, occupancy patterns, or changes in the natural light entering the space. The light sensor data also allowed us to investigate potential correlations between illumination levels and other variables, such as temperature and humidity. For instance, we could examine whether increased light intensity leads to a rise in temperature or a change in humidity levels. This information can be crucial in understanding indoor environmental quality and implementing appropriate control strategies for lighting and HVAC systems.
Furthermore, the light sensor data can be used to assess the effectiveness of existing lighting systems and inform the design of new or improved systems. By analyzing the data, we can determine if the current lighting system provides adequate illumination throughout the space or if there are areas that experience excessive brightness or darkness. This information can be vital in optimizing lighting systems to reduce energy consumption and improve occupant comfort. In summary, the light sensor data collected within a range of 0 to 820 lux provided a comprehensive understanding of the illumination conditions in the monitored environment. This information is essential for assessing the performance of lighting systems, identifying correlations between lighting conditions and other environmental variables, and informing the design and optimization of energy-efficient and comfortable indoor spaces.
In this study, we also collected data from altitude and pressure sensors to understand the monitored area’s environmental conditions better. The altitude sensor data provided 1020 to 1040 m above sea level measurements, while the pressure sensor data ranged from 89,450 to 89,650 Pascals. Analyzing these data points enables us to draw correlations between altitude and atmospheric pressure changes, offering valuable insights into environmental dynamics. The altitude sensor utilized in our data acquisition system offered accurate elevation readings, capturing fluctuations in the monitored area’s altitude over the data collection period. The recorded altitude range of 1020 to 1040 m provides a comprehensive representation of the vertical shifts in the environment, which can be further analyzed for potential impacts on other variables or phenomena. Simultaneously, the pressure sensor measured atmospheric pressure with high precision, capturing values from 89,450 to 89,650 Pascals. Atmospheric pressure is a critical variable influencing various environmental aspects, such as weather patterns and air quality. By examining the pressure sensor data, we can gain insights into potential correlations between changes in atmospheric pressure and other environmental parameters, further enriching our dataset and analysis. The combined analysis of altitude and pressure sensor data offers a complete understanding of the environmental conditions in the monitored area. By identifying trends and relationships between altitude, atmospheric pressure, and other physical variables, we can develop a comprehensive picture of the environmental dynamics at play, enabling more informed decision-making and potentially uncovering new avenues for optimization and improvement.
Therefore, our data collection efforts encompassed altitude and pressure sensor data, providing a holistic view of the environmental conditions in the monitored area. By analyzing these data points and exploring the relationships between altitude, atmospheric pressure, and other environmental variables, we can glean valuable insights and improve our understanding of the complex interactions at play in the natural environment. The sensor data distribution offers valuable insights into the patterns and variations observed in the collected readings within the specified range. By analyzing this distribution, we can better understand the temperature dynamics within the monitored environment and assess the performance of the sensor data. To visualize the data distribution, we can use a histogram, which divides the data into bins representing intervals and plots the frequency of readings within each interval. This graphical representation provides a clear overview of the distribution’s shape, central tendency, and dispersion.
Upon examination of the sensors’ data distribution, several key observations can be made:
  • Central Tendency: By evaluating the mean, median, and mode of the dataset, we can determine the central tendency of the temperature readings. This provides insight into the typical or “average” temperature observed within the monitored environment.
  • Dispersion: Analyzing the data’s range, variance, and standard deviation allows us to understand the degree of dispersion in the temperature readings. A higher dispersion indicates a greater variation in the collected data, whereas a lower dispersion suggests more consistent temperature values.
  • Skewness and Kurtosis: Assessing the skewness and kurtosis of the distribution provides information on the data’s asymmetry and tail behavior, respectively. A positively skewed distribution indicates that the data is more concentrated toward the lower end of the temperature range, while a negatively skewed distribution suggests a higher concentration toward the upper end. Kurtosis measures the “tailedness” of the distribution, with high kurtosis indicating heavy tails and more extreme values, while low kurtosis signifies light tails and fewer extreme values.
  • Outliers: By identifying any potential outliers in the dataset, we can assess the presence of unusual or unexpected temperature readings. Outliers can be detected using various methods, such as the IQR or Z-score methods. It is essential to investigate the source of any identified outliers to determine if they represent genuine fluctuations or errors in the data collection process.
Outliers = data[(data < (Q1 − 1.5 ∗ IQR)) | (data > (Q3 + 1.5 ∗ IQR))]
To visualize and understand the sensor readings distribution, numerous statistics are calculated to understand its properties and characteristics better. Some common statistics are presented in the following subsections.

4.1. Measures of Central Tendency

The central tendency is measured through:
  • Mean: The arithmetic average of the data;
  • Median: The middle value that separates the data into two halves;
  • Mode: The value that appears most frequently in the data.
Table 4 represents the descriptive statistics (mean, median, and mode) for five different measures: light, temperature, humidity, pressure, and attitude.
Light: The average light intensity is about 265.87 units, but the median value is much lower, at 102 units, indicating that the light distribution is skewed to the right, with a few high-intensity readings pulling the mean upwards. The most frequent (mode) light reading is 0.0 units, which could indicate periods of darkness or the device is turned off or blocked.
Temperature: The mean and median values are quite close (36.96 and 37.1, respectively), suggesting that temperature distribution is approximately symmetrical. The mode, or the most frequently occurring value, is 36.6.
Humidity: The mean humidity is 11.78 units, slightly higher than the median of 11 units, implying a slight right skewness in the data. The mode, like the median, is 11.0 units.
Pressure: The mean and median pressure is nearly the same (89,448.6 and 89,455.0, respectively), suggesting a symmetrical distribution. The mode is 89,326.0, which may be a common baseline or ambient pressure reading.
Attitude: The mean attitude measure is 1039.16 units, slightly higher than the median of 1038.56 units, implying a slight right skewness in the distribution. The mode of 1050.45 suggests that this specific attitude value occurs more frequently than others.
In general, for all measures, the proximity of mean and median values suggests that, except for light, the distributions are approximately symmetric with no significant outliers. However, it would be beneficial to visualize this data using plots (like histograms or box plots) to understand the distribution better and identify any potential outliers or trends.

4.2. Measures of Dispersion

The followings are dispersion measures and their definitions.
  • Range: The difference between the maximum and minimum values;
  • Variance: The average of the squared differences from the mean;
  • Standard Deviation: The square root of the variance, representing the dispersion or spread of the data;
  • Interquartile Range (IQR): The range between the first quartile (25th percentile) and the third quartile (75th percentile).
Table 5 provides further insights into the variability and spread of each of the measures (light, temperature, humidity, pressure, and attitude) mentioned.
Light: The standard deviation is large (305.72), which implies significant variability in the light data. The large range (856) further underscores this variation. The variance is quite high, confirming the large spread in the data. The interquartile range (IQR), which measures the statistical spread between the 25th and 75th percentile, is 565, which is also considerable. The minimum is 0 (possibly indicating periods of darkness), while the maximum is 856.
Temperature: The standard deviation is 1.64, indicating a relatively small variation in temperature. The range (10.9) and IQR (1.9) also suggest that most temperature values are close to the mean. The minimum and maximum temperatures recorded are 29.3 and 40.2 degrees, respectively.
Humidity: The standard deviation (1.83) and variance (3.34) suggest moderate variability in humidity. The range (15) and IQR (1) indicate that most of the data points lie near the mean. The humidity values lie between 10 and 25 units.
Pressure: Pressure shows a significant variation, indicated by a standard deviation of 140.65 and a large range (900). The variance is also quite high. However, the IQR is 186.75, which suggests a moderate spread of values around the median. The minimum and maximum recorded pressure values are 88,982 and 89,882, respectively.
Attitude: The standard deviation (12.95) indicates a moderate spread in attitude. The range (82.62) and IQR (17.22) confirm this spread. The minimum and maximum recorded attitude values are 999.59 and 1082.21, respectively.
In summary, light and pressure appear to have the highest variability. Temperature shows the least variability, with most values clustering around the mean. It would be useful to pair these insights with the previous set of descriptive statistics to have a more comprehensive understanding of each measure’s distribution.

4.3. Measures of Shape

Skewness is defined as a measure of the symmetry or asymmetry of the distribution of the data, while Kurtosis means a measure of the “tailedness” of the distribution, indicating whether the data has heavy or light tails compared to a normal distribution.
Table 6 provides two statistical measures—skewness and kurtosis—for five different parameters.
Light: The skewness value of 0.641 indicates a moderate positive (right) skewness, meaning that the light distribution has a longer tail on the right. This suggests that there are periods with unusually high light intensities. The negative kurtosis of −1.27 indicates a distribution flatter (“platykurtic”) than the normal distribution. This suggests that light intensities are quite diverse and not clustered around the mean.
Temperature: The negative skewness of −1.22 suggests a left-skewed distribution, meaning lower temperatures deviate from the average more than the higher ones. The kurtosis value of 2.98 indicates a distribution with heavier tails and a sharper peak (“leptokurtic”) than the normal distribution. This suggests that there are more extreme temperature values (both high and low) than what would be expected in a normal distribution.
Humidity: With a very high skewness value of 3.67, the humidity distribution is highly skewed to the right. This implies that there are periods with extraordinarily high humidity. A very high positive kurtosis value of 16.74 indicates that the distribution has heavy tails and a sharp peak, suggesting that extreme humidity values are more frequent than typical in a normal distribution.
Pressure: The negative skewness value of −0.14 suggests a slight left skew, though this value is relatively small, indicating the distribution is approximately symmetric. A positive kurtosis value of 0.19 suggests that the pressure distribution is slightly more peaked with heavier tails than the normal distribution.
Attitude: A positive skewness of 0.14 indicates a slight right skewness, though this value is quite small, implying a nearly symmetric distribution. The kurtosis value of 0.19 indicates a slightly leptokurtic distribution, suggesting a sharper peak and heavier tails than the normal distribution.
These values are indicative of the nature of data distribution. However, it would still be beneficial to visualize these distributions, for example, by using histograms or density plots. This would provide a clearer picture of the data distribution in each measure.

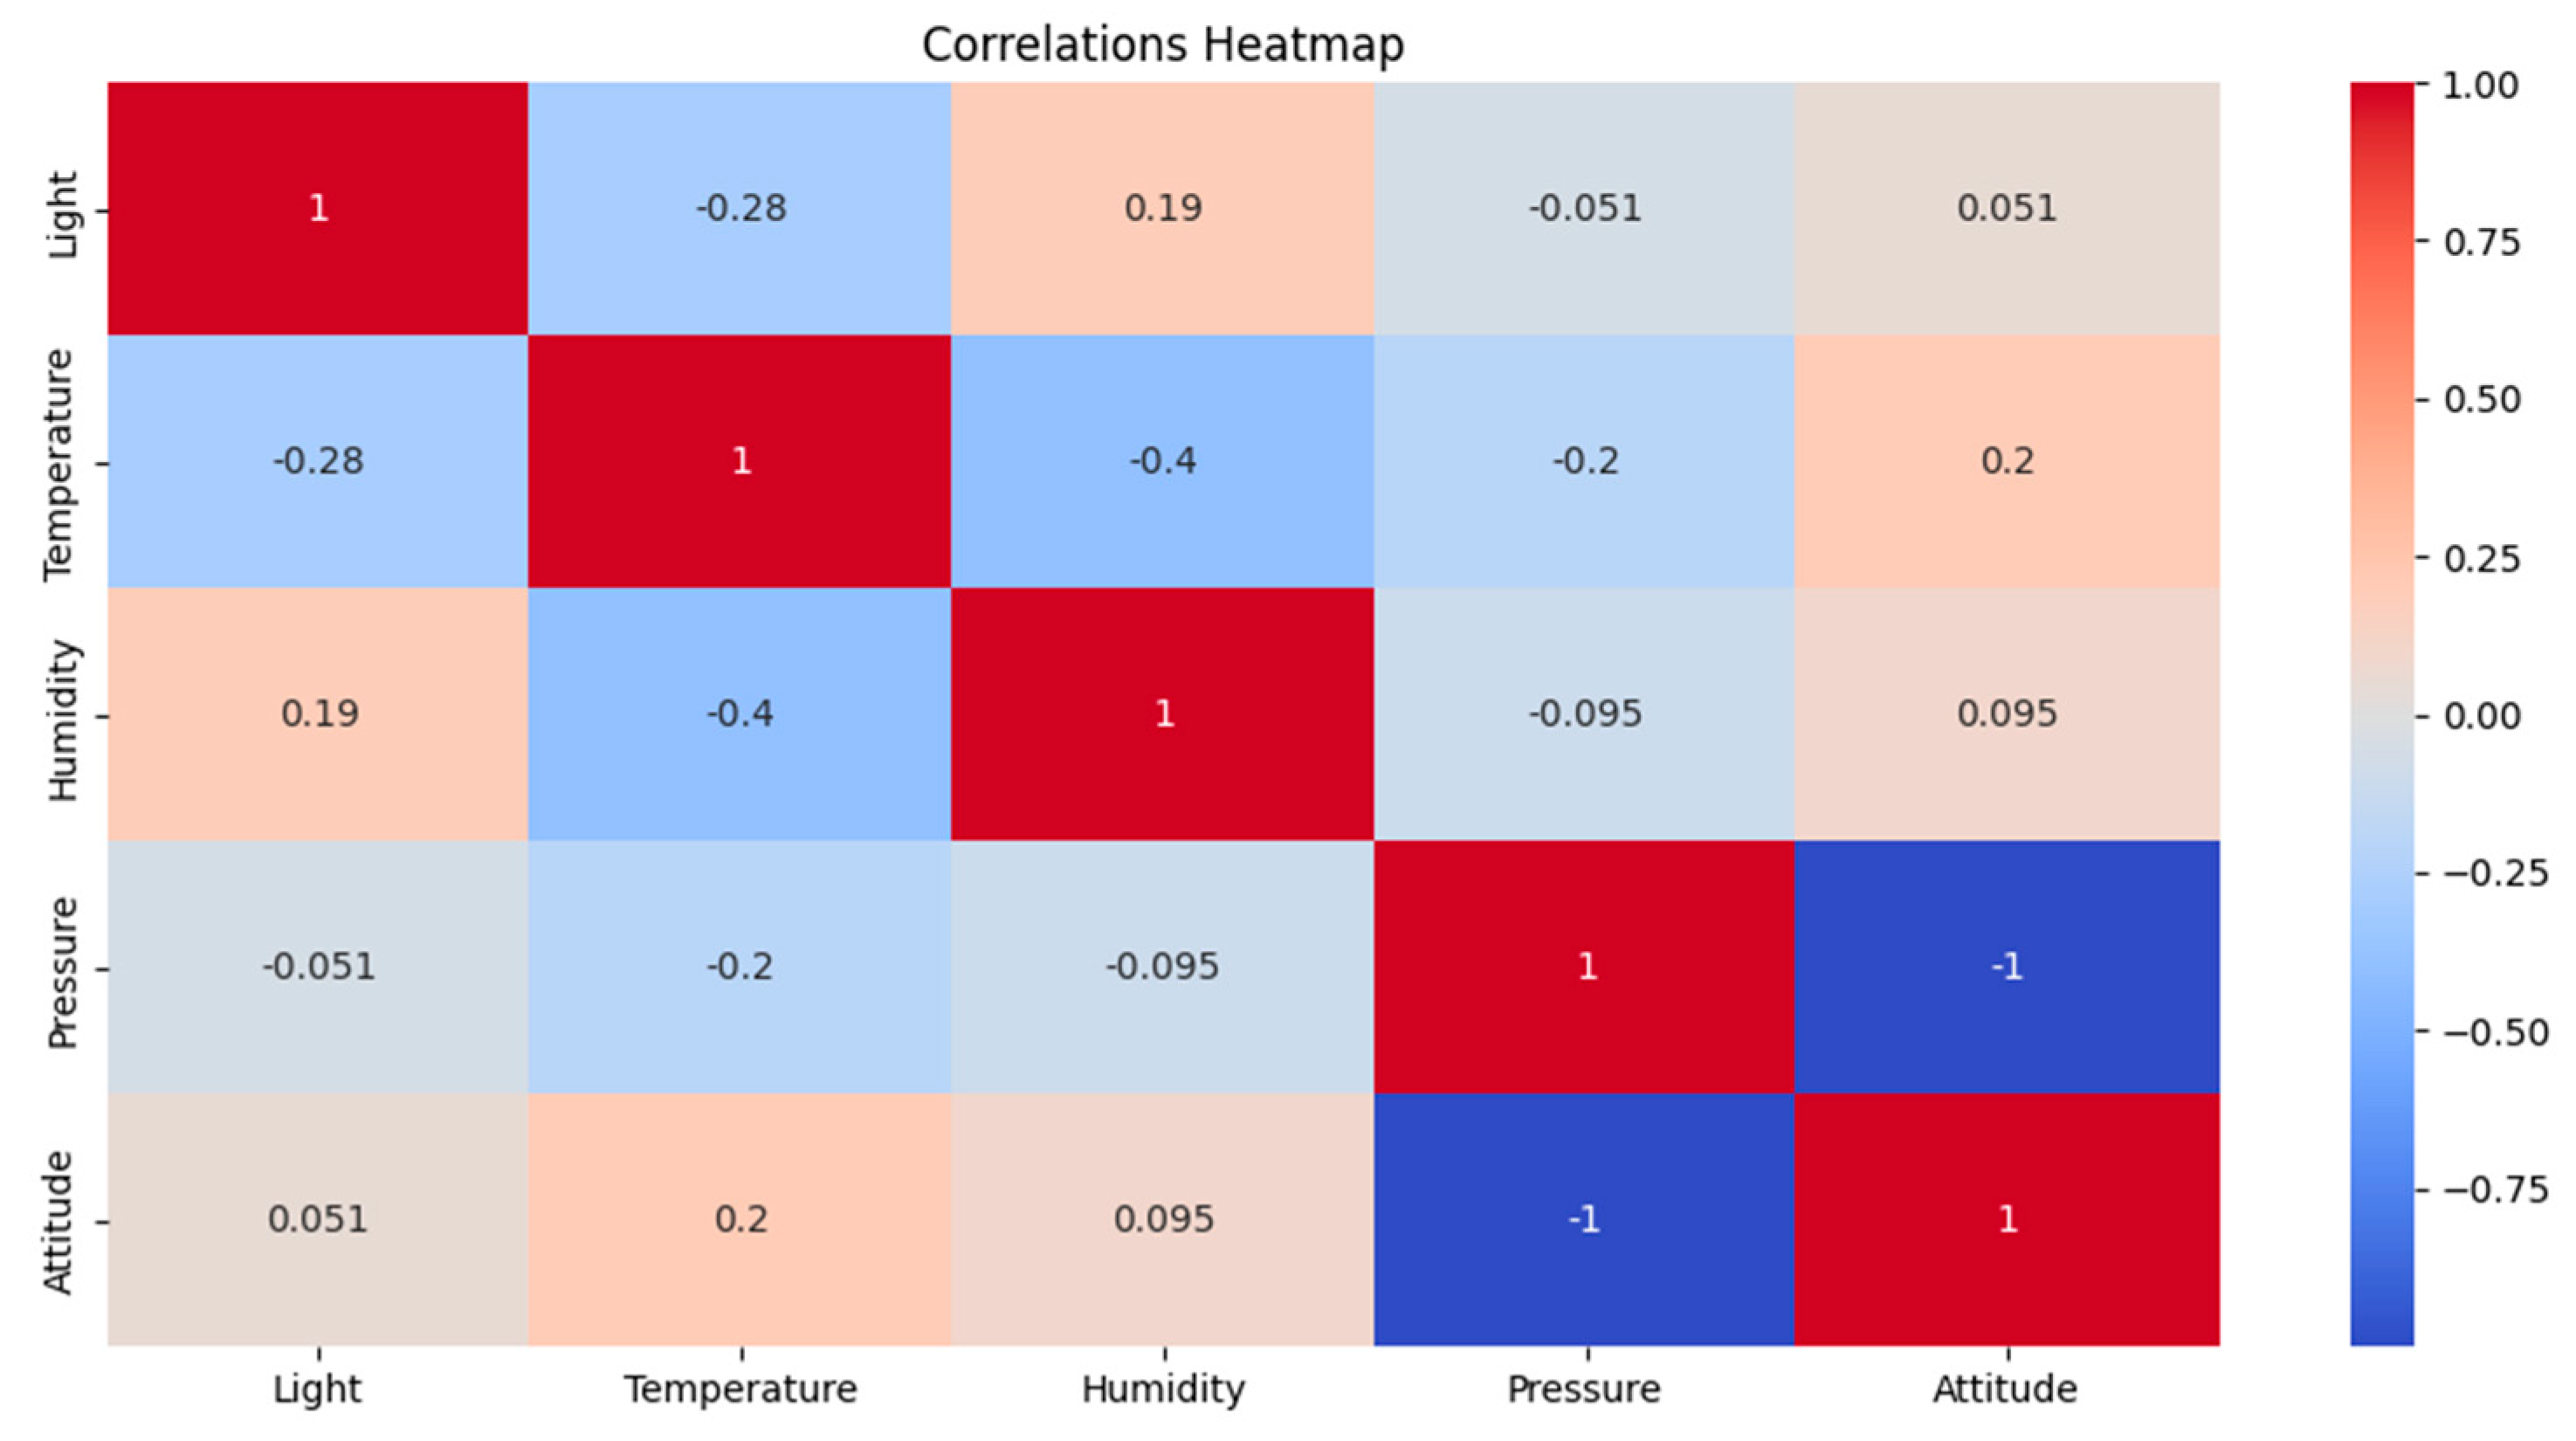
4.4. Measures of Association

The association is measured using correlation and covariance. The correlation is a measure of the linear relationship between two variables. The covariance measures how two variables change together, indicating the direction of the relationship between them.
The data in Table 7 and Figure 5 represents the correlation matrix for the five measures you previously discussed: light, temperature, humidity, pressure, and attitude. Correlation values range from −1 to 1, where −1 indicates a perfect negative correlation, 1 indicates a perfect positive correlation, and 0 indicates no correlation. Here are the interpretations for each pair:
Light and Temperature: There’s a negative correlation of −0.282322, suggesting that as light levels increase, the temperature tends to decrease, and vice versa, although the relationship is not strong.
Light and Humidity: The correlation is positive (0.187878) but weak, implying that light and humidity levels increase together to some extent.
Light and Pressure: The correlation is weak and negative (−0.051294), suggesting a minimal tendency for light and pressure to move in opposite directions.
Light and Attitude: The correlation is weak and positive (0.051339), implying a slight tendency for light and attitude to move in the same direction.
Temperature and Humidity: There is a moderate negative correlation of −0.395346, implying that as the temperature rises, humidity tends to fall, and vice versa.
Temperature and Pressure: The correlation is negative (−0.195911), suggesting that temperature and pressure tend to move in opposite directions, but the relationship is not very strong.
Temperature and Attitude: A weak positive correlation (0.195760) implies a slight tendency for temperature and attitude to move in the same direction.
Humidity and Pressure: The correlation is weak and negative (−0.094870), suggesting a minimal tendency for humidity and pressure to move in opposite directions.
Humidity and Attitude: The correlation is weak and positive (0.094785), suggesting a slight tendency for humidity and attitude to increase together.
Pressure and Attitude: The correlation is strongly negative (−0.999907), indicating a very strong tendency for pressure and attitude to move in opposite directions.
This correlation matrix can provide insights into the relationships between different pairs of variables. However, it is important to note that correlation does not imply causation, and these relationships might be influenced by other factors not included in the analysis.
The covariance, which measures how much two random variables change together, is presented in Table 8. It is positive if the variables tend to show similar behavior, negative if they show opposite behavior, and zero if there is no relationship between their behavior. Before commenting on the provided covariance matrix, it is essential to note that these values do not provide insight into the strength of the relationship between the variables, only the direction (i.e., whether they tend to move together or in opposite directions).
Light: Light has the highest covariance value (93,462.23), suggesting that there is a positive association between light and the variable with which it is compared. The high value might indicate large simultaneous fluctuations in light and the variable in question.
Temperature: The covariance of temperature (2.69) is much smaller than for light, suggesting that changes in temperature are associated with smaller concurrent changes in the other variable.
Humidity: The covariance of humidity (3.34) is slightly higher than that of temperature, indicating that changes in humidity are associated with slightly larger concurrent changes in the other variable than temperature.
Pressure: The covariance for pressure (19,781.49) is significantly higher than both temperature and humidity but smaller than light, suggesting that fluctuations in pressure are associated with substantial simultaneous changes in the other variable, although less so than light.
Attitude: The covariance of attitude (167.74) is smaller than light and pressure but larger than temperature and humidity. This suggests that changes in attitude are associated with more significant concurrent changes in the other variable than temperature and humidity but less so than light and pressure.

4.5. Summary Statistics

Here, the dataset statistics summary is measured using the count, min and max, and percentiles, Table 9. They are defined as follows:
  • Count: The number of data points in the dataset;
  • Minimum and Maximum: The smallest and largest values in the dataset;
  • Percentiles: The values below which a given percentage of the data falls. Common percentiles are the 25th, 50th (median), and 75th percentiles.
The data in Table 9 includes various statistical measures for five metrics: light, temperature, humidity, pressure, and attitude. The measures given are count, minimum, maximum, 25th percentile (1st quartile), median (50th percentile or 2nd quartile), and 75th percentile (3rd quartile).
Light: The light intensity ranged from 0 to 856 units, with half of the readings below 102 units (the median). The 25th percentile and minimum are both 0, meaning at least 25% of the readings were 0, aligning with the previous observation that the most frequent light reading is 0. The 75th percentile is 565 units, indicating that 25% of the readings were above this level.
Temperature: The temperature values ranged from 29.3 to 40.2, with a median of 37.1. The interquartile range (IQR), which ranges between the 25th and 75th percentiles, is from 36.2 to 38.1, meaning that 50% of the temperature readings fall within this range.
Humidity: Humidity varied between 10 and 25 units. The median and the 25th percentile are 11, and the 75th percentile is 12, indicating a concentration of values around the lower end of the range and potential skewness to the right.
Pressure: The pressure ranged from 88,982 to 89,882 units, with a median of 89,455. The IQR spans from 89,355.25 to 89,542, showing that the middle 50% of pressure readings are relatively tightly clustered in this range.
Attitude: Attitude values extended from 999.59 to 1082.21 units, with a median of 1038.56. The IQR is from 1030.55 to 1047.77, indicating that 50% of the attitude measurements are within this range.
The ‘count’ row confirms that there are 8910 data points for each measure, ensuring that comparisons between the measures are valid.

4.6. Distribution

The KDE is finally plotted in Figure 6 for the whole dataset. KDE stands for Kernel Density Estimation. It is a statistical technique used in data science and statistics to estimate a random variable’s Probability Density Function (PDF). Since the underlying data distribution does not depend on pre-existing assumptions or particular parameters, this approach is utilized for non-parametric analysis. KDE presents a smooth curve after the process that gives an impression of the “shape” of the data distribution. It works by placing a kernel on each point in the data set. A basic function having a peak at zero and lengths that stretch to infinity on each side and integrate into one is commonly referred to as a kernel. The final smooth curve (KDE), which is obtained by adding together all of these kernels, provides a reliable estimation of the density of the data. The kernel’s bandwidth determines the degree of smoothing. Large bandwidths result in significant smoothing, whilst tiny bandwidths result in less smoothing.

5. Proposed Applications

Recognizing the significance of the produced dataset in different fields, the following are some of its applications:
  • Smart Homes: The datasets may be used in developing and enhancing smart home applications, especially in locations with comparable environmental features to Saudi Arabia. Controlling the home environment for comfort, energy efficiency, or special health requirements falls under this category.
  • Remote Patient Monitoring Systems: This dataset may be used to enhance these systems, which are used to monitor patients at home. For example, healthcare practitioners might utilize this data to evaluate how changes in a patient’s home environment may affect their health.
  • Aged Care Technologies: This dataset may help technologies that let the elderly live independently at home. Sensors that monitor environmental conditions might give useful information about possible hazards or health problems.
  • Environmental Health Research: Researchers may use this data to investigate the influence of various environmental factors on health outcomes. This might result in creating treatments or recommendations for protecting people’s health in certain surroundings.
  • Models for Disease Prediction: These models might utilize environmental data and personal health data to predict the probability of specific diseases or health problems.
  • Personalized Health Recommendations: This data may be used by mobile apps that deliver individualized health recommendations to account for the environmental context. For example, depending on the current situation at hand, an app may recommend certain activities or precautions.
  • Climate Control Systems: Maintaining a certain range of environmental conditions in hospitals or healthcare facilities may be critical for patient comfort and health. This dataset may be used to train machine learning models that improve the performance of these systems.
  • Emergency Alert Systems: These systems may advise users or healthcare practitioners to take appropriate action in the event of severe environmental conditions (e.g., high temperature).
  • Indoor Farming and Agriculture: Indoor farming and agriculture may also benefit from these statistics since they can give insights into improving plant growth conditions. Although this application does not directly relate to healthcare, it is nonetheless essential due to the need for environmental monitoring.
  • Air Quality Monitoring Systems: Although the dataset does not directly assess air quality, it may be used with other data sources to construct or enhance such systems. Machine learning algorithms, for example, might estimate air quality based on temperature, humidity, and pressure data.

6. Conclusions

This paper provides datasets for researchers of the smart home in healthcare. The datasets could be used to develop machine learning algorithms for prediction problems. The datasets provide measures of indoor rooms with six sensors (timestamps, light, temperature, humidity, pressure, and altitude), describing the relationship between the variables. The datasets were generated and captured every 5 min in July 2022, comprising 8910 records in real-time. However, some challenges in the indoor environment, such as air conditioners and light variation in the office room, led to changes in the variable values. The datasets can provide researchers with data to evaluate new machine learning algorithms that implement prediction methods in the smart home healthcare domain. The dataset saves time and effort for researchers in this domain. Some of the proposed applications in this paper will be conducted in future work research, including prediction and utilization of artificial intelligence techniques.

Author Contributions

Conceptualization, T.A. and R.A.R.; methodology, T.A. and R.A.R.; software, T.A. and R.A.R.; validation, T.A., R.A.R. and A.A.; formal analysis, T.A., R.A.R. and A.A.; investigation T.A., R.A.R. and A.A.; resources, T.A. and R.A.R.; data curation, T.A. and R.A.R.; writing—original draft preparation, T.A. and R.A.R.; writing—review and editing, T.A., R.A.R. and A.A.; visualization, T.A. and R.A.R.; supervision, T.A. and R.A.R.; project administration, R.A.R.; funding acquisition, T.A. and A.A. All authors have read and agreed to the published version of the manuscript.

Funding

This research has been funded by the Scientific Research Deanship at the University of Ha’il, Saudi Arabia, through project number BA-2135.

Institutional Review Board Statement

Not applicable.

Informed Consent Statement

Not applicable.

Data Availability Statement

The data is publicly available at PLOMS Press [45].

Conflicts of Interest

The authors declare no conflict of interest.

References

  1. Manley, K.; Nyelele, C.; Egoh, B.N. A review of machine learning and big data applications in addressing ecosystem service research gaps. Ecosyst. Serv. 2022, 57, 101478. [Google Scholar] [CrossRef]
  2. Salam, A.A.; Elsegaey, I.; Khraif, R.; Al-Mutairi, A. Population distribution and household conditions in Saudi Arabia: Reflections from the 2010 Census. SpringerPlus 2014, 3, 530. [Google Scholar] [CrossRef] [PubMed] [Green Version]
  3. Nabhan, G.P.; Richter, B.D.; Riordan, E.C.; Tornbom, C. Toward Water-Resilient Agriculture in Arizona: Future Scenarios Addressing Water Scarcity; Lincoln Institute of Land Policy: Cambridge, MA, USA, 2023. [Google Scholar]
  4. Yusuf, N.; Lytras, M.D. Competitive Sustainability of Saudi Companies through Digitalization and the Circular Carbon Economy Model: A Bold Contribution to the Vision 2030 Agenda in Saudi Arabia. Sustainability 2023, 15, 2616. [Google Scholar] [CrossRef]
  5. Nassar, H.; Biltagy, M.; Safwat, A.M. The role of waste-to-energy in waste management in Egypt: A techno-economic analysis. Rev. Econ. Political Sci. 2023. [Google Scholar] [CrossRef]
  6. Dubais, F.A.; Urbanization Key Driver towards Smarter Cities. Saudigazette. 2015. Available online: http://www.saudigazette.com.sa/article/120798 (accessed on 10 April 2023).
  7. Khashoggi, A.; Mohammed, M.F. Smart Mobility in Smart City: A Critical Review of the Emergence of the Concept. Focus on Saudi Arabia. In Research and Innovation Forum 2022: Rupture, Resilience and Recovery in the Post-Covid World; Springer International Publishing: Cham, Switzerland, 2023; pp. 233–241. [Google Scholar]
  8. Khahro, S.H.; Kumar, D.; Siddiqui, F.H.; Ali, T.H.; Raza, M.S.; Khoso, A.R. Optimizing Energy Use, Cost and Carbon Emission through Building Information Modelling and a Sustainability Approach: A Case-Study of a Hospital Building. Sustainability 2021, 13, 3675. [Google Scholar] [CrossRef]
  9. Mohdher, L. Design Guidelines to Improve the Air Quality in Hot Climate Open Spaces-Jeddah City as a Case Study. Ph.D. Thesis, Effat University, Jeddah, Saudi Arabia, 2023. [Google Scholar]
  10. Rajoria, N.; Jhamaria, C.; Sharma, S.; Singh, N.; Ameriya, T.; Gupta, A. Sources and Effects of Indoor Air Pollutants: A Review. Ann. For. Res 2023, 66, 1035–1047. [Google Scholar]
  11. Rajaa Al-Shammari, T.S.; Ramadan, R.A.; Northern Saudi Arabia Indoor Environmental Dataset|PLOMS PRESS. Northern Saudi Arabia Indoor Environmental Dataset|PLOMS PRESS. 2023. Available online: https://plomscience.com/press/index.php/Press/catalog/book/2 (accessed on 10 April 2023).
  12. Borghi, J.; Van Gulick, A. Promoting Open Science Through Research Data Management. Harv. Data Sci. Rev. 2022, 4. [Google Scholar] [CrossRef]
  13. Hřebíček, J.; Hejč, M. Quality of Data, Information and Indicators in Environmental Systems. In Proceedings of the 4th WSEAS International Conference on Mathematical Biology And Ecology (MABE’08), Acapulco, Mexico, 25–27 January 2008; WSEAS: Athens, Greece, 2008; pp. 35–40. [Google Scholar]
  14. Choi, J.-H.; Loftness, V.; Aziz, A. Post-Occupancy Evaluation of 20 Office Buildings as Basis for Future IEQ Standards and Guidelines; Elsevier Ltd.: Amsterdam, The Netherlands, 2012; pp. 167–175. [Google Scholar]
  15. Bachmann, N.; Tripathi, S.; Brunner, M.; Jodlbauer, H. The Contribution of Data-Driven Technologies in Achieving the Sustainable Development Goals. Sustainability 2022, 14, 2497. [Google Scholar] [CrossRef]
  16. Diebold, G. Citizen Science and Crowdsourced Data Can Improve Environmental Data in the United States. Center for Data Innovation. 2022. Available online: https://datainnovation.org/2022/06/citizen-science-and-crowdsourced-data-can-improve-environmental-data-in-the-united-states/ (accessed on 10 April 2023).
  17. Cao, B.; Ouyang, Q.; Zhu, Y.; Huang, L.; Hu, H.; Deng, G. Development of a multivariate regression model for overall satisfaction in public buildings based on field studies in Beijing and Shanghai. Build. Environ. 2012, 47, 394–399. [Google Scholar] [CrossRef]
  18. Andargie, M.; Azar, E. An applied framework to evaluate the impact of indoor office environmental factors on occupants’ comfort and working conditions. Sustain. Cities Soc. 2019, 46, 101447. [Google Scholar] [CrossRef]
  19. Sharmin, T.; Gül, M.; Li, X.; Ganev, V.; Nikolaidis, I.; Al-Hussein, M. Monitoring building energy consumption, thermal performance, and indoor air quality in a cold climate region. Sustain. Cities Soc. 2014, 13, 57–68. [Google Scholar] [CrossRef]
  20. Jurado, S.R.; Bankoff, A.D.; Sanchez, A. Indoor air quality in Brazilian universities. Int. J. Environ. Res. Public Health 2014, 11, 7081–7093. [Google Scholar] [CrossRef] [Green Version]
  21. Pei, Z.; Lin, B.; Liu, Y.; Zhu, Y. Comparative study on the indoor environment quality of green office buildings in China with a long-term field measurement and investigation. Build. Environ. 2015, 84, 80–88. [Google Scholar] [CrossRef]
  22. Zuhaib, S.; Manton, R.; Griffin, C.; Hajdukiewicz, M.; Keane, M.M.; Goggins, J. An Indoor Environmental Quality (IEQ) assessment of a partially-retrofitted university building. Build. Environ. 2018, 139, 69–85. [Google Scholar] [CrossRef]
  23. Zhao, L.; Liu, J.; Ren, J. Impact of various ventilation modes on IAQ and energy consumption in Chinese dwellings: First long-term monitoring study in Tianjin, China. Build. Environ. 2018, 143, 99–106. [Google Scholar] [CrossRef]
  24. Sant’anna, D.; Dos Santos, P.; Vianna, N.; Romero, M. Indoor environmental quality perception and users’ satisfaction of conventional and green buildings in Brazil. Sustain. Cities Soc. 2018, 43, 95–110. [Google Scholar] [CrossRef]
  25. Tardioli, G.; Kerrigan, R.; Oates, M.; James, O.D.; Finn, D. Data driven approaches for prediction of building energy consumption at urban level. Energy Procedia 2015, 78, 3378–3383. [Google Scholar] [CrossRef] [Green Version]
  26. A Lou, H.; Ou, D. A comparative field study of indoor environmental quality in two types of open-plan offices: Open-plan administrative offices and open-plan research offices. Build. Environ. 2019, 148, 394–404. [Google Scholar] [CrossRef]
  27. Geng, Y.; Lin, B.; Yu, J.; Zhou, H.; Ji, W.; Chen, H.; Zhang, Z.; Zhu, Y. Indoor environmental quality of green office buildings in China: Large-scale and long-term measurement. Build. Environ. 2019, 150, 266–280. [Google Scholar] [CrossRef]
  28. Ma, F.; Zhan, C.; Xu, X. Investigation and Evaluation of Winter Indoor Air Quality of Primary Schools in Severe Cold Weather Areas of China. Energies 2019, 12, 1602. [Google Scholar] [CrossRef] [Green Version]
  29. Huang, K.; Sun, W.; Feng, G.; Wang, J.; Song, J. Indoor air quality analysis of 8 mechanically ventilated residential buildings in northeast China based on long-term monitoring. Sustain. Cities Soc. 2020, 54, 101947. [Google Scholar] [CrossRef]
  30. Zhu, Y.-D.; Li, X.; Fan, L.; Li, L.; Wang, J.; Yang, W.-J.; Wang, L.; Yao, X.-Y.; Wang, X.-L. Indoor air quality in the primary school of China—Results from CIEHS 2018 study. Environ. Pollut. 2021, 291, 118094. [Google Scholar] [CrossRef]
  31. Kim, J.; Kim, S.; Bae, S.; Kim, M.; Cho, Y.; Lee, K.-I. Indoor environment monitoring system tested in a living lab. Build. Environ. 2022, 214, 108879. [Google Scholar] [CrossRef]
  32. Botero-Valencia, J.; Castano-Londono, L.; Marquez-Viloria, D. Indoor Temperature and Relative Humidity Dataset of Controlled and Uncontrolled Environments. Data 2022, 7, 81. [Google Scholar] [CrossRef]
  33. Najjar, G.A.; Akkad, K.; Almahdaly, A.H. Classification of Lighting Design Aspects in Relation to Employees’ Productivity in Saudi Arabia. Sustainability 2023, 15, 3614. [Google Scholar] [CrossRef]
  34. Giddings, B.; Almehrej, M.; Cresciani, M. The Dilemma of Saudi Arabian Homes in Riyadh. Space Cult. 2023, 26, 4–22. [Google Scholar] [CrossRef]
  35. Frank, A. UCI Machine Learning Repository; University of California, School of Information and Computer Science: Irvine, CA, USA, 2010; Available online: https://archive.ics.uci.edu/ml/index.php (accessed on 10 April 2023).
  36. Asuncion, A.; Newman, D.J. UCI Machine Learning Repository. 2007. Available online: http://www.ics.uci.edu/~mlearn/MLRepository.html (accessed on 10 April 2023).
  37. Nazaroff, W.W.; Singer, B.C. Inhalation of hazardous air pollutants from environmental tobacco smoke in US residences. J. Expo. Sci. Environ. Epidemiol. 2004, 14, S71–S77. [Google Scholar] [CrossRef] [Green Version]
  38. Crawley, D.B.; Lawrie, L.K.; Pedersen, C.O.; Winkelmann, F.C.; Witte, M.J.; Strand, R.K.; Liesen, R.J.; Buhl, W.F.; Huang, Y.J. Robert H. Henninger; et al. EnergyPlus: New, capable, and linked. J. Archit. Plan. Res. 2004, 21, 292–302. [Google Scholar]
  39. Crawley, D.B.; Lawrie, L.K.; Winkelmann, F.C.; Buhl, W.; Huang, Y.; Pedersen, C.O.; Strand, R.K.; Liesen, R.J.; Fisher, D.E.; Witte, M.J.; et al. EnergyPlus: Creating a new-generation building energy simulation program. Energy Build. 2001, 33, 319–331. [Google Scholar] [CrossRef]
  40. Anguita, D.; Ghio, A.; Oneto, L.; Parra-Llanas, X.; Reyes-Ortiz, J. A public domain dataset for human activity recognition using smartphones. In Proceedings of the 2013 International Symposium on Wearable Computers (ISWC), Zurich, Switzerland, 8–12 September 2013. [Google Scholar]
  41. Brown, Z.; Ting, K.C.; Srivastava, M.B. DEBS: A dataset for building energy analysis. In Proceedings of the 4th ACM Workshop on Embedded Sensing Systems for Energy-Efficiency in Buildings, Toronto, ON, Canada, 6 November 2012; pp. 25–30. [Google Scholar]
  42. Geng, Y.; Lin, B.; Zhu, Y. Comparative study on indoor environmental quality of green office buildings with different levels of energy use intensity. Build. Environ. 2020, 168, 106482. [Google Scholar] [CrossRef]
  43. de Dear, R.; Brager, G. Developing an adaptive model of thermal comfort and preference. ASHRAE Trans. 1998, 104, 145–167. [Google Scholar]
  44. Allen, J.G.; MacNaughton, P.; Satish, U.; Santanam, S.; Vallarino, J.; Spengler, J.D. Associations of Cognitive Function Scores with Carbon Dioxide, Ventilation, and Volatile Organic Compound Exposures in Office Workers: A Controlled Exposure Study of Green and Conventional Office Environments. Environ. Health Perspect. 2016, 124, 805–812. [Google Scholar] [CrossRef] [PubMed] [Green Version]
  45. Kong, J.-L.; Fan, X.-M.; Jin, X.-B.; Su, T.-L.; Bai, Y.-T.; Ma, H.-J.; Zuo, M. BMAE-Net: A Data-Driven Weather Prediction Network for Smart Agriculture. Agronomy 2023, 13, 625. [Google Scholar] [CrossRef]
  46. Wang, G.G.; Tsai, H.P. Using Long Short-Term Memory Model for Cloud Forest Vegetation Growth Status Prediction—A Case Study in Shei-Pa National Park. ISPRS-Int. Arch. Photogramm. Remote. Sens. Spat. Inf. Sci. 2022, XLIII-B3-2022, 1033–1038. [Google Scholar] [CrossRef]
  47. Jiang, W.; Yan, Z.; Feng, D.-H.; Hu, Z. Wind speed forecasting using autoregressive moving average/generalized autoregressive conditional heteroscedasticity model. Eur. Trans. Electr. Power 2011, 22, 662–673. [Google Scholar] [CrossRef]
  48. Xiao, Z.; Ye, S.-J.; Zhong, B.; Sun, C.-X. BP neural network with rough set for short term load forecasting. Expert Syst. Appl. 2009, 36, 273–279. [Google Scholar] [CrossRef]
  49. Li, H.; Gao, W.; Xie, J.; Yen, G.G. Multiobjective bilevel programming model for multilayer perceptron neural networks. Inf. Sci. 2023, 642, 119031. [Google Scholar] [CrossRef]
  50. Roy, A.; Chakraborty, S. Support vector machine in structural reliability analysis: A review. Reliab. Eng. Syst. Saf. 2023, 233, 109126. [Google Scholar] [CrossRef]
  51. Glennie, R.; Adam, T.; Leos-Barajas, V.; Michelot, T.; Photopoulou, T.; McClintock, B.T. Hidden Markov models: Pitfalls and opportunities in ecology. Methods Ecol. Evol. 2023, 14, 43–56. [Google Scholar] [CrossRef]
  52. Zhou, H.; Zhang, H.; Deng, H.; Liu, D.; Shen, W.; Chan, S.H.; Zhang, Q. Concept-Level Explanation for the Generalization of a DNN. arXiv 2023, arXiv:2302.13091. [Google Scholar]
  53. Khaldi, R.; El Afia, A.; Chiheb, R.; Tabik, S. What is the best RNN-cell structure to forecast each time series behavior? Expert Syst. Appl. 2023, 215, 119140. [Google Scholar] [CrossRef]
  54. Seabe, P.L.; Moutsinga, C.R.B.; Pindza, E. Forecasting Cryptocurrency Prices Using LSTM, GRU, and Bi-Directional LSTM: A Deep Learning Approach. Fractal Fract. 2023, 7, 203. [Google Scholar] [CrossRef]
  55. Introducing ChatGPT. Available online: https://openai.com/blog/chatgpt (accessed on 10 April 2023).
  56. Li, B.; Qi, P.; Di, S.; Liu, J.; Pei, J.; Yi, J.; Zhou, B. Trustworthy AI: From Principles to Practices. ACM Comput. Surv. 2023, 55, 1–46. [Google Scholar] [CrossRef]
  57. Singh, R.; Gill, S.S. Edge AI: A survey. Internet Things Cyber-Phys. Syst. 2023, 3, 71–92. [Google Scholar] [CrossRef]
  58. General Data Protection Regulation (GDPR)—Official Legal Text. General Data Protection Regulation (GDPR). Available online: https://gdpr-info.eu/ (accessed on 10 April 2023).
  59. Privacy and Data Protection in the Kingdom of Saudi Arabia. Privacy and Data Protection in the Kingdom of Saudi Arabia. Available online: https://www.my.gov.sa/wps/portal/snp/content/dataprotection/?lang=en#:~:text=Anyone%20who%20discloses%20sensitive%20data,data%20owner%20or%20to%20achieve (accessed on 10 April 2023).
Figure 1. Number of publications in 10 years.
Applsci 13 07326 g001
Figure 2. Arduino sensor kit used for the data collection.
Applsci 13 07326 g002
Figure 3. Temperature and humidity.
Applsci 13 07326 g003
Figure 4. Collected data visualization.
Applsci 13 07326 g004
Figure 5. Correlation map.
Applsci 13 07326 g005
Figure 6. Kernal Density Estimation.
Applsci 13 07326 g006
Table 1. Some indoor environmental-related research.
Research StudyYearParameters MeasuredCity of Measurement
[14]2012Thermal, air quality, lighting/visual, and acoustic measurementsUSA
[17]2012Air temperature, mean radiant temperature, relative humidity, air velocity, CO2, illumination intensity, sound pressure levelsChina
[18]2012PM10, PM2.5, PM1 and CO concentrationsIndia
[19]2014CO2 concentration, relative humidityCanada
[20] 2014 Carbon dioxide (CO2), temperature, relative humidity (RH), wind speed, viable mold, and airborne dust levels.Brazil
[21] 2015 Thermal environment, indoor air quality, visual and acoustic environmentChina
[22]2018Air temperature, relative humidity, mean radiant temperature, air velocity, illumination, CO2, and noise level PMV—PPDIreland
[23]2018Air freshness, air cleanliness, humidity, natural lighting, acoustic environmentChina
[24]2018Thermal comfort, lighting, acoustics, ergonomics, cleaning, air qualityBrazil
[25]2018CO2, PM2.5, energy consumptionChina
[18] 2019 Sound level, air velocity, radiant temperature, air temperature, illuminance, relative humidityCanada
[26]2019Layout, air quality, thermal comfort, lighting, and acoustic environmentChina
[27]2019Air temperature, relative humidity, CO2, PM2.5, illuminanceChina
[28] 2019 Carbon dioxide (CO2)China
[29]2020Temperature and concentrations of formaldehyde, VOC, CO2, and PM2.5China
[30]2021Temperature, relative humidity, PM2.5, PM10, CO2, CO, formaldehyde concentrationsBeijing, China
[31]2022Temperature, humidity, PM1.0, PM2.5, PM10, and CO2Republic of Korea
[32] 2022 Timestamp, indoor temperature, and relative humidityUSA
Our Dataset (NorthSaudi)2023Temperature, humidity, pressure, altitude, light, and timestampsNorthern Saudi Arabia
Table 2. Available environmental datasets.
Dataset NameParameters MeasuredShort DescriptionReference
UCI Air QualityCO, NOx, NMHC, Benzene, NO2, O3A dataset collected from an air quality monitoring station in Italy includes outdoor and indoor air quality data.[35,36]
Berkeley Indoor Air Quality DatasetCO2, temperature, humidity, PM2.5, TVOCA dataset collected from multiple San Francisco Bay-area indoor environments includes homes, schools, and offices.[37]
Office Building Energy DatasetTemperature, humidity, CO2, occupancy, lightingA dataset collected from an office building in the US includes data from multiple floors and rooms.[38,39]
UCI Human Activity RecognitionAccelerometer dataA dataset collected from wearable accelerometers includes data on human activity recognition in indoor environments.[40]
DEBSTemperature, humidity, CO2A dataset collected from a New Hampshire, USA, residential building includes data from multiple rooms and floors.[41]
NAThermal comfort, air quality, and visual environmentA dataset collected from 20 green office buildings in China.[42]
UC Berkeley Thermal Comfort DatabaseTemperature, humidity, air speedA dataset collected from experiments on human thermal comfort in different indoor environments includes data on occupant comfort in different temperature and humidity conditions.[43]
NACO2, temperature, humidity, TVOCA dataset collected from multiple indoor environments in the US includes data from homes, schools, and offices.[44]
Table 3. Sample of the dataset.
Time
(HH:MM:SS)
Light
(Lumen (lm))
Temperature
(°C)
Humidity
(%)
Pressure
(Pascal (Pa))
Attitude
12:02:0835737.51189,5351031.2
12:07:0935237.61189,5361031.1
12:12:1034937.61189,5321031.47
12:33:5433937.71189,5101033.5
12:38:5533637.71189,5121033.31
12:43:5633037.71189,5071033.77
12:48:5732537.71189,5011034.33
12:53:5832237.91189,5021034.23
12:58:5931537.91189,4991034.51
13:04:0131237.91189,4921035.15
13:09:02304381289,4951034.88
13:14:03300381289,4871035.61
13:19:04293381289,4771036.53
Table 4. Central tendency analysis.
MeasureLight
(Lumen (lm))
Temperature
(°C)
Humidity
(%)
Pressure
(Pascal (Pa))
Attitude
mean265.86588136.9648611.77542189,448.5984291039.161420
Median102.0037.1011.0089,455.001038.56
Mode0.036.611.089,326.01050.45
Table 5. Measure of dispersion.
MeasureLight
(Lumen (lm))
Temperature
(°C)
Humidity
(%)
Pressure
(Pascal (Pa))
Attitude
std305.7159271.641571.827553140.64667012.951571
min0.00000029.3000010.00000088,982.000000999.590000
max856.00000040.2000025.00000089,882.0000001082.210000
Range856.0010.9015.00900.0082.62
Variance93,462.2277172.6947523.33995019,781.485821167.743187
IQR565.001.901.00186.7517.22
Table 6. Measures of shape.
MeasureLight
(Lumen (lm))
Temperature
(°C)
Humidity
(%)
Pressure
(Pascal (Pa))
Attitude
Skewness0.641172−1.2238773.668192−0.1419230.144958
Kurtosis−1.2707472.97780716.7448380.1909310.190579
Table 7. Measures of association.
CorrelationLight
(Lumen (lm))
Temperature
(°C)
Humidity
(%)
Pressure
(Pascal (Pa))
Attitude
Light1.000000−0.2823220.187878−0.0512940.051339
Temperature−0.2823221.000000−0.395346−0.1959110.195760
Humidity0.187878−0.3953461.000000−0.0948700.094785
Pressure−0.051294−0.195911−0.0948701.000000−0.999907
Attitude0.0513390.1957600.094785−0.9999071.000000
Table 8. Covariance measure.
MeasureLight
(Lumen (lm))
Temperature
(°C)
Humidity
(%)
Pressure
(Pascal (Pa))
Attitude
Covariance93,462.2277172.6947523.33995019,781.485821167.743187
Table 9. Statistics Summary.
MeasureLightTemperatureHumidityPressureAttitude
count8910.0000008910.000008910.0000008910.0000008910.000000
min0.00000029.3000010.00000088,982.000000999.590000
max856.00000040.2000025.00000089,882.0000001082.210000
25%0.00000036.2000011.00000089,355.2500001030.550000
50%102.00000037.1000011.00000089,455.0000001038.560000
75%565.00000038.1000012.00000089,542.0000001047.770000
Disclaimer/Publisher’s Note: The statements, opinions and data contained in all publications are solely those of the individual author(s) and contributor(s) and not of MDPI and/or the editor(s). MDPI and/or the editor(s) disclaim responsibility for any injury to people or property resulting from any ideas, methods, instructions or products referred to in the content.

