Article

Noncovalent Adsorption of Single-Stranded and Double-Stranded DNA on the Surface of Gold Nanoparticles

by
Ekaterina A. Gorbunova
,
Anna V. Epanchintseva
*,
Dmitrii V. Pyshnyi
* and
Inna A. Pyshnaya
Institute of Chemical Biology and Fundamental Medicine SB RAS, 630090 Novosibirsk, Russia
*
Authors to whom correspondence should be addressed.
Appl. Sci. 2023, 13(12), 7324; https://doi.org/10.3390/app13127324
Submission received: 31 May 2023 / Revised: 13 June 2023 / Accepted: 16 June 2023 / Published: 20 June 2023
(This article belongs to the Special Issue Novel Nanomaterials and Nanostructures)

Abstract

:
Understanding the patterns of noncovalent adsorption of double-stranded nucleic acids (dsDNA) on gold nanoparticles (GNPs) was the aim of this study. It was found that the high-affinity motifs in DNA can and do act as an “anchor” for the fixation of the whole molecule on the GNP (up to 98 ± 2 single-stranded (ss)DNA molecules per particle with diameter of 13 ± 2 nm). At the same time, the involvement of an “anchor” in the intramolecular DNA interaction can negatively affect the efficiency of the formation of ss(ds)DNA–GNP structures. It has been shown that the interaction of GNP with DNA duplexes is accompanied by their dissociation and competitive adsorption of ssDNAs on GNP, wherein the crucial factor of DNA adsorption efficiency is the intrinsic affinity of ssDNA to GNP. We propose a detailed scheme for the interaction of dsDNA with GNPs, which should be taken into account in studies of this type. Researchers focused on this field should accept the complicated nature of such objects and take into account the many competing processes, including the processes of adsorption and desorption of DNA on gold as well as the formation of secondary structures by individual DNA strands.

1. Introduction

The development of delivery systems for therapeutic nucleic acids (NAs) and of sensors containing NAs as disease markers begins with research on fundamental aspects of the binding of NAs to the carrier surface. There are many promising carriers, including gold nanoparticles (GNPs). GNPs have low toxicity [1] and chemical inertness [2] as well as the ability to bind (on their surface) biomolecules (containing or not containing thio groups) via strong covalent and noncovalent adsorption [3,4,5,6]. It should be noted that the process of even covalent attachment of biomolecules to the surface of GNPs [7,8,9,10] is initiated by noncovalent adsorption [11]. Therefore, understanding the patterns of noncovalent adsorption of biomolecules on the surface of GNPs is important for the creation of carriers containing NAs.
It is known that the adsorption of single-stranded DNAs (ssDNAs or oligonucleotides) on GNPs proceeds more efficiently than the adsorption of double-stranded DNAs (dsDNAs or DNA duplexes) [12]. ssDNA forms multipoint contacts with a GNP, and the nucleotide sequence, its length, the presence of modifications in the DNA, ionic strength and pH of the medium during the incubation, temperature, and association reaction time significantly affect the efficiency of observed adsorption of ssDNA to the surface of GNPs [4,13,14]. It has been shown that the adsorption of various DNA structures (dsDNA, ssDNA with a hairpin structure, and self-complementary ssDNA) on GNPs indeed substantially varies if we compare values of the association constant of the NAs toward the surface of inorganic nanoparticles [15]. It should be mentioned that the effects of differences in the primary structure of model DNAs were not discussed in the work just cited.
It is important to understand that DNA forms secondary structures in which the most hydrophilic polyanion residues (the phosphate backbone) protect the hydrophobic portions of the duplexes (i.e., the DNA bases) from direct contact with the gold surface. Therefore, nitrogenous bases of dsDNA can be exposed to the gold surface only on the side of the major and minor grooves or as terminal base pairs of the duplex, which are in a state of dynamic equilibrium between open and closed forms. This mechanism was first demonstrated by analysis of the interaction of DNA with the flat surface of a gold layer [16].
There are two main differences between ssDNA and dsDNA in the context of their interaction with GNPs [17]. First, heterocyclic bases of ssDNA, being spatially accessible, are capable of forming hydrogen bonds and/or hydrophobic contacts with atoms on the surface of GNPs; these processes are severely impeded for heterocycles within dsDNA [18]. According to a number of studies (including our data), it is this interaction that determines the strength of binding between NAs and GNPs [4,19,20]. The second difference is that ssDNA has a much more mobile structure, whereas dsDNA has a rigid structure that hinders the direct interaction of nitrogenous bases with the surface of nanoparticles. This statement is supported by data obtained by circular dichroism spectroscopy, indicating that the interaction of dsDNA with GNPs leads to a forced change in dsDNA’s spatial structure [21].
According to Schreiner and coauthors [22], molecules of dsDNA tend to have planar positioning relative to the gold surface. It is this circumstance that forces researchers to look for approaches ensuring the effective interaction of dsDNA with nanoparticles, including approaches involving duplexes with single-stranded overhangs, the affinity of which for the surface of inorganic nanoparticles can be predetermined [23,24]. Such an approach was first demonstrated via binding of dsDNA containing a single-stranded homoA overhang to the surface of a gold film and subsequent dehybridization/hybridization of the DNA complex on the surface of GNPs [25]. Meanwhile, it has been reported that the strength of binding of GNPs to dsDNA containing a homonucleotide pentameric overhang can be ranked in the following order: dsDNA containing C5 > T5 > G5 > A5 [26]. Duplexes with any type of overhang interact more effectively with GNPs as compared to their blunt-ended precursor [27]. In addition, it should be pointed out that dsDNA containing nucleotide mismatches also binds to GNPs more efficiently than does a respective fully complementary duplex. In this context, it was found that the location of nucleotide mismatches in the duplex is of great importance for the efficiency of GNP–DNA interaction; however, the researchers failed to identify a clear-cut effect of the type of mismatch on the occupancy of GNPs by the NAs [26].
Thus, aspects related to the adsorption of various DNAs on GNPs are under meticulous scrutiny [28,29,30], but so far no one has carried out a rigorous analysis of features of noncovalent binding of a DNA duplex and of its individual components to the surface of GNPs. This analysis is considerably complicated by the fact that it requires taking into account the full material balance, that is, the contribution of intra- and intermolecular NA–NA interactions and, directly, the analysis of the binding of each structure (formed in NAs) to GNPs.
The present work is aimed at in-depth investigation of the details and features of noncovalent adsorption of dsDNA (and of the pair of corresponding interacting ssDNA components) on GNPs. By gel electrophoresis, autoradiography using 32P-labeled interacting components, and colorimetric assays, comparative analyses were performed on features of the binding of GNPs to ssDNAs of various structures and to dsDNAs, either blunt-ended or bearing various single-stranded overhangs (“anchor” gold-binding motifs). At the same time, we attempted to modulate the affinity of the anchor DNA motifs for the surface of GNPs [23]. As the “anchor” gold-binding motifs, we tested short DNA sequences—previously selected by us based on results of large-scale sequencing and an analysis of the nucleotide sequence—that possess enhanced affinity for spherical GNPs 13 ± 2 nm in diameter.
It was found that the interaction of GNPs with DNA duplexes is accompanied by their dissociation and competitive adsorption of individual DNA strands on GNPs, while the key determinant of the efficiency of DNA adsorption is intrinsic affinity of ssDNA components of the potential duplex for GNPs. It was established that within DNA, motifs having strong affinity for GNPs can act and do act as an “anchor” fixing the entire molecule on the surface of the inorganic nanoparticle. On the other hand, involvement of the anchor fragments in an intramolecular interaction within DNA can reduce the efficiency of formation of hybrid double-stranded (single-stranded) DNA–GNP structures. A rational choice of optimal length and sequence of an anchor DNA segment makes it possible to achieve high density of adsorption of ssDNA to the gold surface, up to 98 ± 2 molecules per GNP, but does not unambiguously promote efficient adsorption of the corresponding anchor-containing DNA duplexes on GNPs.

2. Materials and Methods

2.1. Reagents and Chemicals

Tetrachloroauric acid (HAuCl4·H2O) was purchased from Electron Microscopy Sciences (Hatfield, PA, USA); sodium citrate dehydrate (Na3C6H5O7), glycerol, and ethylenediaminetetraacetic acid (EDTA) were purchased from Sigma–Aldrich (Darmstadt, Germany); Stains-all was purchased from Acros (Princeton, NJ, USA), Tris from Amresco (Solon, OH, USA), and glycine from Serva (New York, NY, USA), whereas γ-32P-ATP, T4 polynucleotide kinase (EC 2.7.1.78), and 10× reaction buffer were purchased from Biosan (Novosibirsk, Russia). H3BO3 was bought from Himprom (Samara, Russia) and agarose from Lonza (Rockland, ME, USA).

2.2. Synthesis of GNPs

GNPs were prepared using the classic citrate reduction procedure [31]. The size of GNPs and their dispersity were determined by transmission electron microscopy (TEM) and dynamic light scattering (DLS) using a Zetasizer Nano ZS Plus instrument (Malvern Instruments, Malvern, UK).

2.3. Synthesis of DNAs

DNAs (Table 1) were synthesized on an ASM-800 (Biosset, Novosibirsk, Russia) following the solid-phase phosphoramidite protocol using DNA phosphoramidites from ChemGenes (Wilmington, MA, USA).
DNAs were purified by electrophoresis in a 15% polyacrylamide gel containing 8 M urea (15% PAAG). Electrophoresis was carried out in TBE (89 mM Tris, 89 mM H3BO3, 2 mM EDTA, pH 8.5) for 90 min at 20 V/cm. Water was purified by means of a Simplicity 185 system (Millipore) and had a resistivity of 18.2 MΩ cm at 25 °C.
DNAs (100 nmol) were 5′-32P-labeled in a solution (10 μL) containing 50 mM Tris-HCl, pH 7.6, 10 mM MgCl2, 5 mM DTT, 0.1 mCi γ-32P-ATP, and 80 units of T4 polynucleotide kinase for 2 h at 37 °C. 32P-labeled DNAs (designated as DNA*) were purified by electrophoresis in a 15% PAAG.

2.4. Determination of Tm Values for DNAs under Study

Tm values for all studied DNA duplexes were determined based on the nearest-neighbor model [32,33,34,35] in 2 × 10⁻⁶ M DNA solutions in the presence of 4 mM Na3C6H5O7 using a CARY 300 Bio spectrophotometer (Varian, USA). Measurement error was 0.2 °C. Further, Tm values for F, R, FL, FL2, FL4, FT, FT2, and FT4 were determined in 2 × 10⁻⁶ M DNA solutions in the presence of 10 mM NaC2H6AsO2 and 1 M NaCl. Additionally, for FL2, Tm values were determined in solutions containing 2 × 10⁻⁶ M, 5 × 10⁻⁷ M, or 1 × 10⁻⁷ M FL2 in the presence of 4 mM Na3C6H5O7. In some cases, the web service “Tm for Oligos Calculator” was used [36].

2.5. Preparation of Noncovalent Associates of GNPs and DNAs

2.5.1. Adsorption of ssDNAs on GNP

To obtain associates of GNPs and ssDNAs, the solutions (final volume 1.4 mL) containing 0.5–100 nM DNA and 0.5 nM GNPs were prepared and incubated for 24 h at 25 °C (unless specified otherwise), then centrifuged for 30 min at 14,000 rpm, and supernatants were collected. DNA was radioactively labeled. The activity of 32P-containing samples was determined in water using a Tri-Carb 2800TR liquid scintillation counter (Perkin-Elmer, Waltham, MA, USA).

2.5.2. Simultaneous Adsorption of a Mixture of Two Different ssDNAs on a GNP

To obtain associates of a GNP with a mixture of two different ssDNAs, the solutions (final volume 1.4 mL) containing 0.5–100 nM each ssDNA and 0.5 nM GNPs were prepared and incubated for 24 h at 25 °C (unless specified otherwise), then centrifuged for 30 min at 14,000 rpm, and supernatants were collected. One of the DNA strands was radioactively labeled. The activity of 32P-containing samples was determined in water using the Tri-Carb 2800TR liquid scintillation counter (Perkin-Elmer, Waltham, MA, USA).

2.6. Assembly of a Complementary Complex from Noncovalent Associates

Associates FL/GNP, FL*/GNP, R/GNP, and R*/GNP were obtained as described in Section 2.5.1. Then, associates FL/GNP and R*/GNP or associates FL*/GNP and R/GNP were mixed (final volume 1.4 mL, 0.5 nM GNPs), incubated at 25 °C for 21 h, and centrifuged for 30 min at 14,000 rpm, and supernatants were collected.

2.7. Agarose Gel Electrophoresis

Samples containing 5 μL of each noncovalent associate (0.5 pmol) and 0.5 μL glycerol/deionized water (1:1, v/v) were loaded into wells of a 0.8% agarose gel in Tris-glycine buffer (250 mM glycine, 25 mM Tris, pH 8.5). The electrophoresis was carried out for 30 min at 5 V/cm.

2.8. Agarose Gel Analysis

Scanned images of an agarose gel were obtained after 30 min of electrophoresis; the images of the bands in the gel were analyzed in Gel Analyzer 19.1 software («www.gelanalyzer.com» (accessed on 20 February 2022), created by Istvan Lazar Jr., Ph.D., and Istvan Lazar Sr., Ph.D., CSc).
Contents of top and bottom parts of each band of the agarose gels (Ntop and Nbottom, respectively, in the formulas below) were evaluated using the following formulas:
Ntop = 100% × IODtop/IODtotal,
Nbottom = 100% × IODbottom/IODtotal,
where IODtop is optical density of the top half of the band, IODbottom is optical density of the bottom half of the band, and IODtotal is the total optical density of the band).

2.9. DNA Loading Capacity (the Number of DNA Molecules on One GNP)

DNA loading capacity was determined on the basis of radioactivity, according to the equation:
n = [DNAb]/[GNP0],
where n is DNA loading capacity, [DNAb] is the concentration of DNAs associated with GNPs, and [GNP0] is the total concentration of GNPs.
Loading capacity values for graphs in Figures 3 and 5 were calculated as mean loading capacity values for DNA concentrations 60, 100, and 200 nM.

2.10. The Langmuir Isotherm

The concentration of each adsorbed DNA was determined at a fixed concentration of GNPs (0.5 nM); a 1−200-fold excess of DNA was added. The Langmuir constant was determined by fitting the data to the Langmuir isotherm:
n = a × KL [DNA]/(1 + [DNA] KL),
where n is the adsorbed DNA (molecules per GNP), KL is the Langmuir constant in M−1, a is the adsorption capacity (molecules per GNP), and [DNA] is the DNA molar concentration [37].

2.11. Desorption DNA from GNPs

For the desorption assay, 4 mM Na3C6H5O7 was added to an associates’ pellet. The associates were incubated for 24 h at 25 °C, then centrifuged for 30 min at 14,000 rpm, and supernatants were collected. After each incubation step, the activity of 32P-containing samples was measured in supernatants.

2.12. Statistics

The data obtained by the methods described in Section 2.8, Section 2.9, Section 2.10 and Section 2.11 were statistically processed by Student’s t test, and differences with p ≤ 0.05 were considered statistically significant. Microsoft Excel 2016 software version 2304 (Microsoft Corporation, Redmond, WA, USA) was used for this analysis. Data are expressed as means ± SE for at least four independent experiments.

3. Results and Discussion

3.1. Design of the Oligonucleotides

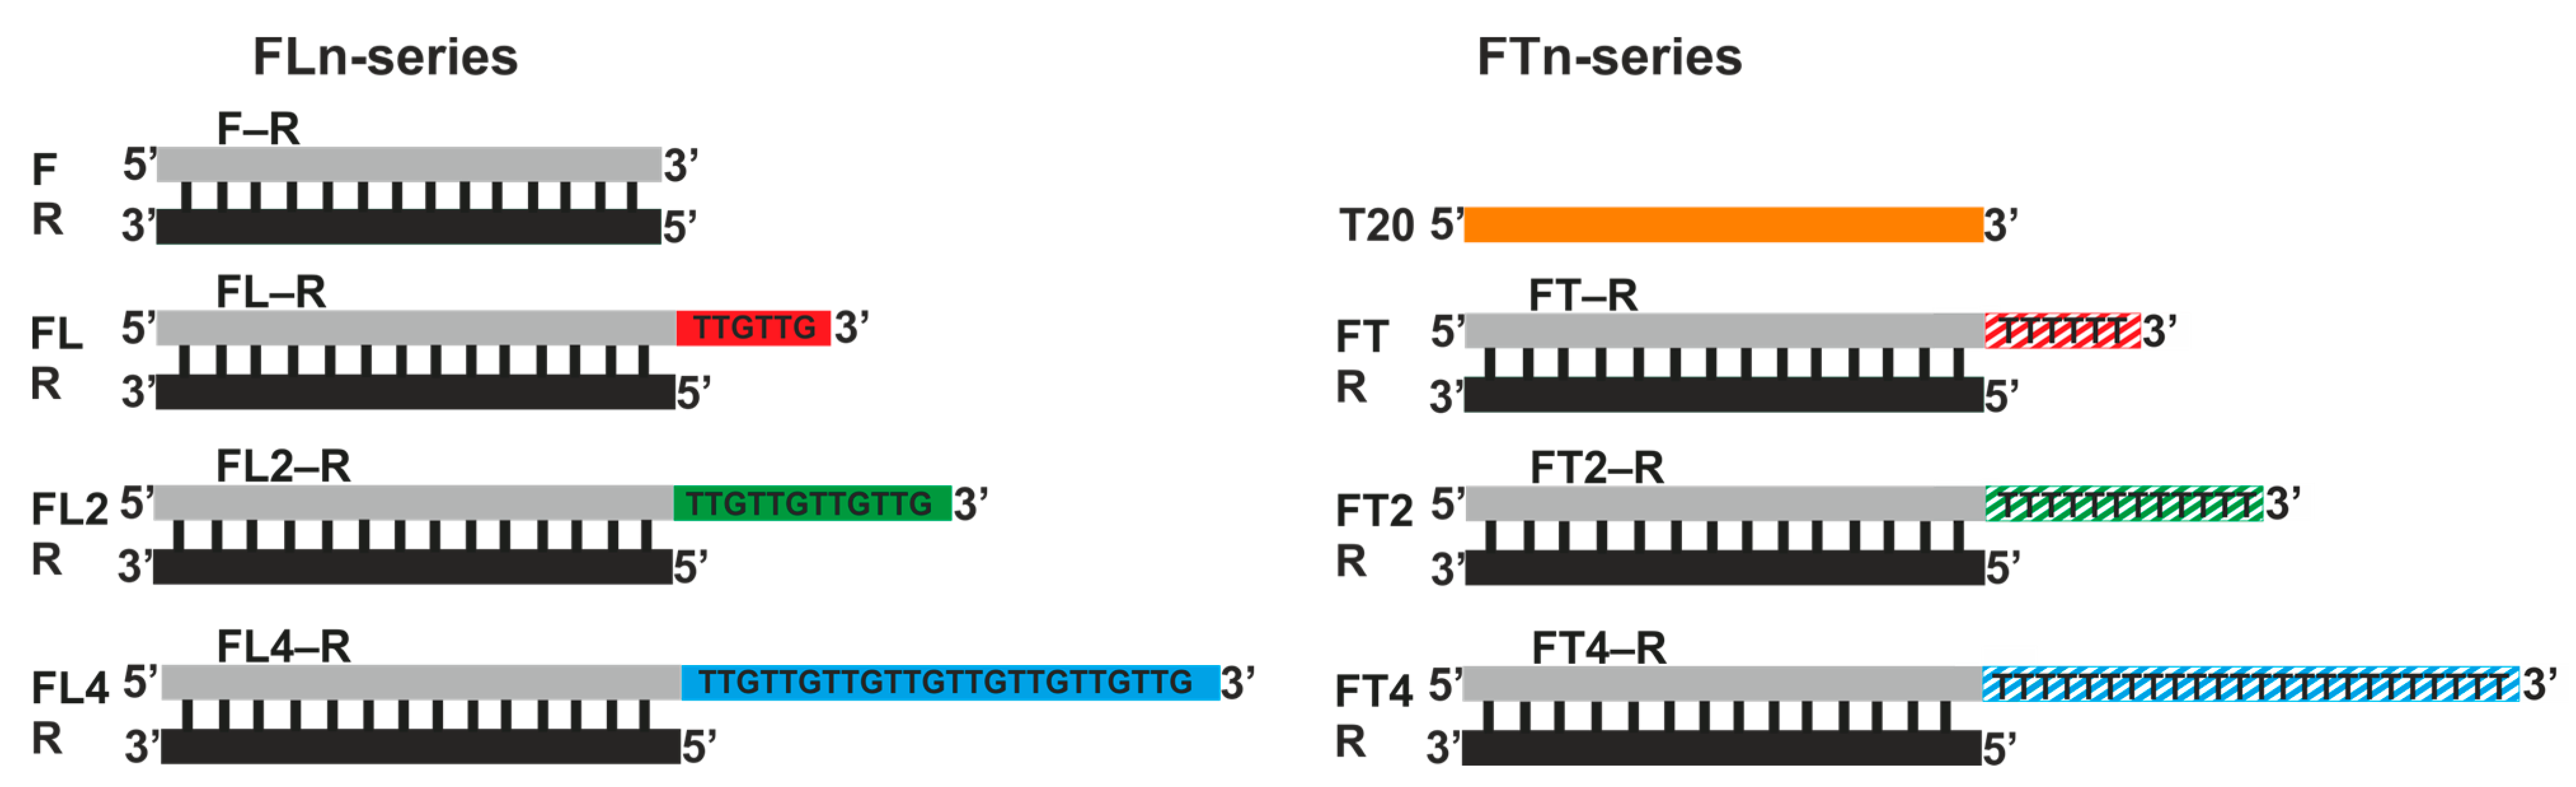
Spherical GNPs 13 ± 2 nm in diameter were used, as were model oligodeoxyribonucleotides that form the simplest duplex (i.e., the initial blunt-ended duplex designated as F–R) and duplexes carrying a 3′ single-stranded overhang of various nucleotide compositions and lengths (designated as FLn–R and FTn–R) (Figure 1). FLn oligonucleotides (n = 1, 2, and 4) contained different numbers of an L motif (TTGTTG), which possesses enhanced affinity for the surface of GNPs [23]. Oligonucleotides from the FTn series served as controls, in which, instead of the L motif, we used hexatimidylate; it has weaker affinity for the surface of GNPs [23]. Single-stranded L motifs, as explained above, should play the role of DNA regions that predetermine the enhanced affinity of DNA molecules for GNPs, that is, they should act as “anchor” regions.
We studied in detail effects of the length of the L and T motifs on the affinity of the respective ssDNAs and dsDNAs for the surface of GNPs and on the capacity of GNPs for these DNAs (i.e., the highest possible number of bound DNA molecules per GNP). By the affinity of DNA for GNPs, we mean the energy of interaction of nucleotide units and of their motifs with the surface of GNPs. In this context, the multipoint nature of the interaction of DNA strands with GNPs should be taken into account. This phenomenon implies that the formation of several (many) contacts with a GNP by one DNA molecule reduces the area of the GNP available for adsorption of other identical molecules of DNA. Consequently, the capacity of GNPs for a DNA having stronger affinity for GNPs is less than that for a DNA having weaker affinity. It is the details addressed by this study (on the basis of principles of material balance) that allow us to elucidate the mechanism of (and problems with) the formation of noncovalent associates of DNA with GNPs (DNA/GNP). In our study, the 3′-terminal single-stranded motifs 6, 12, and 24 nucleotides long in the oligonucleotides of the L and T series underlie the comparative analysis of the formation of noncovalent associates of ssDNA or dsDNA with GNPs. It is important to emphasize again that (1) all formed duplexes bearing an overhang have a 3′-terminal single-stranded motif, and (2) for the assembly of all duplexes, the same oligonucleotide R was used, which is completely complementary to the F segment within oligonucleotides of any series (Figure 1). At the same time, sequences F and R were chosen so as to minimize the likelihood of both intra- and intermolecular interactions [38]. The last requirement was imposed because of evidence that the formation of secondary structures of DNA, that is, hairpins or duplexes, lowers the efficiency of the formation of DNA/GNP associates [23,39].
We deliberately employed 5′-32P-labeled (radioactive) strands of ssDNA to exclude the effect of fluorescent labels on the interaction of DNAs with GNPs; this phenomenon has been documented by us earlier [14]. For dsDNA, the 32P label was introduced into either one or the other strand (consecutively) to quantify the interaction of each strand with GNPs.

3.2. ssDNAs and GNPs

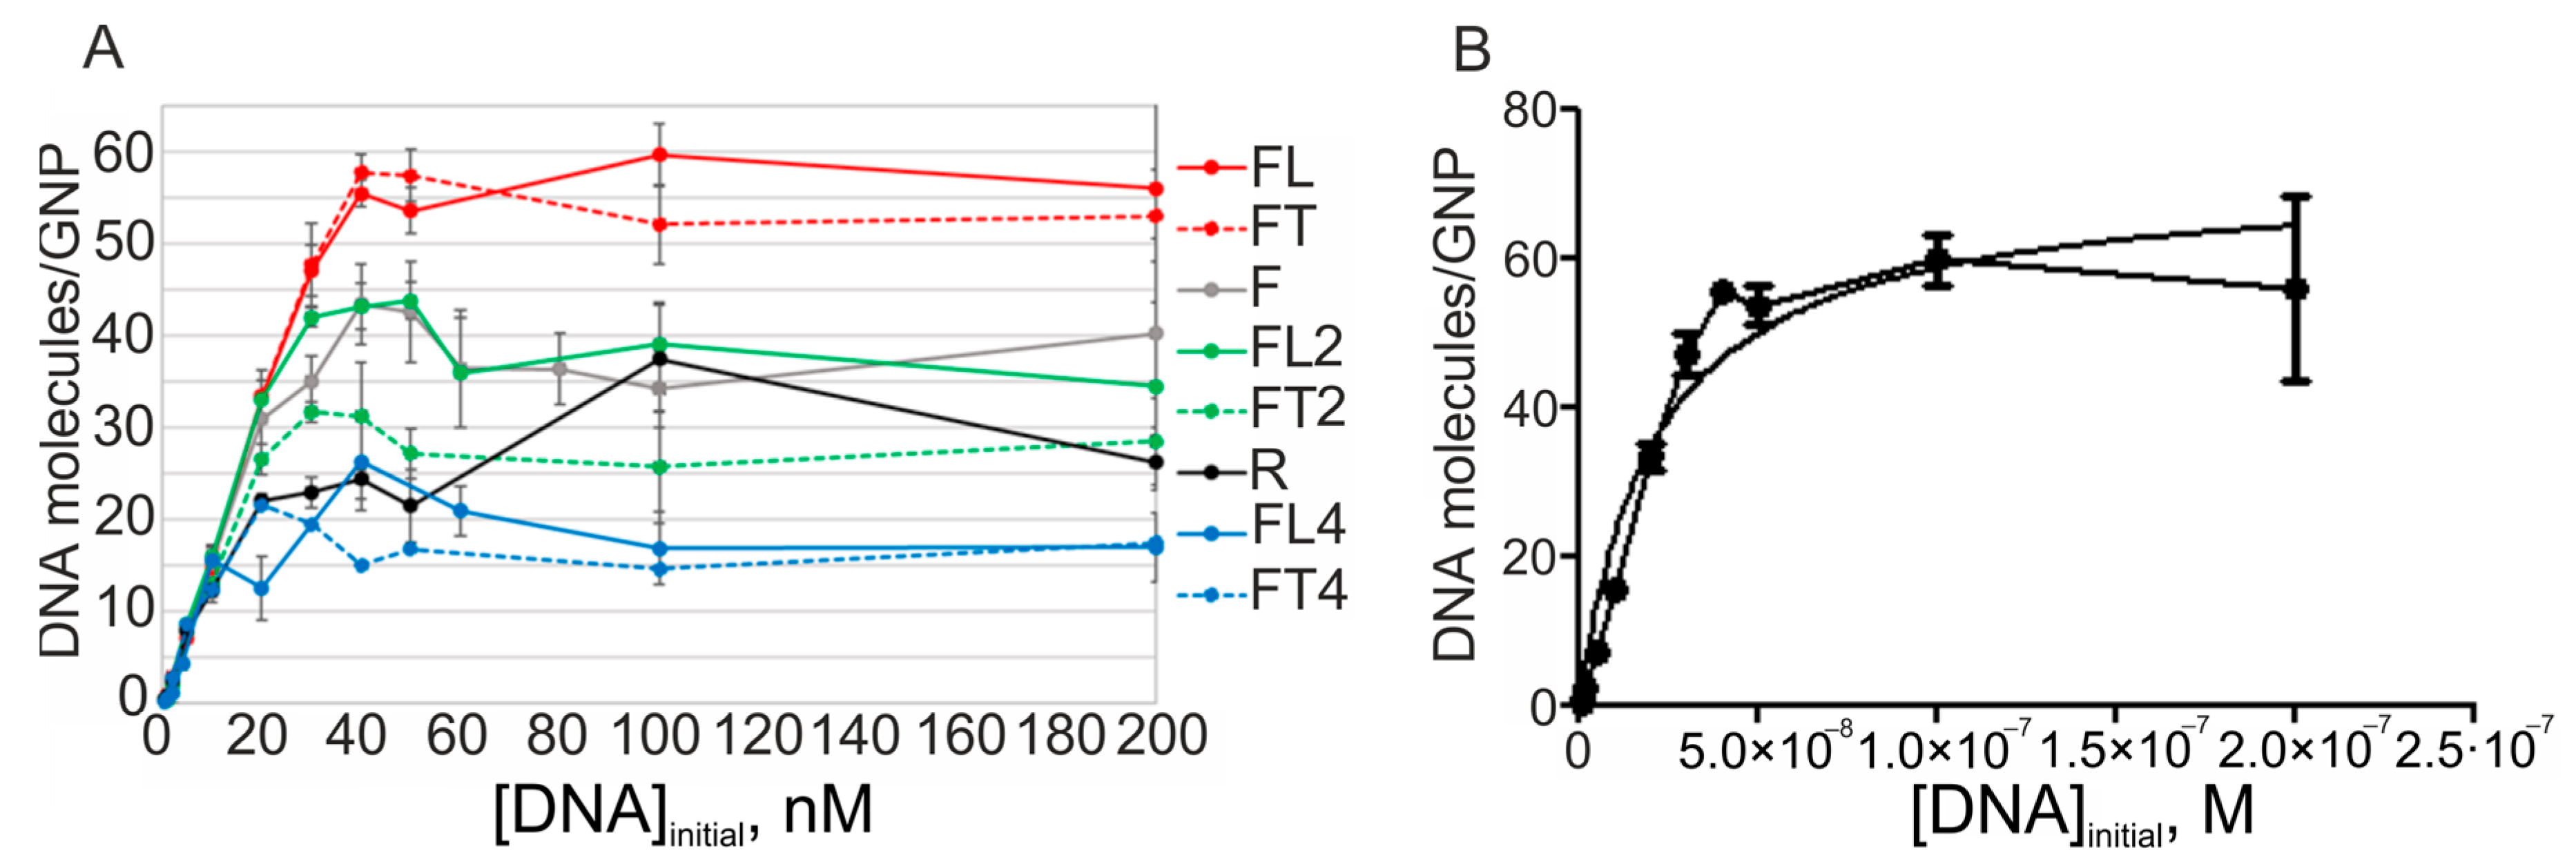
In the first stage of the study, we researched in detail the adsorption of a set of ssDNAs on GNPs (concentrations of GNPs: 0.5 nM) under standardized conditions (Figure 2, Table 2) and carried out a theoretical calculation (affinity-rating analysis) of relative affinity of all tested ssDNAs for GNPs, similarly to [23]. The standardized conditions (24 h incubation at 25 °C) have previously been shown to be sufficient to achieve thermodynamic equilibrium in a heterophasic interaction of ssDNA with GNPs [40]).
The base oligodeoxynucleotides (hereafter “initial oligodeoxynucleotides”) F and R have similar characteristics regarding their affinity for GNPs (Figure 2). Langmuir constants (KL) and surface capacity of GNPs are almost identical between these ssDNAs, which is important to consider below.
As expected, the introduction of one high-affinity hexameric L motif at the 3′ end of the F oligonucleotide led to a significant increase in the efficiency of adsorption of FL on GNPs. If we compare F with its extended version, FL, the surface capacity of GNPs increased from 36 to 56 molecules of DNA per nanoparticle; this increase is inversely proportional to a decrease in equilibrium interaction constant KL (Table 2), which characterizes the stability of ssDNA/GNP associates. Making the anchor L motif longer—from hexa- to dodeca- and tetracosenucleotides—caused a significant decrease in the capacity of GNPs for oligonucleotides FL2 and FL4 (capacity for FL2: 38 molecules per GNP, and for FL4: 17). The efficiency of binding of ssDNA to GNPs changed approximately by the same factor (2.2), judging by the KL value. Therefore, one of possible determinants of this imbalance is an increase in electrostatic repulsion between elongated DNAs adsorbed on the surface of metal nanoparticles. We have reported a high probability of this type of phenomenon earlier, in a detailed analysis of an interaction of charged molecules with a metal nanoparticle [41]. The second possible determinant is elevated likelihood of long oligonucleotides forming secondary structures (imperfect hairpins or intermolecular complexes, their stability was assessed by means of [42]) that possess weaker affinity for GNPs [39] (Figures S1 and S2, Table S3). There is no doubt that, in this case, ssDNA somewhat loses its ability to bind to GNPs because it is the implementation of a network of direct ssDNA/GNP contacts that primarily determines the stability of the nanoassociates in question [4,23].
We could not resist the temptation to evaluate the influence of the nucleotide sequence of the “anchor” motif in ssDNA on the efficiency of its adsorption on the surface of GNPs. The presence of L motifs (TTGTTG sequence) within ssDNAs (FLn series) should significantly enhance the interaction of the oligonucleotide with GNPs [23]. On the other hand, the use of a longer ssDNA can raise the probability of formation of its secondary structures that have lower affinity for GNPs and can increase electrostatic repulsion of DNA molecules between themselves and from the surface of citrate GNPs [39,43]. That is why we compared these data with the adsorption of the control set of ssDNAs: the FTn series. The homogenous composition of the single-stranded overhang in this series ensures that nitrogenous bases are less likely to take part in intra- or intermolecular NA–NA interactions while preserving the overall charge of the DNA molecules. One can see that, surprisingly, under these conditions, GNP affinity values of oligonucleotides of the same length are comparable between the two series (Figure 2A, Table 2). Only in the case of the dodecanucleotide extension (n = 2, FL2) is the oligonucleotide capable of 35% stronger binding to the surface of GNPs as compared to its control counterpart (FT2).
Next, we assessed how the presence of the “anchor” hexanucleotide groups and their extension affect the outcome of loading of the surface of GNPs by the “main” segments (Figure 1) of FLn (or FTn) in the noncovalent ssDNA/GNP associate (compare the first and second rows in Table 2). Readers can see that the introduction of a single hexanucleotide L motif raises the capacity of GNPs for FL by more than 1.5-fold as compared to the initial oligonucleotide (F). Further extension proved to be fruitless: if we compare L1 with the L2 motif and then with the L4 motif under the standard conditions of assembly of nanoassociates (25 °C), there is no expected outcome. For instance, the introduction of the fourfold L motif (compare FL and FL4) causes a threefold decrease in the observed capacity of GNPs for ssDNA (from 56 ± 2 to 17 ± 2 molecules), while in terms of “anchor” nucleotides, there is an increase in capacity of only 1.2-fold. These data, overall, are consistent with experimental results [44] concerning the relation between the extension of an oligonucleotide by means of high-affinity motifs (via introduction of homoadenylate strands) and surface capacity of GNPs for the oligonucleotide. At the same time, it should be noted that our use of the L motif as a gold-binding “anchor” yields greater affinity of these types of extended oligonucleotides for GNPs as compared to oligo(dA)-containing analogs [23,45,46,47]. In addition, the use of the L anchor is comparable—in terms of achieved efficiency of adsorption of DNA containing it on GNPs—with fluorescein-containing DNA. An increase in the efficiency of adsorption of fluorescently labeled DNAs on GNPs by severalfold as compared to native DNAs has been demonstrated by us elsewhere [14].

3.3. Effectiveness of ssDNA Adsorption on GNPs Depends on Incubation Temperature

All the experiments described above were conducted under standardized conditions, that is, the adsorption of oligonucleotides on GNPs was studied at 25 °C and with a low-ionic-strength solution (4 mM sodium citrate, pH 5.8). The temperature at which the interaction is carried out is one of the decisive factors determining the effectiveness of DNA binding to GNPs. We have previously found that the noncovalent interaction of ssDNA with GNPs proceeds faster at elevated temperatures [
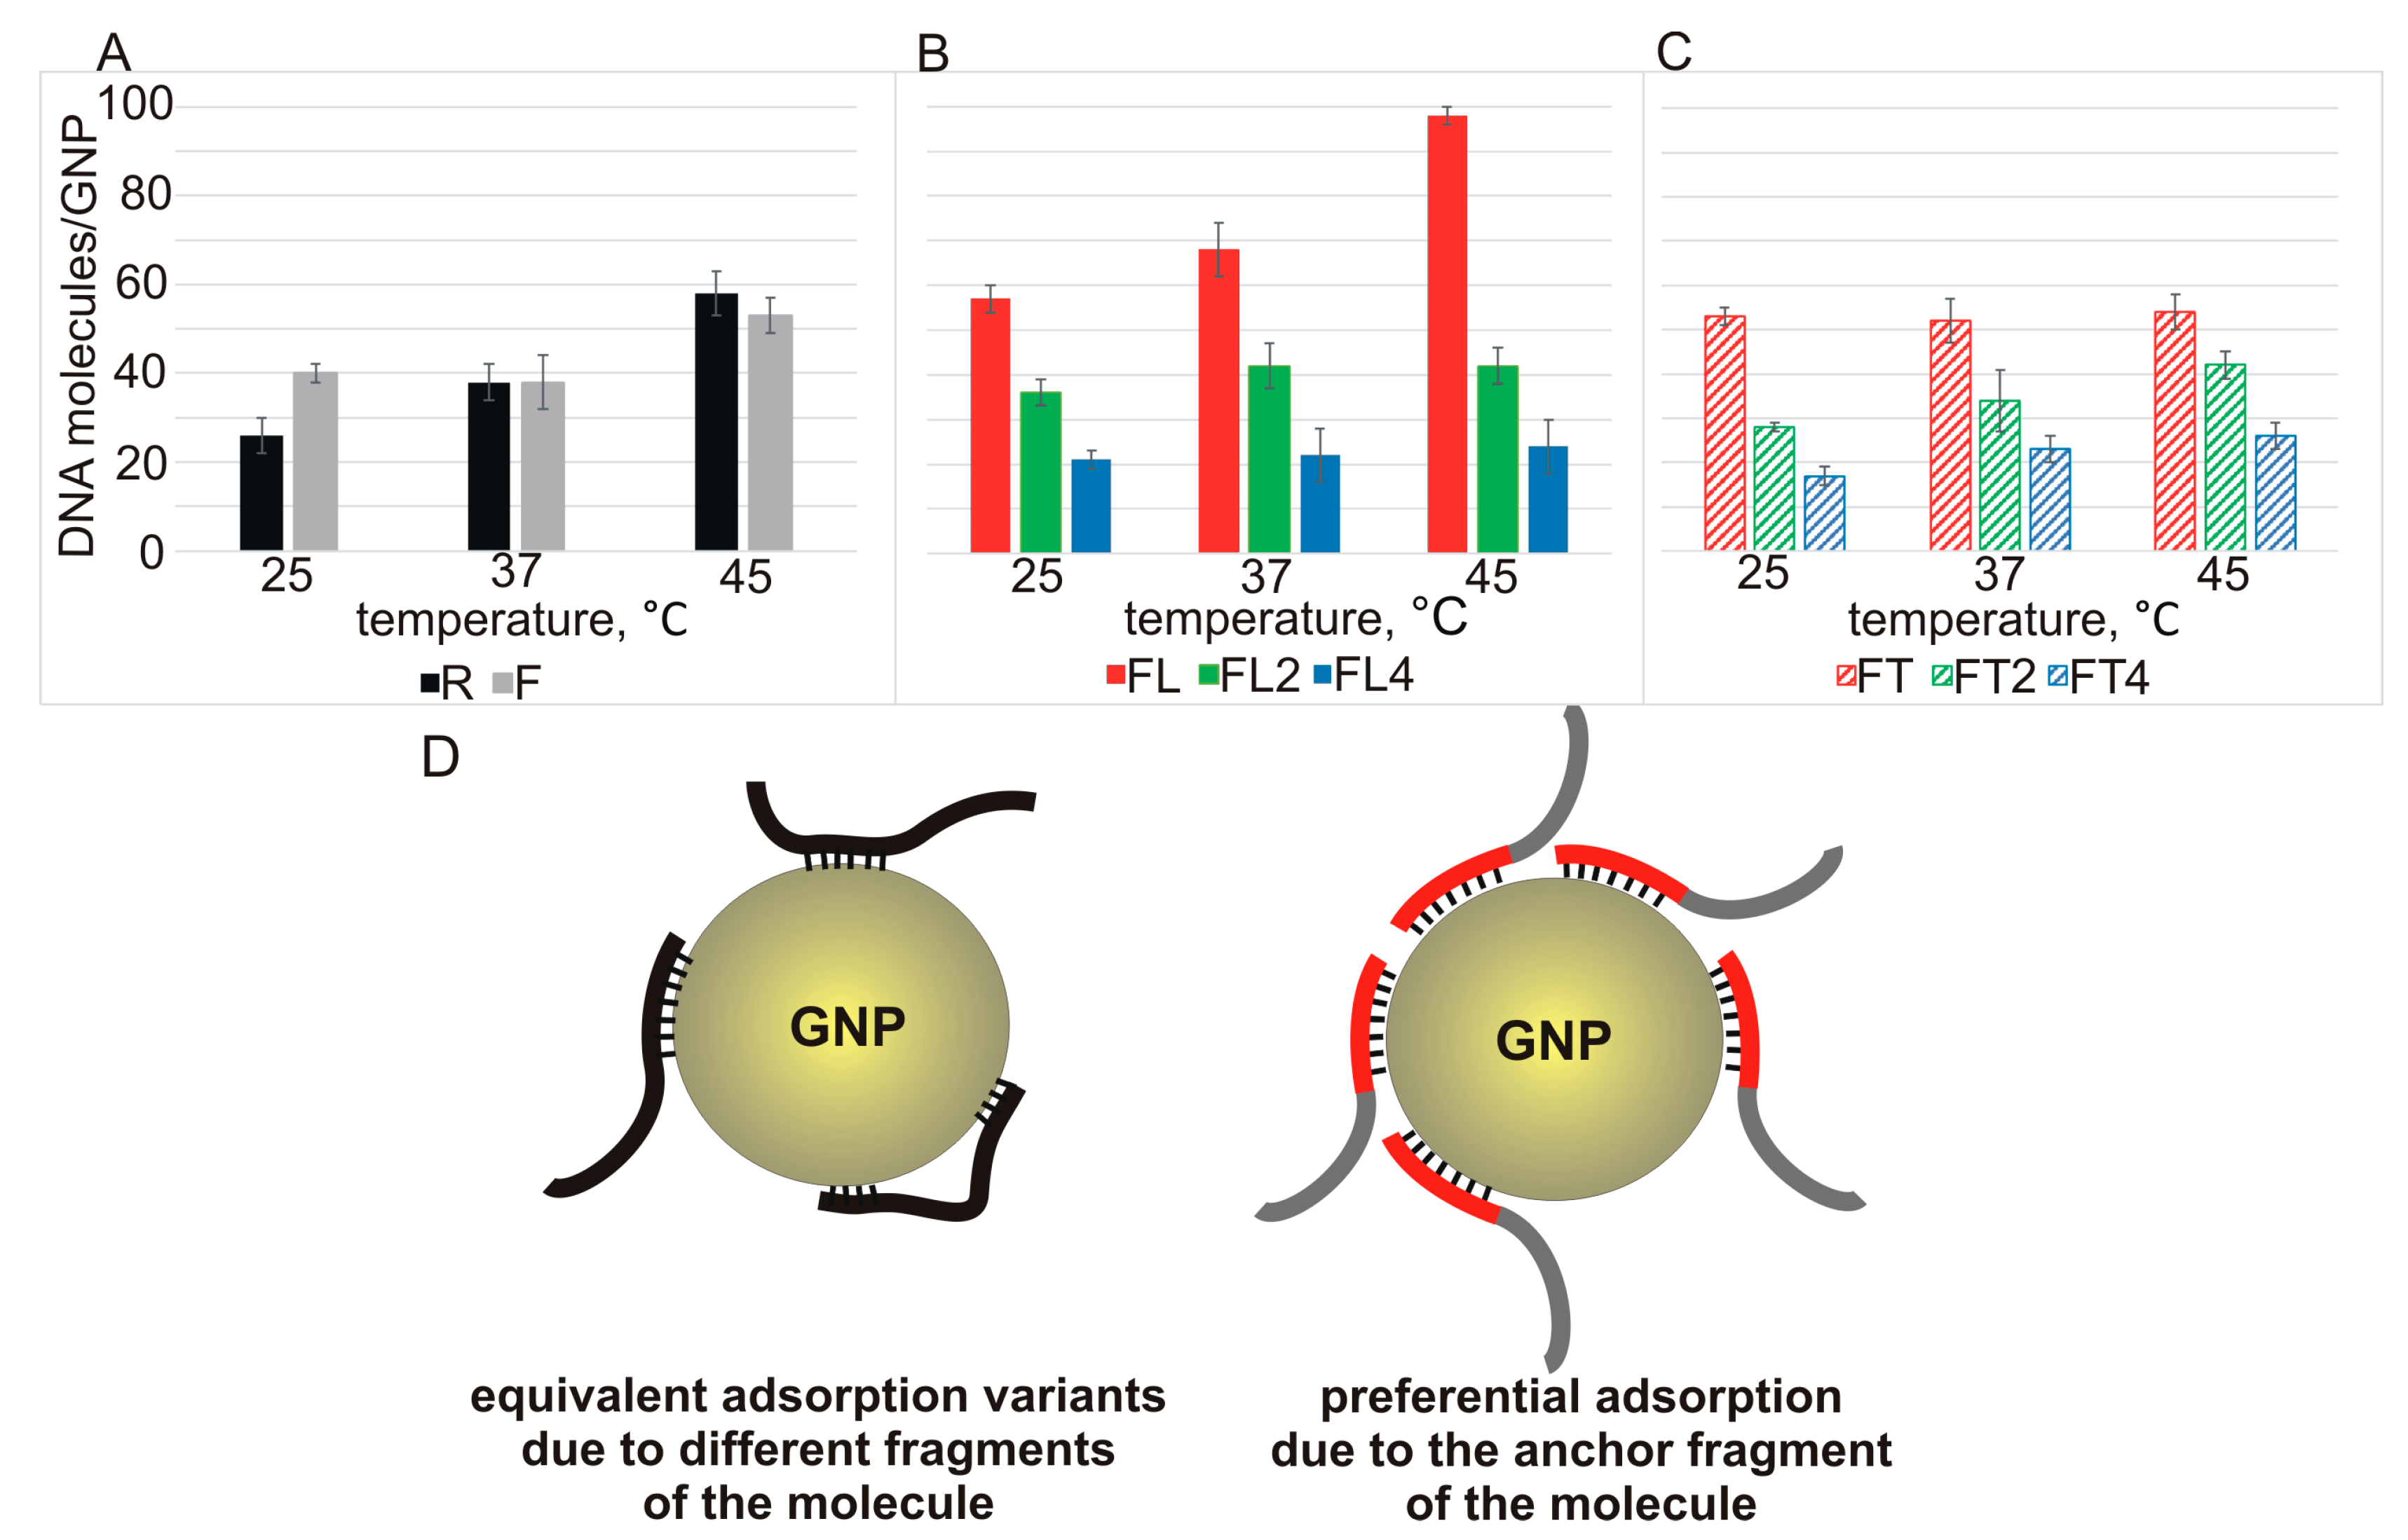
4]. Considering this and the fact that the extension of an ssDNA strand raises the probability of formation of its complicated structures, we next investigated in detail the influence of the incubation temperature of the reaction mixture (25, 37, or 45 °C) on the efficiency of formation of noncovalent ssDNA–GNP associates. One can see that the sequence of ssDNA significantly affects the nature of the dependence of its affinity for GNPs on temperature (
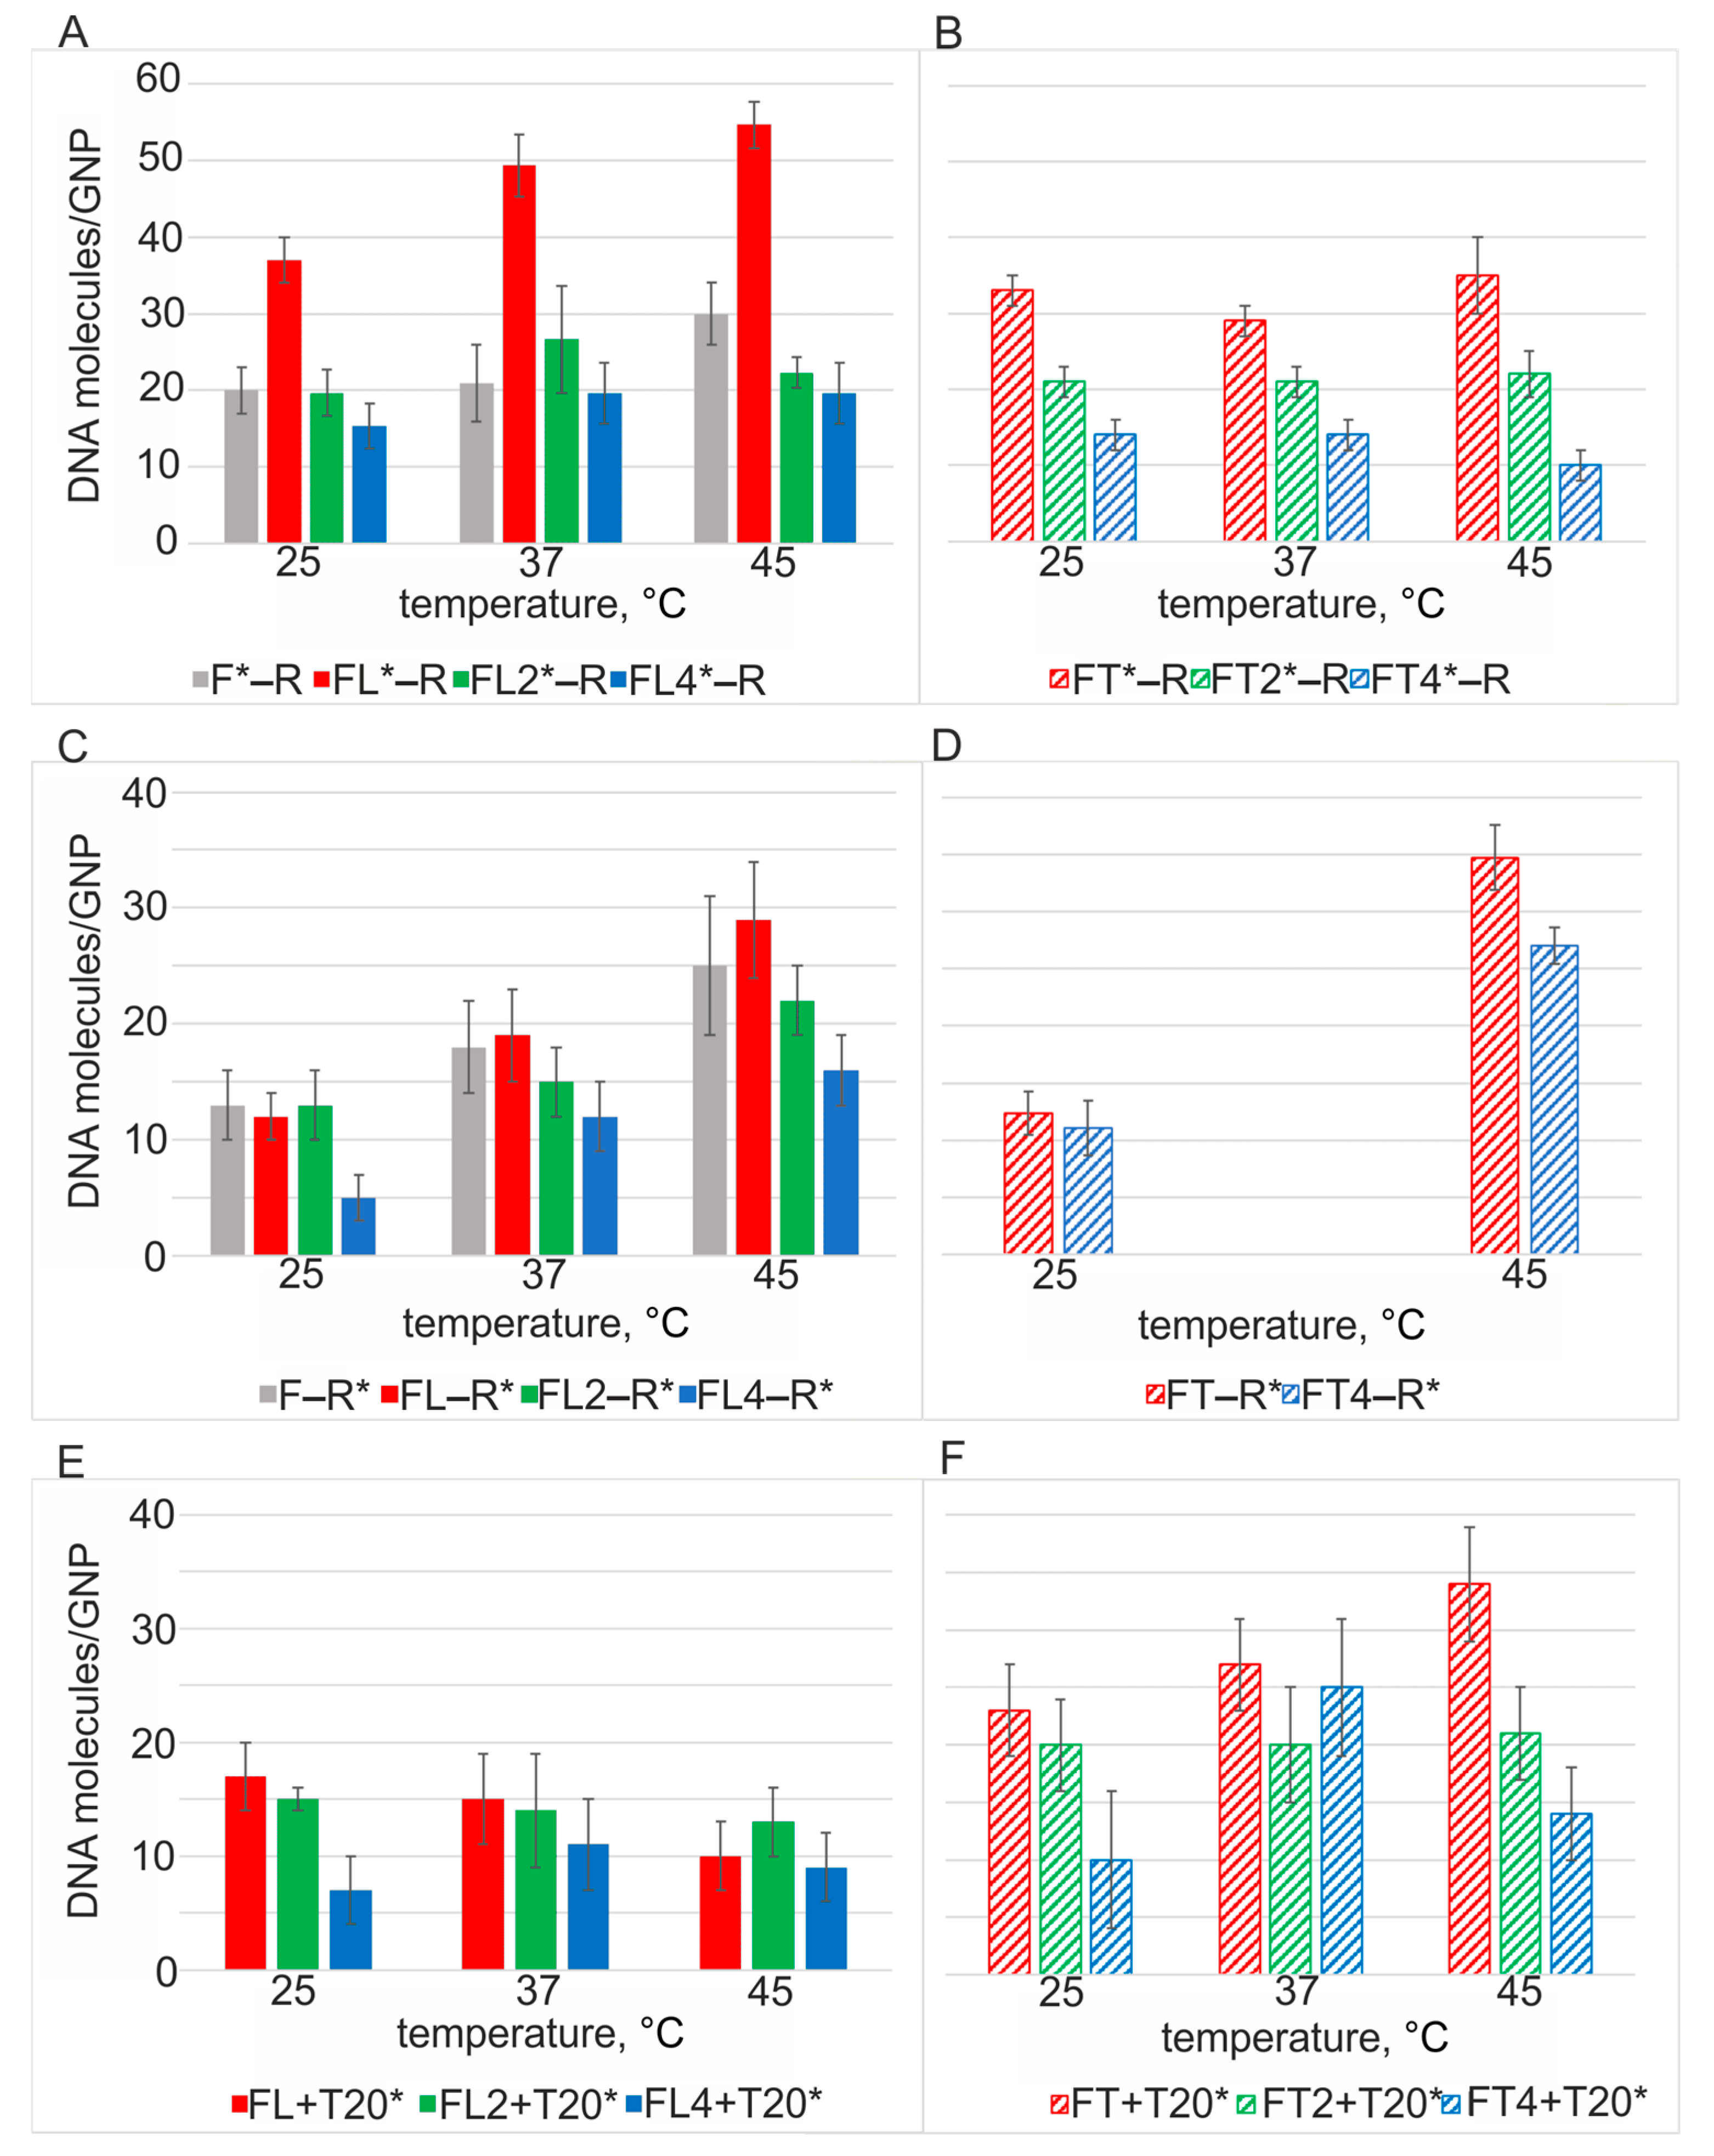
Figure 3A–C).
In the case of binding of 20-mer strands R and F with GNPs, there is a tendency for adsorption capacity to increase with temperature, as expected for ssDNA having a heterosequence that is not prone to the formation of secondary structures (Figure 3A).
A significant temperature-dependent increase in the capacity of GNPs for ssDNA of the FLn series was observed only for FL (length: 26 nucleotides) (Figure 3B, red solid bars). In the other cases (FLn at n > 1), we did not notice an increase in the capacity with increasing temperature of the mixture incubation (Figure 3B,C). This finding validates the notion of a balance of opposing factors: formation of intra- and/or intermolecular structures versus the enhanced anchoring ability of the L region.
Figure 3. The dependence of the capacity of GNPs for ssDNAs R and F (A) or ssDNAs of the L series (B) or of the T series (C) on the temperature of incubation of the ssDNA with GNPs. Modes of adsorption (on GNPs) of the ssDNA oligonucleotides that do not contain (left) or do contain (right) an “anchor” motif (D).
Applsci 13 07324 g003
Our data are suggestive of two possible modes of adsorption of ssDNA on GNPs. For instance, the initial oligonucleotides R and F, which have similar values of affinity for GNPs, and some FTn oligonucleotides (FT2 and FT4) at 25 °C probably form a network of equivalent contacts between their sequence regions and GNPs, without an obvious adsorption advantage for any of these regions. Raising the incubation temperature increases the degrees of freedom of ssDNA, thereby facilitating the interaction of ssDNA with the nanoparticles. This effect enables a greater number of ssDNA molecules to bind to the GNP surface (Figure 3D, left). In the presence of the “anchor” L motif in FL, we observed a pronounced enlargement of the binding capacity with increasing temperature, and the maximum capacity of 98 molecules per GNP was reached at 45 °C (Figure 3D, right).
Oligonucleotides FL2 and FL4 (they have an extended “anchor”) each occupy a greater contact area on the surface of a GNP and at the same time have an elevated propensity for intra-and/or intermolecular structures. These circumstances (taking into account greater electrostatic repulsion with the extension of ssDNA strands) do not allow for a significant increase in the efficiency of this interaction with increasing temperature. Nevertheless, the very presence of gold-binding sequences in FLn (at n > 1) during the formation of the respective noncovalent associates with GNPs enables the mode of predominantly “anchor” adsorption (Figure 3D, right), thereby minimizing electrostatic repulsion during the adsorption of such a large number of molecules. For FTn oligonucleotides, there is probably no clear advantage of one mode, as in the case of F and R, as explained below in the affinity-rating analysis section.

3.4. Affinity-Rating Analysis

The methodology of rating (affinity-rating analysis) the gold affinity in different DNA hexamers, allowing us to theoretically calculate the relative affinity of ssDNA for GNPs, has been proposed by us earlier [23]. By testing this method on the affinity of the present series of ssDNAs for GNPs, we found that the statistically determined (theoretical) affinity of the studied FLn oligonucleotides for GNPs is well consistent with actually observed adsorption efficiency (Table 3).
Readers can see that the rating of theoretical affinity for GNPs increases in the series F < FL < FL2 < FL4. At the same time, only FL has elevated capacity for GNPs (Figure 2) relative to the initial oligonucleotide, F, and the elongation of the L motif reduces the efficiency of binding of ssDNA to GNPs.
The rating method makes it possible to explain the role of Ln and Tn “anchors” in the adsorption of ssDNA on GNPs.
FL consists of two regions: F has a rating of 5.0 × 10⁻⁵, and the L motif (6 nucleotides long) 12.0 × 10⁻⁵, i.e., the affinity of these two segments of FL, when normalized to the number of nucleotides, differs by a factor of 2.4. As a consequence, the interaction of FL with GNPs is most likely mediated by the short 6-nt L motif. This interaction provides much greater occupancy of the surface of GNPs by FL molecules as compared to F. After the extension of the L motif to 12 and 24 nt, its theoretically expected affinity strengthens to 62.0 × 10⁻⁵ in FL2 and to 86.0 × 10⁻⁵ in FL4. Thus, with the increase in the length of the “anchor,” the affinity difference between the “anchor” and the “main” region of the molecule increases even more, by 12- and 17-fold, respectively. Now, the longer “anchor” is even more likely to be adsorbed on GNPs while occupying a larger proportion of the nanoparticle surface, thus leading to the observed decrease in capacity for FL2 and FL4. Moreover, the probability of formation of secondary structures in the elongated oligonucleotides is higher, which also results in lower capacity of GNPs for FL2 and FL4 as compared to FL.
The hexathymidylate motif tends to lower the rating of the FTn containing it; that is, this motif in ssDNA no longer plays the role of an “anchor” that has paramount importance for the adsorption of ssDNA on GNPs. Its introduction into DNA (and extension) does not result in preferential adsorption of the “anchor” part of DNA on GNPs. In other words, we see different levels of capacity for FT2 and FT4 with increasing temperature owing to the equivalent adsorption of different segments of their molecules, in contrast to FL2 and FL4 (Table 2). It can be said that the greater capacity of GNPs for FT compared to F is explained by (i) higher probability of a larger number of different binding modes with the extension of the molecule (Figure 3D), (ii) a slight increase in electrostatic repulsion after minimal elongation, and (iii) the absence of secondary structures. The electrostatic repulsion and its negative contribution to the capacity strengthen with further lengthening of the anchor (in FT2 and FT4).
Therefore, during the interaction of the tested ssDNAs with GNPs, different binding modes are realized:
(1)
The presence of one short high-affinity sequence of the L motif significantly promotes binding precisely due to the direct contact of this motif with the surface of the metal nanoparticle;
(2)
The presence of the Tn motif, which does not have pronounced affinity for GNPs, causes predominant or equivalent interaction (with GNPs) of the other (“main”) part of the oligonucleotide: in our case, F;
(3)
The presence of any long additional motif diminishes the capacity of GNPs for the oligonucleotides, and this phenomenon is most likely explained by (i) the preferential interaction of GNPs with DNA in the single-stranded state (elevated probability of secondary structures) and (ii) a greater role of electrostatic repulsion between negatively charged oligonucleotides adsorbed on the GNP surface.
Striking the right balance between the above factors mainly determines the effectiveness of the ssDNA interaction with GNPs. Apparently, such a balance makes the FL oligonucleotide significantly better than all the other tested ssDNAs (FLn and FTn series and initial oligonucleotide F).

3.5. dsDNA and GNPs

The key point of this study was to investigate the efficiency of adsorption (on the surface of GNPs) of DNA duplexes (Figure 2), including those carrying “anchor” ssDNA motifs that are intended to enhance the affinity for GNPs. DNA duplexes (or dsDNA) were assembled from ssDNAs (strand concentrations from 0.5 to 100 nM) in a 4 mM sodium citrate solution. The concentration of GNPs was constant (0.5 nM) in all experiments.
Initially, we determined thermal stability of the formed duplexes under the conditions utilized for the assembly of the noncovalent nanoassociates. According to the experimental data, the melting temperature (Tm) of all dsDNAs (at 4 μM total concentration of ssDNA) is significantly higher than 25 °C (Table S1). This finding indicates that at a high concentration of interacting complementary DNA strands (100 nM), in solution, all duplexes being analyzed should be predominantly in the double-stranded state. At 37 °C, under such conditions, the DNA duplex is half-dissociated, whereas at 45 °C, the DNA should be predominantly represented by separate strands. According to the calculated data (Table S2), a decrease in the total concentration of ssDNA (to 0.5 nM) at 25 °C should not significantly destabilize dsDNA. Note, however, that the proportion of ssDNAs released from the complex goes up as the concentration of interacting DNA strands decreases [48].

3.6. Adsorption of dsDNA on GNPs

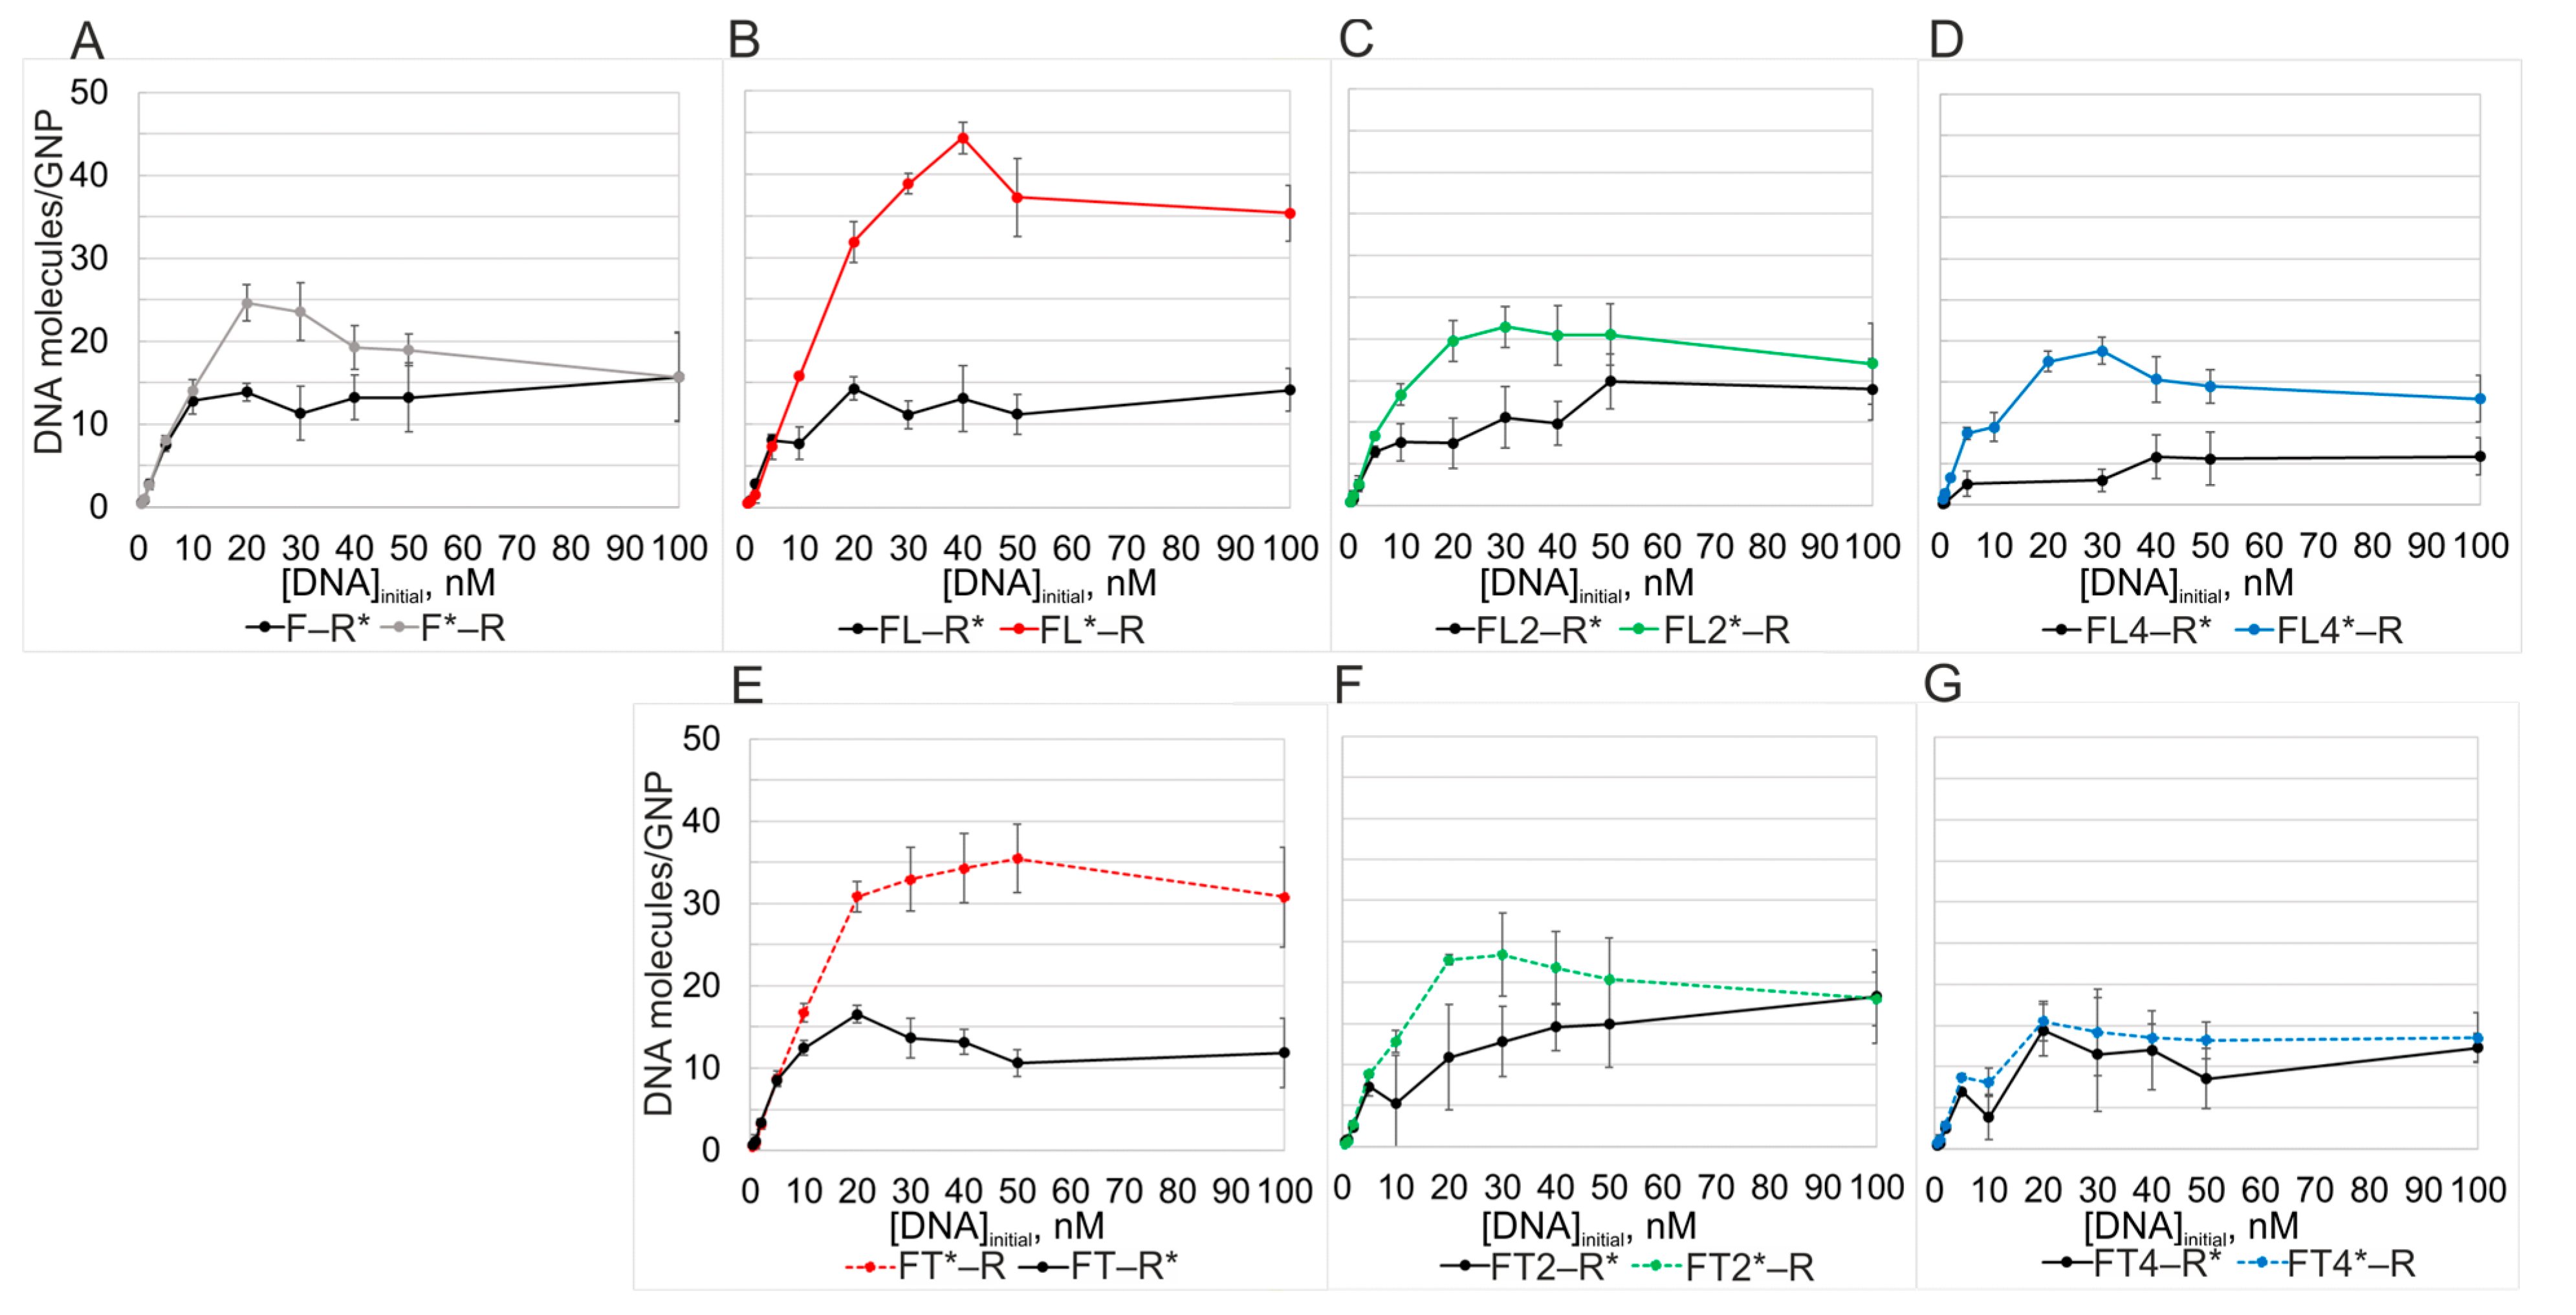
Next, we compared the adsorption (on GNPs) of dsDNAs carrying single-stranded overhangs (L series and T series 6, 12, and 24 nucleotides long) and of the initial blunt-ended duplex (Figure 1). It should be stressed that we assessed adsorption parameters of dsDNA by means of the balance of all the interacting ssDNAs binding to the nanoparticle (Figure 4, Table 4). For this purpose, a radioactive 5′ 32P label was introduced into one or the other DNA strand. One can see that even at high concentrations of dsDNA (all duplexes were stable), we did not observe well-pronounced and equivalent efficiency levels of adsorption of both complementary DNA strands for any of the tested duplexes (Figure 4). A question arises: are such complementary ssDNAs adsorbed on the surface of GNPs in the form of a duplex?
The saturation curves of dsDNAs F*–R and FLn*–R, which contain radiolabeled F strands, have a local maximum in the range of low concentrations of ssDNAs (20–40 nM, Figure 4A–D), when the presence of a substantial amount of the ssDNA form in the reaction mixture should still be expected. Obviously, an increase in the concentration of the interacting strands to 100 nM should considerably reduce the probability of “complementarity-mismatched” interaction of individual DNA strands with GNPs. In this context, it is important to take into consideration that the strands released from dsDNA, which have a propensity for intra- and/or intermolecular interactions, can also lose the ability to independently bind to GNPs [15]. In the extreme case, an increase in the concentration of dsDNA and the consequent increase in Tm values (Table S2) determine the convergence of capacity values when we examine saturation curves of complementary ssDNAs (with the exception of FL–R) (Figure 4A,C,D). It is for this reason that values of saturation capacity of the GNP surface for components F and FL2 relative to component R become significantly closer (Figure 4A,D), that is, under the conditions that are most conducive to the formation of dsDNA.
Let us examine the same duplexes when the R strand is radiolabeled (Figure 4A–D). One can see that radiolabeled 20-mer R* in a stoichiometric mixture with any DNA of the L series adsorbs worse at most concentrations. Only ~14 molecules of R* per GNP when mixed with F, FL, or FL2, and only six molecules of R* when mixed with long FL4, bind to a GNP, whereas 20 to almost 40 molecules of the L series of oligonucleotides were found cover the GNP. The use of the long L4 overhang (having high Au affinity, occupying greater specific area on the GNP surface, and creating the strongest electrostatic repulsion between adsorbed DNA strands within the associates with GNPs) further complicates the adsorption of R. As already mentioned, an important experimental finding here is the difference in saturation capacity of GNPs between FLn*–R and FLn–R* (at n = 1, 2, and 4).
The capacity of GNPs for the labeled R* strand in mixtures with each FTn oligonucleotide was ~13 molecules per GNP. This confirms that adsorption efficiency of even the longest T-containing 44-mer FT4 does not give it an advantage in affinity for GNPs when FT4 competes with R. This is an important result, especially in contrast to FL4, which carries the long, gold-binding L4 motif (Table 4) [4,23,32,37].
In the comparison of DNA duplexes radiolabeled on different strands (FLn*, FTn*, or R*), it becomes obvious that, overall, T motifs are inferior to L motifs in the efficiency of formation of DNA/GNP nanoassociates. This observation vividly reflects the difference in features (affinity) of individual parts of the oligonucleotides and is consistent with the presented data on ssDNAs in Figure 3B,C. Thus, the observed differences between complementary ssDNAs of a duplex in the adsorption correlate with the affinities of individual ssDNAs for GNPs. Probably, gold affinity levels of complementary oligonucleotides must be very similar to ensure their adsorption on GNPs in the form of a DNA duplex. This is evident in the F–R duplex, where the capacity on the F* side is 20 ± 2 molecules and, on the R* side, it is 16 ± 1 molecules (Table 4).

3.7. The Dependence of Adsorption Efficiency of a Mixture of ssDNAs to GNPs on Incubation Temperature

Next, we investigated the dependence of the capacity of GNPs for dsDNA on the incubation temperature of the reaction mixture (25, 37, and 45 °C). Such data should reveal how the adsorption of a stoichiometric mixture of complementary ssDNAs occurs and is realized on GNPs: individually or as part of the duplex. To distinguish between processes of adsorption of dsDNA and the competition of individual ssDNA strands with each other, we conducted experiments on the adsorption of each ssDNA (FLn or FTn) paired with a noncomplementary oligonucleotide, T20, under the same conditions. Oligothymidylate T20 by itself has GNP affinity similar to that of R (Figure S3), i.e., T20 should manifest exceptionally competitive behavior when coadsorbed with any of the ssDNAs on GNPs.
Let us analyze the adsorption (on GNPs) of DNAs of the FLn series in a mixture with the R oligonucleotide, which has almost the same affinity for GNPs as the F oligonucleotide does. For duplexes F*–R and FL*–R, two significantly different binding modes are seen at 25 and 45 °C (gray and red solid bars in Figure 5A). Duplexes FL2*–R and FL4*–R manifested the same binding mode at all temperatures (green and blue solid bars in Figure 5A). Consequently, the adsorption of dsDNA via a long high-affinity albeit structured “anchor” is more favorable at all temperatures as compared to all other adsorption modes. R* paired with any DNA of the L series showed a tendency for increased capacity with increasing temperature (Figure 5C). By contrast, the capacity for T20* in the presence of DNA of the L series either diminished or remained at the same level with increasing temperature (Figure 5E). Namely, under competitive conditions, lower-affinity T20 is inferior to higher-affinity DNAs of the L series. Because T20 is a homosequence, preferential adsorption of any of its regions can be ruled out, and we observed the same magnitude of adsorption at all temperatures. Capacity values of mixtures with T20* did not exceed those for R* under the corresponding conditions (Figure 5C,E). This finding can be explained by partial formation of a duplex between R and DNA of the L series, with this process bringing a greater number of R molecules to the surface of GNPs.
For oligonucleotide pairs (FTn* and R), similar capacity values were observed regardless of incubation temperature (Figure 5B, e.g., 21 molecules of FT2*–R per GNP at 25, 37, and 45 °C: green striped bars), in agreement with previously published data [4]. Capacity values of R* in mixtures with DNA of the FT series increased with increasing temperature (Figure 5D), i.e., partial duplex formation takes place, as in the case of FLn–R* (Figure 5E). Note that FT4–R* is adsorbed almost two times more (Figure 5D) as compared to mixture FL4–R* (Figure 5C) at both 25 and 45 °C. This result reflects more favorable and/or faster adsorption of the shorter and higher-affinity R compared to FT4 (in contrast to the ratio of gold affinity levels in the FL4–R pair) [43]. The substitution of FLn with FTn resulted in a significant increase in the adsorption of T20*, thereby reflecting a difference in the affinity between the L and T motifs, which allows more T20 molecules to be adsorbed during competition with lower-affinity FTn (Figure 5E,F).
At the same time, we should highlight the absence of a temperature dependence in the adsorption of T20* in pairs with FTn (Figure 5F) or with FLn (Figure 5F), in contrast to the behavior of R*, whose capacity increases with temperature, thus confirming that the adsorption of complementary DNAs is not exclusively competitive (Figure 5C,D).
Therefore, it can be concluded that when interacting with GNPs, ssDNAs complementary to each other compete with each other, while some of them form a duplex, which is also adsorbed on GNPs.
Figure 5. The dependence of the capacity of GNPs for a mixture of DNAs on the temperature of incubation of the DNAs with GNPs. (A) DNAs of the L series in a mixture with complementary R, (B) DNAs of the T series in a mixture with complementary R, (C) complementary R mixed with DNA of the L series, (D) complementary R mixed with DNA of the T series, (E) competitive T20 mixed with DNA of the L series, and (F) competitive T20 mixed with DNA of the T series. * denotes radioactively labeled DNA.
Applsci 13 07324 g005

3.8. Evaluation of the Mobility of DNA–GNP Associates by Agarose Gel Electrophoresis

Determination of surface capacity of GNPs for DNA characterizes the average occupancy of the nanoparticles by oligonucleotides in a given sample. The gel electrophoresis method enables researchers (i) to separate DNA/GNP associates by their charge and size and (ii) to estimate the proportion of associates having different levels of oligonucleotide occupancy in one sample. It has been previously reported that the mobility of associates of GNPs with unstructured ssDNAs is determined only by the charge of these associates [4]. In general, the higher the capacity of a GNP for ssDNA, the greater the negative charge on the surface of GNPs (owing to negatively charged internucleotide phosphate groups in DNA) and the higher the electrophoretic mobility of ssDNA/GNP associates and the proportion of maximally mobile GNPs in the sample [4,49].
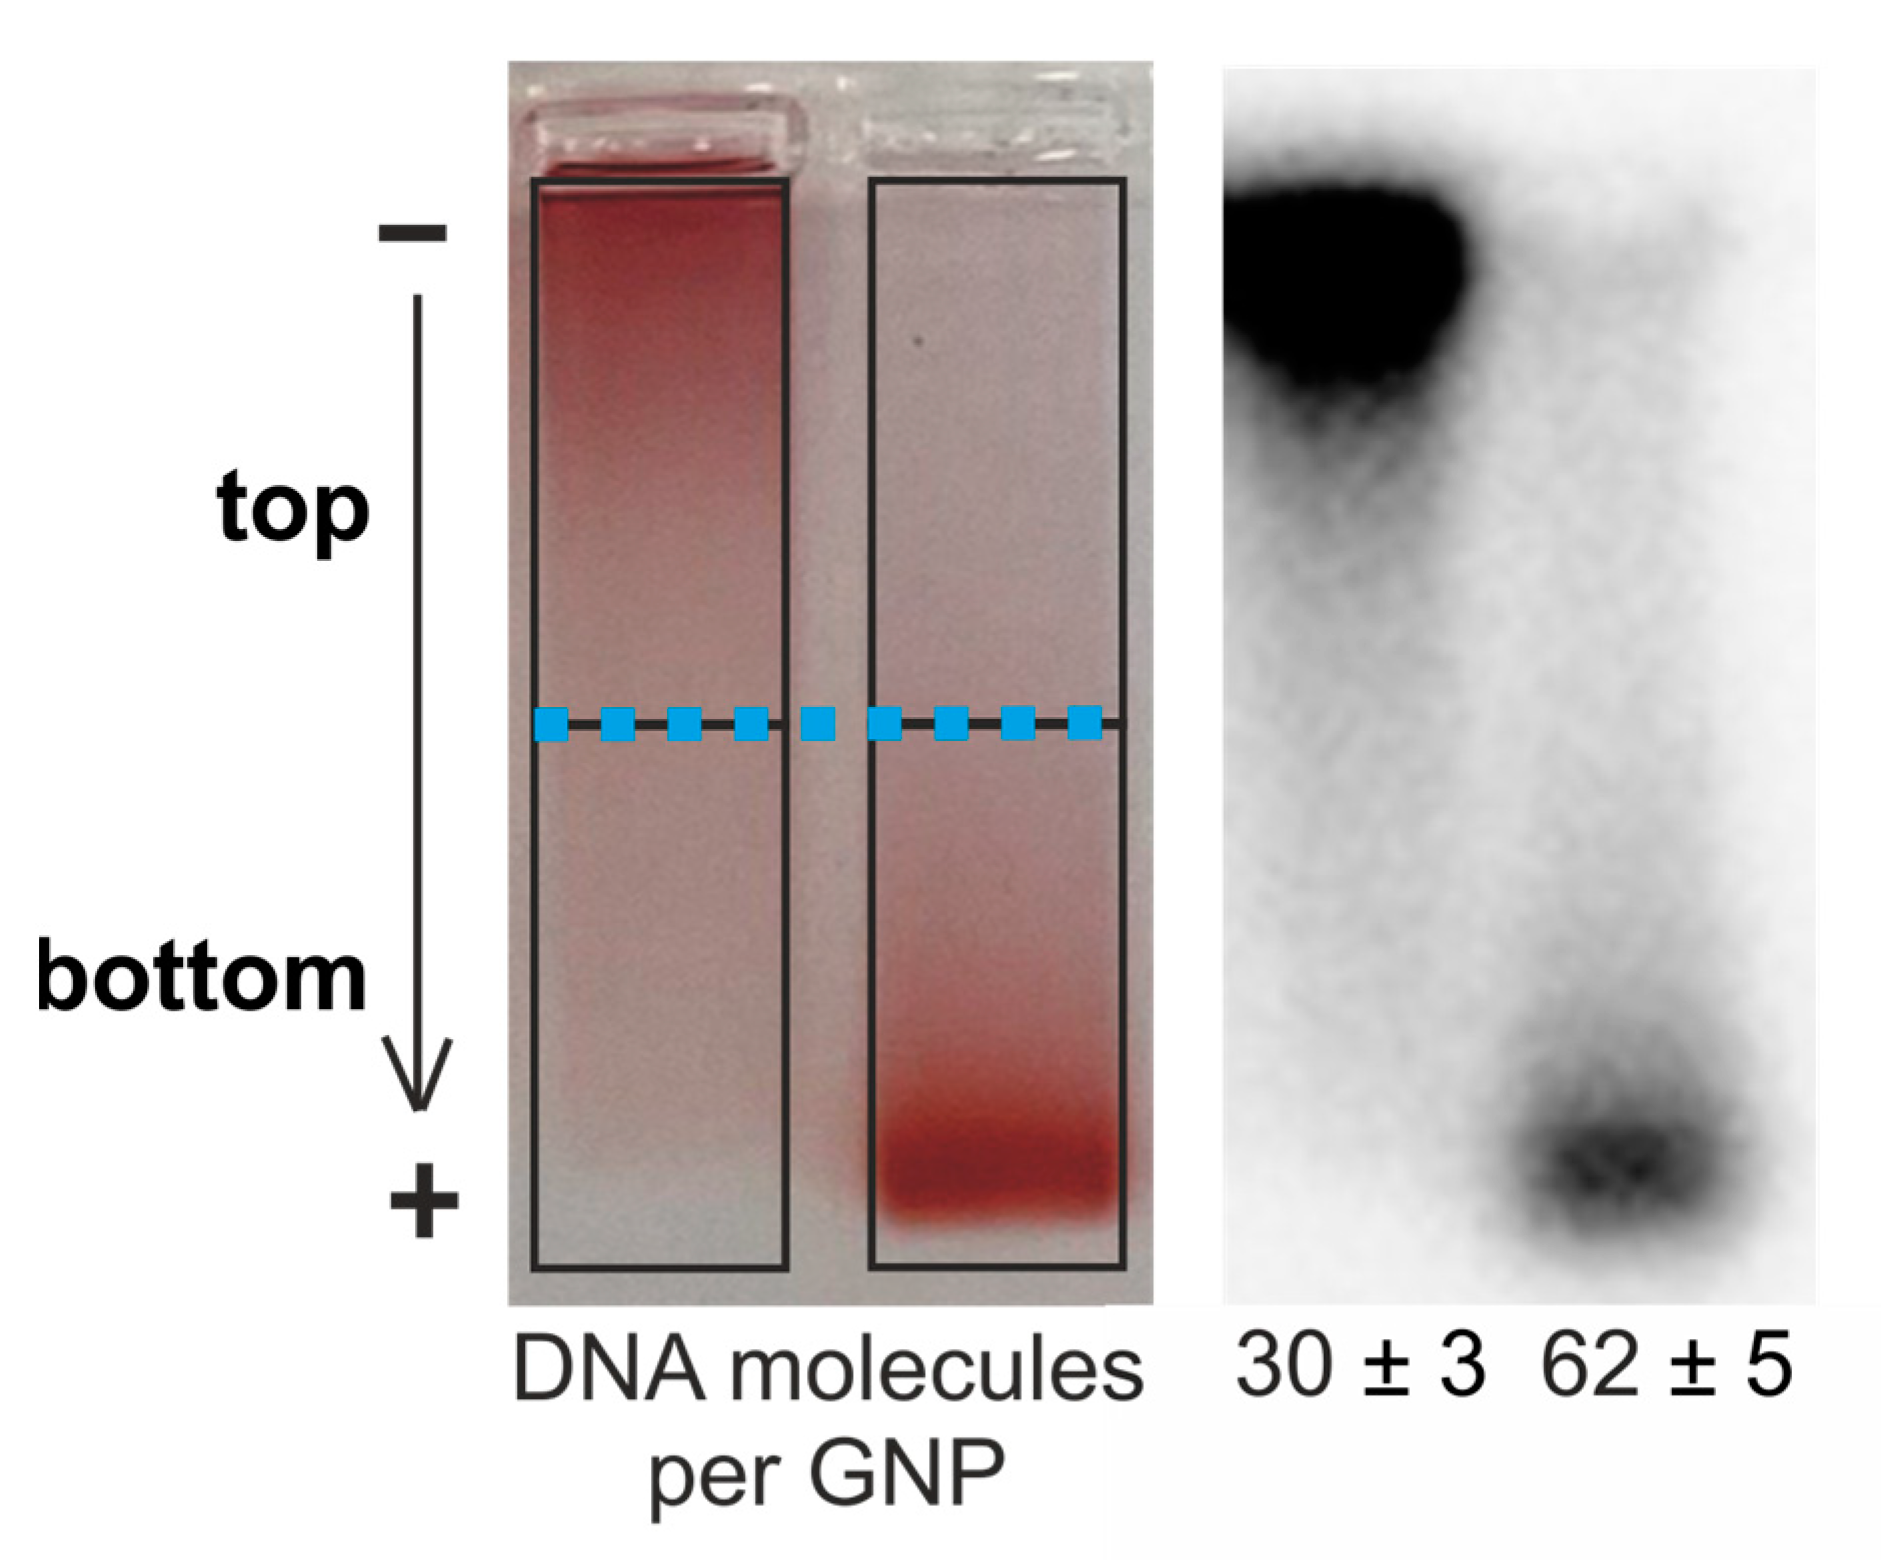
Analyzing scans and autoradiographs of the same agarose gel containing GNPs with radioactively labeled ssDNA, we found that the mobility of the associates indeed directly depends on the number of adsorbed molecules of ssDNA (Figure 6). On the contrary, images of associates consisting of GNPs and a pair of complementary ssDNAs did not correlate with the surface capacity of GNPs for dsDNA (Figure 7).
We hypothesized that for associates of GNPs and a pair of complementary ssDNAs, the relation between the capacity and mobility in the gel differs from this relation for associates of GNPs with one ssDNA. Therefore, to analyze the mobility of DNA–/GNP associates, in each lane of the gel image, we identified two parts having the same geometric area (marked with a blue dotted line in Figure 6: the upper part contained “slow” associates, and the lower one contained “fast” ones). We calculated the proportion “slow” and “fast” associates relative to the total staining intensity of the entire lane for each associate formation temperature (25, 37, and 45 °C).
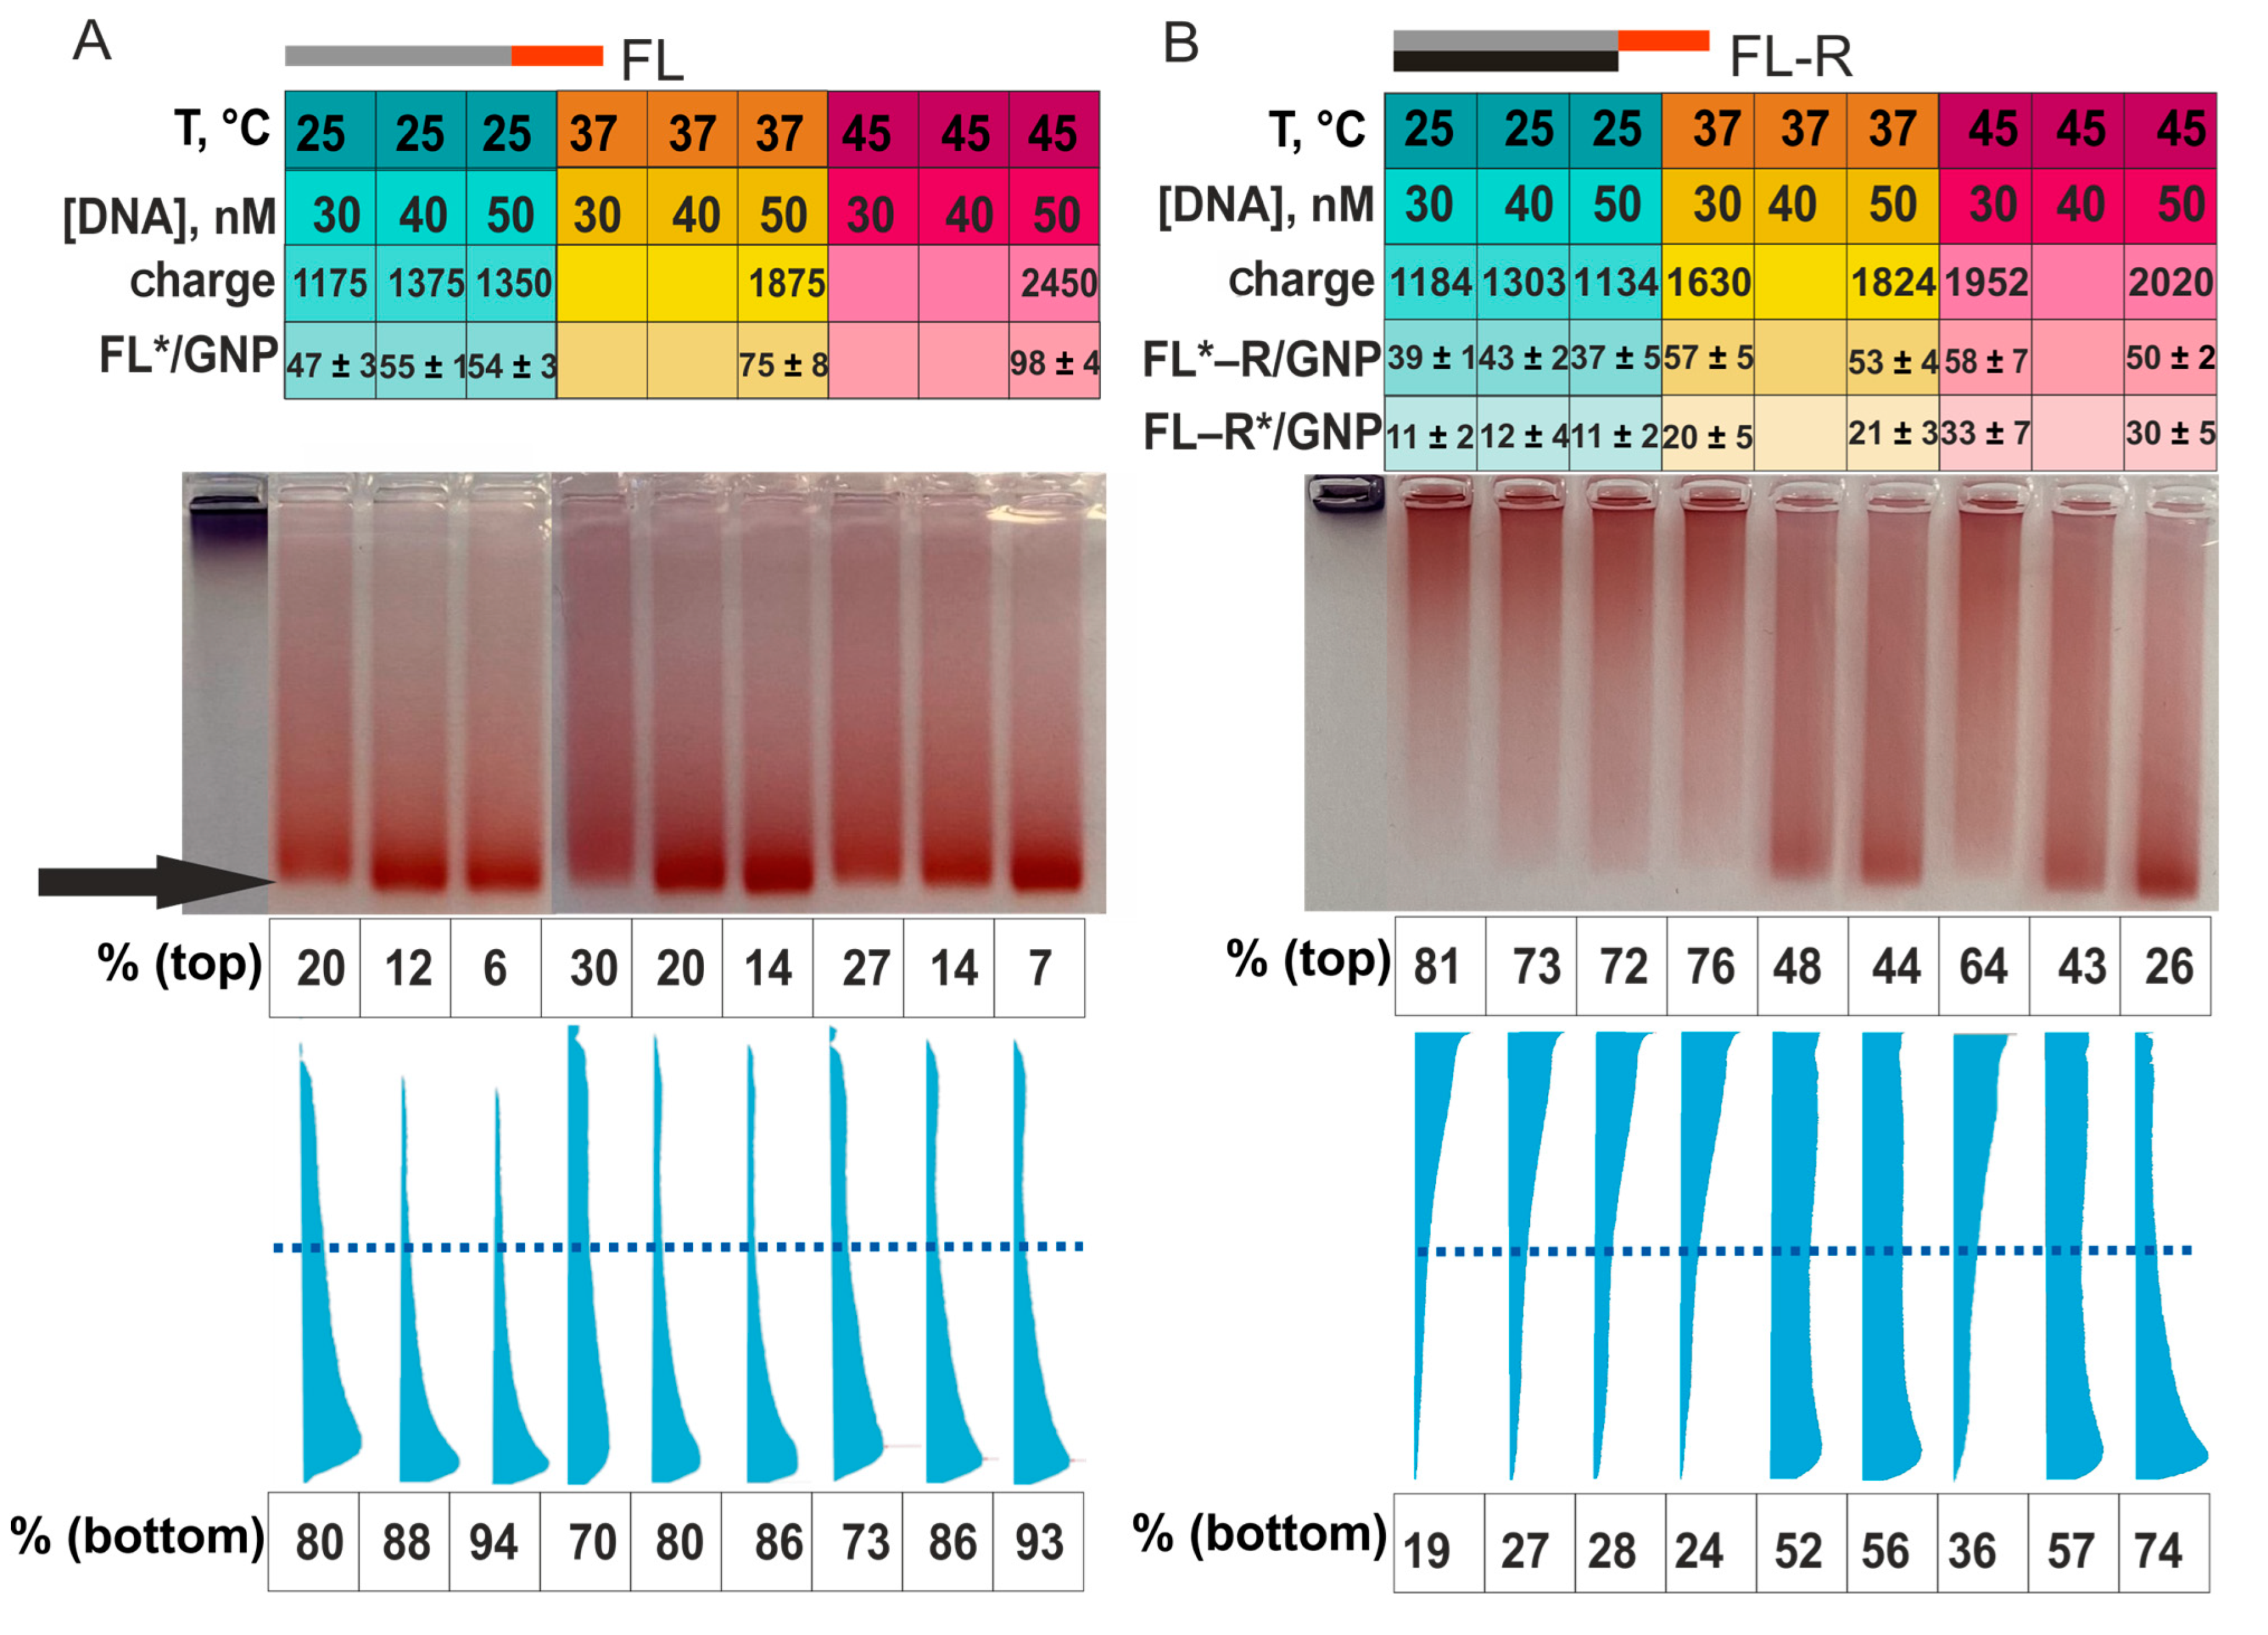
Let us first examine the electrophoresis of ssDNA/GNP associates using FL/GNP associates as an example (Figure 7A). At 25 °C and at a concentration of ssDNA from 30 to 50 nM, the capacity in FL–GNP associates increases from 47 to 54 molecules of FL per GNP (Figure 7A, rows [DNA] and FL*/GNP). These seven FL molecules correspond to an addition of 175 internucleotide phosphate groups (Figure 7A, row “charge”). In the meantime, the increase in the lower fraction (“fast” associates) in the gel was 14% (Figure 7A, row “% bottom”). For the 50 nM concentration of FL, while changing the temperature from 25 to 37 and to 45 °C, we observed an increase in FL/GNP capacity by 21 and 23 FL molecules, that is, by 525 and 575 phosphate groups. The proportion of “fast” associates grew to 86% and 93%, respectively. Furthermore, it is visible that the increase in the FL concentration and in incubation temperature (with the increase in capacity and charge up to 2450 phosphate groups) did not raise the highest mobility of the associates under electrophoresis conditions. This outcome is due to the highest occupancy of the binding sites on the surface of GNPs by ssDNA molecules [4,14]. Thus, for high-affinity unstructured ssDNA FL, the expected picture was observed: with increasing capacity, the charge increased, and the proportion of “fast” associates grew. FL/GNP associates are compact, their movement is not hindered by the size of the gel pores, and their velocity is determined only by the electric field parameters used. For the second ssDNA, R, which is complementary to FL, a similar pattern was registered (Figure S4).
The associates obtained by incubation of GNPs with a mixture of FL and R at 25 °C in the concentration range of 30–50 nM ssDNA (Figure 7) had the same capacity for ssDNA FL (40 molecules on average, row FL*–R/GNP in the figure) and for ssDNA R (11 molecules on average, row FL–R*/GNP in the figure), corresponding to 1134–1303 internucleotide phosphate groups (Figure 7B, row “charge”). Nonetheless, 72–81% of FL–R/GNP associates were “slow” rather than “fast,” as might be expected from their high negative charge (Figure 7B). According to the FL–R melting point (Table S2), the ssDNA should be in a duplex at 25 °C [48]. Although occupancy levels of GNPs by FL and R molecules are not equal, it is expected that some of the adsorbed DNAs formed a duplex because we see a decrease in the mobility of the FL–R/GNP associate, probably owing to an increase in the size of the associate itself.
Raising the temperature of incubation of GNPs with mixture FL–R up to 37 °C enlarged the capacity of GNPs (on average) by 16 molecules of FL and by 10 molecules of R (an increase of 690 phosphate groups in row “charge” in Figure 7). At this temperature, the DNA in the incubation solution can be of single- and double-stranded form (Tables S1 and S2). Consequently, some oligonucleotides could be adsorbed in a single-stranded state, thereby forming compact “fast” associates. Moreover, with increasing temperature, the greater increase in capacity was due to FL. This effect widened the imbalance between the amounts of adsorbed FL and R even more and increased the proportion of associates of GNPs with ssDNA. Overall, for FL–R/GNP associates, these changes elevated the proportion of “fast” associates (from 28% at 30 nM to 56% at 50 nM, Figure 7B, for 37 °C, row “% bottom”).
At 45 °C, the DNA should be in a single-stranded state (Tables S1 and S2). Accordingly, we predicted the formation of mostly “fast” associates at all DNA concentrations. Nevertheless, the proportion of “fast” associates was only 36% at a DNA concentration of 30 nM and a large total charge of associates: 1952 phosphate groups (Figure 7B, for 45 °C, row “Charge”). Considering the high capacity of GNPs for oligonucleotides, especially FL, at 45 °C, FL/GNP associates are most likely formed via DNA adsorption through the “anchor” and a vertical arrangement of the “main” part (F) of the FL oligonucleotide with respect to the GNP surface. These circumstances should facilitate the complementary interaction of adsorbed FL molecules with R molecules adsorbed on another GNP. As a result, highly charged but large and “slow” associates (FL/GNP + R/GNP) can come into being. With a further increase in the concentration of FL and R at 45 °C, the same trends were observed as those at 37 °C: the proportion of “fast” associates increased from 36% to 74% (Figure 7B, for 45 °C, row “% bottom”).
The presence of large and “slow” associates (i.e., a redistribution of some oligonucleotides from filled GNPs to naked GNPs) was confirmed in experiments involving (i) separation of mixture (FL + R) /GNPs (Figure 7B) and of a mixture of associates obtained beforehand (FL–GNP + R–GNP) (Figure S5A) and (ii) mixing of additional citrated GNPs with ssDNA/GNP associates, followed by incubation for 0, 2, and 24 h (Figure S5A,B).
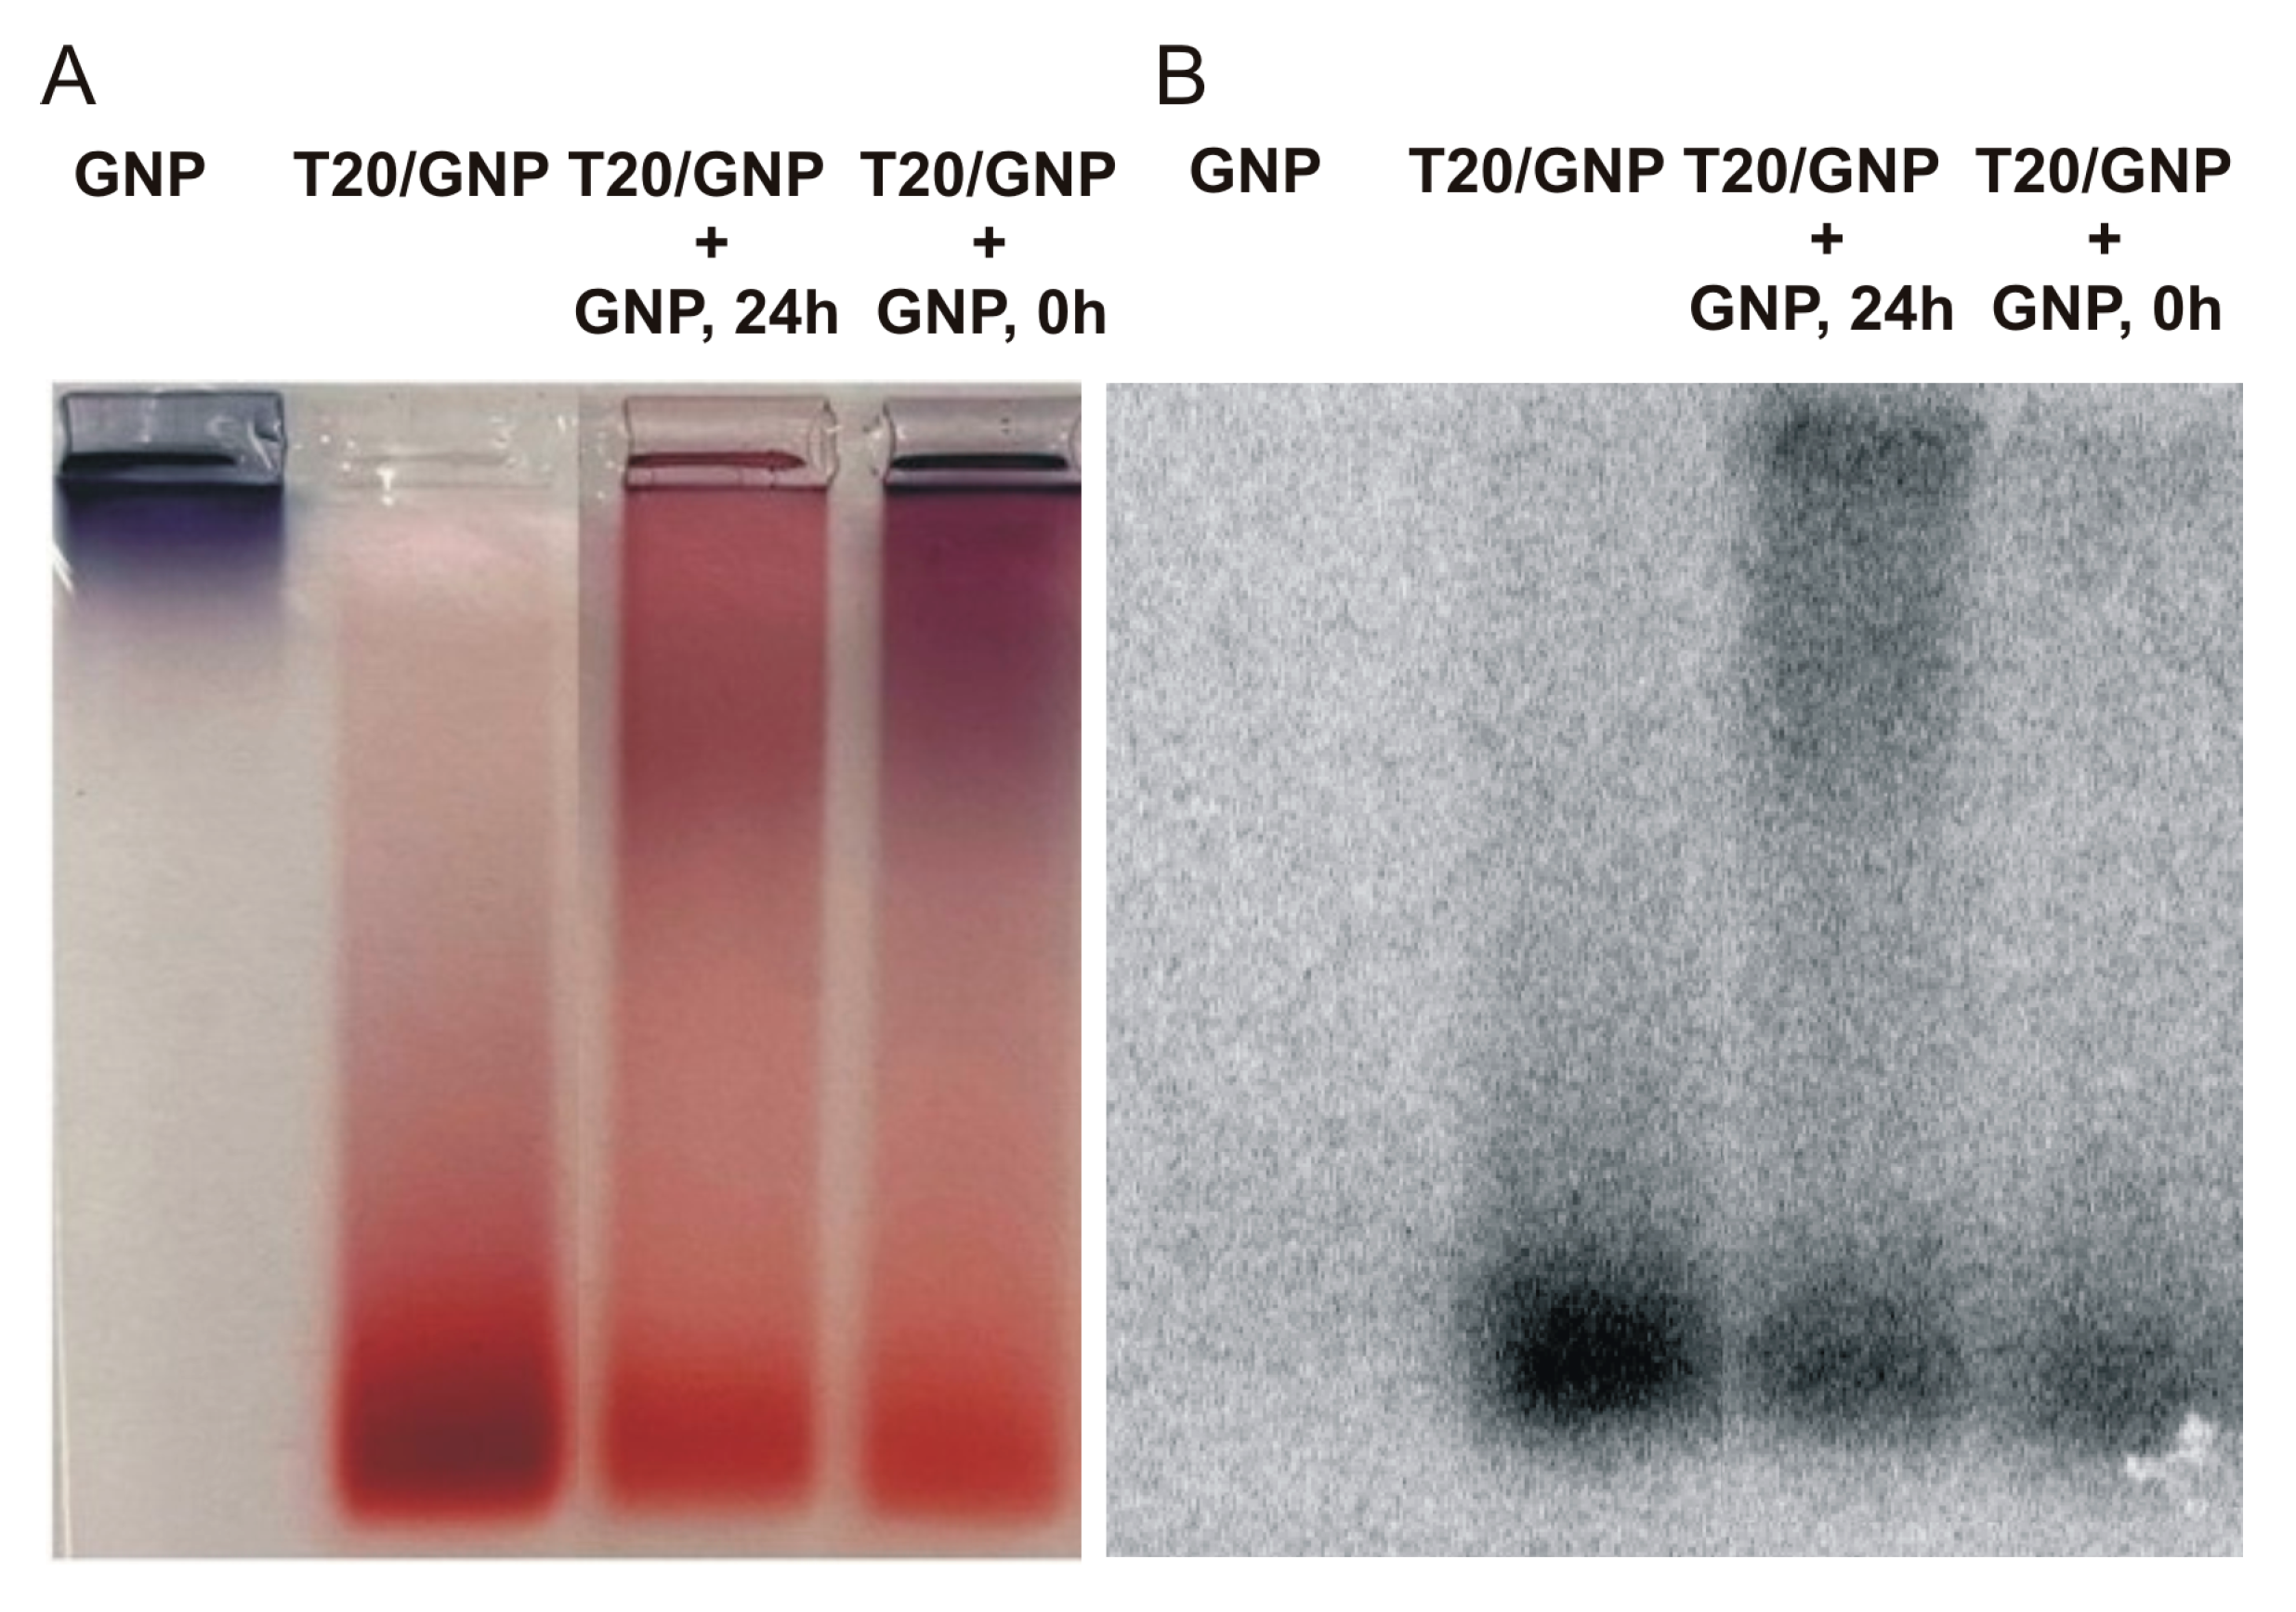
Analysis by means of radiolabeled T20 clearly confirmed the redistribution of some oligonucleotides from loaded GNPs to naked GNPs (Figure 8).
The initial ratio of the amount of T20 adsorbed on the particles of the upper and lower fractions (according to electrophoretic mobility) was 21% and 79% (Figure 8A,B, lane T20–GNP). Immediately after the addition of the naked GNPs to T20*/GNPs, this ratio shifted to 29% and 71%, respectively (Figure 8A,B, lane T20/GNP+GNP, 0 h). After 24 h, the amounts of DNA in the upper and lower particle fractions equalized and amounted to 50% each (Figure 8A,B, lane T20/GNP+GNP, 24 h). Moreover, immediately after mixing, we noticed desorption of some T20 molecules (22% or 7 out of 32 molecules), and after 24 h, almost no desorption was detectable (6% or 2 out of 32 molecules). In other words, upon addition of naked GNPs, there was probably desorption of some DNA molecules from the surface of the initial associates into the solution. These molecules were then adsorbed onto the surface of the added GNPs. As a consequence, after 24 h, DNA desorption into the solution was not detectable.
Therefore, after the mixing of two types of associates (FL/GNP and R/GNP), desorption of the appreciable proportion of DNA into the solution at 1 day after the mixing indicates the formation of a duplex by these DNAs in solution (Figure S6).
Thus, the ratios of the capacity and of electrophoretic mobility—of GNP associates with ssDNA or with a mixture of complementary ssDNAs—indirectly confirm possible formation of DNA duplexes upon adsorption on GNPs at all tested concentrations and temperatures. It is known that the method of DNA binding to the surface of GNPs affects the size of the associate and its mobility in an agarose gel [50]. Indirectly, the existence of such a relation has been demonstrated for associates of GNPs with thiol-containing and native oligonucleotides. The associates of GNPs with thiol-containing ssDNAs have a larger radius as compared to the associates of GNPs with thiol-dsDNA or with thiol-free ssDNA [49]. As a consequence, associates of GNPs with thiol-bound dsDNAs migrate more slowly in an agarose gel than do associates of GNPs with noncovalently bound dsDNAs [50].

4. Conclusions

While trying to dissect the process of interaction of DNA duplex structures with carrier surfaces in our study on GNPs, we should address in detail the question of which state of DNA, single- or double-stranded, has prevailing affinity for the surface of the material (Figure 9).
It would seem that the extension of an oligonucleotide via the introduction of the gold-binding L motif, especially when several such motifs are attached, should noticeably increase the capacity of GNPs for DNA molecules. By contrast, using an analogous series of homothymidylate motif-extended oligonucleotides showing statistically significantly weakened affinity for GNPs, we were able to demonstrate that the increased likelihood of intramolecular structures in ssDNA weakens its expected affinity for GNPs. Moreover, by means of the 32P label introduced separately into each strand of interacting oligonucleotides, we were able to show for the first time that on the surface of GNPs, the DNA duplex only partially retains its duplex structure. Meanwhile, it is known [51] that ΔG of association of the duplex DNA is −23.8 kcal/mol, and ΔG of adsorption of the same DNA duplex on GNPs is −6.8 kcal/mol, i.e., energies of these processes are of the same order of magnitude and, hence, competition between them is likely.
It is more likely that the affinity of ssDNA, that is, of its individual strands, determines the capacity of the gold surface for dsDNA molecules. In this context, the affinity of each complementary interacting strand is of paramount importance. Our study unambiguously shows that ssDNA has much more pronounced affinity for GNPs in comparison with its duplex or intramolecularly structured state. With all this, while examining the material balance of noncovalent interaction of a pair of complementary oligonucleotides with GNPs, a researcher should take into account a wide range of implementation of intermediate and final types of association of the NAs with each other and with the nanoparticle. Our findings suggest that the preservation of dsDNA structures when dsDNA is adsorbed on GNPs should be experimentally confirmed both in the case of SH-free and SH-containing oligonucleotides. Summing up, it must be noted that the scheme of GNP–DNA interaction proposed by us (Figure 9) indicates the complexity of the processes involved, and the role of each of them may be decisive in the rational design of carriers containing DNA duplexes.

Supplementary Materials

The following supporting information can be downloaded at: https://www.mdpi.com/article/10.3390/app13127324/s1, Table S1: Thermal denaturation temperature of dsDNAs; Table S2: Thermal denaturation temperatures of the F–R duplex at different DNA concentrations; Figure S1: Possible secondary structures of (A) FL4, (B) FL2, and (C) R; Figure S2: Thermal denaturation curves of ssDNA in 4 mM Na3C6H5O7. (A) Thermal denaturation integral curves of ssDNA at 2 × 10⁻⁶ M; (B) differential curves of thermal denaturation of FL2 at concentrations of 2 × 10⁻⁶ M, 5 × 10⁻⁷ M, and 1 × 10⁻⁷ M; Table S3: ΔG values for processes of association of dsDNAs FL2–R and FL4–R and for secondary structure formation in FL2 and FL4 in 4 mM Na3C6H5O7; Figure S3: Efficiency of adsorption of T20 on GNPs. (A) The curve of binding of GNPs to the T20 oligonucleotide at 25 °C, (B) magnitude of adsorption of T20 on GNPs at different incubation temperatures; Figure S4: Analyses of the mobility and charge of DNA–GNP associates by agarose gel electrophoresis. An agarose gel image and the analysis of distribution of DNA–GNP associates, as performed by means of GelAnalyzer 19.1 software («www.gelanalyzer.com» (accessed on 20 February 2022), created by Istvan Lazar Jr., Ph.D., and Istvan Lazar Sr., Ph.D., CSc, March 2022); Figure S5: Agarose gel electrophoresis of FL–GNP and R–GNP associates and of their mixtures with each other or with naked GNPs. (A) Incubation for 24 h. (B) Separation of mixtures of FL–GNP and R–GNP associates with naked GNPs immediately after mixing (0 h) and after incubation for 2 or 24 h. Naked GNPs and initial associates FL–GNP and R–GNP were applied to both gels as controls of the mobility and distribution of the associates; Figure S6: Separate adsorption of complementary oligonucleotides FL and R on GNPs (blue background) followed by combining the two types of DNA–GNP associates with each other (step 1 on a green background) or with naked GNPs (step 2 (FL) on a pink background and step 2′ (R) on a gray background). The background level of desorption after a wash of the associates with a 4 mM solution of sodium citrate is indicated as step 3 (FL) and step 3′ (R) on a yellow background. “+” denotes the adsorption of a specified number of DNA molecules, “–” indicates the desorption of a specified number of DNA molecules. Adsorption and desorption of FL are highlighted in red, whereas the adsorption and desorption of R are indicated in black.

Author Contributions

Conceptualization, A.V.E. and D.V.P.; investigation, E.A.G.; methodology, data curation, and funding acquisition, A.V.E.; writing—original draft preparation, A.V.E. and E.A.G.; writing—review and editing, I.A.P. and D.V.P.; formal analysis, supervision, and project administration, I.A.P. All authors have read and agreed to the published version of the manuscript.

Funding

This research was funded by the Russian Science Foundation, grant #23-24-00505.

Data Availability Statement

Raw data are available upon request from the corresponding author.

Acknowledgments

We are greatly thankful to Tatyana Bushueva and Evgeniya Dyudeeva for the synthesis of the oligonucleotides.

Conflicts of Interest

The authors declare no conflict of interest.

References

  1. Ghosh, P.; Han, G.; De, M.; Kim, C.K.; Rotello, V.M. Gold nanoparticles in delivery applications. Adv. Drug Deliv. Rev. 2008, 60, 1307–1315. [Google Scholar] [CrossRef] [PubMed]
  2. Vodyashkin, A.A.; Rizk, M.G.H.; Kezimana, P.; Kirichuk, A.A.; Stanishevskiy, Y.M. Application of Gold Nanoparticle-Based Materials in Cancer Therapy and Diagnostics. ChemEngineering 2021, 5, 69. [Google Scholar] [CrossRef]
  3. Carnerero, J.M.; Jimenez-Ruiz, A.; Castillo, P.M.; Prado-Gotor, R. Covalent and Non-Covalent DNA–Gold-Nanoparticle Interactions: New Avenues of Research. ChemPhysChem 2017, 18, 17–33. [Google Scholar] [CrossRef]
  4. Epanchintseva, A.; Vorobjev, P.; Pyshnyi, D.; Pyshnaya, I. Fast and strong adsorption of native oligonucleotides on citrate-coated gold nanoparticles. Langmuir 2018, 34, 164–172. [Google Scholar] [CrossRef]
  5. Wang, P.; Wang, X.; Wang, L.; Hou, X.; Liu, W.; Chen, C. Interaction of gold nanoparticles with proteins and cells. Sci. Technol. Adv. Mater. 2015, 16, 34610. [Google Scholar] [CrossRef] [Green Version]
  6. Su, S.; Zuo, X.; Pan, D.; Pei, H.; Wang, L.; Fan, C.; Huang, W. Design and applications of gold nanoparticle conjugates by exploiting biomolecule-gold nanoparticle interactions. Nanoscale 2013, 5, 2589–2599. [Google Scholar] [CrossRef]
  7. Cárdenas, M.; Barauskas, J.; Schillén, K.; Brennan, J.L.; Brust, M.; Nylander, T. Thiol-Specific and Nonspecific Interactions between DNA and Gold Nanoparticles. Langmuir 2006, 22, 3294–3299. [Google Scholar] [CrossRef]
  8. Parak, W.J.; Pellegrino, T.; Micheel, C.M.; Gerion, D.; Williams, S.C.; Alivisatos, A.P. Conformation of Oligonucleotides Attached to Gold Nanocrystals Probed by Gel Electrophoresis. Nano Lett. 2003, 3, 33–36. [Google Scholar] [CrossRef]
  9. Parak, W.J.; Gerion, D.; Zanchet, D.; Waerz, A.S.; Micheel, C.; Williams, S.C.; Seitz, M.; Bruehl, R.E.; Bryant, Z.; Bustamante, C.; et al. Conjugation of DNA to silanized colloidal semiconductor nanocrystaline quantum dots. Chem. Mater. 2002, 14, 2113–2119. [Google Scholar] [CrossRef] [Green Version]
  10. Brown, K.A.; Park, S.; Hamad-Schifferli, K. Nucleotide-surface interactions in DNA-modified Au-nanoparticle conjugates: Sequence effects on reactivity and hybridization. J. Phys. Chem. C 2008, 112, 7517–7521. [Google Scholar] [CrossRef]
  11. Fu, C.; Yang, H.; Wang, M.; Xiong, H.; Yu, S. Serum albumin adsorbed on Au nanoparticles: Structural changes over time induced by S–Au interaction. Chem. Commun. 2015, 51, 3634–3636. [Google Scholar] [CrossRef]
  12. Oh, J.H.; Park, D.H.; Joo, J.H.; Lee, J.S. Recent advances in chemical functionalization of nanoparticles with biomolecules for analytical applications. Anal. Bioanal. Chem. 2015, 407, 8627–8645. [Google Scholar] [CrossRef] [PubMed]
  13. Nelson, E.M.; Rothberg, L.J. Kinetics and mechanism of single-stranded DNA adsorption onto citrate-stabilized gold nanoparticles in colloidal solution. Langmuir 2011, 27, 1770–1777. [Google Scholar] [CrossRef]
  14. Epanchintseva, A.V.; Gorbunova, E.A.; Ryabchikova, E.I.; Pyshnaya, I.A.; Pyshnyi, D.V. Effect of Fluorescent Labels on DNA Affinity for Gold Nanoparticles. Nanomaterials 2021, 11, 1178. [Google Scholar] [CrossRef]
  15. Gearheart, L.A.; Ploehn, H.J.; Murphy, C.J. Oligonucleotide adsorption to gold nanoparticles: A surface-enhanced Raman spectroscopy study of intrinsically bent DNA. J. Phys. Chem. B 2001, 105, 12609–12615. [Google Scholar] [CrossRef]
  16. Zhang, R.Y.; Pang, D.W.; Zhang, Z.L.; Yan, J.W.; Yao, J.L.; Tian, Z.Q.; Mao, B.-W.; Sun, S.G. Investigation of ordered ds-DNA monolayers on gold electrodes. J. Phys. Chem. B 2002, 106, 11233–11239. [Google Scholar] [CrossRef]
  17. Loweth, C.J.; Caldwell, W.B.; Peng, X.; Alivisatos, A.P.; Schultz, P.G. DNA-based assembly of gold nanocrystals. Angew. Chem. Int. Ed. 1999, 38, 1808–1812. [Google Scholar] [CrossRef]
  18. Liu, J. Adsorption of DNA onto gold nanoparticles and graphene oxide: Surface science and applications. Phys. Chem. Chem. Phys. 2012, 14, 10485–10496. [Google Scholar] [CrossRef] [PubMed] [Green Version]
  19. Zhao, W.; Lin, L.; Hsing, I.M. Nucleotide-mediated size fractionation of gold nanoparticles in aqueous solutions. Langmuir 2010, 26, 7405–7409. [Google Scholar] [CrossRef]
  20. Sedighi, A.; Li, P.C.; Pekcevik, I.C.; Gates, B.D. A proposed mechanism of the influence of gold nanoparticles on DNA hybridization. ACS Nano 2014, 8, 6765–6777. [Google Scholar] [CrossRef] [Green Version]
  21. Carnerero, J.M.; Jimenez-Ruiz, A.; Grueso, E.M.; Prado-Gotor, R. Understanding and improving aggregated gold nanoparticle/dsDNA interactions by molecular spectroscopy and deconvolution methods. Phys. Chem. Chem. Phys. 2017, 19, 16113–16123. [Google Scholar] [CrossRef]
  22. Schreiner, S.M.; Hatch, A.L.; Shudy, D.F.; Howard, D.R.; Howell, C.; Zhao, J.; Koelsch, P.; Zharnikov, M.; Petrovykh, D.Y.; Opdahl, A. Impact of DNA Surface Interactions on the Stability of DNA Hybrids. Anal. Chem. 2011, 83, 4288–4295. [Google Scholar] [CrossRef] [PubMed]
  23. Vorobjev, P.; Epanchintseva, A.; Lomzov, A.; Tupikin, A.; Kabilov, M.; Pyshnaya, I.; Pyshnyi, D. DNA Binding to Gold Nanoparticles through the Prism of Molecular Selection: Sequence−Affinity Relation. Langmuir 2019, 35, 7916–7928. [Google Scholar] [CrossRef] [PubMed]
  24. Bawazer, L.A.; Newman, A.M.; Gu, Q.; Ibish, A.; Arcila, M.; Cooper, J.B.; Meldrum, F.C.; Morse, D.E. Efficient selection of biomineralizing DNA aptamers using deep sequencing and population clustering. ACS Nano 2014, 8, 387–395. [Google Scholar] [CrossRef] [PubMed]
  25. Niu, L.M.; Liu, Y.; Lian, K.Q.; Ma, L.; Kang, W.J. Characterization of a sensitive biosensor based on an unmodified DNA and gold nanoparticle composite and its application in diquat determination. Arabian J. Chem. 2015, 11, 655–661. [Google Scholar] [CrossRef] [Green Version]
  26. Zou, J. Study of Interactions between DNA and Gold Nanoparticles for Biosensor Applications. Ph.D. Thesis, The University of Miami, Coral Gables, FL, USA, 31 July 2013. [Google Scholar]
  27. Mohammed, A.S.; Nagarjuna, R.; Khaja, M.N.; Ganesan, R.; Ray Dutta, J. Effects of free patchy ends in ssDNA and dsDNA on gold nanoparticles in a colorimetric gene sensor for Hepatitis C virus RNA. Microchim. Acta 2019, 186, 1–11. [Google Scholar] [CrossRef]
  28. Zare, N.; Ghasemi, R.; Rafiee, L.; Javanmard, S.H. Assessment of microRNA-21 using gold nanoparticle-DNA conjugates based on colorimetric and fluorescent detection. Gold Bull. 2022, 55, 107–114. [Google Scholar] [CrossRef]
  29. Tripathi, A.; Jainb, R.; Dandekar, P. Rapid visual detection of Mycobacterium tuberculosis DNA using gold nanoparticles. Anal. Methods 2023, 15, 2497–2504. [Google Scholar] [CrossRef]
  30. Gu, D.; Qiao, Y.; Fu, H.; Zhao, H.; Yue, X.; Wang, S.; Yin, Y.; Xi, R.; Fu, X.; Zhao, X.; et al. Size-Controllable DNA Origami-Stacked Gold Nanoparticles for Deep Tumor-Penetrating Therapy. ACS Appl. Mater. Interfaces 2022, 14, 38048–38055. [Google Scholar] [CrossRef]
  31. Storhoff, J.J.; Elghanian, R.; Mucic, R.C.; Mirkin, C.A.; Letsinger, R.L. One-Pot Colorimetric Differentiation of Polynucleotides with Single Base Imperfections Using Gold Nanoparticle Probes. J. Am. Chem. Soc. 1998, 120, 1959–1964. [Google Scholar] [CrossRef]
  32. SantaLucia, J.; Allawi, H.T.; Seneviratne, P.A. Improved nearest-neighbor parameters for predicting DNA duplex stability. Biochemistry 1996, 35, 3555–3562. [Google Scholar] [CrossRef] [PubMed]
  33. SantaLucia, J. A unified view of polymer, dumbbell, and oligonucleotide DNA nearest-neighbor thermodynamics. Proc. Natl. Acad. Sci. USA 1998, 95, 1460–1465. [Google Scholar] [CrossRef] [Green Version]
  34. Allawi, H.T.; SantaLucia, J., Jr. Thermodynamics and NMR of internal G.T mismatches in DNA. Biochemistry 1997, 36, 10581–10594. [Google Scholar] [CrossRef] [Green Version]
  35. Gray, D.M. Derivation of nearest-neighbor properties from data on nucleic acid oligomers. II. Thermodynamic parameters of DNA.RNA hybrids and DNA duplexes. Biopolymers 1997, 42, 795–810. [Google Scholar] [CrossRef]
  36. Tm for Oligos Calculator. Available online: https://worldwide.promega.com/resources/tools/biomath/tm-calculator/ (accessed on 1 December 2021).
  37. Zhang, X.; Servos, M.R.; Liu, J. Surface science of DNA adsorption onto citrate-capped gold nanoparticles. Langmuir 2012, 28, 3896–3902. [Google Scholar] [CrossRef] [Green Version]
  38. RNAstructure–Mathews Lab. Available online: https://rna.urmc.rochester.edu/RNAstructureWeb/Servers/Predict1/Predict1.html (accessed on 1 December 2021).
  39. Li, H.; Rothberg, L. Colorimetric detection of DNA sequences based on electrostatic interactions with unmodified gold nanoparticles. Proc. Natl. Acad. Sci. USA 2004, 101, 14036–14039. [Google Scholar] [CrossRef] [Green Version]
  40. Poletaeva, J.; Dovydenko, I.; Epanchintseva, A.; Korchagina, K.; Pyshnyi, D.; Apartsin, E.; Ryabchikova, E.; Pyshnaya, I. Non-Covalent Associates of siRNAs and AuNPs Enveloped with Lipid Layer and Doped with Amphiphilic Peptide for Efficient siRNA Delivery. Int. J. Mol. Sci. 2018, 19, 2096. [Google Scholar] [CrossRef] [PubMed] [Green Version]
  41. Perfilieva, O.A.; Pyshnyi, D.V.; Lomzov, A.A. Molecular Dynamics Simulation of Polarizable Gold Na-noparticles Interacting with Sodium Citrate. J. Chem. Theory Comput. 2019, 15, 1278–1292. [Google Scholar] [CrossRef]
  42. Oligo Calc: Oligonucleotide Properties Calculator. Available online: http://biotools.nubic.northwestern.edu/OligoCalc.html (accessed on 5 March 2022).
  43. Li, H.; Rothberg, L.J. Label-free colorimetric detection of specific sequences in genomic DNA amplified by the polymerase chain reaction. J. Am. Chem. Soc. 2004, 126, 10958–10961. [Google Scholar] [CrossRef]
  44. Yao, G.; Pei, H.; Li, J.; Zhao, Y.; Zhu, D.; Zhang, Y.; Lin, Y.; Huang, Q.; Fan, C. Clicking DNA to gold nanoparticles: Poly-adenine-mediated formation of monovalent DNA-gold nanoparticle conjugates with nearly quantitative yield. NPG Asia Mater. 2015, 7, e159. [Google Scholar] [CrossRef] [Green Version]
  45. Zhang, X.; Liu, B.; Dave, N.; Servos, M.R.; Liu, J. Instantaneous Attachment of an Ultrahigh Density of Nonthiolated DNA to Gold Nanoparticles and Its Applications. Langmuir 2012, 28, 17053–17060. [Google Scholar] [CrossRef] [PubMed] [Green Version]
  46. Chen, N.; Wei, M.; Sun, Y.; Li, F.; Pei, H.; Li, X.; Su, S.; He, Y.; Wang, L.; Shi, J.; et al. Self-Assembly of Poly-Adenine-Tailed CpG Oligonucleotide-Gold Nanoparticle Nanoconjugates with Immunostimulatory Activity. Small 2014, 10, 368–375. [Google Scholar] [CrossRef]
  47. Pei, H.; Li, F.; Wan, Y.; Wei, M.; Liu, H.; Su, Y.; Chen, N.; Huang, Q.; Fan, C. Designed Diblock Oligonucleotide for the Synthesis of Spatially Isolated and Highly Hybridizable Functionalization of DNA−Gold Nanoparticle Nanoconjugates. J. Am. Chem. Soc. 2012, 134, 11876–11879. [Google Scholar] [CrossRef]
  48. Pyshnyi, D.V.; Lomzov, A.A.; Pyshnaya, I.A.; Ivanova, E.M. Hybridization of the Bridged Oligonucleotides with DNA: Thermodynamic and Kinetic Studies. J. Biomol. Struct. Dyn. 2006, 23, 567–579. [Google Scholar] [CrossRef] [PubMed]
  49. Sandström, P.; Åkerman, B. Electrophoretic properties of DNA-modified colloidal gold nanoparticles. Langmuir 2004, 20, 4182–4186. [Google Scholar] [CrossRef]
  50. Sandström, P.; Boncheva, M.; Åkerman, B. Nonspecific and thiol-specific binding of DNA to gold nanoparticles. Langmuir 2003, 19, 7537–7543. [Google Scholar] [CrossRef]
  51. Liu, Z.; Hettihewa, M.; Shu, Y.; Zhou, C.; Wan, Q.; Liu, L. The mechanism of the adsorption of dsDNA on citrate-stabilized gold nanoparticles and a colorimetric and visual method for detecting the V600E point mutation of the BRAF gene. Microchim. Acta 2018, 185, 240. [Google Scholar] [CrossRef]
Figure 1. Schematic representation of DNAs used in the work, where F is 5′-CTAACTAACGTCATCATATC-3′, and R is 5′-GATATGATGACGTTAGTTAG-3′. The “main” DNA regions are highlighted in gray or black. The red, blue, and green colors indicate the “anchor” DNA regions.
Applsci 13 07324 g001
Figure 2. Adsorption capacity of GNPs for ssDNAs. Curves of saturation of GNPs by radiolabeled ssDNAs (A), and a typical plot for KL determination in GraphPad Prism (B).
Applsci 13 07324 g002
Figure 4. Curves of saturation of GNPs with dsDNA at 25 °C incubation temperature: F–R (A), FL–R (B), FL2–R (C), FL4–R (D), FT–R (E), FT2–R (F), FT4–R (G). * Radioactively labeled ssDNA.
Applsci 13 07324 g004
Figure 6. Mobility and charge analysis (agarose gel electrophoresis) of DNA–GNP associates obtained at 25 °C. A scanned image of an agarose gel (left) and its autoradiograph (right) for FT–GNP associates differing in the capacity of one GNP for ssDNA. The black frames indicate the distribution of the upper (top) and lower (bottom) fractions of FT–GNP associates on a gel lane. The boundary between them is indicated by a blue dotted line. The arrow shows the direction of the electric current.
Applsci 13 07324 g006
Figure 7. Scans of agarose gels and analysis (in GelAnalyzer 19.1 software, «www.gelanalyzer.com» (accessed on 20 February 2022), created by Istvan Lazar Jr., Ph.D., and Istvan Lazar Sr., Ph.D., CSc, March 2022) of the distribution of FL/GNP associates (A) and of FL–R–GNP associates. T: associate incubation temperature, [DNA]: concentration of ssDNA, Charge: the number of internucleotide phosphate groups. Rows FL*/GNP, R*/GNP, FL*–R/GNP, and FL–R*/GNP: capacity of GNPs for respective associates; % (top) and % (bottom): the proportion of the upper and lower fractions of associates of GNPs with DNA. The arrow indicates the highest electrophoretic mobility of DNA/GNP associates (B).
Applsci 13 07324 g007
Figure 8. Agarose gel electrophoresis of T20/GNP associates and their mixtures with naked GNPs immediately after the mixing (0 h) and after incubation for 24 h. A gel scan (A) and a gel autoradiograph (B). Naked GNPs and initial T20/GNP associates were applied to the gel as controls for the mobility and distribution of the associates.
Applsci 13 07324 g008
Figure 9. Schematic representation of the competitive processes of formation of inter- and/or intramolecular structures by oligonucleotides R and FLn (where n = 0, 1, 2, or 4) and their association with GNPs at different molar ratios (the capacity of GNPs is denoted as k, m, z, l, and i) in a single-stranded, double-stranded, or internally structured conformation. The orange background highlights these processes involving R, the gray background indicates the processes involving FLn, the yellow color highlights the formation of the FLn–R duplex, and the green background shows processes involving the FLn–R duplex and GNPs. Index h denotes an internally structured (hairpin) conformation of oligonucleotides R or FLn. Dashed lines show some possible competitive processes.
Applsci 13 07324 g009
Table 1. Sequences of single-stranded oligonucleotides (ssDNAs).
CodeSequence 5′ → 3′
T205′-TTT-TTT-TTT-TTT-TTT-TTT-TT-3′
RGATATGATGACGTTAGTTAG
FCTAACTAACGTCATCATATC
“Anchor” DNAs of L-series
FLGATATGATGACGTTAGTTAG-TTGTTG
FL2GATATGATGACGTTAGTTAG-TTGTTG-TTGTTG
FL4GATATGATGACGTTAGTTAG-TTGTTG-TTGTTG-TTGTTG-TTGTTG
“Anchor” DNAs of T-series
FTCTAACTAACGTCATCATATC-TTTTTT
FT2CTAACTAACGTCATCATATC-TTTTTT-TTTTTT
FT4CTAACTAACGTCATCATATC-TTTTTT-TTTTTT-TTTTTT-TTTTTT
Table 2. Parameters of adsorption of ssDNAs on GNPs, as determined by the autoradiographic method.
RFFLFL2FL4FTFT2FT4
Capacity, largest number of DNA molecules per GNP29 ± 336 ± 356 ± 238 ± 417 ± 253 ± 328 ± 518 ± 4
Capacity in terms of anchor nucleotides per GNP--336 ± 12384 ± 48408 ± 48318 ± 18336 ± 60432 ± 96
KL, pM−177 ± 1176 ± 1049 ± 680 ± 12119 ± 2352 ± 972 ± 12149 ± 22
R2 (p < 0.05)0.9450.9470.9490.9280.9070.9210.9310.943
Table 3. The rating of the analyzed DNAs by affinity per nucleotide.
L SeriesT Series
FFLFL2FL4FTFT2FT4
5.0 × 10−511.3 × 10−530.0 × 10−552.1 × 10−51.4 × 10−5−8.1 × 10⁻⁵−19.0 × 10⁻⁵
Table 4. Capacity of GNPs for oligonucleotides as part of dsDNA, in molecules per GNP, at 25 °C.
Initial dsDNA (Blunt-Ended)dsDNAs Containing Single-Stranded Overhangs Based On
L MotifT Motif
F*–RFL*–RFL2*–RFL4*–RFT*–RFT2*–RFT4*–R
20 ± 239 ± 220 ± 118 ± 233 ± 220 ± 214 ± 1
F–R*FL–R*FL2–R*FL4–R*FT–R*FT2–R*FT4–R*
16 ± 113 ± 113 ± 26 ± 113 ± 116 ± 211 ± 2
* denotes radioactively labeled DNA.
Disclaimer/Publisher’s Note: The statements, opinions and data contained in all publications are solely those of the individual author(s) and contributor(s) and not of MDPI and/or the editor(s). MDPI and/or the editor(s) disclaim responsibility for any injury to people or property resulting from any ideas, methods, instructions or products referred to in the content.

