Article

Wheat Transformation with ScTPS1-TPS2 Bifunctional Enzyme for Trehalose Biosynthesis Protects Photosynthesis during Drought Stress

by
Andrea Romero-Reyes
1,†,
Juan Pablo Valenzuela-Avendaño
1,†,
Ciria G. Figueroa-Soto
1,
José O. Mascorro-Gallardo
2,
Gabriel Iturriaga
3,
Alejandro Castellanos-Villegas
4,
Marisela Rivera-Domínguez
1 and
Elisa M. Valenzuela-Soto
1,*
1
Centro de Investigación en Alimentación y Desarrollo A.C., Hermosillo 83304, Sonora, Mexico
2
Departamento de Fitotecnia, Universidad Autónoma Chapingo, Km 38.5 Carretera México-Texcoco, Texcoco 56230, Mexico, Mexico
3
Tecnológico Nacional de México/Campus Roque, Km 8 Carretera Celaya-Juventino Rosas, Roque Celaya, Guanajuato 38110, Guanajuato, Mexico
4
Departamento de Investigaciones Científicas y Tecnológicas, Universidad de Sonora, Reforma y L.D. Colosio, Hermosillo 83000, Sonora, Mexico
*
Author to whom correspondence should be addressed.
These authors contributed equally to this work.
Appl. Sci. 2023, 13(12), 7267; https://doi.org/10.3390/app13127267
Submission received: 31 March 2023 / Revised: 30 May 2023 / Accepted: 8 June 2023 / Published: 18 June 2023
(This article belongs to the Special Issue Crop Production and Regulation under Environmental Stress)

Abstract

:
Wheat cultivation makes an important contribution to human nutrition. Trehalose synthesis plays a role in the tolerance to drought stress. A bifunctional TPS-TPP enzyme gene from yeast was used to obtain transgenic wheat plants to increase trehalose synthesis. Mature wheat embryos were transformed using pGreen rd29A::TPS1-TPS2 or pGreen 35S::TPS1-TPS2 constructs. The transgene presence in mature leaves of T3 plants was confirmed by sequencing a PCR fragment of the inserted transgene. Transgenic and NT plants were submitted to drought stress for eight days. Transformed wheat lines retained a higher relative water content than NT plants during drought stress, and the Rubisco activity was unaffected. Plants transformed with the 35S construct showed a lower photosynthetic rate and lower fructose 1–6-bisphosphatase (FBPase) activity during drought, suggesting that constitutive trehalose and sucrose synthesis caused a reduced ribulose 1,5-bisphosphate (RuBP) regeneration. Lines transformed with the rd29A promoter showed a higher photosynthetic rate after eight days of drought, as the RuBP regeneration was unaffected. Transgenic wheat plants had higher biomass and grain weight than NT plants after drought. These results suggest that trehalose synthesis improves photosynthesis during stress and induces changes in the activity of some Calvin-cycle enzymes, reflected in plant metabolism and growth.

1. Introduction

The growth of the world population has increased the demand for wheat for use in the food industry. However, drought periods have affected wheat production in many countries, and lower production is expected in the future due to climate change [1,2].
The disaccharide trehalose (α-D-glucopyranosyl, α-D-glucopyranoside), a non-reducing sugar, is broadly distributed in nature. Many organisms synthesize trehalose, including bacteria, yeast, resurrection plants, and some vertebrates [2,3,4,5]. In plants and yeast, trehalose’s main biosynthesis pathway consists of two steps. The first step is the linkage of uridine diphosphate glucose and glucose 6-phosphate to produce trehalose 6-phosphate, a reaction catalyzed by trehalose 6-phosphate synthase (TPS, EC 2.4.1.15). In the second step, the trehalose phosphate phosphatase (TPP, EC 3.1.3.12) dephosphorylates trehalose 6-phosphate, generating trehalose [6]. Several studies have demonstrated that trehalose plays an essential role in the plant response to abiotic stress [7,8,9,10,11,12]. Despite having many copies of the tps and tpp genes, higher plants do not accumulate trehalose; nonetheless, the gene expressions of plant TPS and TPP are induced by abiotic stress, such as salt and drought stress [13,14,15].
Some studies have shown that the induction of trehalose synthesis in plants by inserting genes for TPS and TPP enzymes can affect plant metabolism and physiology differently. For example, several studies found that the overexpression of microbial TPS boosts tolerance against abiotic stress [10,16,17,18], while others have reported disturbances in plant growth and morphology [17,18,19]. This effect can be attributed to increased levels of T6P, a key metabolite in sugar metabolism regulation [20,21]. Nonetheless, improved photosynthesis was found in tobacco and tomato caused by the overexpression of a TPS1 gene from Saccharomyces cerevisiae, as it increased the chlorophyll and starch content [17,18].
Miranda et al. (2007) [22] synthesized a bifunctional TPS-TPP enzyme from the fusion of S. cerevisiae TPS1 and TPS2 genes. This bifunctional enzyme prevents T6P accumulation in Arabidopsis thaliana, generating abiotic-stress-tolerant plants without morphological alterations [22]. The overexpression of a similar fusion TPSP gene from Escherichia coli induced a higher photosynthetic rate during abiotic stress in rice and tomatoes [10,16]. Although an increased trehalose synthesis leads to improved photosynthetic performance under abiotic stress, little is known about how sugar synthesis in the Calvin cycle is affected by the modification of trehalose metabolism in plants. For example, in tobacco plants, the overexpression of a TPS gene from E. coli increased the Rubisco activity, but no changes in the activity of other Calvin-cycle enzymes were found [23]. In this work, we transformed wheat plants for the overexpression of a bifunctional TPS-TPP enzyme to evaluate the changes in photosynthesis, activity of the Calvin cycle, and sugar synthesis enzymes in plants subjected to drought stress.

2. Materials and Methods

2.1. Plant Material and Growth Conditions

Wheat (Triticum aestivum L.) var. Kronstad F2004 was transformed using Agrobacterium tumefaciens-mediated transformation with two different constructs: pGreen rd29A::TPS1-TPS2 or pGreen 35S::TPS1-TPS2, using the stress-inducible rd29A promoter and the CaMV35S promoter for the constitutive expression of the transgene, respectively [22,24,25]. These two constructs include the bar gene for phosphinothricin (PPT) selection. Mature wheat embryos were extracted from the seeds under aseptic conditions using a scalpel blade and were cut longitudinally and transversely. Embryos were placed on CM4C semi-solid medium (pH 5.8 with 0.5 mg/L 2,4-D, 200 μM acetosyringone, and 2.4 mg/L picloram), individually inoculated with 10 μL of active A. tumefaciens LBA-4404 culture and incubated for 5 days in darkness at 26 °C. To remove the bacteria, embryos were washed 3 times with a washing solution (1.95 g/L MES; 100 mg/L ascorbic acid; 150 mg/L citric acid; 40 g/L maltose; 110 g/L sucrose; 0.02% Tween 20; 100 mg/L ascorbic acid; 150 mg/L citric acid; pH 5.8) for 15 min at 26 °C with mild stirring. Later, embryos were washed for 1 h with a solution containing 300 mg/L cefotaxime, 200 mg/L meropenem, and 10% PPM (plant preservative mixture). Sterile filter paper was used to remove the excess solution.
Infected embryos were cultivated in CM4C semi-solid medium (pH 5.8 with 0.5 mg/L 2,4-D; 2.4 mg/L picloram; 750 µL/L PPM; 100 mg ascorbic acid; 150 mg citric acid; 50 mg meropenem; and 100 mg cefotaxime) for four weeks at 26 °C in darkness until the embryogenic calli were generated. Subsequently, the calli were transferred to MMSOC-2 media (4.4 g/L MS salts; 40 g/L maltose; 100 mg/L hydrolyzed casein; 1.95 g/L MES; 0.2 mg/L 2,4-D; 2.4 mg/L picloram; 750 µL/L PPM; 100 mg ascorbic acid; 150 mg citric acid; 50 mg meropenem; 100 mg cefotaxime; 3 mg/L PPT; 7 g/L agar; pH 5.8) for two weeks in darkness at 26 °C. After that, the calli were incubated on MMSOC media (3 g/L MS salts; 40 g/L maltose; 100 mg/L hydrolyzed casein; 1.95 g/L MES; 750 µL/L PPM; 100 mg/L ascorbic acid; 150 mg/L citric acid; 50 mg meropenem; 100 mg cefotaxime; 3 mg/L PPT; 7 g/L agar; pH 5.6) for 4 additional weeks under a 16 h light/8 h darkness photoperiod at 26 °C. Surviving root-forming plantlets (T0 generation) were transferred to pots and tested to PPT resistance. The transgenic plants were grown to maturity in a greenhouse.
Non-transformed and transgenic wheat seeds were placed in Petri dishes with filter paper sown in sterile water to induce germination. After root emergence, seedlings were exposed to light to promote photosynthetic activity. Once the first leaf was developed, plants were transferred to pots filled with a mixture of soil and peat moss (1:1) in greenhouse conditions at temperatures of 20–25 °C during the day and 10–15 °C at night, with constant watering.

2.2. PCR Analysis

Plants from the T3 generation were grown, and after 30 days, leaves from lines 3A, 5A, and 6B 35S::TPS1-TPS2 and 1A, 1B, 1C, and 6B rd29A::TPS1-TPS2 were used to analyze the inserted T-DNA. The PCR reaction was performed using genomic DNA isolated from transformed leaves (200 mg). In the first reaction, 200 ng DNA was used as template, and the primers 5′-GTTCCTGCAGAGACCATTCCC-3′ and 5′-CGTCAGTGAAGTCATCACCC-3′ were used to amplify an internal 1800 bp fragment of the ScTPS1-TPS2 construct (Figure 1a). The reaction conditions were one cycle at 94 °C for 3 min; 40 cycles of 94 °C for 30 s; 55 °C for 2 min; 72 °C for 1 min; and a final extension of 72 °C for 3 min. In the second reaction, a 1:500 dilution of the first reaction product was used as template, and oligonucleotides 5′-CTGTGGTCAATGAGTTGGTC-3′ and 5′-CTACGCTTAGCCTGCTTGTAG-3′ were used to amplify an internal 680 bp fragment of the ScTPS1-TPS2 construct (Figure 1a). Reaction conditions were one cycle at 94 °C for 3 min; 40 cycles of 94 °C for 30 s; 57 °C for 1 min; 72 °C for 1 min; and a final extension of 72 °C for 3 min. Taq DNA polymerase (Roche Applied Science, Mannheim, Germany) was used for the PCR analysis.

2.3. Drought Stress Treatment

A completely randomized design was applied for this experiment. A total of 105 plants from each line were grown in the greenhouse and distributed in groups of 20 plants for each stress treatment, and 5 plants per line were used as the non-stressed control for the biomass analysis. Seven weeks after seed germination, wheat plants were subjected to drought by suspending irrigation. A garden soil moisture sensor was used for measuring soil moisture in pots. Drought was considered once soil reached a moisture level of 30%.

2.4. Relative Water Content

Relative water content (RWC) measurements were carried out by cutting wheat leaf discs (0.5 cm). Later, they were weighed (fresh weight) and placed in a Petri dish containing strips of wet polyurethane foam for 12 h (rehydration period). At the end of the period, tissue was weighed (saturated weight) and dried in an oven at 40 °C until constant weight (dry weight). The RWC was calculated with the following formula:
RWC = (fresh weight − dry weight/saturated weight − dry weight) × 100
Each measurement was performed in triplicate [26].

2.5. Gas Exchange Measurements

Photosynthetic rate (A), intercellular CO2 content (Ci), and transpiration rate (E) were obtained using an LI-6400 instrument (LI-COR, Lincoln, NE, USA). Photosynthetic parameter measuring began at 9:00 am on each day of the drought treatment.

2.6. Enzymatic Extract Preparation

Crude extracts were prepared using 1 g of leaf tissue pulverized with liquid nitrogen and immediately homogenized in 3 mL of extraction buffer (50 mM Tris-HCl; pH 8; 1 mM EDTA; 1 mM MgCl2; 12.5% glycerol; 10 mM ß-mercaptoethanol; and 10% PVP), followed by centrifugation at 10,900× g for 20 min at 4 °C (Thermo Scientific SL16R, Langselbold, Germany). The supernatant was transferred to another tube and centrifugated a second time (10,900× g for 20 min at 4 °C). The supernatant thereby obtained was stored at −80 °C until enzymatic activity analysis.

2.7. Enzyme Activity Assays

Rubisco activity was measured according to Li et al. (2016) [27], with some modifications. Rubisco was activated by adding enzyme extract to an activation mixture containing 33 mM Tris-HCl, pH 7.5 buffer, 0.67 mM EDTA, 33 mM MgCl2, and 10 mM NaHCO3 in a final volume of 100 µL. The mixture was incubated at 25 °C for 30 min. Then, the Rubisco activity was measured spectrophotometrically. The reaction mixture contained 5 mM HEPES; pH 8; 2 mM MgCl2; 0.1 mM EDTA; 0.25 mM DTT; 0.5 mM ATP; 0.5 phosphocreatine; 0.06 mM RuBP; 1 U creatine phosphokinase; 1 U 3-phosphoglycerate phosphokinase; 1 U glyceraldehyde-3-phosphate dehydrogenase; 1 mM NaHCO3; and 0.015 mM NADH, in a final volume of 500 µL. The reaction was started by adding previously activated extract. NADH oxidation was followed by the changes in absorbance at 340 nm for 3 min using a Cary 50 spectrophotometer (Varian, Victoria, Australia).
Chloroplastic fructose biphosphatase activity was assayed as described in Zimmermann et al. (1976) [28]. Enzymatic activity of sucrose phosphate synthase was measured according to Huber (1981) [29].

2.8. Protein Quantification

Protein content in enzymatic extracts was measured according to Bradford (1976) [30].

2.9. Sugar Content Analysis

For carbohydrate quantification, 750 mg of leaf tissue was pulverized using liquid nitrogen. The powder obtained was transferred to tubes with 3.75 mL of 80% ethanol. Samples were homogenized and incubated at 50 °C for 24 h. The tubes were then centrifuged at 10,900× g for 15 min, and the supernatant was transferred to another tube for a second centrifugation (10,900× g for 15 min). The volume of the supernatant obtained was adjusted to 3 mL with 80% ethanol. Carbohydrate content was measured by HPLC using a Dionex-CarboPac PA10 (4 × 50 mm) pre-column and a Dionex-CarboPac PA10 (4 × 250 mm) column (Thermo Fisher Scientific, Sunny Valley, ID, USA). Water was used as mobile phase with a 1 mL/min flux. Sucrose and trehalose content were calculated based on a calibration curve made with commercial standards.

2.10. Statistical Analysis

For data analysis, once its goodness of fit to normal was verified using the Kolmogorov test, an analysis of variance by linear models (ANOVA GLM) was performed for a completely randomized design, adjusting the treatments as the main factor (transformed and non-transformed wheat lines). The ANOVA was performed for each time of exposure to drought, and significant differences between days of treatment were identified using a Tukey–Kramer test (p ≤ 0.05). Student’s t-test at p < 0.05 (*) was used to evaluate significant variations in aerial biomass and grain weight between non-stressed and stressed plants. The analysis was performed using the NCSS, 2021, and GraphPad Prism 8 software.

3. Results

3.1. Plant Transformation and Selection

The transgene presence in the mature leaves of T3 plants was confirmed by PCR, and by sequencing a 680 bp long PCR fragment product. This fragment corresponds to a specific internal sequence of the ScTPS1-TPS2 construct (Figure 1b), as described in Section 2. The presence of the transgene was confirmed in samples from 35S-2 plants (line 35S) and the lines rd-1B and rd-1C (Figure 1b). These three transgenic wheat lines were selected to continue with the drought stress experiment.

3.2. Relative Water Content during Drought

Drought stress was induced in seven-week-old wheat plants. Well-watered wheat plants had a leaf RWC between 84 and 94% (Table 1). Once irrigation was suspended, the pots reached a soil humidity of 30% after five days of water withdrawal, and drought stress was considered at this point. After two days of drought, the WT and 35S plants significantly reduced their RWC (Table 1). In the RD transgenic lines, the leaf RWC did not diminish considerably until day four of drought in line rd-1B, nor until day six in the rd-1C line (Table 1). At the highest degree of drought (day 8), the mean value of RWC was more elevated in the transgenic plants compared to the NT wheat. On the eighth day of drought, the RWC in the WT plants was 63.1%, whereas in the transgenic lines, it was 70.7% in 35S, 67.9% in rd-1B, and 65.6% in rd-1C (Table 1).

3.3. Photosynthetic Parameters

The photosynthetic rate (A) in the NT plants was not affected (p ≥ 0.05) for the first four days of the drought stress, and it had its lowest (p ≤ 0.05) value on day six of drought (Figure 2a). Photosynthesis recovered (p ≤ 0.05) in the NT plants on day eight of stress (Figure 2a). Transgenic plants from the 35S line had a decrease (p ≤ 0.05) in their photosynthetic activity on day six of drought, which remained unchanged by the end of the treatment (Figure 2a). Transgenic wheat transformed with the stress-inducible rd29A promoter maintained a stable photosynthesis during the drought treatment (Figure 2a). In the rd-1B plants, despite some variations in the mean value, the photosynthetic rate did not decrease when drought stress was applied (Figure 2a), whereas in the rd-1C plants, photosynthesis had no significant changes during drought stress (Figure 2a).
The intercellular CO2 (Ci) in NT wheat plants had no significant changes during drought stress. In the 35S line, the Ci varied from day zero to day six, and it had its lowest (p ≤ 0.05) value by the end of the drought treatment (Figure 2b). The transgenic rd-1B plants had a decrease (p ≤ 0.05) in their Ci at day four of drought and remained unchanged (p ≥ 0.05) by the end of the treatment (Figure 2b). In the rd-1C plants, the mean Ci value had some variations throughout the drought experiment, but the differences were not significant (Figure 2b).
No effect (p ≥ 0.05) was detected in the transpiration rate (E) of the NT wheat plants for the first four days of drought, but it decreased (p ≤ 0.05) on day six (Figure 2c). On the eighth day of drought, the E in the NT plants was more than 50% lower (p ≤ 0.05) than in non-stressed plants (Figure 2c). The transgenic 35S line had no changes (p ≥ 0.05) in the E from day zero to day six of drought (Figure 2c). However, the E in the 35S plants was significantly decreased by day eight (Figure 2c). In rd-1B wheat plants, an increased (p≤ 0.05) E was detected on days two and four of drought (Figure 2c). When drought stress increased on days six and eight, the E in the rd-1B plants was not different (p ≥ 0.05), as in non-stressed plants (Figure 2c). Transpiration in the transgenic line rd-1C varied throughout the drought stress, but no significant differences (p ≥ 0.05) were found between non-stressed and stressed plants (Figure 2c).

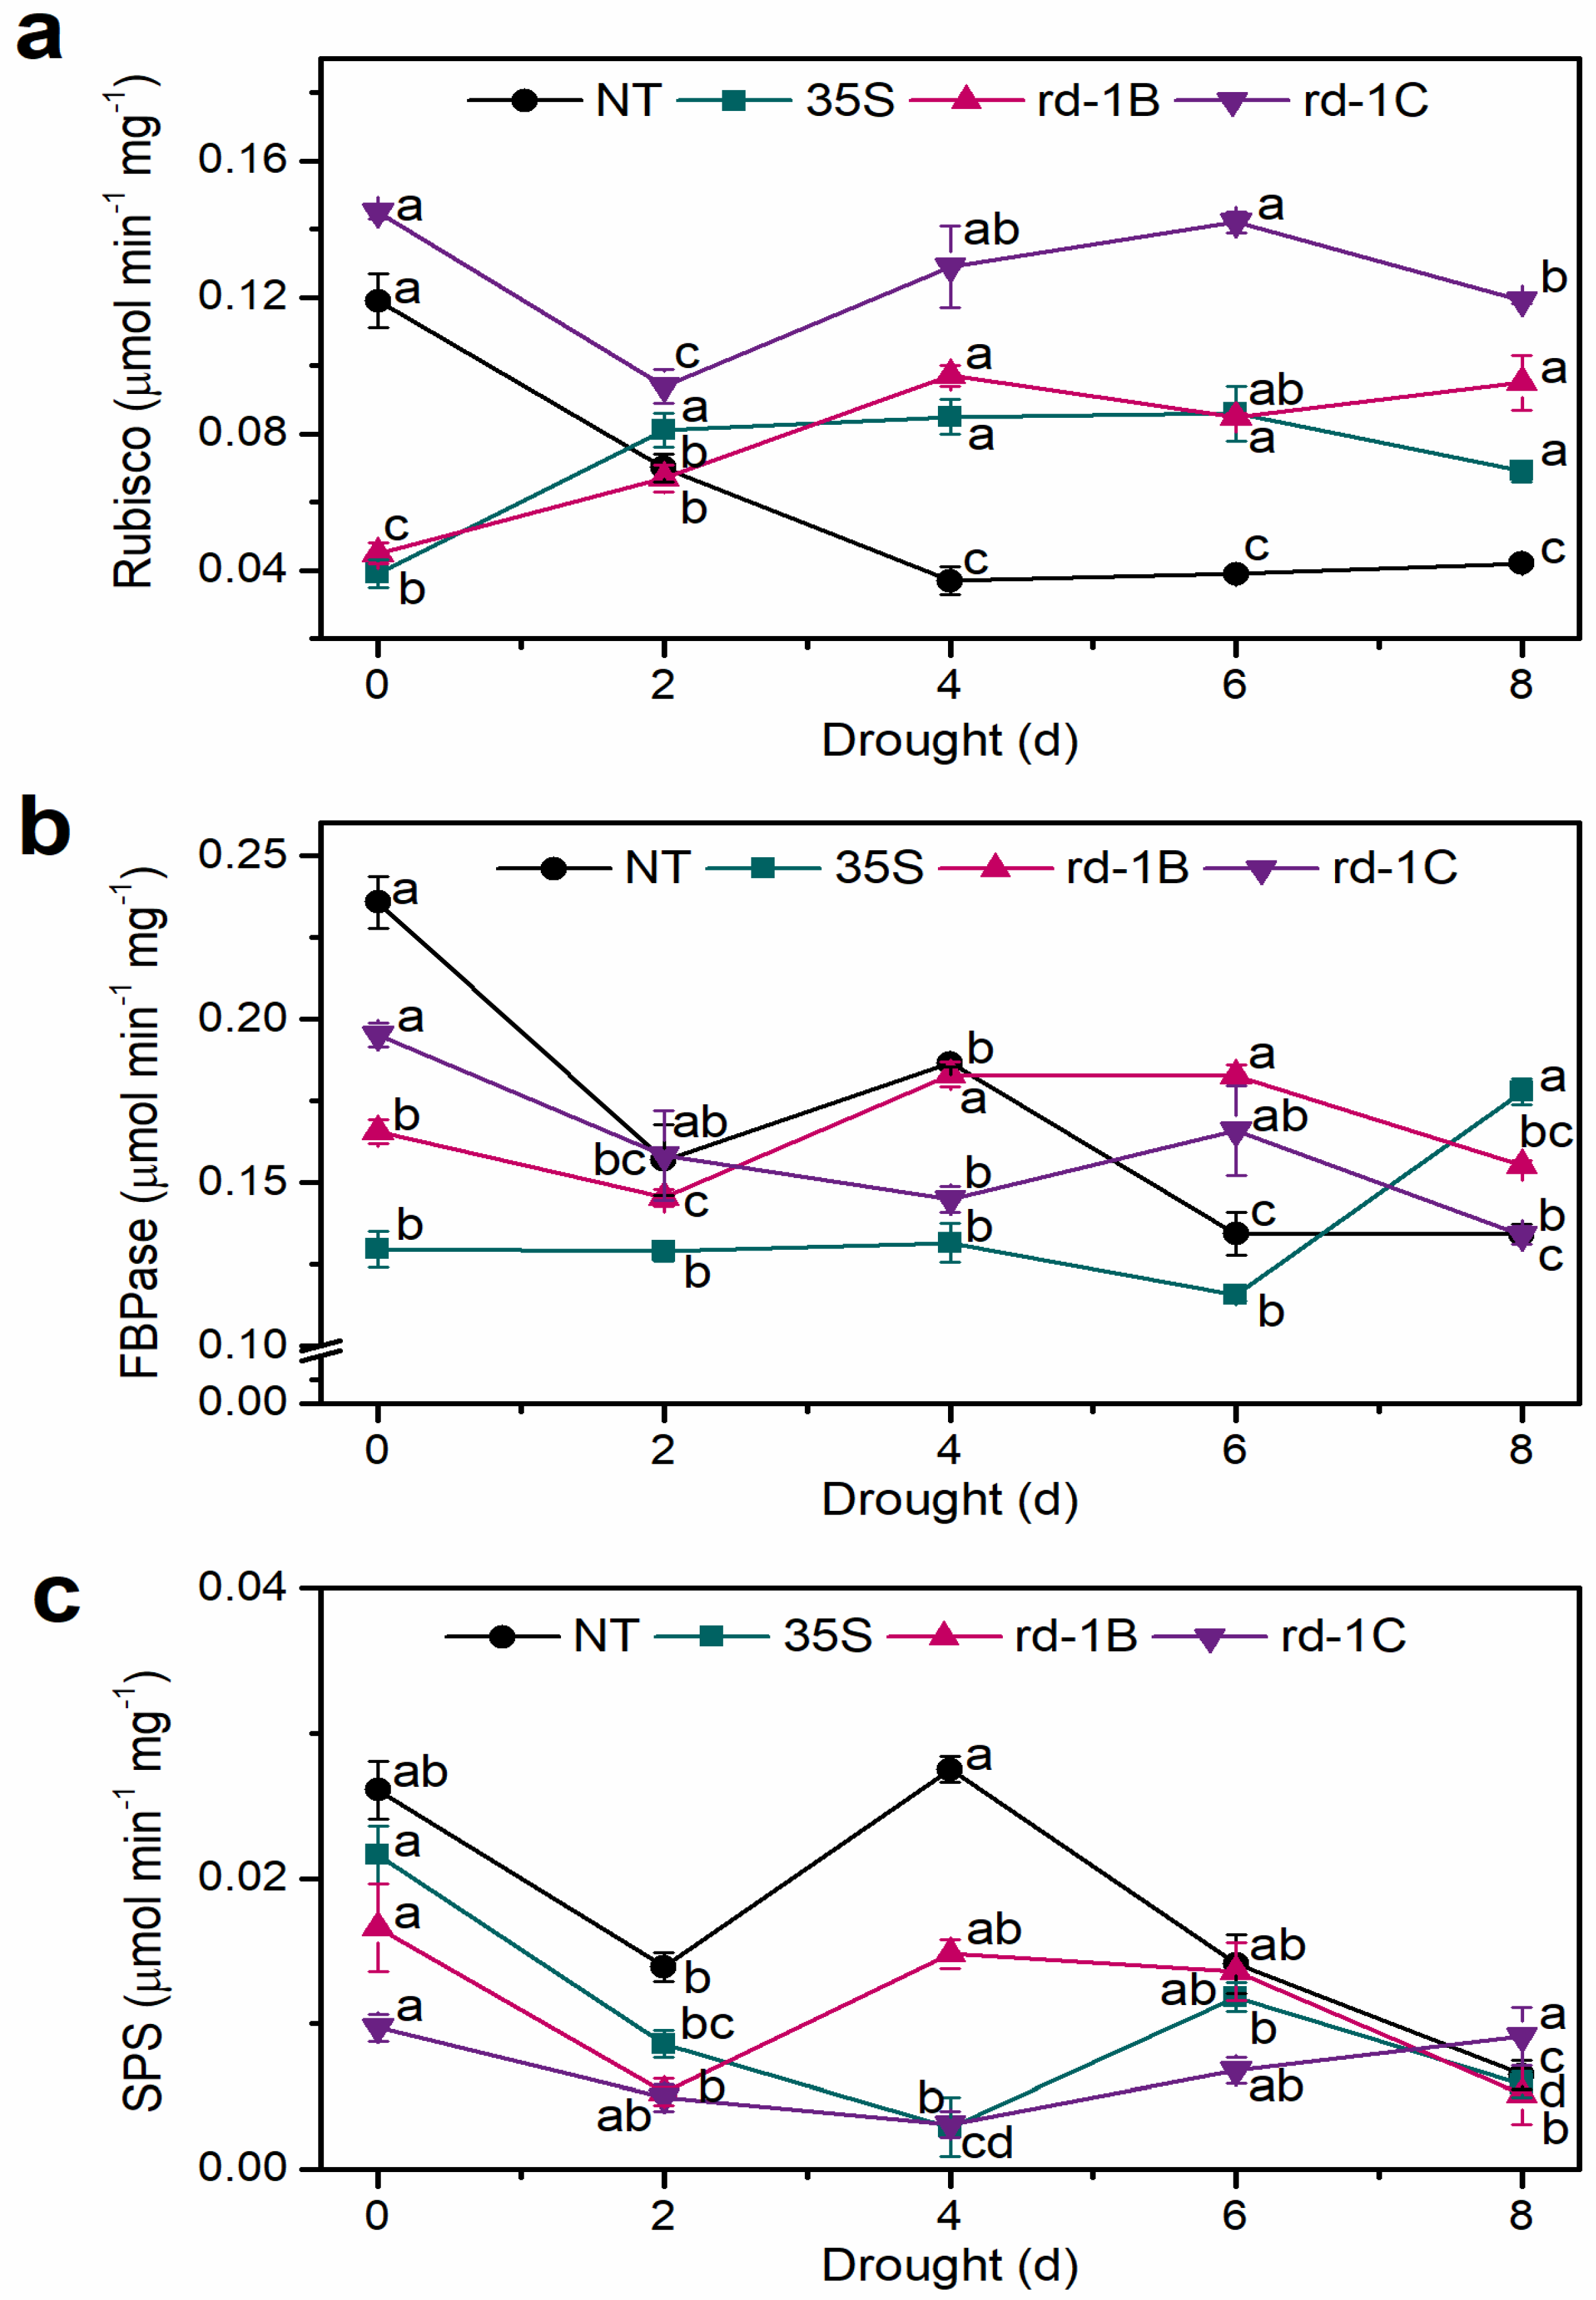
3.4. Enzyme Activity

Before the drought stress treatment, the activity of Rubisco in the NT plants was 120 nmol min−1 mg−1, and it diminished (p ≤ 0.05) when drought stress was applied (Figure 3a). After four days of drought, the Rubisco in the NT plants had lower activity, which was 70% lower compared to day zero, and remained unchanged (p ≥ 0.05) for the rest of the experiment (Figure 3a). In the 35S and rd-1B transgenic lines, the Rubisco activity in non-stressed plants was 40 nmol min−1 mg−1, and this increased (p ≤ 0.05) from day two of the drought treatment (Figure 3a). Rubisco showed a similar performance in both the 35S and rd-1B lines, as it remained unchanged (p ≥ 0.05) from day four until day eight of stress (Figure 3a). However, the Rubisco activity was 13% lower in the 35S plants than in the rd-1B line at the end of the drought treatment (Figure 3a).
The transgenic rd-1C line had the highest (p ≤ 0.05) Rubisco activity among all the lines throughout the experiment (Figure 3a). Before the drought treatments, the activity of Rubisco in the rd-1C plants was 148 nmol min−1 mg−1, and it diminished (p ≤ 0.05) on the second day of drought (Figure 3a). On day four, the Rubisco activity in the rd-1C line increased (p ≤ 0.05) to its original value and was maintained until the end of the stress (Figure 3a).
The FBPase activity was higher (p ≤ 0.05) in the NT wheat plants before drought compared to the transgenic lines (Figure 3b). Two days after starting the drought treatment, the activity of FBPase in the NT plants diminished (p ≤ 0.05), and it reached its lowest (p ≤ 0.05) activity on the sixth day, which was half the value compared to day zero (Figure 3b). Transgenic plants from the 35S line showed less FBPase activity than the NT and other transgenic lines (Figure 3b). The FBPase activity in the 35S plants was 130 nmol min−1 mg−1 and showed no changes (p ≥ 0.05) from day zero to day six of the treatment (Figure 3b). On the eighth day of drought, the 35S plants had higher FBPase activity (p ≤ 0.05) (Figure 3b).
The FBPase activity in non-stressed rd-1B plants was 210 nmol min−1 mg−1, and it diminished (p ≤ 0.05) on the second day of drought (Figure 3b).
The activity of FBPase increased (p ≤ 0.05) from day four to day six in the rd-1B plants, and on the eighth day of drought, it went back to its initial activity (Figure 3b). In the rd-1C transgenic plants, the FBPase activity gradually decreased throughout the drought treatment (Figure 3b). The NT plants had a higher (p ≤ 0.05) SPS activity than the transgenic lines (Figure 3c). After being reduced (p ≤ 0.05) on day two of drought, the SPS activity in the NT plants recovered its initial activity on day four (p ≤ 0.05) and declined again on the sixth day of drought until the end of the experiment (Figure 3c).
The activity of SPS in the transgenic 35S plants was 21 nmol min−1 mg−1 at day zero, and this declined from day two to day four of drought. The SPS activity had an increase (p ≤ 0.05) in the 35S plants on the sixth day of stress and declined again on day eight (Figure 3c). In the rd-1B plants, the activity of SPS was 17 nmol min−1 mg−1 on day zero, and it decreased (p ≤ 0.05) almost three-fold by day two of the treatment (Figure 3c). No significant changes were observed in the SPS activity in the rd-1B plants on days four and six of drought (Figure 3c). By the end of the drought stress treatment, the SPS activity was the same (p ≥ 0.05) for the transgenic lines rd-1B and 35S and NT plants (Figure 3c). The activity of SPS was lower (p ≤ 0.05) in the rd-1C plants compared to the other transgenic lines and NT plants during most of the time and did not show any significant changes throughout the drought stress (Figure 3c).

3.5. Sugar Content

The sucrose content in the NT plants increased (p ≤ 0.05) along with increased drought until day six, on which the NT plants had their highest sucrose content (Table 2). On the eighth day of drought, sucrose decreased in the wheat plants by 42% (Table 2). The transgenic 35S line had its highest sucrose content when the plants were non-stressed (Table 2).
Sucrose decreased (p ≤ 0.05) in the 35S plants from day two of drought until the end of the experiment, and it was significantly lower than in the NT plants and the lines transformed with the rd29A promoter (Table 2). Non-stressed rd-1B plants had a sucrose content of 22 µg gDW-1, and it did not change (p ≥ 0.05) until the sixth day of drought, on which it was 50% lower than its initial concentration (Table 2). In the rd-1C line, the sucrose content varied along the timepoints of the drought stress (Table 2). The initial sucrose content in the rd-1C plants was lower than in the NT plants and the other two transgenic lines (Table 2). On the eighth day of drought, all three transgenic lines had three times less sucrose (p ≤ 0.05) than the NT wheat plants (Table 2).
The trehalose content was two times higher (p ≤ 0.05) in the 35S plants before the stress treatment compared to the NT plants and the lines rd-1B and rd-1C (Table 2). The NT wheat plants increased their trehalose content on day two of drought and had their highest concentration on day six, which decreased (p ≤ 0.05) on day eight (Table 2). The 35S plants had the highest trehalose content when non-stressed compared to the NT and other transgenic lines. The trehalose concentration varied once the drought treatment was applied in the 35S line (Table 2). The transgenic rd-1B and rd-1C lines increased (p ≤ 0.05) their amounts of trehalose on day four and day eight of drought, respectively (Table 2). By the end of the drought stress, the trehalose content in both the rd-1B and rd-1C lines was the highest of all the days of drought treatment (Table 2).

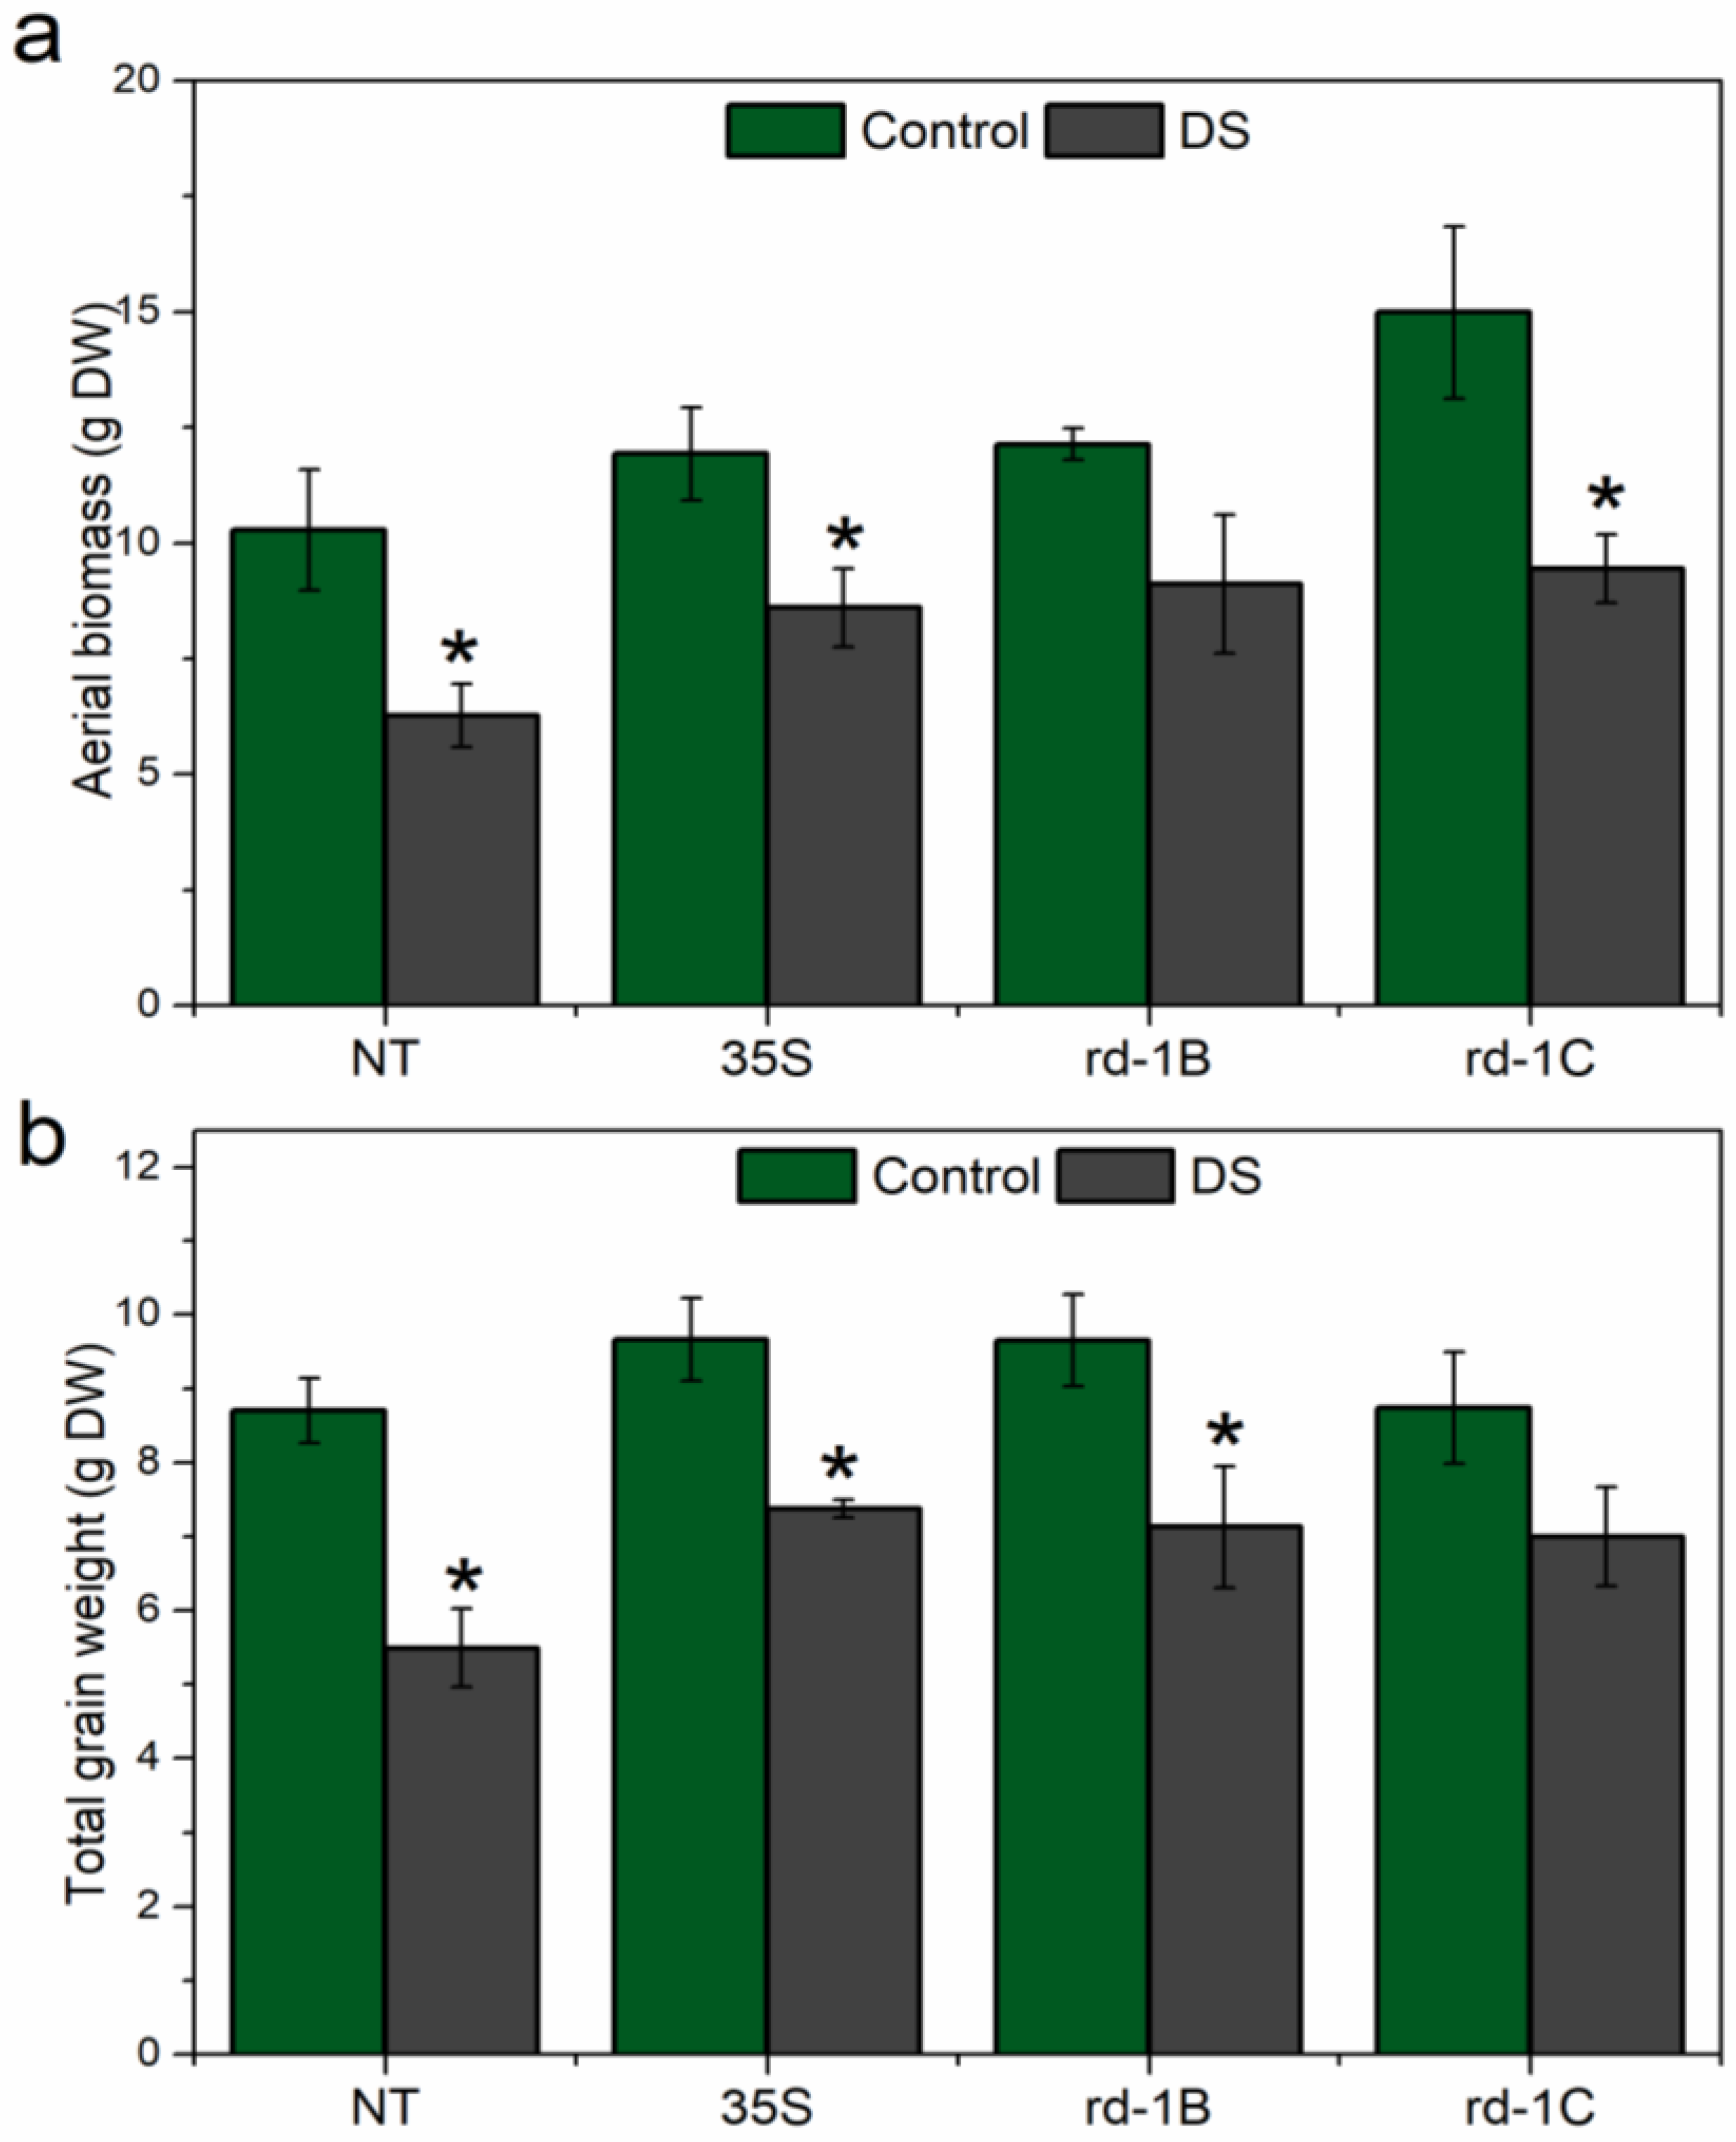
3.6. Plant Biomass after Drought Stress

After the drought stress treatment, all plants were irrigated. Five days after re-watering, the transgenic wheat lines maintained higher fresh biomass compared to the NT plants (Figure 4a). The wheat plants from the rd-1B and rd-1C lines were taller compared to the 35S transgenic plants and NT plants (Figure 4a). Even when the plants were irrigated after the treatment, the differences in plant height remained until the end of the life cycle of the plants (Figure 4b). Ten days after re-watering, the aerial biomass was measured in terms of dry weight.
When the wheat plants reached their maturity stage, the aerial biomass was collected, oven-dried, and weighed. The NT plants, as well as the 35S and rd-1C lines, had a reduction (p ≤ 0.05) in the aerial biomass due to drought stress, compared to non-stressed plants (Figure 5a). The aerial biomass in the rd-1B line was also reduced, although this reduction was not statistically significant (Figure 5a). The reduction in the areal biomass of the plants under drought stress was greater in the NT plants compared to the transformed plants (Figure 5a).
Spikes from mature plants were threshed to measure the total grain weight produced per plant to analyze the effect of drought on the grain yield. A reduction in grain weight because of drought stress was observed in plants from all three transgenic lines and in the NT plants. Furthermore, the NT plants showed the lowest yield under drought stress compared to the transgenic plants (Figure 5b). The decrease in the weight of the grains was statistically significant in the NT plants compared to the transformed ones (Figure 5b).

4. Discussion

Drought stress reduced the leaf RWC in both the NT and transformed plants, where the transgenic wheat lines performed differently than the NT plants. The transgenic lines maintained their RWC more efficiently, as it was higher after the eighth day of drought than that of the NT plants (Table 1). These data suggest that the overexpression of the ScTPS1-TPS2 gene aided in retaining their RWC when the soil water diminished. In the NT plants, the transpiration rate decreased during drought (Figure 2c), indicating that stomatal closure occurred. This result explains the decrease in the photosynthetic rate (Figure 2a). However, the Ci in the NT plants did not change during drought (Figure 2b), suggesting that the reduction in the photosynthetic rate was more affected by non-stomatal factors than by a decreased gas interchange in the leaf. One of these factors could be Rubisco activity, which declined for the NT plants under drought stress (Figure 3a). Although the NT plants showed a recovery in their photosynthetic rate on day eight of drought (Figure 2a), a definitive decline in photosynthesis could be expected if the drought treatment were to be extended further [31].
In the transgenic line 35S, the photosynthetic rate and Ci declined on the sixth day of drought (Figure 2a), but the transpiration (Figure 2c) and Rubisco activity (Figure 3a) data denote that the decline in the photosynthetic rate was not due to a reduced CO2 uptake. We observed that the constitutive overexpression of the TPS-TPP bifunctional enzyme in the 35S line caused a decreased activity of FBPase compared to the NT plants and the rd-1B and rd-1C lines (Figure 3b). This suggests that triose phosphates synthesized in the Calvin cycle in the 35S line were not directed towards RuBP regeneration, which could explain the decreased photosynthetic rate observed in this line (Figure 3a).
The gas exchange parameters (A, Ci, and E) were less affected by drought in plants transformed with the inducible rd29A promoter, as both lines kept a higher photosynthetic rate on the eighth day of drought (Figure 2). The rd-1B plants and rd-1C plants maintained their CO2 uptake during drought, which aided in sustaining the photosynthetic rate (Figure 2). Moreover, the rd-1B and rd-1C lines maintained a higher Rubisco activity under drought conditions than the NT plants (Figure 3a). A higher FBPase activity was also observed in these transgenic lines on the sixth day of drought (Figure 3b), suggesting that RuBP regeneration was sustained and contributed to keeping a high photosynthetic rate during drought (Figure 2a).
The photosynthesis data in this work agree with other studies, in which the overexpression of a bifunctional bacterial TPS-TPP in rice avoids stomata closure when subjected to drought and salinity stress, promoting a higher photosynthetic rate [32]. Foliar trehalose application avoids stomata closure, increases photosynthesis during abiotic stress, and protects the chloroplast structure [33,34]. Although trehalose metabolism seems involved in controlling the stomata aperture and the activation of various stress–response pathways, the precise mechanism for protecting photosynthesis during abiotic stress is still unclear [35].
Transcriptomic and proteomic approaches have found that trehalose application up-regulates Rubisco and chloroplast FBPase in wheat, even under non-stressed conditions [36,37]. In this work, the three lines transformed with the ScTPS1-TPS2 gene had higher Rubisco activity during drought stress than non-transformed wheat plants (Figure 4a), implying that increased trehalose synthesis in wheat promotes better photosynthesis because it helps maintain an efficient CO2 fixation under drought conditions.
The activity of SPS declined in the transgenic wheat lines on day eight of drought (Figure 3c). This may have been caused by the increased demand for glucose and UDP-glucose for trehalose synthesis under stress, induced by the transformation with the ScTPS1-TPS2 gene. On the contrary, the decline in enzyme activity observed in the NT plants was probably due to the adverse effects of drought on the overall plant metabolism (Figure 2), supporting the claims that an increased trehalose synthesis in plants aids in better performance under abiotic stress conditions [10,32].
Despite being transformed with the same promoter, lines rd-1B and rd-1C showed some differences in the response against drought. The differences could be due to diverse insertion sites of the transgene. Plant transformation using Agrobacterium is random rather than site-directed; thus, the actual transgene insertion site may influence gene expression. Nonetheless, the overall effect in the two lines transformed with the rd29A promoter was similar in both lines: because there was an improved tolerance to drought compared to the NT plants.
The sucrose and trehalose content (Table 2) and enzyme activity data in the 35S lines (Figure 3) suggest a split between trehalose and sucrose synthesis, as both sugars are synthesized in the cytoplasm. In the 35S line, this could also explain the lower RuBP regeneration shown by the low FBPase activity (Figure 2b), indicating that the constitutive overexpression of the TPSTPP enzyme in wheat directed the flux of triose phosphates towards the cytoplasm rather than to the chloroplast. Seeds from the 35S line had the lowest germination rate compared to the lines transformed with the rd29A promoter and NT seeds. Moreover, during the development of the 35S plants, the leaves were narrow (Figure S1). The changes in the leaves were probably caused by a reduced starch accumulation in the chloroplast during photosynthesis.
On the one hand, in lines rd-1B and rd-1C, trehalose increased once the soil water diminished (Table 2), which corresponds with the induction of the TPS-TPP bifunctional enzyme by the rd29A promoter under drought stress. On the other hand, the sucrose content in the rd-1B and rd-1C lines diminished when drought increased (Table 2), coinciding with the low SPS activity (Figure 3c). These results suggest that triose phosphates were mainly utilized for trehalose synthesis and RuBP regeneration in these lines when drought was imposed, which helped the transgenic plants to maintain better photosynthesis during stress. Furthermore, because rd-1B and rd-1C had a 100% germination rate and produced more and broader leaves, the increased CO2 fixation and triose phosphate flux in the chloroplast likely allowed a higher starch accumulation in these transgenic lines.
The overexpression of TPS and/or TPP genes in plants seems to have different effects on the trehalose content depending on the species; some results even seem contradictory. Yeo et al. (2000) and Miranda et al. (2007) [19,22] found increased trehalose content without correlation with gene expression levels. Jang et al. (2003) [16] reported high trehalose accumulation and high expression of the TPS-TPP gene from E. coli. In tobacco plants, the overexpression of a yeast TPS1 accumulated less trehalose than the non-transformed plants despite increased TPS activity, and no effect in the trehalose content was found in the E. coli TPS and TPP [17,23] overexpressed plants. No previous studies on wheat transformed for TPS and/or TPP overexpression have been published so far.
In plants, trehalose accumulation is only known in resurrection plants. The lack of trehalose accumulation in higher plants is thought to be due to the increased activity of trehalase [38]. Here, a high content of trehalose from day 2 to day 8 of drought in the NT plants was detected (Table 2). Moreover, the trehalase activity was higher in the transgenic lines than in the NT plants under drought (0.03 nmol min−1 mg−1 in NT versus 0.2–0.5 nmol min−1 mg−1 in transgenic plants), and this explains the lower trehalose content in the transformed plants.
Similar results were reported for transgenic tobacco and potato plants, with no increase in trehalose but enhanced stress tolerance [17,39]. While trehalose was first considered to act as an osmoprotectant under abiotic stress, more recent evidence suggests that this sugar could also be a regulatory molecule with effects on the upregulation of photosynthetic and antioxidant enzymes and heat-shock proteins [21,34,36].
The transgenic plants recovered better after drought than the NT plants, as the aerial biomass was greater in the 35S and rd-1B and rd-1C lines (Figure 4). At the maturity stage, drought reduced the dry weight in both the NT and transgenic plants (Figure 5a). However, the grain weight was less affected in the transgenic plants than in the NT plants by drought (Figure 5b), suggesting that along with promoting a better photosynthetic performance under drought, transformation with the ScTPS1-TPS2 gene in wheat plants also aided in sustaining their growth and yield under drought stress.
Interestingly, the aerial biomass was higher in the transgenic wheat lines under control and drought-stressed conditions than in the NT plants (Figure 5). T6P is directly involved in regulating the carbon flux and sugar synthesis in plants, and this regulation responds to environmental conditions, including abiotic stress [40]. In addition, T6P acts as a signaling molecule for carbon availability in plants by responding to the sucrose content. However, transgenic plants transformed with TPS and/or TPP genes show that this regulatory mechanism may be altered by T6P and the trehalose levels [5,40]. More profound research in the field will help to understand how trehalose synthesis regulates the response to stress in plants and its participation in sustaining plant growth.

5. Conclusions

Transgenic wheat overexpressing a bifunctional TPS-TPP enzyme from yeast improved the response to drought stress, as the CO2 fixation was not affected. The transgenic wheat lines studied had differences in their Calvin-cycle-enzyme activity and sucrose synthesis. These differences depended on the induction or constitutive increased synthesis of trehalose during drought stress. The differences were also reflected in the biomass production and seed viability. These findings suggest that trehalose participates in different pathways in sugar metabolism during drought stress, supporting the hypothesis that it acts as a signaling sugar during abiotic stress rather than as an osmolyte. However, further research is needed to understand the role of trehalose in triose phosphate flux in sugar synthesis.

Supplementary Materials

The following supporting information can be downloaded at: https://www.mdpi.com/article/10.3390/app13127267/s1, Figure S1: Morphological differences between non-transformed (NT) and transgenic wheat lines at three, five and seven weeks after germination.

Author Contributions

Conceptualization, E.M.V.-S.; funding acquisition, E.M.V.-S.; investigation, A.R.-R. and J.P.V.-A.; methodology, C.G.F.-S., J.O.M.-G., G.I., A.C.-V. and M.R.-D.; software, A.C.-V.; supervision, M.R.-D.; writing—original draft, A.R.-R.; writing—review and editing, J.P.V.-A., C.G.F.-S., J.O.M.-G., G.I., A.C.-V. and E.M.V.-S. All authors have read and agreed to the published version of the manuscript.

Funding

This study was funded by the National Science and Technology Council, Mexico (CONACyT), grant CB 2012/181574, to E.M.V.-S.

Institutional Review Board Statement

Not applicable.

Informed Consent Statement

Not applicable.

Data Availability Statement

All the data supporting the findings of this study are included in this article.

Acknowledgments

JPVA and ARR received a Ph.D. scholarship from CONACYT, Mexico. The authors thank INIFAP for providing the wheat seeds used, and especially Pedro Figueroa for his kindness and facilities. We thank Miguel Angel Martínez-Tellez and Chemist Biologist Francisco Soto-Cordova for the technical help provided in the sugar content measurements in wheat leaves. We also give thanks to Department Head Rafael Retes López from the University of Sonora’s Agriculture and Livestock Department for allowing us to work in their greenhouse facilities.

Conflicts of Interest

The authors declare no conflict of interest.

References

  1. Curtis, T.; Halford, N.G. Food security: The challenge of increasing wheat yield and the importance of not compromising food safety: Wheat yield and food safety. Ann. Appl. Biol. 2014, 164, 354–372. [Google Scholar] [CrossRef] [PubMed] [Green Version]
  2. Wang, Z.; Li, J.; Lai, C.; Wang, R.Y.; Chen, X.; Lian, Y. Drying tendency dominating the global grain production area. Glob. Food Secur. 2018, 16, 138–149. [Google Scholar] [CrossRef]
  3. Wingler, A. The function of trehalose biosynthesis in plants. Phytochemistry 2002, 60, 437–440. [Google Scholar] [CrossRef] [PubMed]
  4. Iturriaga, G.; Suárez, R.; Nova-Franco, B. Trehalose metabolism: From osmoprotection to signaling. Int. J. Mol. Sci. 2009, 10, 3793–3810. [Google Scholar] [CrossRef] [Green Version]
  5. Phan, L.C.H.B.T.; Van Dijck, P. Biosynthesis and degradation of trehalose and its potential to control plant growth; development; and abiotic stress tolerance. In Osmoprotectant-Mediated Abiotic Stress Tolerance in Plants; Hossain, M.A., Kumar, V., Burritt, D.J., Fujita, M., Mäkelä, P.S.A., Eds.; Springer: Cham, Switzerland, 2019; pp. 175–199. [Google Scholar] [CrossRef]
  6. Elbein, A.D.; Pan, Y.T.; Pastuszak, I.; Carroll, D. New insights on trehalose: A multifunctional molecule. Glycobiology 2003, 13, 12–17. [Google Scholar] [CrossRef]
  7. Singer, M.A.; Lindquist, S. Thermotolerance in Saccharomyces cerevisiae: The yin and yang of trehalose. Trends Biotechnol. 1998, 16, 460–468. [Google Scholar] [CrossRef]
  8. Garg, A.K.; Kim, J.K.; Owens, T.G.; Ranwala, A.P.; Choi, Y.D.; Kochian, L.V.; Wu, R.V. Trehalose accumulation in rice plants confers high tolerance levels to different abiotic stresses. Proc. Natl. Acad. Sci. USA 2002, 99, 15898–15903. [Google Scholar] [CrossRef] [Green Version]
  9. Luo, Y.; Li, F.; Wang, G.P.; Yang, X.H.; Wang, W. Exogenously-supplied trehalose protects thylakoid membranes of winter wheat from heat-induced damage. Biol. Plant. 2010, 54, 495–501. [Google Scholar] [CrossRef]
  10. Lyu, J.I.; Min, S.R.; Lee, J.H.; Lim, Y.H.; Kim, J.-K.; Bae, C.-H.; Liu, J.R. Overexpression of a trehalose-6-phosphate synthase/phosphatase fusion gene enhances tolerance and photosynthesis during drought and salt stress without growth aberrations in tomato. Plant Cell Tissue Organ Cult. 2013, 112, 257–262. [Google Scholar] [CrossRef]
  11. Luo, Y.; Gao, Y.M.; Wang, W.; Zou, C.J. Application of trehalose ameliorates heat stress and promotes recovery of winter wheat seedlings. Biol. Plant. 2014, 58, 395–398. [Google Scholar] [CrossRef]
  12. Zhang, Q.; Song, X.; Bartels, D. Enzymes and metabolites in carbohydrate metabolism of desiccation tolerant plants. Proteomes 2016, 4, 40. [Google Scholar] [CrossRef] [Green Version]
  13. Avonce, N.; Mendoza-Vargas, A.; Morett, E.; Iturriaga, G. Insights on the evolution of trehalose biosynthesis. BMC Evol. Biol. 2006, 6, 109–114. [Google Scholar] [CrossRef] [Green Version]
  14. Mu, M.; Lu, X.K.; Wang, J.J.; Wang, D.L.; Yin, Z.J.; Wang, S.; Fan, W.L.; Ye, W.W. Genome-wide identification and analysis of the stress-resistance function of the TPS (Trehalose-6-Phosphate Synthase) gene family in cotton. BMC Genom. 2016, 17, 54. [Google Scholar] [CrossRef] [Green Version]
  15. Islam, M.A.; Rahman, M.M.; Rahman, M.M.; Jin, X.; Sun, L.; Zhao, K.; Wang, S.; Sikdar, A.; Noor, H.; Jeon, J.S.; et al. In silico and transcription analysis of trehalose-6-phosphate phosphatase gene family of wheat: Trehalose synthesis genes contribute to salinity, drought stress and leaf senescence. Genes 2021, 12, 1652. [Google Scholar] [CrossRef] [PubMed]
  16. Jang, I.-C.; Oh, S.-J.; Seo, J.-S.; Choi, W.-B.; Song, S.-I.; Kim, C.-H.; Kim, Y.-S.; Seo, H.-S.; Choi, Y.-D.; Nahm, B.-H.; et al. Expression of a bifunctional fusion of the Escherichia coli genes for trehalose-6-phosphate synthase and trehalose-6-phosphate phosphatase in transgenic rice plants increases trehalose accumulation and abiotic stress tolerance without stunting growth. Plant Physiol. 2003, 131, 516–524. [Google Scholar] [CrossRef] [PubMed] [Green Version]
  17. Cortina, C.; Culiáñez-Macià, F.A. Tomato abiotic stress enhanced tolerance by trehalose biosynthesis. Plant Sci. 2005, 169, 75–82. [Google Scholar] [CrossRef]
  18. Lee, S.-B.; Kwon, H.-B.; Kwon, S.-J.; Park, S.-C.; Jeong, M.-J.; Han, S.-E.; Byun, M.-O.; Daniell, H. Accumulation of trehalose within transgenic chloroplasts confers drought tolerance. Mol. Breed. 2003, 11, 1–13. [Google Scholar] [CrossRef]
  19. Yeo, E.T.; Kwon, H.B.; Han, S.E.; Lee, J.T.; Ryu, J.C.; Byun, M.O. Genetic engineering of drought resistant potato plants by introduction of the trehalose-6-phosphate synthase (TPS1) gene from Saccharomyces cerevisiae. Mol. Cells 2000, 10, 263–268. [Google Scholar]
  20. Lawlor, D.W.; Paul, M.J. Source/sink interactions underpin crop yield: The case for trehalose 6-phosphate/SnRK1 in improvement of wheat. Front. Plant Sci. 2014, 5, 418. [Google Scholar] [CrossRef] [Green Version]
  21. Figueroa, C.M.; Lunn, J.E. A Tale of Two Sugars: Trehalose 6-phosphate and sucrose. Plant Physiol. 2016, 172, 7–27. [Google Scholar] [CrossRef] [Green Version]
  22. Miranda, J.A.; Avonce, N.; Suárez, R.; Thevelein, J.M.; Van Dijck, P.; Iturriaga, G. A bifunctional TPS–TPP enzyme from yeast confers tolerance to multiple and extreme abiotic-stress conditions in transgenic Arabidopsis. Planta 2007, 226, 1411–1421. [Google Scholar] [CrossRef] [Green Version]
  23. Pellny, T.K.; Ghannoum, O.; Conroy, J.P.; Schluepmann, H.; Smeekens, S.; Andralojc, J.; Krause, K.P.; Goddijn, O.; Paul, M.J. Genetic modification of photosynthesis with E. coli genes for trehalose synthesis. Plant Biotechnol. J. 2004, 2, 71–82. [Google Scholar] [CrossRef] [PubMed]
  24. Yamaguchi-Shinozaki, K.; Shinozaki, K. A Nove1 cis-acting element in an Arabidopsis gene 1s involved in responsiveness to drought, low temperature, or high-salt stress. Plant Cell 1994, 6, 251–264. [Google Scholar] [PubMed] [Green Version]
  25. Hellens, R.P.; Edwards, E.A.; Leyland, N.R.; Bean, B.; Mullineaux, P.M. pGreen: A versatile and flexible binary Ti vector for Agrobacterium-mediated plant transformation. Plant Mol. Biol. 2000, 42, 819–832. [Google Scholar] [CrossRef]
  26. Slavík, B. Methods of Studying Plant Water Relations; Springer: Berlin/Heidelberg, Germany; Prague, Czech Republic, 1974; p. 146. [Google Scholar]
  27. Li, H.; Ahammed, G.J.; Zhou, G.; Xia, X.; Zhou, J.; Shi, K. Unraveling main limiting sites of photosynthesis under below- and above-ground heat stress in cucumber and the alleviatory role of Luffa rootstock. Front. Plant Sci. 2016, 7, 746. [Google Scholar] [CrossRef] [Green Version]
  28. Zimmermann, G.; Kelly, G.; Latzko, E. Efficient purification and molecular properties of spinach chloroplast fructose 1,6-biphosphatase. Eur. J. Biochem. 1976, 70, 361–367. [Google Scholar] [CrossRef]
  29. Huber, S.C. Interspecific variation in activity and regulation of leaf sucrose phosphate synthetase. Z. Pflanzenphysiol. 1981, 102, 441–450. [Google Scholar] [CrossRef]
  30. Bradford, M.M. A rapid and sensitive method for the quantitation of microgram quantities of protein utilizing the principle of protein-dye binding. Anal. Biochem. 1976, 72, 248–254. [Google Scholar] [CrossRef] [PubMed]
  31. Balla, K.; Bencze, S.; Bónis, P.; Árendás, T.; Veisz, O. Changes in the photosynthetic efficiency of winter wheat in response to abiotic stress. Open Life Sci. 2014, 9, 519–530. [Google Scholar] [CrossRef] [Green Version]
  32. Joshi, R.; Sahoo, K.K.; Singh, A.K.; Anwar, K.; Pundir, P.; Gautam, R.K.; Krishnamurthy, S.L.; Sopory, S.K.; Pareek, A.; Singla-Pareek, S.L. Enhancing trehalose biosynthesis improves yield potential in marker-free transgenic rice under drought, saline, and sodic conditions. J. Exp. Bot. 2020, 71, 653–668. [Google Scholar] [CrossRef] [PubMed]
  33. Chang, B.; Yang, L.; Cong, W.; Zu, Y.; Tang, Z. The improved resistance to high salinity induced by trehalose is associated with ionic regulation and osmotic adjustment in Catharanthus roseus. Plant Physiol. Biochem. 2014, 77, 140–148. [Google Scholar] [CrossRef]
  34. Zhao, D.Q.; Li, T.T.; Hao, Z.J.; Cheng, M.L.; Tao, J. Exogenous trehalose confers high temperature stress tolerance to herbaceous peony by enhancing antioxidant systems, activating photosynthesis, and protecting cell structure. Cell Stress Chaperones 2019, 24, 247–257. [Google Scholar] [CrossRef]
  35. Kahraman, M.; Sevim, G.; Bor, M. The Role of proline, glycinebetaine, and trehalose in stress-responsive gene expression. In Osmoprotectant-Mediated Abiotic Stress Tolerance in Plants; Hossain, M.A., Kumar, V., Burritt, D.J., Fujita, M., Mäkelä, P.S.A., Eds.; Springer: Cham, Switzerland, 2019; pp. 241–256. [Google Scholar] [CrossRef]
  36. Luo, Y.; Liu, H.Y.; Fan, Y.Z.; Wang, W.; Zhao, Y.Y. Comparative chloroplast proteome analysis of exogenously supplied trehalose to wheat seedlings under heat stress. Photosynthetica 2018, 56, 1123–1133. [Google Scholar] [CrossRef]
  37. Nemat Alla, M.; Badran, E.; Mohammed, F. Exogenous trehalose alleviates the adverse effects of salinity stress in wheat. Turk. J. Bot. 2019, 43, 48–57. [Google Scholar] [CrossRef]
  38. Van Houtte, H.; Vandesteene, L.; López-Galvis, L.; Lemmens, L.; Kissel, E.; Carpentier, S.; Feil, R.; Avonce, N.; Beeckman, T.; Lunn, J.E.; et al. Overexpression of the trehalase gene AtTRE1 leads to increased drought stress tolerance in Arabidopsis and is involved in abscisic acid-induced stomatal closure. Plant Physiol. 2013, 161, 1158–1171. [Google Scholar] [CrossRef] [PubMed] [Green Version]
  39. Goddijn, O.; Verwoerd, T.C.; Voogd, E.; Krutwagen, R.W.H.H.; de Graaf, P.T.H.M.; Poels, J.; van Dunn, K.; Ponstein, A.S.; Damn, B.; Pen, J. Inhibition of trehalase activity enhances trehalose accumulation in transgenic plants. Plant Physiol. 1997, 113, 181–190. [Google Scholar] [CrossRef] [PubMed] [Green Version]
  40. Lunn, J.E.; Delorge, I.; Figueroa, C.M.; Van Dijck, P.; Stitt, M. Trehalose metabolism in plants. Plant J. 2014, 79, 544–567. [Google Scholar] [CrossRef] [PubMed]
Figure 1. Bifunctional enzyme transgene detection. (a) PCR products of internal 1800 bp and 680 bp region of inserted construction. (b) PCR product of an internal 680 bp region of inserted construction. Negative control (Neg.); positive control (Pos.); transformed lines with 35S::TPS1-TPS2 (35S-3 and 35S-2 lines) or rd29A::TPS1-TPS2 (rd-1C and rd-1B) constructs; non-transformed lines (NT).
Applsci 13 07267 g001
Figure 2. Drought stress effect on leaf gas exchange parameters of wheat plants. Panel (a) photosynthetic rate (A); Panel (b) intercellular CO2 concentration (Ci); Panel (c) transpiration rate (E). Values are mean ± SE (n = 5). Letters indicate significant differences during days of drought (p ≤ 0.05).
Applsci 13 07267 g002
Figure 3. Effect of drought stress on enzymes involved in Calvin cycle and sugar 3.5 synthesis: (a) Rubisco activity; (b) fructose biphosphatase (FBPase); (c) sucrose phosphate synthase (SPS). Values are mean ± SE (n = 3). Letters indicate significant differences during days of drought (p ≤ 0.05).
Applsci 13 07267 g003
Figure 4. Comparison of plant biomass between non-transformed (NT) and transgenic wheat lines: (a) five days after re-watering (61 days post-germination) and (b) at the maturity stage.
Applsci 13 07267 g004
Figure 5. Effect of drought stress on final biomass of wheat plants: (a) aerial dry biomass; (b) total grain weight per plant. Values are mean ± SE (n = 5). Student’s t-test at p < 0.05 (*) was used to evaluate significant variations between non-stressed and stressed plants.
Applsci 13 07267 g005
Table 1. Relative water content of wheat plants during drought stress treatment.
Relative Water Content (%)
Drought (d)02468
NT87.7 ± 2.3 a77.3 ± 2.4 bc81.9 ± 2.3 ab70.9 ± 3.0 bc63.1 ± 3.4 c
35S92.4 ± 2.7 a81.9 ± 2.7 b81.7 ± 2.7 b77.6 ± 3.5 bc70.7 ± 3.5 c
rd-1B84.1 ± 1.7 a86.5 ± 1.7 a74.2 ± 2.1 b74.3 ± 3.0 b67.9 ± 2.7 b
rd-1C84.9 ± 1.8 a80.6 ± 1.7 a79.2 ± 1.9 a66.3 ± 3.0 b65.6 ± 2.7 b
Data show mean ± standard error (n = 5). Letters indicate significant differences compared to non-stressed plants from each line (p ≤ 0.05).
Table 2. Content of sucrose and trehalose in wheat plants under drought stress.
SugarDrought (d)
Sucrose
(μg g−1 DW)
02468
NT19.3 ± 1.0 d21.3 ± 0.8 d32.9 ± 0.4 c61.6 ± 1.1 a37.3 ± 0.5 b
35S31.4 ± 0.5 a11.2 ± 0.1 c6.7 ± 0.04 e8.4 ± 0.1 d14.0 ± 0.2 b
rd-1B22.0 ± 0.5 b23.9 ± 0.1 a23.7 ± 0.3 a13.7 ± 0.3 c13.7 ± 0.01 c
rd-1C10.8 ± 0.04 e27.3 ± 0.5 b18.6 ± 0.01 c30.9 ± 0.5 a16.6 ± 0.02 d
Trehalose
(µg g−1 DW)
NT56.8 ± 0.4 e88.4 ± 1.9 d146.2 ± 5.2 b163.9 ± 1.2 a106.5 ± 0.1 c
35S108.5 ± 1.6 b75.2 ± 0.3 c47.9 ± 0.3 e115.5 ± 0.7 a60.7 ± 1.4 d
rd-1B60.9 ± 1.3 d74.9 ± 0.7 c92.2 ± 1.0 a82.8 ± 0.1 b92.2 ± 0.6 a
rd-1C76.4 ± 1.5 b66.8 ± 1.5 c69.9 ± 0.1 c76.1 ± 0.8 b97.9 ± 0.4 a
Data show mean ± standard error (n = 3). Letters indicate significant differences during days of drought (p ≤ 0.05).
Disclaimer/Publisher’s Note: The statements, opinions and data contained in all publications are solely those of the individual author(s) and contributor(s) and not of MDPI and/or the editor(s). MDPI and/or the editor(s) disclaim responsibility for any injury to people or property resulting from any ideas, methods, instructions or products referred to in the content.

