Article

A Malware Detection and Extraction Method for the Related Information Using the ViT Attention Mechanism on Android Operating System

1
Department of Information Security, Korea University, Seoul 02841, Republic of Korea
2
Department of Computer Science, Lewis University, Romeoville, IL 60446, USA
*
Author to whom correspondence should be addressed.
Appl. Sci. 2023, 13(11), 6839; https://doi.org/10.3390/app13116839
Submission received: 13 May 2023 / Revised: 1 June 2023 / Accepted: 2 June 2023 / Published: 5 June 2023

Abstract

:
Artificial intelligence (AI) is increasingly being utilized in cybersecurity, particularly for detecting malicious applications. However, the black-box nature of AI models presents a significant challenge. This lack of transparency makes it difficult to understand and trust the results. In order to address this, it is necessary to incorporate explainability into the detection model. There is insufficient research to provide reasons why applications are detected as malicious or explain their behavior. In this paper, we propose a method of a Vision Transformer(ViT)-based malware detection model and malicious behavior extraction using an attention map to achieve high detection accuracy and high interpretability. Malware detection uses a ViT-based model, which takes an image as input. ViT offers a significant advantage for image detection tasks by leveraging attention mechanisms, enabling robust interpretation and understanding of the intricate patterns within the images. The image is converted from an application. An attention map is generated with attention values generated during the detection process. The attention map is used to identify factors that the model deems important. Class and method names are extracted and provided based on the identified factors. The performance of the detection was validated using real-world datasets. The malware detection accuracy was 80.27%, which is a high level of accuracy compared to other models used for image-based malware detection. The interpretability was measured in the same way as the F1-score, resulting in an interpretability score of 0.70. This score is superior to existing interpretable machine learning (ML)-based methods, such as Drebin, LIME, and XMal. By analyzing malicious applications, we also confirmed that the extracted classes and methods are related to malicious behavior. With the proposed method, security experts can understand the reason behind the model’s detection and the behavior of malicious applications. Given the growing importance of explainable artificial intelligence in cybersecurity, this method is expected to make a significant contribution to this field.

1. Introduction

Mobile security threats that target Android devices are constantly evolving and becoming more sophisticated. Using Android malware, cybercriminals can steal sensitive information, disrupt device use, and compromise user privacy [1].
Among the many efforts to detect malicious applications (app), many studies have demonstrated the effectiveness of deep learning methods [2]. Recently, studies using image-based malware detection models have been increasing [3]. This method of detecting malicious applications by expressing binary as an image enables more accurate detection by applying advanced technology to image processing [4]. Additionally, this method can quickly generate training data because it processes the data in a way that does not require feature engineering. With these advantages, a more accurate and efficient malicious application detection method can be built.
However, a deep learning-based malware detection model does not explain the reason for detecting an application as malicious. This poses severe problems when integrating artificial intelligence (AI) into cybersecurity [5], reducing human users’ trust in the model and making it difficult for users to understand the process behind the results [6]. To address these issues, some studies interpret the model’s decision basis as images or strings [7,8,9]. Unfortunately, in many cases, a model is designed for interpretability rather than detection accuracy, and interpretation methods are usually complex. As malware evolves rapidly, a methodology that provides both accuracy and interpretability while requiring minimal updates or modifications to models or input data is needed to continuously respond to malware [10]. A method with a simple structure is needed for this purpose. In addition, a means of explaining the interpretation of these detection models should be designed with the needs and preferences of users in mind. That is, it should be provided in a form that is easy for users to understand, such as in text format [11].
In this paper, we propose a high-accuracy method for detecting malicious applications based on a vision transformer (ViT)-based model and a method for extracting the class and method names of source code related to malicious behavior by interpreting the detection results. The extracted data can be used to understand the behavior of the malicious app and can provide an essential indicator for mobile security professionals to respond to threats. Furthermore, static analysis is performed on representative samples from various malware categories to verify malicious behaviors related to the extracted classes and methods. Our main contributions are as follows.
  • The proposed method effectively integrates the two goals of accuracy and interpretability in malware detection. It can detect malicious Android apps accurately while providing valuable insights into the underlying patterns and behaviors associated with the identified threats. The combination of detection accuracy and interpretability has broadened the scope of malware detection research and paved the way for the development of more reliable and trustworthy AI-based cybersecurity solutions.
  • A method for extracting features related to malicious behavior is presented. We show that the proposed method can provide class and method names that are useful in static analysis and that the provided class and method names can help to understand the malware’s behavior and patterns.
  • A simple structure and methodology for interpretation are proposed. The interpretation method is more straightforward than in other studies. An image heatmap is used to find out why the application is detected as malicious. This is an easy way to convert applications into images, providing detection and interpretability.
The rest of the paper is organized as follows. Section 2 reviews related work, Section 3 provides the background, Section 4 offers the methodology, Section 5 presents the experimental setup and results, Section 6 discusses the results, and Section 7 concludes the paper with a summary and future research directions.

2. Related Work

2.1. Malware Detection

Android malware detection has been extensively studied and broadly divided into signature-based and artificial intelligence-based methods [12].
Zhang et al. [13] obtained features through a static analysis of the AndroidManifest.xml and Android Dalvik executable (DEX) file. They generated four different feature sets: permission, intent filter, API call, and string, and proposed a convolutional neural network (CNN)-based model for malicious app detection by creating a vector of features through a feature embedding model.
Wang et al. [14] created a hybrid model using a deep autoencoder and convolutional neural network to detect malicious applications. They used seven categories of static features: requested permissions, intent, restricted API calls, hardware functions, code-related patterns, and suspicious API calls. The total number of extracted all individual features was 34,570. Among them, 413 features were used after filtering. Two variant CNN-based models, CNN-S and CNN-P, were used to detect malicious apps.
Ren et al. [15] presented two methods for processing classes.dex files into fixed-size sequences and using them as input to a deep learning model. This method does not limit the input file size, does not require feature engineering, and consumes few resources.
Hsien-De Huang and Kao [16] mapped the bytecode of classes.dex to RGB color to create fixed-size color images that revealed visual patterns in malware from the same family. The inception-V3 model detected malware with high accuracy, and the grayscale image was as effective as the color.
Daoudi et al. [17] used grayscale images from DEX file bytecodes to detect malware with a CNN model, achieving high accuracy. Image size did not significantly impact performance, and obfuscated apps were also effectively detected.
Freitas et al. [4] constructed MALNET-IMAGE, a dataset consisting of over one million malicious application images, providing a valuable resource for research into malicious apps. Using this MalNet dataset, detection performance was evaluated using CNN-based models such as ResNet, DenseNet, and MobileNet.
Yadav et al. [18] presented an EfficientNet-B4 CNN-based method for Android malicious app detection, wherein the DEX file was transformed into an image and used as model input. This approach demonstrated superior malicious app detection performance compared to pre-trained models such as ResNet, InceptionV3, and DenseNet.
These influential studies in the field of Android malicious app detection each employ unique approaches, ranging from static analysis and feature extraction to complex deep learning models. Studies focusing on image-based malware detection have demonstrated impressive performance, leveraging the latest CNN-based models.

2.2. Malware Detection Interpretation

XMal, proposed by Wu et al. [9], is a method for detecting malicious applications and generating descriptions of malicious behavior using an attention mechanism based on a multi-layer perceptron (MLP). Their model generated human-readable descriptions of malware behavior using API calls and permissions as features. It included an attention layer and MLP and used a pre-built semantic database of highly impactful features for detection. However, XMal prioritizes highly weighted features, but may not cover all malicious behavior, while its focus on interpretability may compromise detection accuracy.
Deep learning techniques can visualize important image features, making them helpful in interpreting the results of image-based malware detection models.
Iadarola et al. [7] used images to identify common patterns among malware of the same type. They used gradient-weighted class activation mapping (Grad-CAM) to visually present the model’s results to security professionals. They used average Euclidean distance to compare heatmap images of similar malware types, finding similar shapes and enabling security experts to identify patterns in these types without prior knowledge of the samples. One area of improvement is that the interpretation provided to security experts is a heatmap of a binary image; thus, it is not an image that humans can easily understand.
Yakura et al. [19] proposed a method of extracting essential byte sequences from malware to make manual analysis more efficient. Based on attention mechanisms and CNNs, they showed that by applying attention maps to binary data, and thus it was possible to identify features or locations of these data that characterize the type of malware.
The research in this field has been largely focused on generating descriptions of malicious app behaviors or identifying typical characteristics associated with specific categories of apps.

3. Background

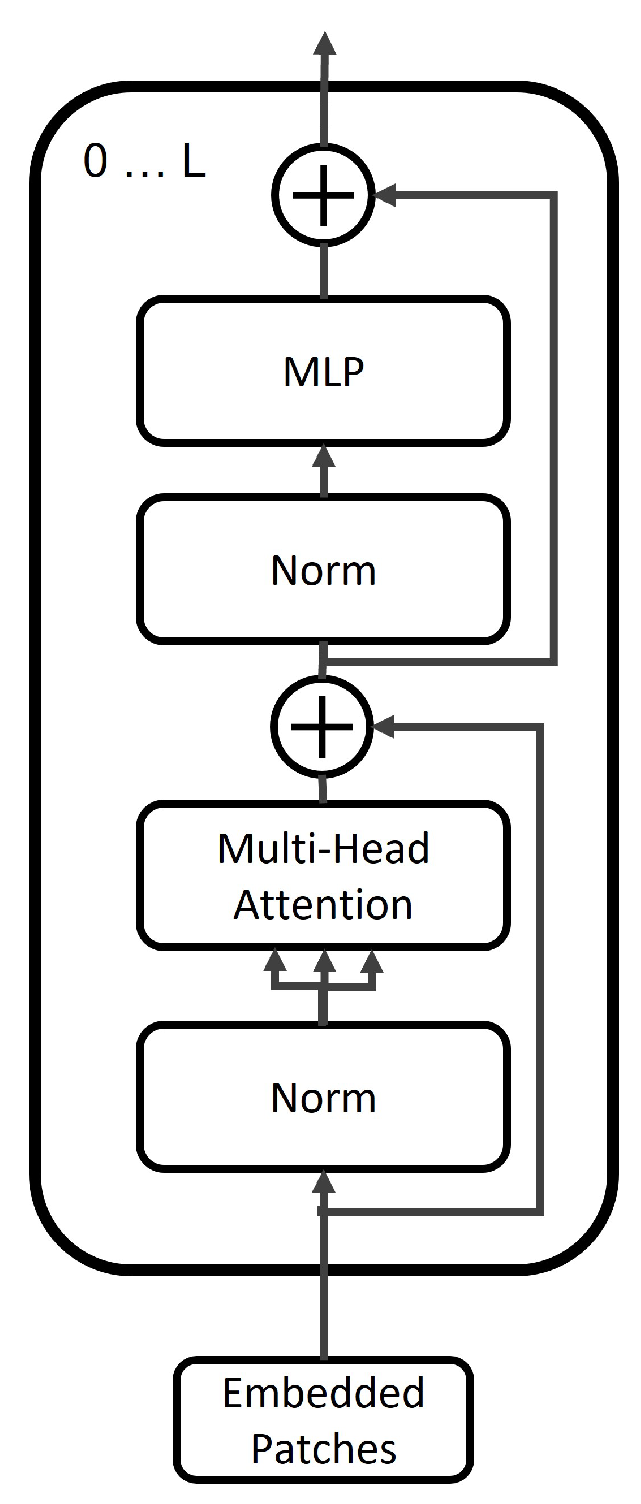
3.1. Vision Transformer

A ViT is a Transformer Encoder-based model for image classification that is highly scalable and performs well on large datasets with fewer training resources than CNN-based models [20]. Self-attention is an essential mechanism for ViT, which enables ViT to learn large image datasets very accurately and effectively [21]. One of the most valuable things about ViT is that self-attention makes it easy to recognize where the model is focusing on in the input data. This interpretability is a crucial advantage of ViT compared to other deep learning models and is particularly useful in applications where transparency and explainability are essential [22]. Overall, self-attention is a suitable method for the ViT to achieve high accuracy in various computer vision tasks and provide a transparent and intuitive way to interpret its inner workings [23].
One of the methods that can be used to compute the attention map is Attention Rollout [24]. The Attention Rollout method can be applied to a ViT to generate a heatmap showing the areas identified as critical in the ViT model.
In CNN-based models, Grad-CAM is often used to generate heatmaps. Grad-CAM improves on the traditional class activation map (CAM) method and has the advantage that it can be applied to visualizations without modifying the model [25]. The CAM method relies on the last convolutional layer, the Global Average Pooling layer, and gradient values to produce a heatmap highlighting critical regions [26].
Some research points out that Attention Rollout may be more efficient in explaining ViT decisions than previous XAI techniques, such as CNN’s Grad-CAM. Both Attention Rollout and Grad-CAM aim to provide insight into the decision-making process of a deep neural network. Attention Rollout provides a more accurate and detailed visual description of ViT’s predictions [27]. However, it should be noted that the effectiveness of these visualization methods depends on a number of factors, such as the complexity of a given dataset and the specific task.

3.2. Android DEX File

The Dalvik Virtual Machine (DVM) runs code that has been converted to the DEX file format. DEX files contain data about the source code of the application. The DEX file contains crucial information to run Android apps but is not human-readable. It has sections such as header, string_ids, and type_ids. The data section contains bytecode and string data stored in a format specific to each element. DEX decompiler tools allow for the Java source code to be obtained by reorganizing the data in a DEX file into Java code format. The tools used to decompile DEX include jadx [28], dex2jar [29], and apktool [30]. Even without a decompiler tool, the source code and related information can be obtained by parsing the DEX file following Google’s dex format documentation.

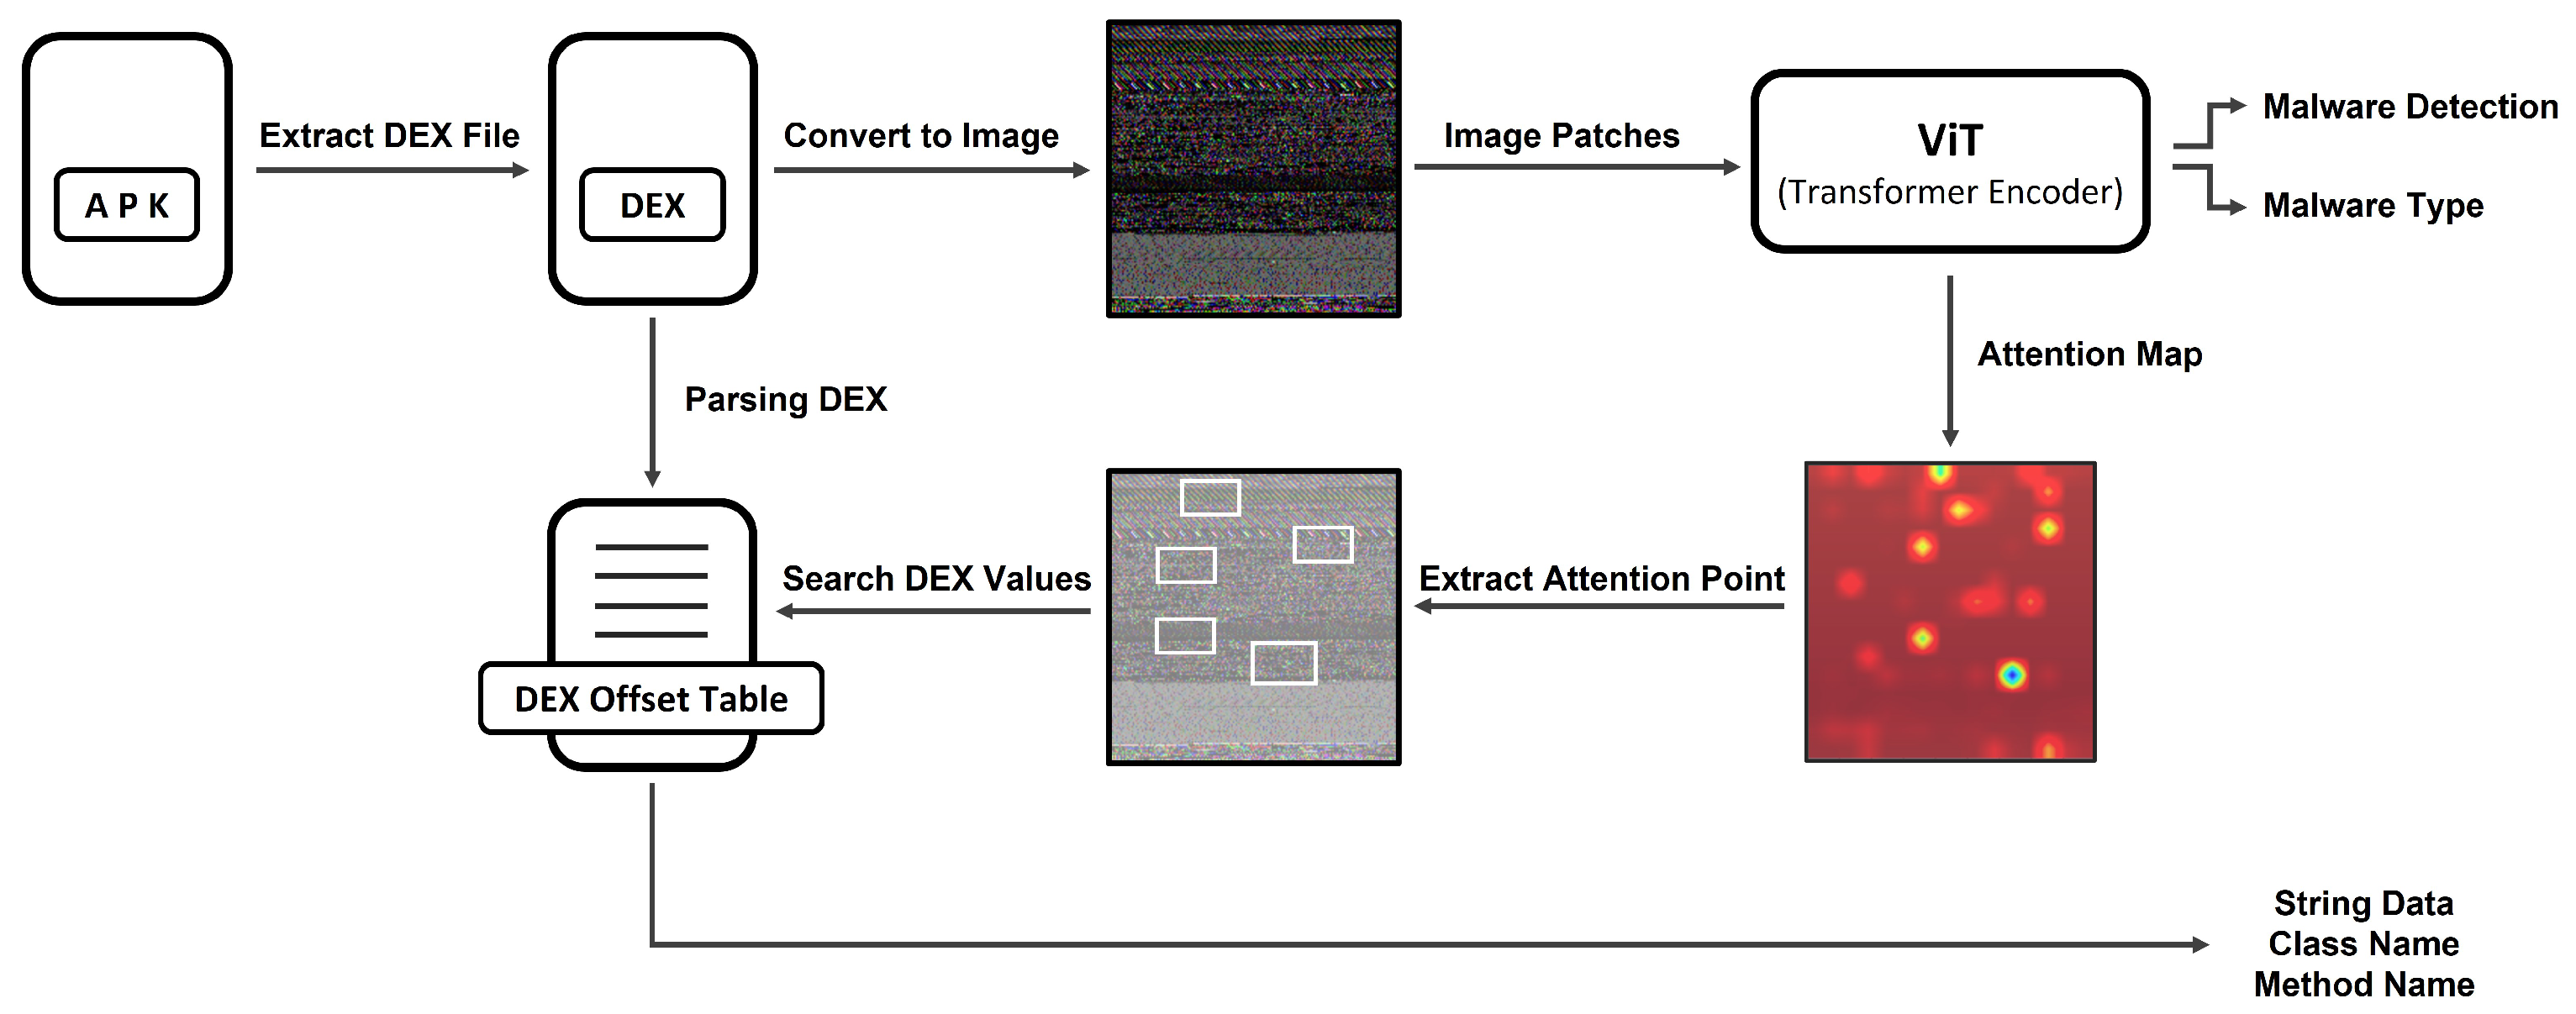
4. The Proposed Method

4.1. Overview

This paper proposes both a method to detect a malicious mobile app based on ViT and a method to extract information on malicious behavior using an attention map generated from ViT. This approach uses ViT’s attention mechanism to extract regions of the images converted from the DEX that significantly influence the detection model’s decision-making process. The extracted image regions are mapped to a DEX file to obtain DEX file data for these regions. Since DEX files contain the application’s source code data, we can obtain the data that the model used to make decisions in the form of human-readable strings, such as class names and method names. Figure 1 shows the overall structure of our proposed approach. The pseudo-code of the algorithm for overall progress is shown in Algorithm 1.
First, the DEX file format is parsed. A dex section data map is created with the offset value of the DEX file as the key and the DEX section’s information that uses the offset’s data as the value. Then, the app, which is represented as an image, is input into the detection model to obtain a prediction result. The next step is to create an attention map representing the most referenced regions for malware detection in the ViT model. To make high attention score regions, relatively high values are selected in the attention map. The dex section data and values are obtained by searching the dex section data map with the index of the highlighted area. Class and method information is extracted from the obtained data and provided to the user. The proposed method aims to detect malware and provide class and method names related to malicious behavior. The following sections sequentially describe each step of the proposed method.
Algorithm 1 Proposed overall progress Algorithm.
Input:  APK
Output:  Detection Result, List of Class and Method Name
   1: D E X = e x t r a c t D E X f r o m A P K ( A P K )
   2: d e x _ r g b _ i m a g e = c o n v e r s i o n I n t o I m a g e ( D E X )
   3: d e x _ s e c t i o n _ d a t a _ m a p = D E X p a r s e ( D E X )
   4: p r e d i c t i o n = V i T ( d e x _ r g b _ i m a g e )
   5: attention_map,attention_points=getAttentionMap(Vit,dex_rgb_image)
   6: for  a t t e n t i o n _ p o i n t s  do
   7:      d e x _ m m _ l i s t = c o n v e r T o D e x O f f s e t ( a t t e n t i o n _ p o i n t )
   8: end for
   9: class_method_names_list=extractInformation(dex_mm_list,dex_offset_index_table)
 10: return prediction, class_method_names_list

4.2. Conversion into Image

The DEX is extracted from the Android Application Package (APK). Since the APK is a ZIP format, the APK is unzipped to obtain the DEX file. Then, the DEX file is converted to an RGB-based image because color images provide better accuracy than grayscale images in malware detection models [31]. The following Equation (1) shows how to change a DEX file to a color image.
d e x _ r g b _ i m a g e [ n ] = R G B ( d e x [ 3 n ] , d e x [ 3 n + 1 ] , d e x [ 3 n + 2 ] ) , ( n = 0 , , k 3 )
where d e x _ r g b _ i m a g e is a list of RGB codes for a DEX color image, dex is a one-dimensional array of dex bytes, and k is the total length of a one-dimensional list of dex bytes. If k is k / 3 0 , zero is padded to the end of the dex file to make the length a multiple of 3. The conversion to an RGB image uses the same method as R2-D2 [16]. As in Equation (1), the three bytes of bytecode in the DEX file are converted to a single RGB pixel. The image of the DEX can be obtained by changing the one-dimensional d e x _ r g b _ i m a g e array to two dimensions. The obtained image has a square shape. The image sizes are made differently depending on the size of the DEX. The images are scaled to the same size when input to the model.

4.3. Malware Detection Model

The malware detection model uses the ViT model proposed by Dosovitskiy et al. [20]. The ViT model consists of multiple layers of Transformer Encoders. The following Figure 2 shows the structure of an encoder block used in the ViT. The model consists of L encoder layers. For each layer, the input is the previous layer’s output, and the input of the first layer is the model’s input. The ’Embedded Patches’ at the bottom of Figure 2 are the input of the ViT model. The encoder block of a layer consists of a normalized multi-head self-attention (MSA) and a normalized multi-layer perceptron (MLP). Between MSA and MLP, the residual connection exists.
ViT uses a number of transformer encoder blocks to learn relationships between image patches and uses MLP, an output layer, to make the model’s output.
The DEX image created in Section 4.2 is used as input to the model. The image shape is ( H , W , C ) , where H is the height of the image, W is the width of the image and C is the number of channels. The image is divided into patches that are used as model input. The image is divided into patches of size ( P , P ) , where P is the size of the patch. The number of patches, N, is calculated by Equation (2) [20].
N = H W P 2
The generated patch is x p i , ( 1 i N ) . The shape of x p i is x p i R P 2 C . To enter the patches into the model, embedding is applied, as shown in Equation (3).
z 0 = [ x c l s ; x p 1 E ; x p 2 E ; · · · ; x p N E ] + E p o s , E R ( P 2 · C ) × D , E p o s R ( N + 1 ) × D
where z 0 is the initial input to the model. To embed patches, we use patch projection with E. E is a matrix. D is the embedding dimension, so patches map to D dimensions. The position embedding, E p o s , is added. The class token x c l s is added to the first position of the input.
Equation (4) is a set of layer normalization (LN) and the MSA in an encoder block. First, layer normalization is performed on the encoder’s input, as shown in the equation.  LN normalizes each sample’s features. For more information about LN, refer to Wang et al. [32], Ba et al. [33]. Then, MSA is performed. For more information about MSA, refer to Vaswani et al. [22]. The input and output of a set of LN and MSA are connected by a residual connection. The result of the residual connection z l 1 goes into the input of a set of LN and MLP in Equation (5).
z l 1 = M S A ( L N ( z l 1 ) ) + z l 1 , l = 1 · · · L
where L is the total number of encoder layers in the model. Equation (5) is a set of LN and MLP in the encoder block. The input and output of a set of LN and MLP are connected by a residual connection. The result of the residual connection z l is an output of the encoder block.
z l = M L P ( L N ( z l 1 ) ) + z l 1 , l = 1 · · · L
where L is the total number of encoder layers in the model. The output of each Transformer Encoder is z l . The  z l becomes the input of the next layer.
An attention weight A is generated in the MSA from Equation (6) as follows.
A = s o f t m a x ( Q K T D h )
where Q is the query and K is the key. D h is D / k and k are the number of heads [22]. The attention weight A is used to create the attention map in Section 4.4.2.
The following Equation (7) finally generates a detection result in ViT.
y ^ = M L P ( z L 0 )
where z L 0 is the first row of z L . After iterating over the Transformer Encoders L times, the final output is z L R ( N + 1 ) × D . Since the value of the model input z 0 is a class token in Equation (3), z L 0 in z L is the class token. The class token is a special token that contains the global information of the input image.
At the final layer, a layer normalization is applied to the output z L of the encoder block. After the layer normalization, the class token z L 0 R D is extracted from the z L . The detection result y ^ is obtained by MLP [20]. This MLP head finally generates the malicious application detection result.

4.4. Extraction Malicious Function Identifiers
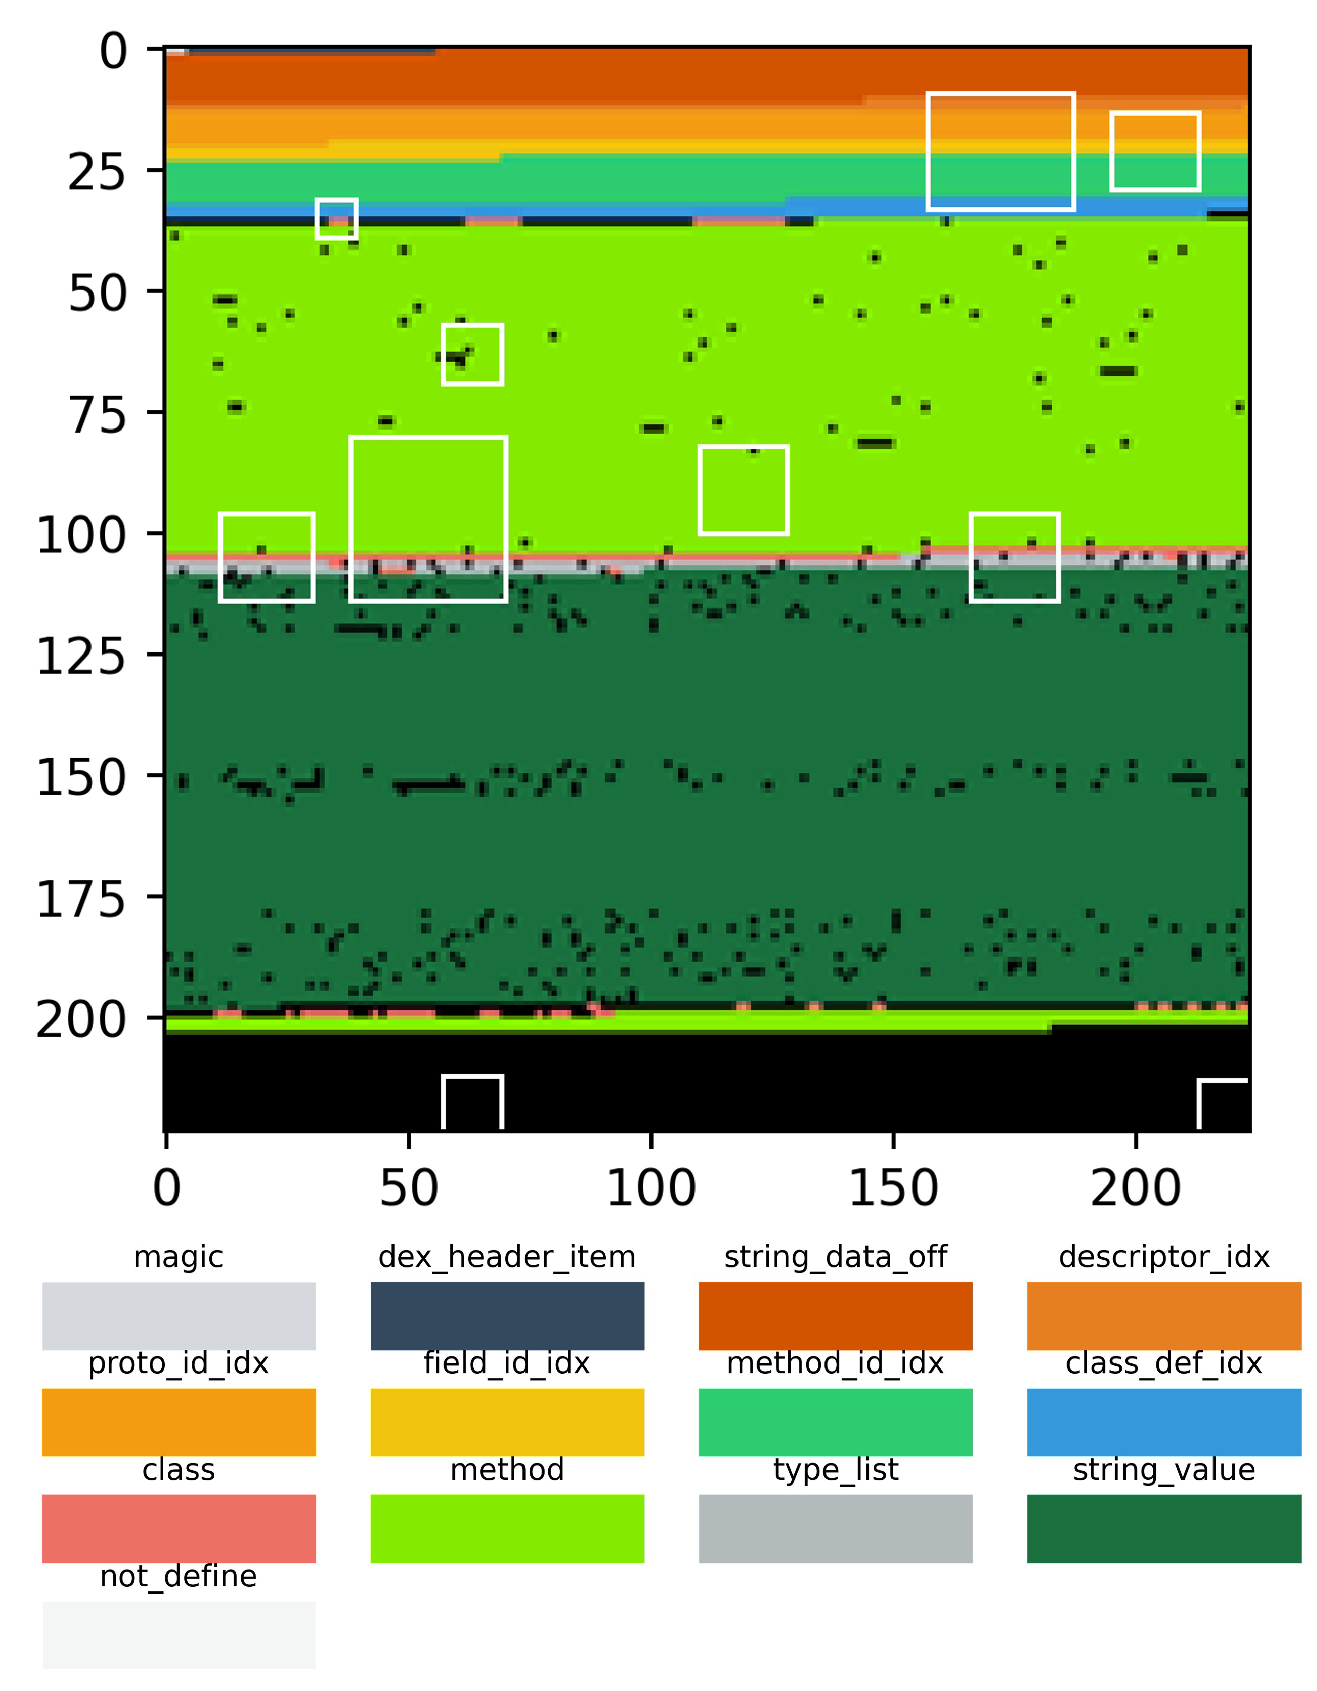
After obtaining the malicious application detection results from the model, the functional identifiers related to the malicious behavior are obtained. In this paper, the function identifier means the names of classes and methods. This process has three steps.

4.4.1. DEX Parsing

A DEX file is composed of multiple sections, including a header, string table, type table, class table, and method table. The proposed d e x _ s e c t i o n _ d a t a _ m a p in Algorithm 1 is a structured representation of how these sections are laid out in a DEX file and allows efficient DEX field data access. This map makes it easy to know which class or method references data at an offset point within the DEX file.
To parse the DEX file, we parse each section according to its structure. For example, the method_ids area starts at 0x16c offset when the method_ids_off value is written as 6C 01 00 00 in the dex header. The detailed configuration of the dex format is described in the Google AOSP documentation [34].
The d e x _ s e c t i o n _ d a t a _ m a p structure is organized as in Equation (8).
D [ k e y ] = v a l u e , k e y = 0 · · · ( n 1 )
where D is the d e x _ s e c t i o n _ d a t a _ m a p , n is the total number of bytes in the DEX file. The d e x _ s e c t i o n _ d a t a _ m a p shows which string, prototype, class, and method values are at each offset in the DEX file. k e y is the offset value of DEX file. v a l u e is a list that has DEX field names and information about DEX fields as items. For example, if the data at positions 0x10, 0x11, and 0x12 of the DEX file correspond to the string_ids section, the  v a l u e of D[0x10], D[0x11], and D[0x12] becomes l i s t ( " s t r i n g _ i d s " : s t r i n g _ d a t a _ o f f ) . In the dex format, only the fields that make up the class and method go into v a l u e as the class or method name, not the dex field name. For example, if the data at positions 0xa0, 0xa1, and 0xa2 of the dex file correspond to the data section and are used in m e t h o d _ e x _ 2 of the class c l a s s _ e x _ 1 , the  v a l u e of D[0xa0], D[0xa1], and D[0xa2] are l i s t ( " c l a s s " : c l a s s _ e x _ 1 , " m e t h o d " : m e t h o d _ e x _ 2 ) .

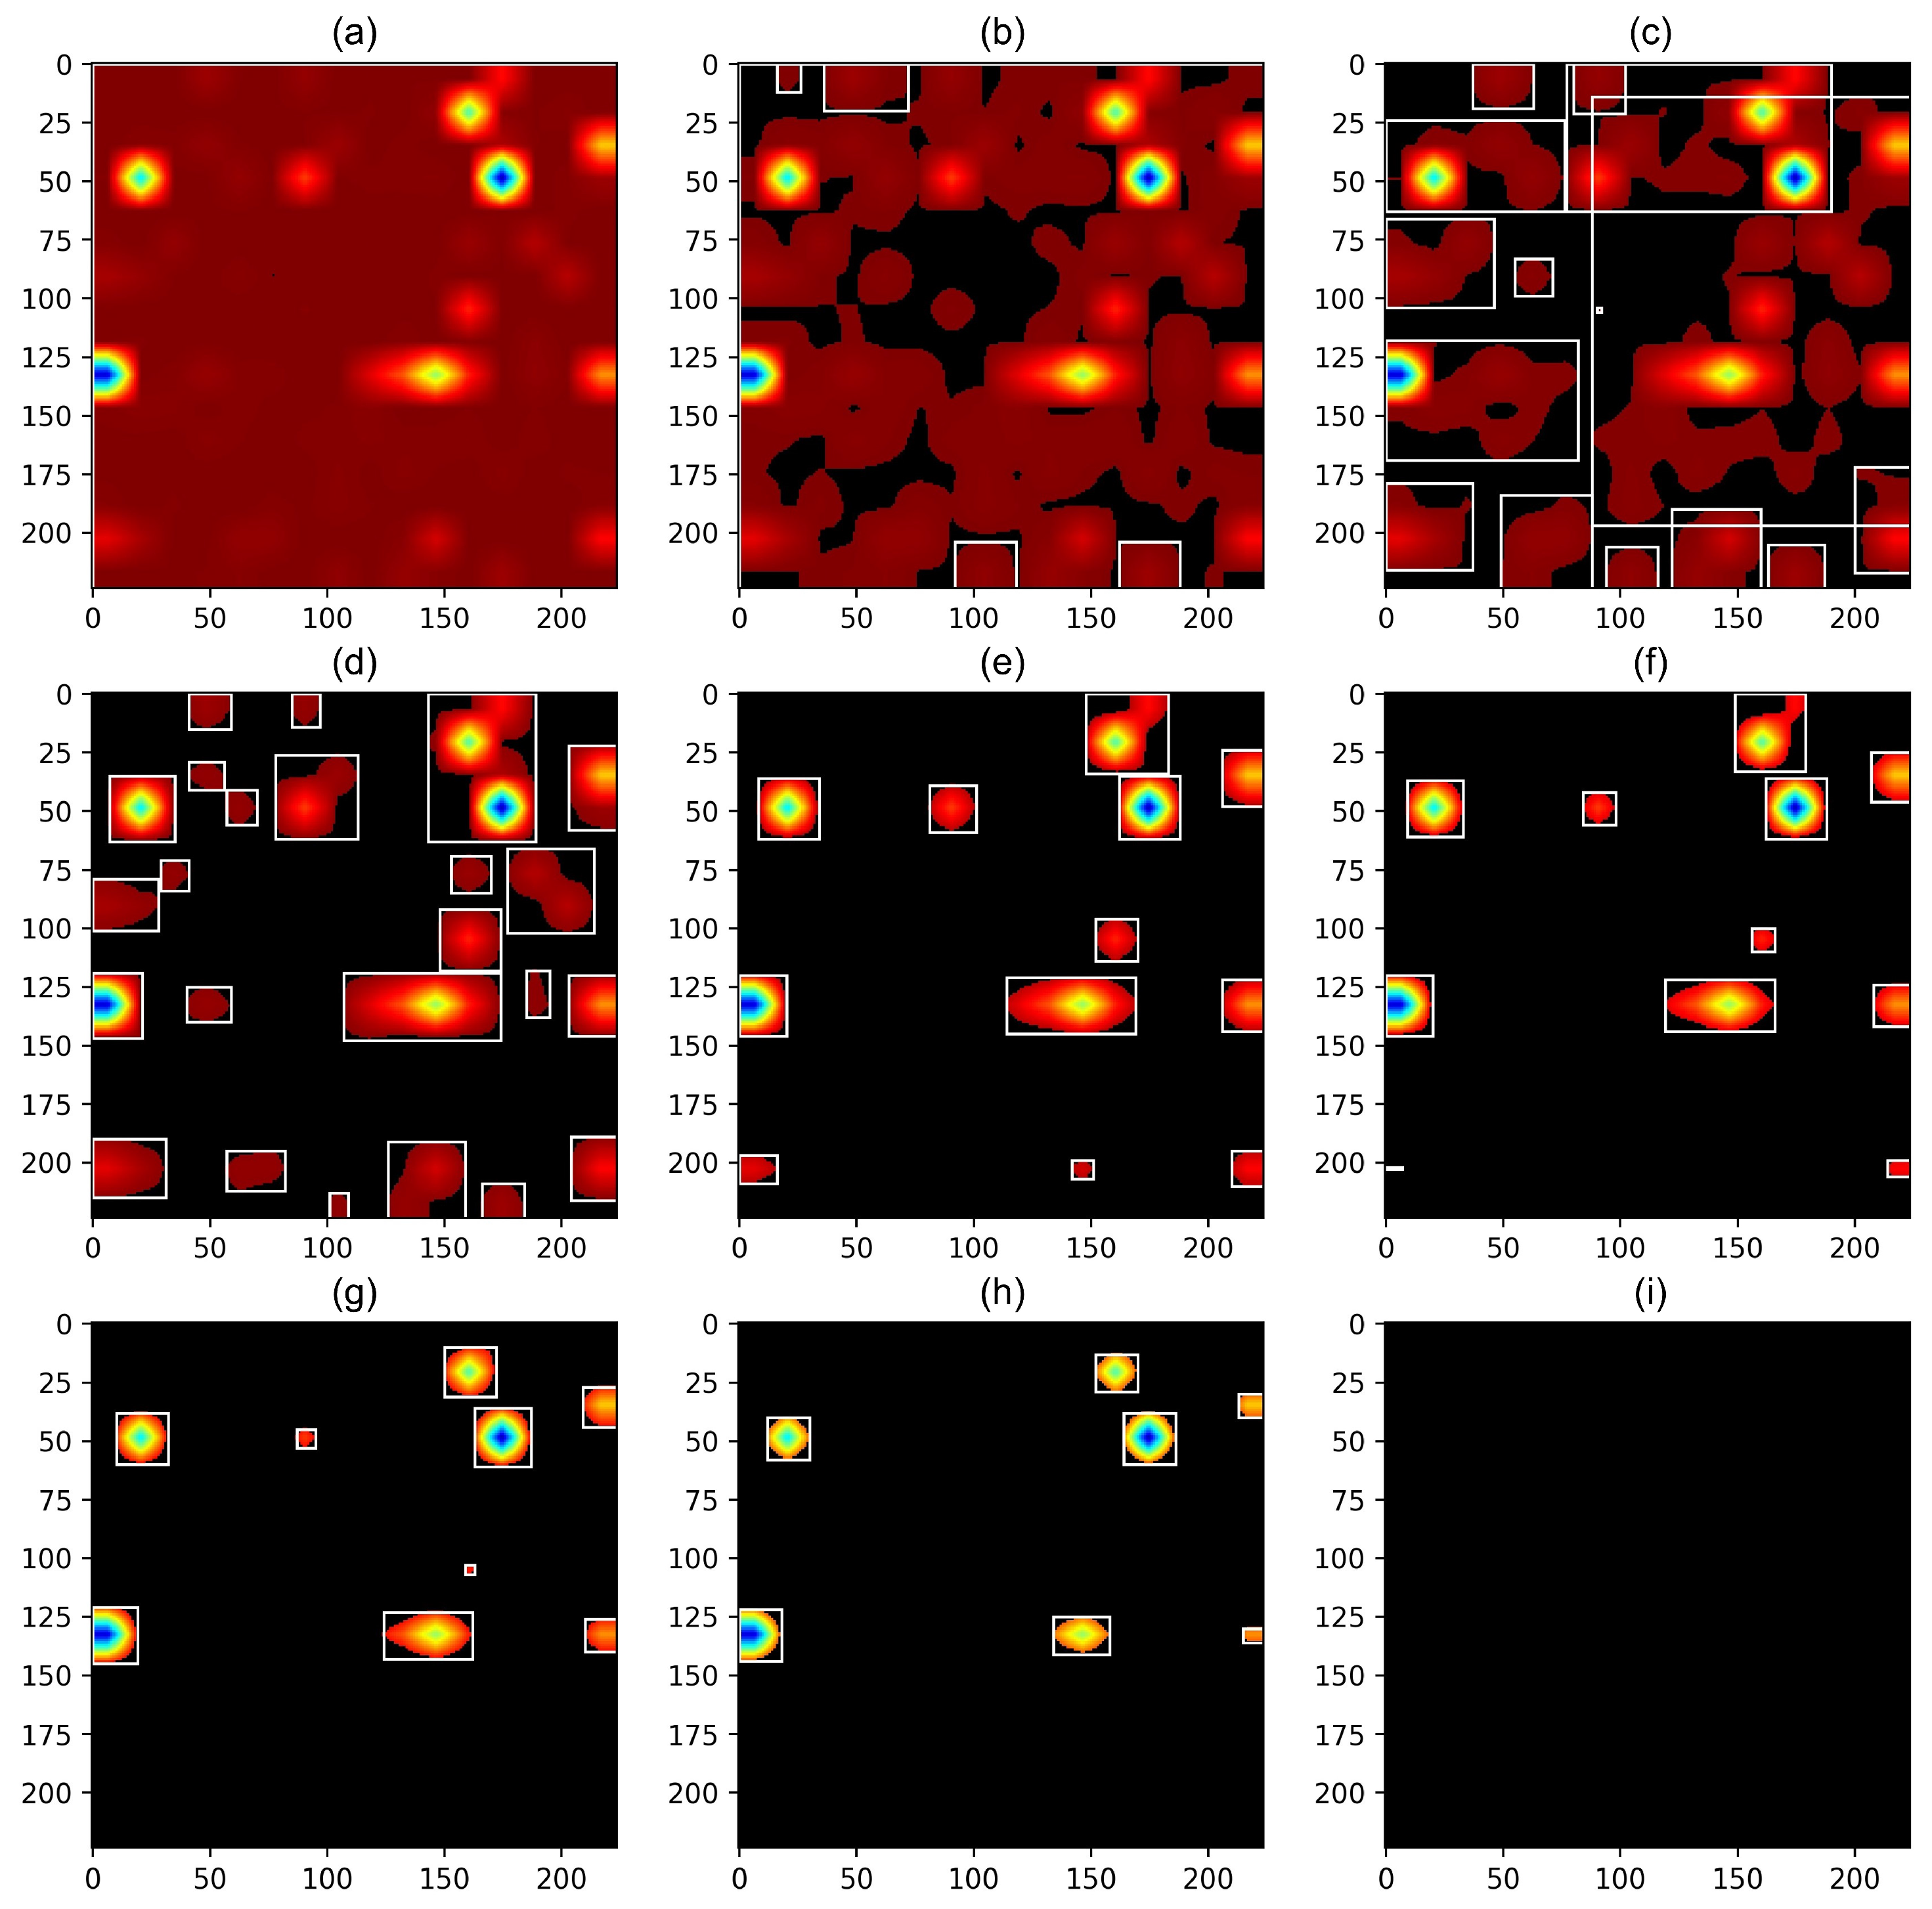
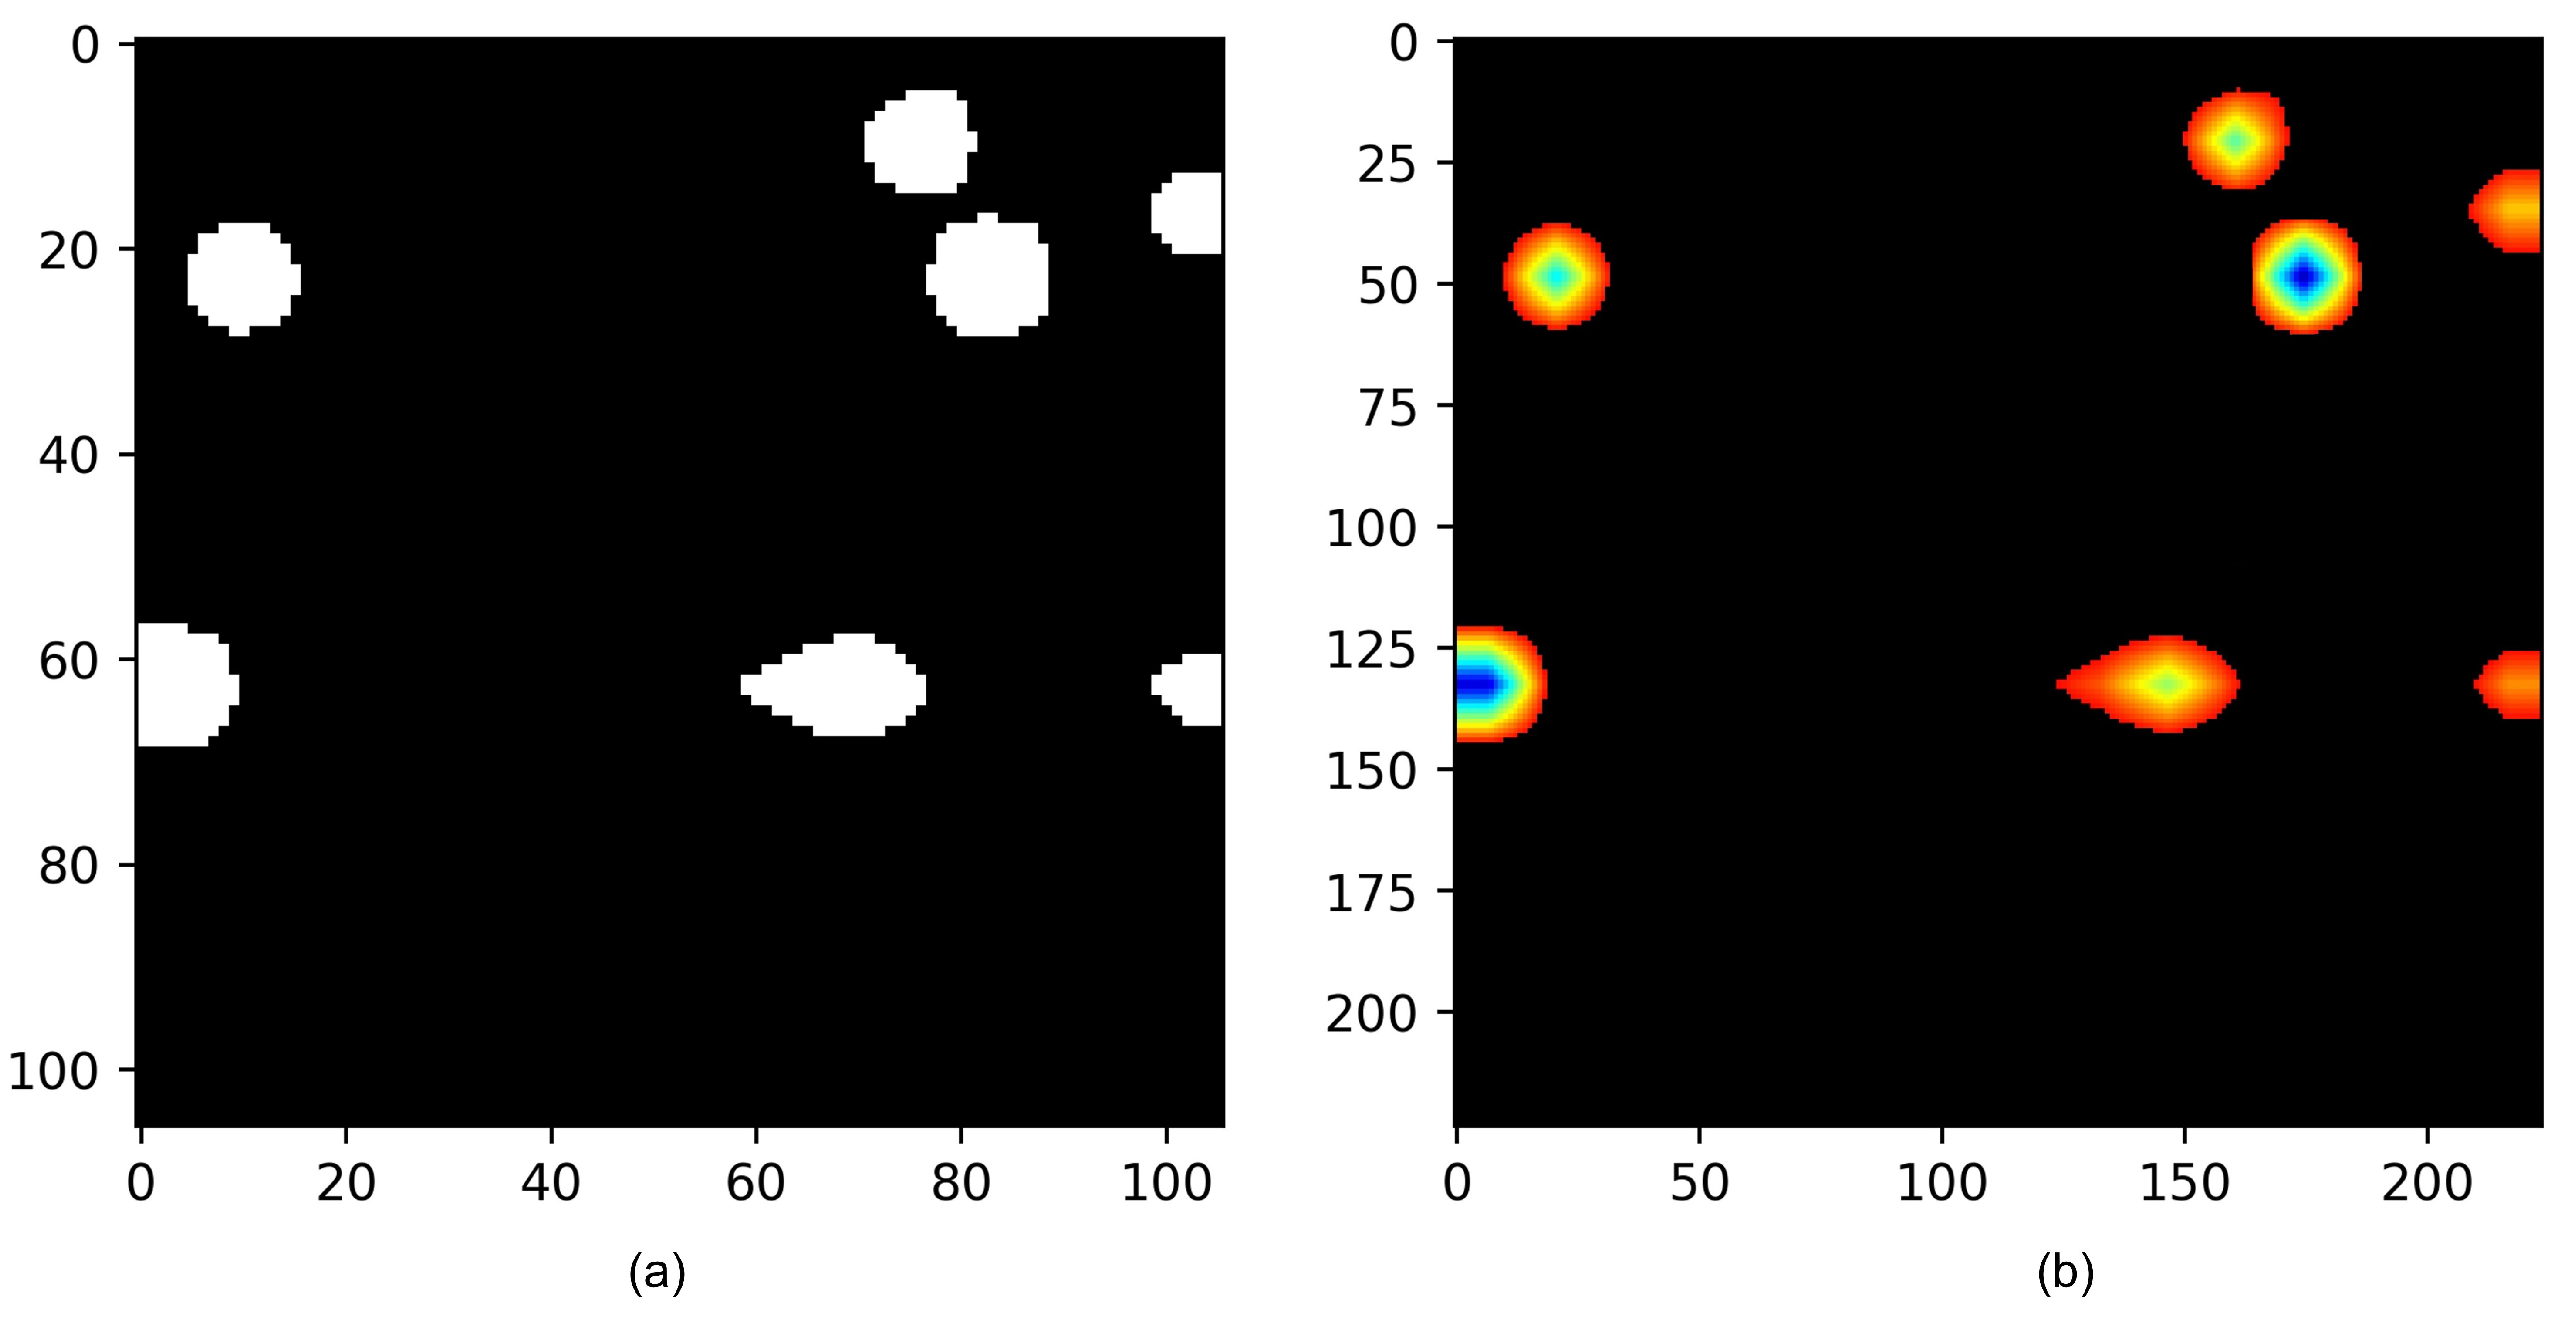
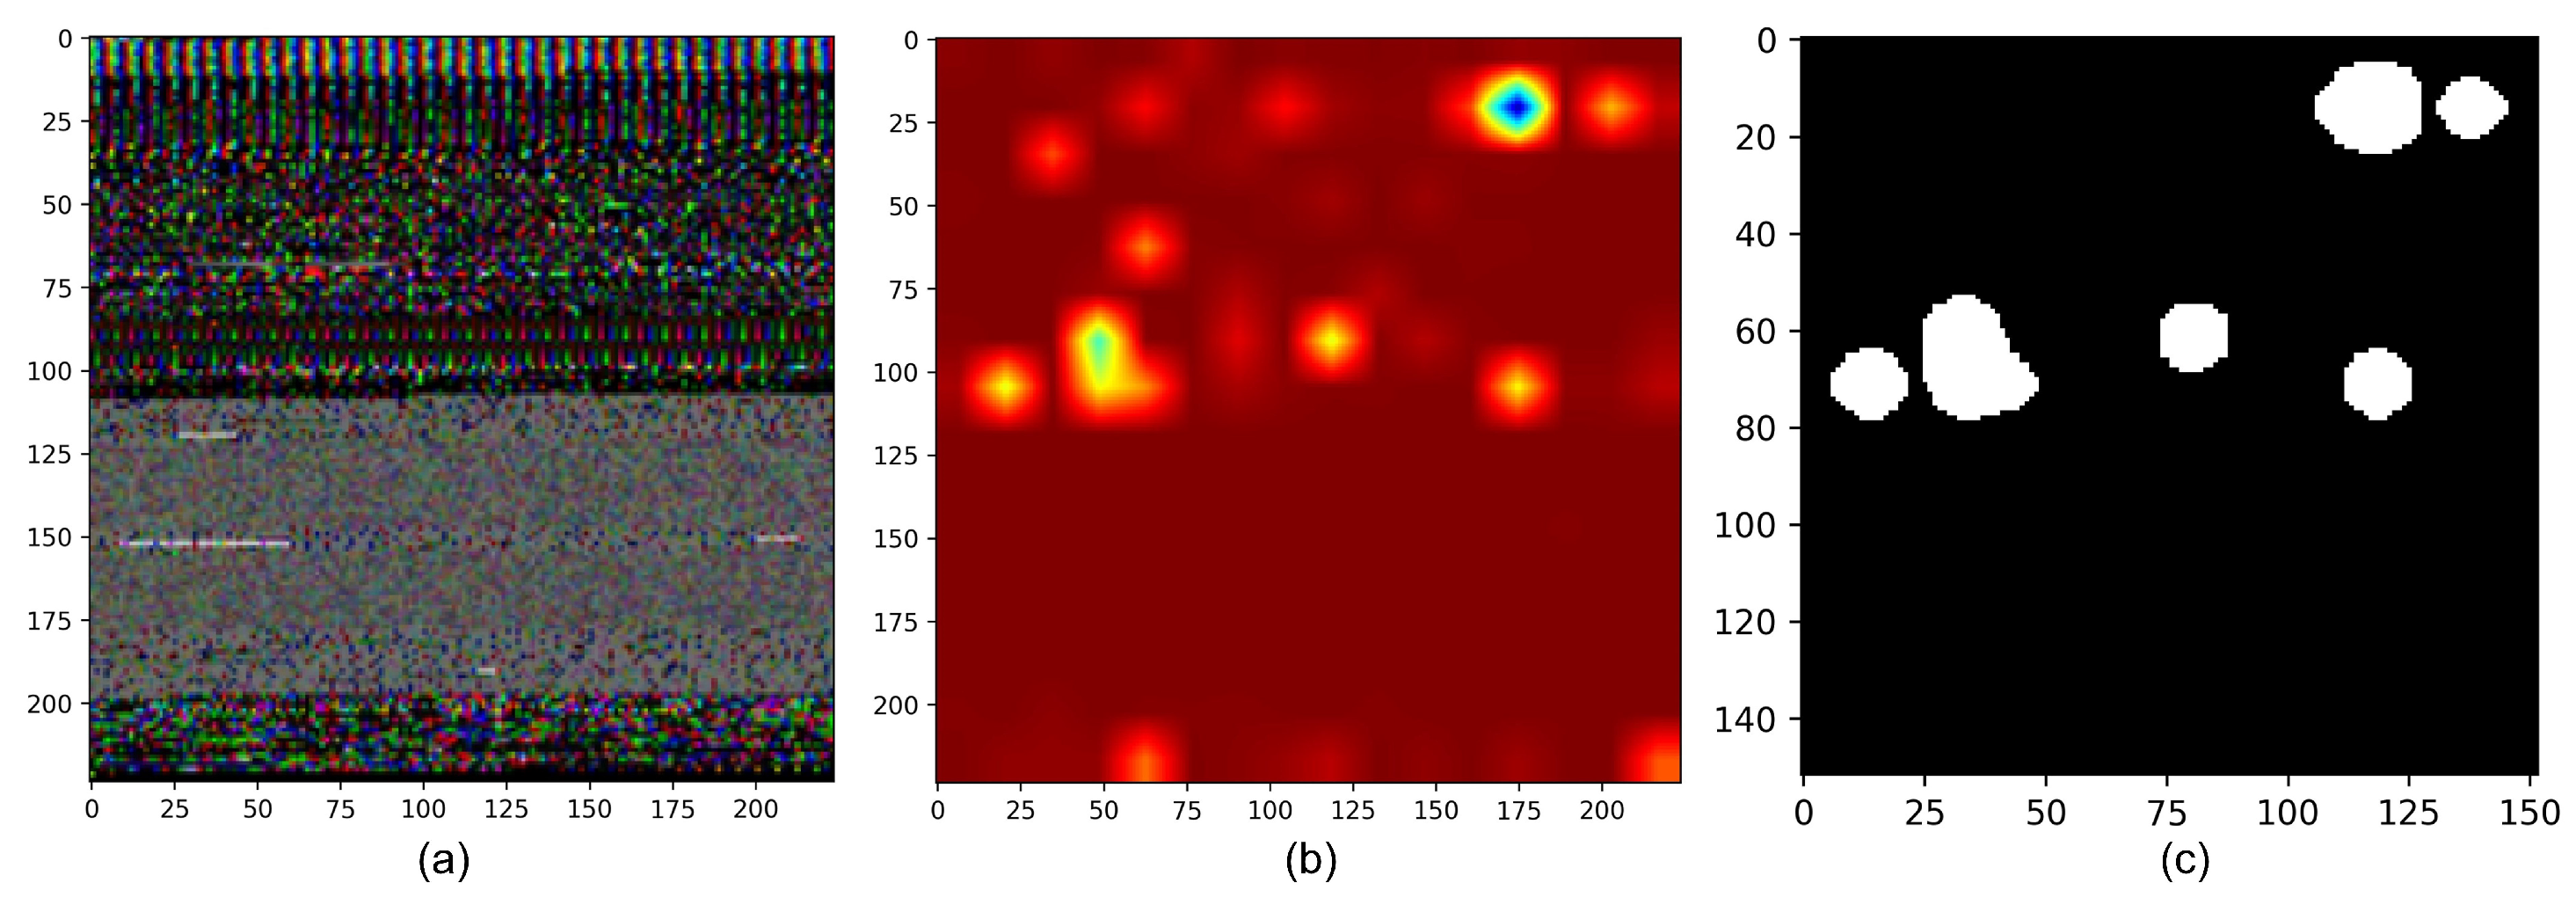
4.4.2. Attention Map

Attention Rollout [24] is used to generate a heatmap of the areas of the dex image, on which the model focuses its attention [20]. In Section 4.3, the model produces a detection result for the input DEX image, and the attention weight is calculated using Equation (6). Here, a heatmap is created using the Attention Rollout method with the attention weight calculated by the model. In each Transformer Encoder layer, the MSA creates an attention weight for each head. Equation (9) shows how these attention weights are combined into an attention matrix at the layer.
W k [ x , y ] = m a x ( W h 0 k [ x , y ] , · · · , W h n k [ x , y ] ) , k = 1 · · · L
where W k is attention matrix at the layer k. L is the total number of encoder layers in the model. x, y are coordinates. n is the index number of attention heads. W h i k , ( 0 i n ) is the attention weights of head i at the layer k. The Attention Rollout method uses the average value, but we use the maximum value to obtain more emphasized values. W k is generated by taking the maximum value of each coordinate in the attention weights of the n heads. Then, we keep the top p percent of elements in W and reset the rest to zero. Each Transformer Encoder layer produces an attention matrix. Next, the following Equation (10) is used to obtain the raw attention A k . The Attention Rollout adds an identity matrix to the attention matrix and renormalizes the weights to account for residual connections.
A k = 0.5 W k + 0.5 I , k = 1 · · · L
where L is the total number of encoder layers in the model. k is the layer number. Therefore, we add the identity matrix to the attention matrix, as in Equation (10), to obtain the raw attention A k . There is a A k for each Transformer Encoder layer [24].
The attention rollout matrix is created using the following Equation (11). The attention rollout matrix of the previous layer is multiplied by the current layer’s raw attention. By repeating this process for all layers from 0 to L, we can obtain the attention rollout matrix A R at the last layer.
A R i = A i × A R i 1 i f i > 0 A i i f i = 0
where A R i is the attention rollout matrix. A i is the raw attention at the layer i, and the multiplication operation is matrix multiplication [24].
In ViT, images are divided into patches, and when image patches are entered into the model, they are prefixed with a class token, as shown in Equation (3). Since detection is performed using class tokens, an attention map needs to be generated based on the attention of the remaining image patches to the class token. Therefore, in the attention rollout matrix, we subtract the first row corresponding to the class token and use the rest of the attention rollout matrix for subsequent processing. Finally, to obtain the attention map, we convert and resize it to fit the image size.

4.4.3. Extraction Function Identifiers

In this step, the high attention score regions of the attention map are selected, and malicious behavior-related class and method names are extracted based on the selected regions of the attention map. High attention score regions are regions in an attention map where the values are particularly high, indicating that the model is focusing more attention on those specific parts of the input data. To select regions in the attention map, the values are sorted in descending order, and only the values with the top p% are used, where p% is predetermined. Applying Equations (12) and (13), the attention map is filtered to remove values below a certain threshold, which helps highlight the relevant features in the data.
Instead of extracting information from as many regions as possible, selecting only the most suitable regions is more efficient [35].
A M [ i , j ] = A M [ i , j ] i f A M [ i , j ] c 0 i f A M [ i , j ] < c
c = a [ ( N × p ) ]
where A M is an attention map. i, j are the coordinates of the attention map. A M is a filtered attention map. a is the attention map changed to a one-dimensional array and sorted in descending order. p is the pre-determined percentile value, given as a rational number between 0 and 1. N is the total number of elements in the attention map matrix.
The following Algorithm 2 is used to change the coordinates of the selected regions to the original dex offset values.
Algorithm 2 Coordinate Conversion Algorithm.
Input:  (x, y)                                         ▹ Attention Point Coordinate
Output:  List with DEX Offset
   1: function ConvertToDexOffsets(x,y)
   2:      x = x × ( o r i g i n a l _ i m a g e _ s i z e / r e s i z e d _ i m a g e _ s i z e )
   3:      y = y × ( o r i g i n a l _ i m a g e _ s i z e / r e s i z e d _ i m a g e _ s i z e )
   4:      d e x _ m m _ l i s t = L i s t ( 3 )
   5:     m m _ i d x = ( ( y × o r i g i n a l _ i m a g e _ s i z e ) + x ) × 3
   6:     d e x _ m m _ l i s t [ 0 ] = m m _ i d x
   7:     d e x _ m m _ l i s t [ 1 ] = m m _ i d x + 1
   8:     d e x _ m m _ l i s t [ 2 ] = m m _ i d x + 2
   9: return  d e x _ m m _ l i s t
 10: end function
Once the region is selected, the DEX components of the selected region should be found. This is performed by converting the selected region to a DEX offset. The process is the reverse of converting the DEX file to an image. In Algorithm 2, first, the scale of the resized image used for the model is calculated. To obtain the offset of the DEX, the coordinates of the selected area are multiplied by the scale of the resized image. Due to the RGB image being used, 3 bytes of the original image were changed to 1 pixel. The first DEX offset is added by 1 and 2 to get three offset values. These are the offset values in DEX. With the DEX offset values obtained, we search for data in the d e x _ s e c t i o n _ d a t a _ m a p in Section 4.4.1.
Finally, the fully qualified names of classes and methods related to the malicious behavior are extracted. Based on the selected regions in the attention map, the values fetched from the d e x _ s e c t i o n _ d a t a _ m a p have DEX field values. This is the information that the malware detection model uses to determine maliciousness. In the d e x _ s e c t i o n _ d a t a _ m a p , the fields related to class and method are stored; thus, getting the class and method names for the data used to determine maliciousness is possible. Here, we can take the class and method names and sort them by frequency of appearance.

5. Experiment

5.1. Experimental Setup

Our experiments were run on Ubuntu 20.04.3 LTS on a single node. The CPU was an Intel(R) Xeon(R) Silver 4210 CPU @ 2.20GHz with 256 GB of RAM and the GPU is a Quadro RTX 8000 48 GB.

5.2. Dataset

Our research to detect malicious apps uses AndroZoo [36], a constantly updated repository of Android apps. We used 1 million apps labeled by using Euphoney [37]. There are 37 labels for malicious apps, excluding those with ambiguous meanings or similar names and fewer instances. AndroZoo is a large-scale imbalanced dataset composed of various malicious apps. In the real-world cybersecurity domain, some malicious app families make up the majority of the total malware [4]. For this reason, we used AndroZoo to evaluate the detection model. In addition to AndroZoo, we also used the CICMalDroid2020 dataset [38]. CICMalDroid2020, which is a categorized dataset of 17,246 Android samples collected from December 2017 to December 2018, with five categories (Adware, Banking Malware, SMS Malware, Riskware, and Benign) [39]. CICMalDroid2020 is a balanced dataset. The families were classified according to the characteristics of malicious apps, and the features of each family were well explained. Therefore, we used this to evaluate the performance of the detection model on a balanced dataset and to experiment with the proposed malicious behavior extraction method.
We experimented with AndroZoo and CICMalDroid2020, respectively. For model training, we used 70% of each of the AndroZoo and CICMalDroid2020 datasets as training sets, with 15% used for validation and the remaining 15% used for testing. The following Table 1 shows the number of samples and the number of malware families in AndroZoo and CICMalDroid2020.
The following Table 2 shows the number of samples for each category in the AndroZoo and CICMalDroid2020 datasets. It shows the number of samples for the 10 categories with the highest number of samples out of 37 categories in the AndroZoo dataset. It can be seen that the entire dataset is an unbalanced dataset, with most of the samples in the ’adware’ and ’trojan’ categories.

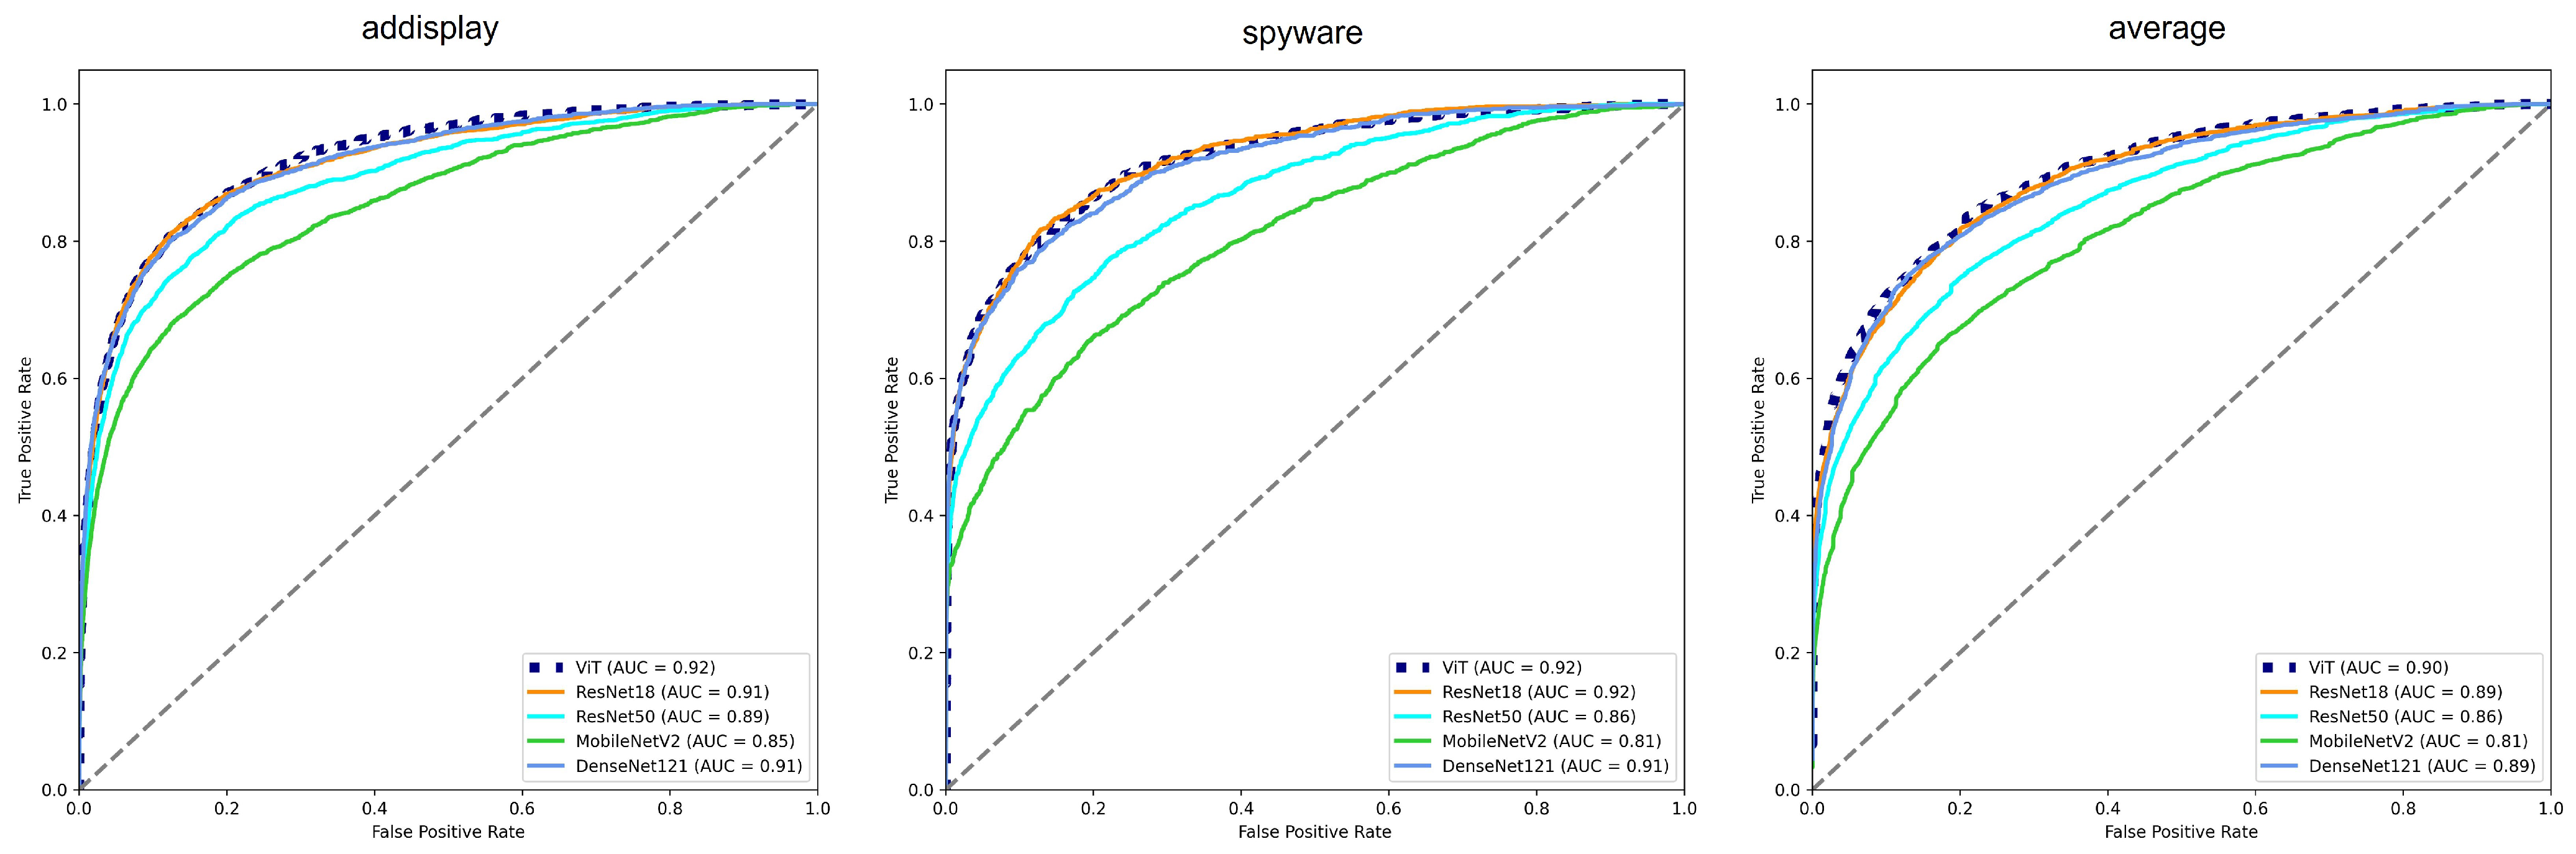
5.3. Malware Detection Model Performance Validation

To measure the performance of our proposed model, we used Accuracy, Precision, Recall, and F1-score. These measures are given in Equations (14)–(16).
P r e c i s i o n = T P T P + F P
R e c a l l = T P T P + F N
F 1 = 2 × P r e c i s i o n × R e c a l l P r e c i s i o n + R e c a l l
Table 3 describes Weighted Average and Macro Average, which are ways to measure the performance of the entire dataset when the data are organized into multiple categories. The macro-averaged F1 score is computed using the arithmetic mean of all the per-category F1 scores. The weighted average F1 score is calculated by taking the average of all per-category F1 scores while taking into account the importance of each category. The weighted average helps to measure the performance across the entire dataset. This means that the weighted average can be more useful when assessing the model’s performance on the whole dataset. The macro average ensures that the performance of minority categories has an equal impact on the overall average. The performance of minority categories is also considered important. Both the weighted average and the macro average are used to obtain both the overall performance evaluation and the performance evaluation considering minority categories of the detection model in the real-world dataset.
Table 3. Metrics for evaluating the performance.
Macro AverageWeighted Average
M a c r o _ p r e c i s i o n = P r e c i s i o n i n
W e i g h t e d _ p r e c i s i o n = w i × P r e c i s i o n i , w i = n i N
M a c r o _ R e c a l l = R e c a l l i n
W e i g h t e d _ R e c a l l = w i × R e c a l l i , w i = n i N
i is each category; n i is the number of samples in category i; N is the total number of samples.

5.4. Accuracy of Malware Detection

The proposed ViT model is compared with well-known CNN-based app family detection models to evaluate its performance.
The input image size for all models was 224 × 224. This is the image size commonly used in image classification models. There is no significant change in detection performance for images above a specific size. The batch size was set to 256 and the epoch to 80. Epoch 80 has been shown to perform well in multiple tests. For image-based malware detection models, CNN-based models are mainly used. ResNet [40], DenseNet [41], MobileNet [42], etc., are popular because they have the advantages of a high performance, stable learning, lightweight models, and applicability to various fields. The our proposed model with the best validation loss during training was used for evaluation.
The structure and parameters of our proposed model are shown in Table 4. Considering the size of the test data, the model was set to 12 for Layers and 8 for Heads. Even if the size of the model parameter was increased, there would be no significant performance improvement.
Table 5 shows the results of the evaluation of the models on the AndroZoo dataset.
Our proposed model achieved an accuracy of 0.8027, which is significantly high in comparison to other deep learning models such as ResNet18, ResNet50, DenseNet121, and MobileNetV2.
The comparison of the deep learning models trained on the CICMalDroid2020 dataset is shown in Table 6.
The CNN model proposed by the Iadarola et al. [7], which used CNN models to interpret detection results by generating heatmap images, was used as a comparative CNN model. Our proposed model has a better performance than the CNN model. Our proposed model achieved an accuracy of 0.8681, which is the third best performance after ResNet18 and DenseNet121, and there was no significant difference in performance. ResNet18 performed well because it can generalize to a relatively small number of data.
The following Figure 3 is the Receiver Operating Characteristic (ROC) curves of each model for the AndroZoo dataset. The AUC value on the macro average, which reflects the model’s performance, ViT leads with 0.90, closely followed by ResNet18 and DenseNet121, each at 0.89.

5.5. Experiment with the Interpretation Process

Here is an example of how the proposed method can extract function identifiers used to detect malicious applications. For this example, we selected a app (sha2: ae1377abf1755523fe96a41456c88230f239ec106041b91ad6282c739072aae0) from the CICMalDroid2020 dataset that is categorized as part of the SMS malware family. The following Figure 4 shows the attention map generated by the Attention Rollout and the filtering of results to keep only the high attention regions of the attention map.
The DEX is converted to an RGB-based image. This image is fed into the model to obtain the model’s detection results. Then, the method in Section 4.4.2 is used to build the model’s attention map for the DEX image. The attention map is drawn as shown in Figure 4a, where areas closer to red are less critical, and areas closer to blue are more important. To select the high attention regions of the attention map, we used Equations (12) and (13) to keep only values above a certain percentile. In Figure 4, typically, the 93rd or 95th percentile is a reasonable threshold for identifying valuable regions. As shown in Figure 4f,g, the high attention regions are clearly visible. Once the region is selected, the Algorithm 2 is used to change it to the DEX offset value. Figure 5 shows how well the selected regions were converted to dex offset values with Algorithm 2.
Both images are identical. Notice that the high attention score regions extracted from the attention map are correctly converted to dex offset values.

Comparison with Malware Detection Interpretation Methods

Our proposed method is compared with existing studies that attempt to classify malicious apps and describe malicious behavior. Table 7 shows studies related to the interpretation of malicious app detection models.
One of the related studies, Iadarola et al. [7], proposed cumulative heatmaps to provide interpretability to image-based detection models. It has been shown that malicious applications belonging to the same malware family reveal similar patterns on the heatmap. In another study, Kinkead et al. [8], an opcode sequence was extracted from the application and used as input. They calculated the local interpretable model-agnostic explanations (LIME) activation and created a line graph image of the activation. The image shows which opcode sequences are highlighted. The other study, XMal, proposed by Wu et al. [9], used API calls and permissions as features. It obtained APIs and permissions from APKs through a preprocessing process. XMal did not use all APIs and permissions but selected 97 APIs and 61 permissions. Then, through a customized model consisting of a fully connected network and attention mechanism, malicious classification was performed and APIs and permissions that could explain malicious behavior were selected.
XMal [9] used a metric similar to the F1-score (Equation (16)) to quantitatively measure how well a model describes the behavior of a malicious application while expressing the interpretation results in natural language. Therefore, we compared XMal and the method proposed in this study with a numerical value. The following Equations (21)–(23) are used to measure interpretability.
p r e c i s i o n d e s c r i p t i o n = d e t e c t _ c o n c e p t s d e t e c t _ c o n c e p t s + s u r p l u s _ c o n c e p t
r e c a l l d e s c r i p t i o n = d e t e c t _ c o n c e p t s t o t a l _ c o n c e p t s
i r d e s c r i p t i o n = 2 × p r e c i s i o n d e s c r i p t i o n × r e c a l l d e s c r i p t i o n p r e c i s i o n d e s c r i p t i o n + r e c a l l d e s c r i p t i o n
where p r e c i s i o n d e s c r i p t i o n is the proportion of d e t e c t _ c o n c e p t s among the concepts in the generated descriptions. r e c a l l d e s c r i p t i o n is the proportion of d e t e c t _ c o n c e p t s among the concepts in the ground truth. d e t e c t _ c o n c e p t s is the number of “concepts” in the ground truth detected by model. s u r p l u s _ c o n c e p t is the number of “concepts” in the generated descriptions that do not exist in the ground truth. t o t a l _ c o n c e p t s is the total number of “concepts” in the ground truth. For a detailed explanation of Equation (23), refer to Wu et al. [9].
Table 8 shows an example of ground truth. The ground truth for malicious samples, which consists of phrases describing the behavior of malicious applications, was generated by security experts. We used the ground truth provided by XMal in our study.
The process of calculating i r d e s c r i p t i o n is as follows. For apps identified as malicious by our model, we extracted the names of the classes and methods using the proposed method. API and permissions are the key features. The API calls in the source code of the extracted class, and the permissions required by the API are extracted. If the extracted class is defined in AndroidManifest.xml, the permissions corresponding to the described intent action are collected. The maximum number of extracted key features is six. The extracted key features are changed to semantics using the rules provided by XMal. Then, the semantics are combined to create a description that describes the app’s behavior. Finally, we extract “concepts” from the generated description and compare the extracted “concepts” with the ground truth of the malware family to calculate i r d e s c r i p t i o n . An example of semantics matching key features can be seen in Table 9.
We compared our i r d e s c r i p t i o n with Xmal’s i r d e s c r i p t i o n . In XMal, they compared the performance with XMal, Drebin [43] and LIME [44]. We referenced the results of Drebin, LIME, and XMal from XMal [9] and compared them with the results of our proposed method.
For comparison with XMal results, we used the same Drebin dataset as XMal to test our proposed method. The comparison was performed on the 10 malware families in the Drebin datasets with the highest number of entries. XMal used 10 randomly selected samples for each family. However, since the samples used in XMal are not specified, we also randomly selected and used 10 samples for each family in the same way as XMal for comparison under the same conditions. The selected samples are used to compute i r d e s c r i p t i o n .
The following Table 10 shows the results of the evaluation of the interpretability, where the results for the comparison methods are from the XMal [9].
Our proposed method has a better interpretability performance than Drebin and LIME. Compared to XMal, our proposed method performs similarly for FakeInstaller, BaseBridge, and Iconosys, slightly worse for Plankton, Opfake, Ginmaster, Kwin, and FakeDoc, and significantly outperforms some malware families, DroidKungFu and Geinimi. For some families, our method performs better, and for others, it is nearly identical. However, our approach has a simple model structure compared to other methods. Considering that our proposed method has simpler feature engineering and interpretation methods, it has fairly high interpretability.
Overall, our approach has significantly better interpretability than Drebin and LIME and is close to XMal. Considering both accuracy and interpretability, our proposed method has high accuracy and high interpretability while describing the interpretation results of the model in a human-understandable form.

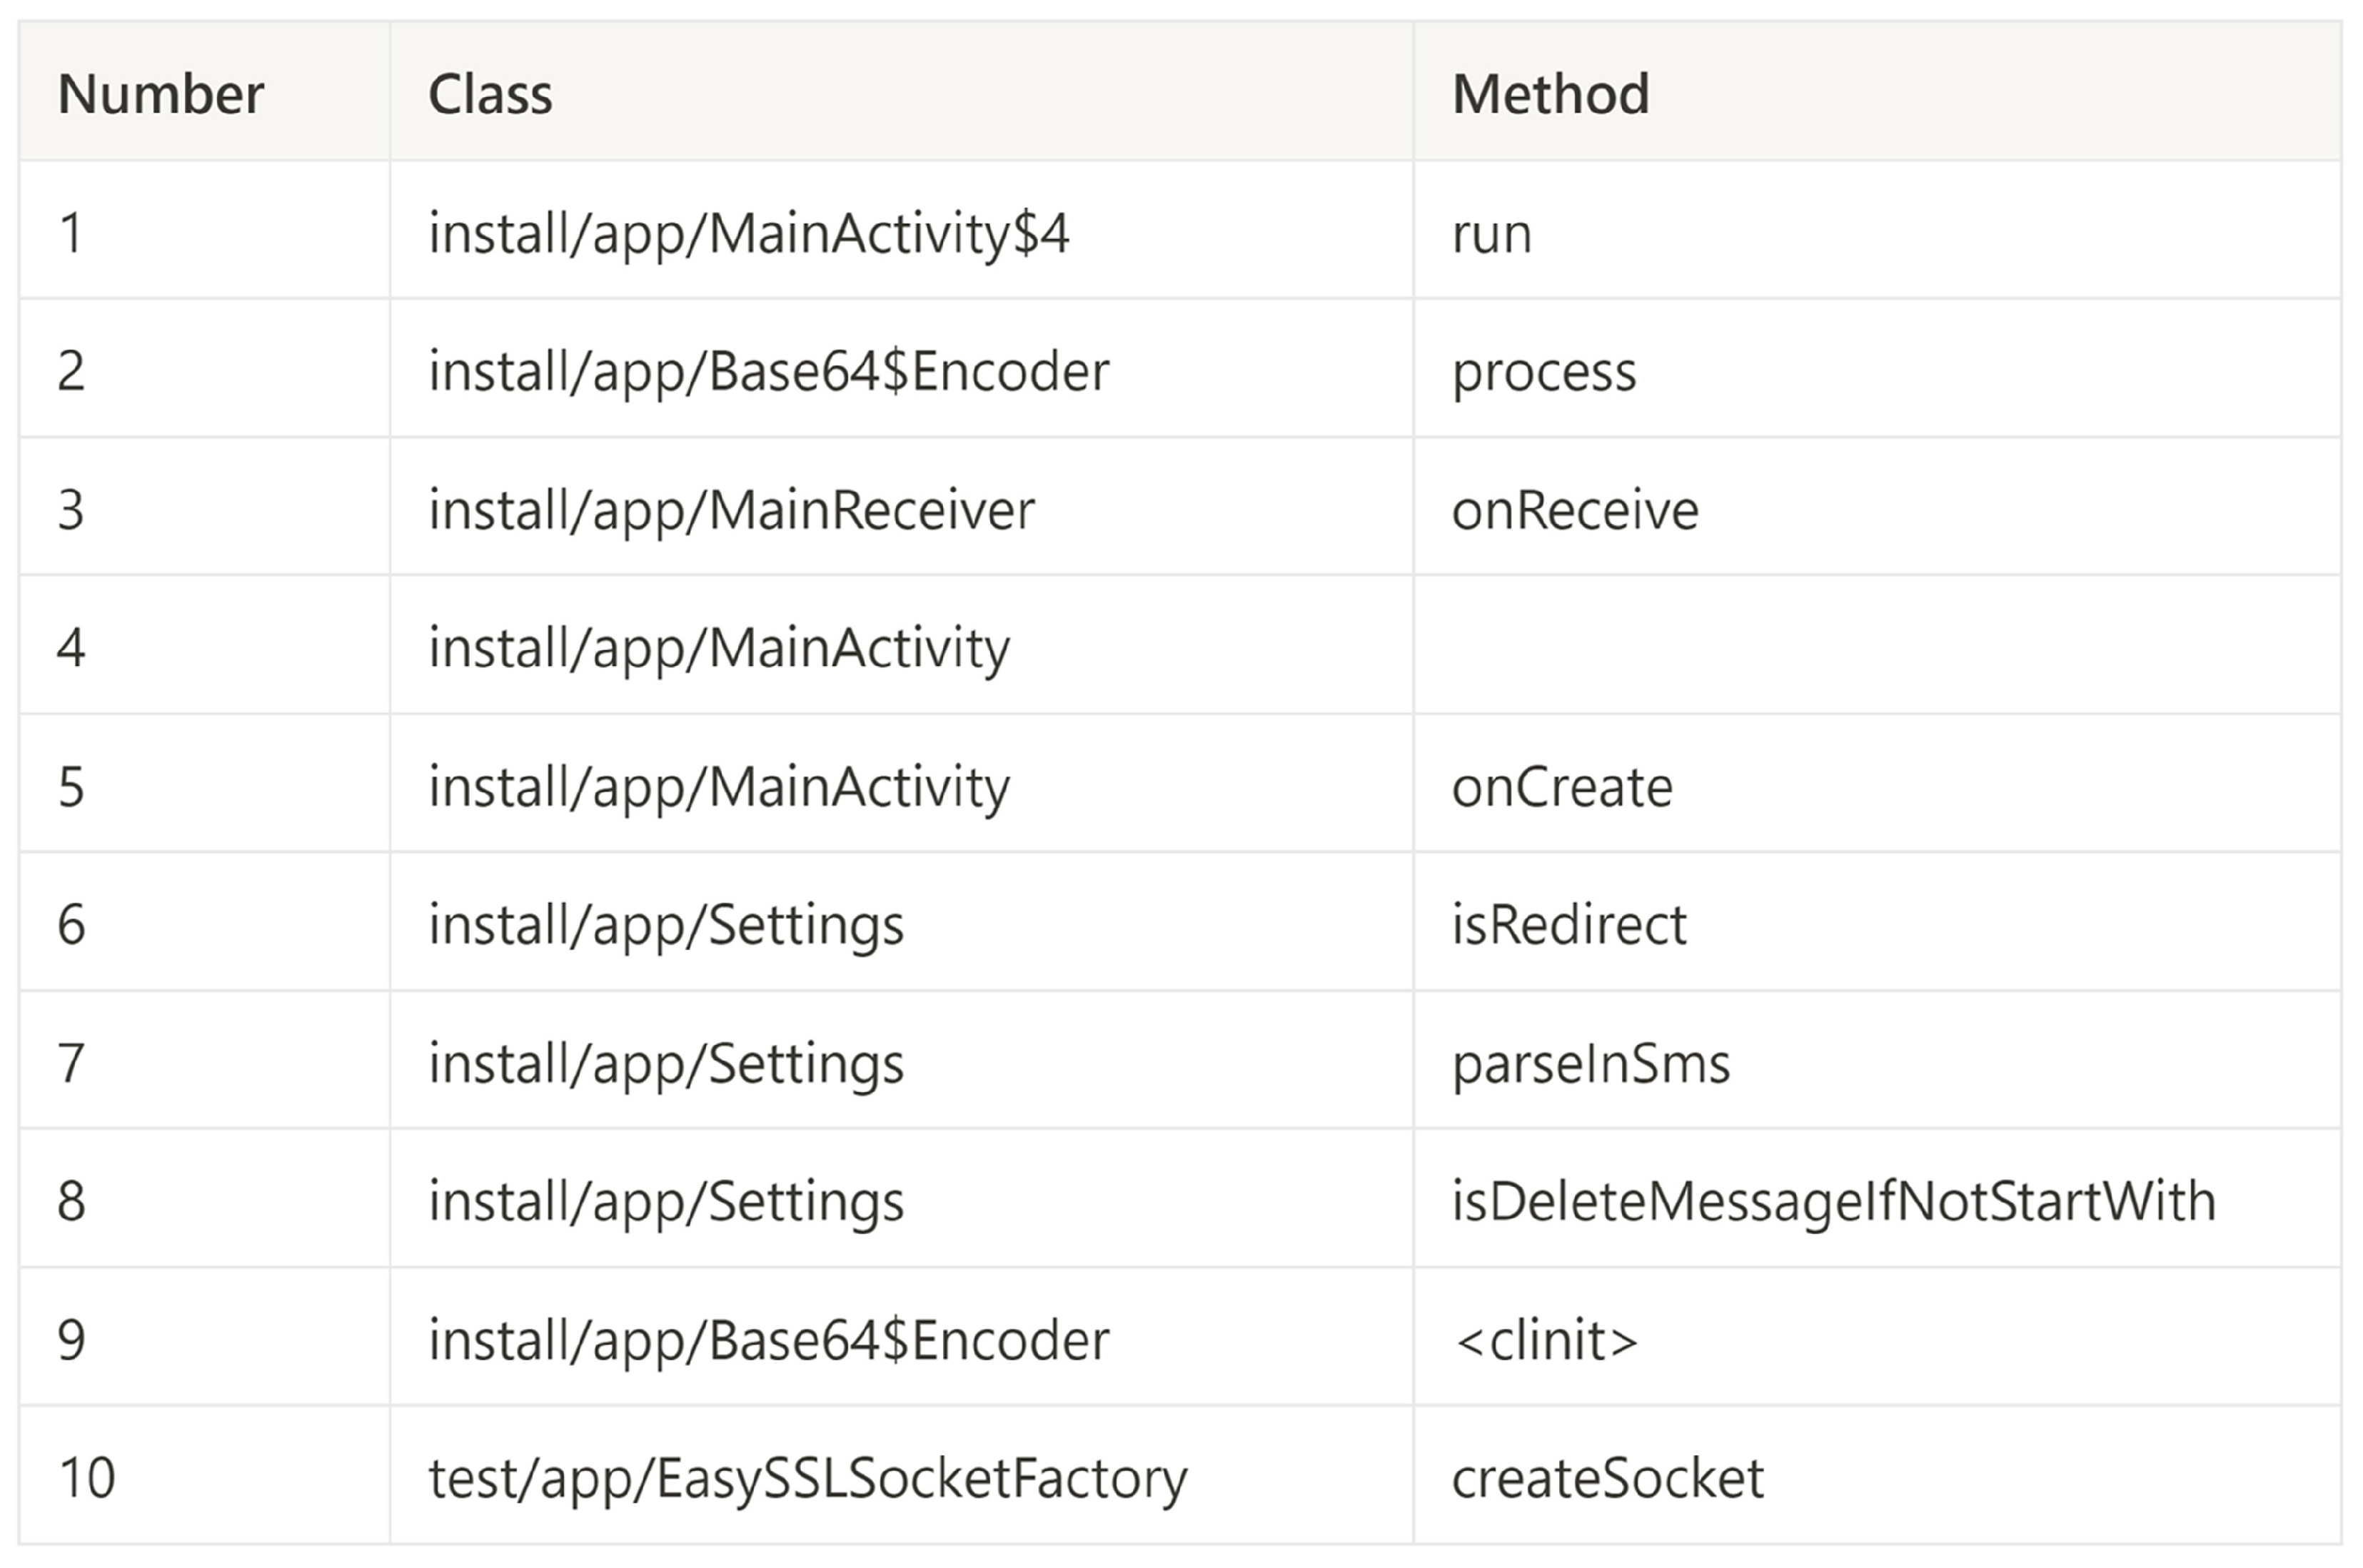
5.6. Example of Extraction Information

It is not sufficient to rely solely on numerical scores to verify that the extracted behavioral information effectively describes the behavior of an application or correlates with the malware type. In addition to validating interpretations based on scores, we also want to demonstrate reliability by explaining the information extracted through static analysis.
Test samples for demonstration are selected from various malware categories. Static analysis is performed based on the extracted information to demonstrate the relationship and validity of the extracted features compared to the application’s behavior. We have experimented with many types of malware, but discuss just one typical example in the following section.

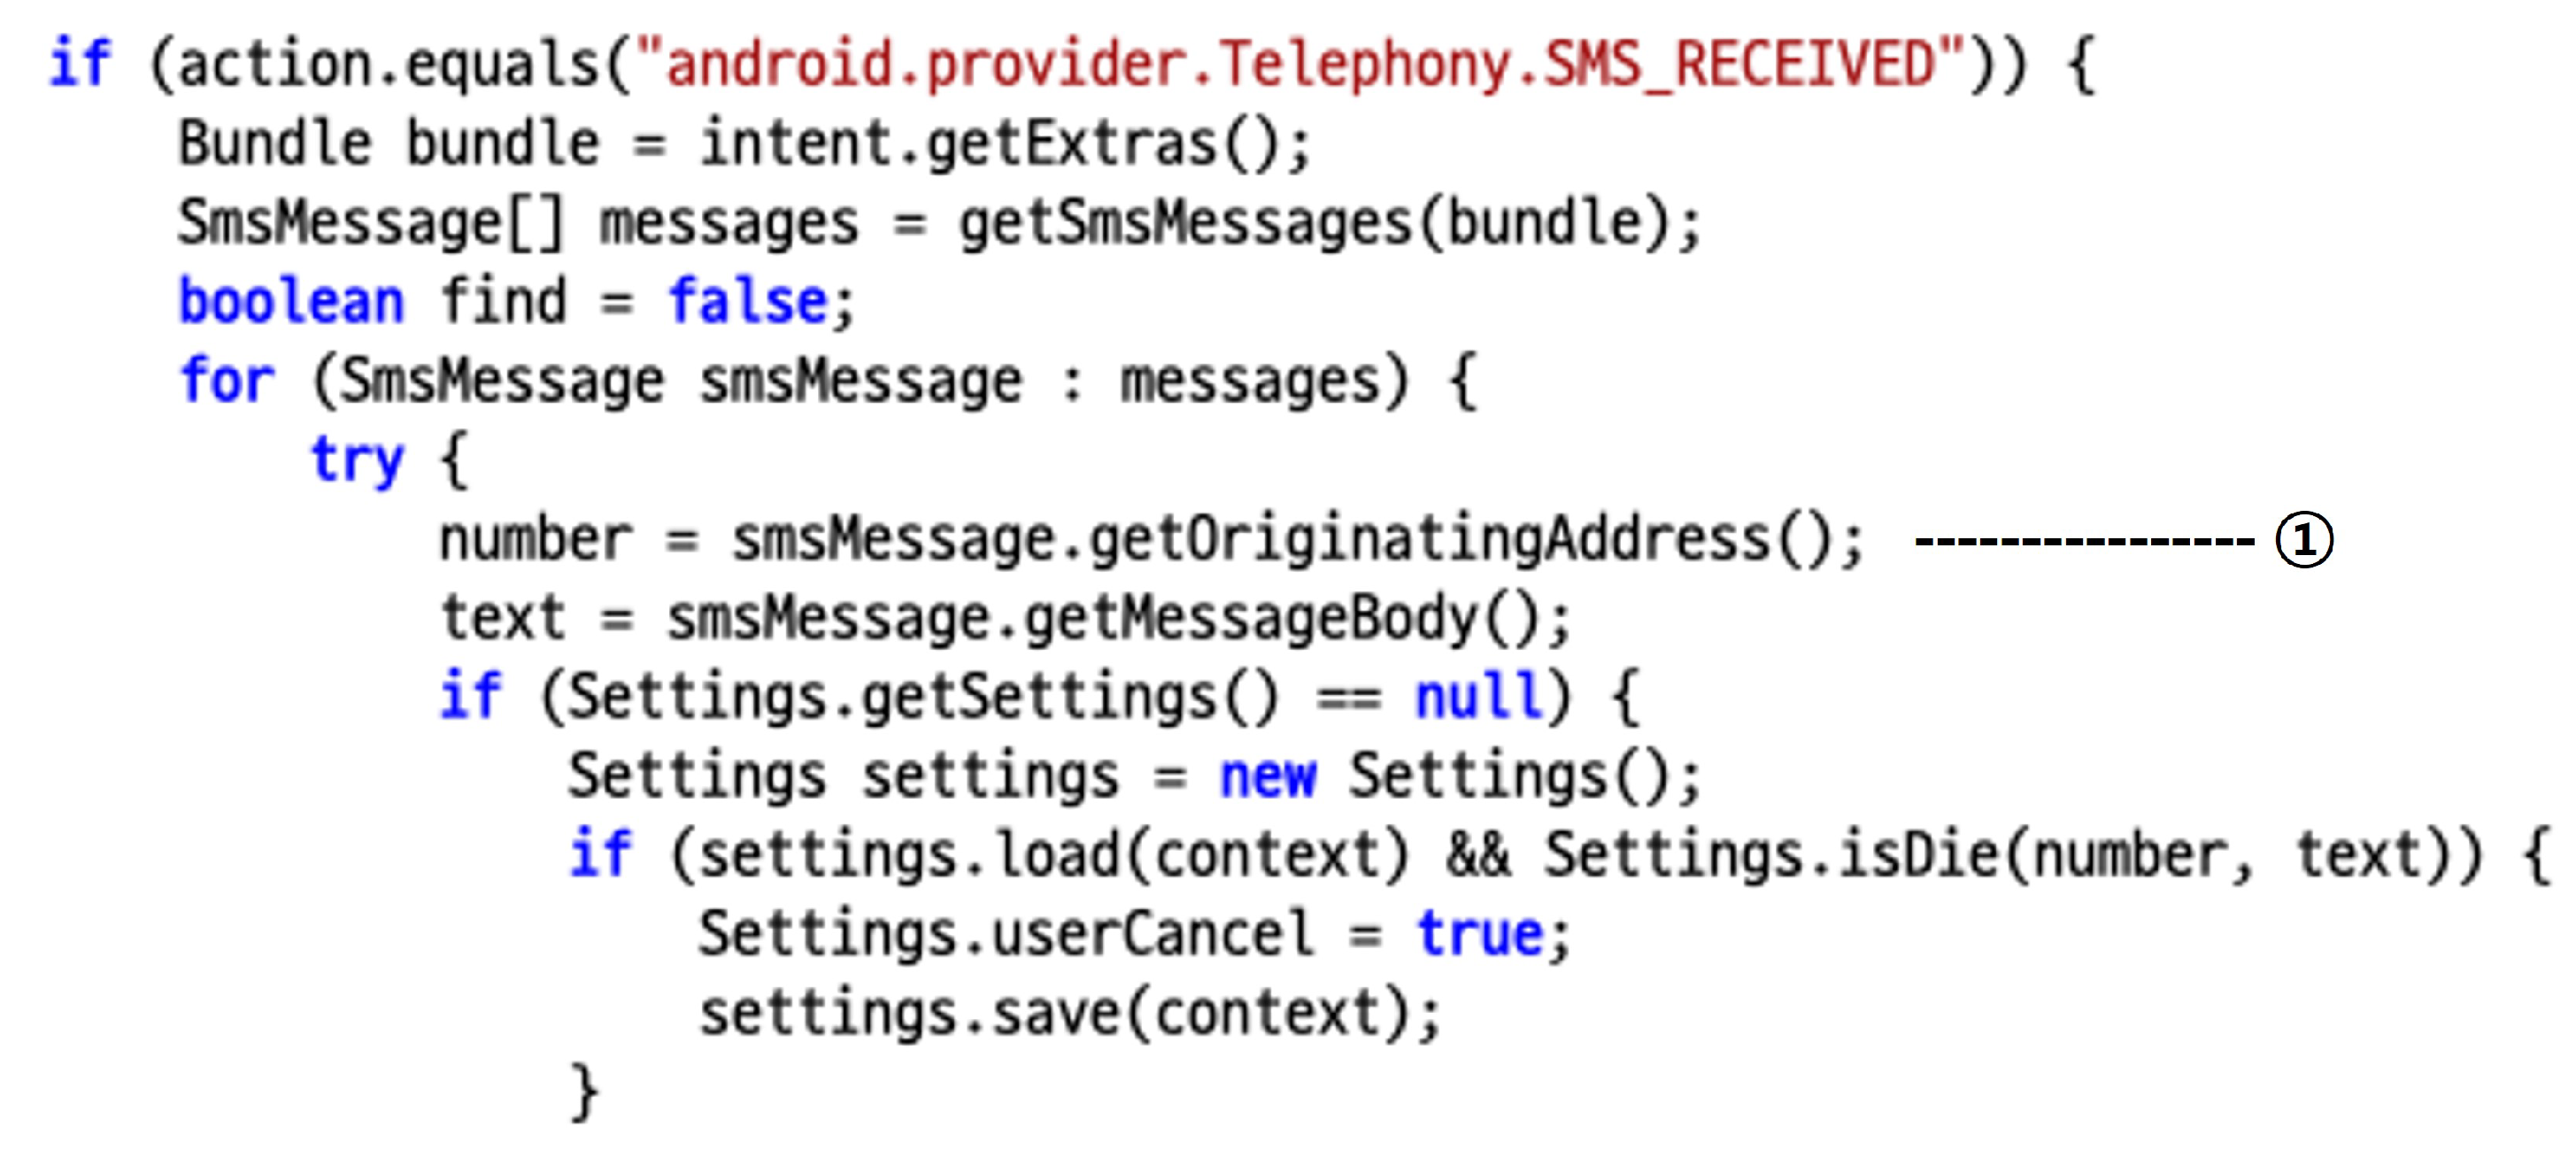
SMS Malware—trojan.fakeinst/smsagent

The sample has a popular threat label on VirusTotal as trojan.fakeinst/smsagent (sha2: 7f38675a778f8aeee0d76d63903f67e06fbdc49de7310a7744466416c8d924ce) and is a malicious mobile application that uses the SMS function to perform malicious actions. This malicious app belongs to the SMS malware family. It is classified as SMS malware by our ViT model. The short message service (SMS) malware sample uses the SMS service to exploit. The attacker uses a command and control (C&C) server to send attack commands. The attacker makes the device send an SMS, intercepts incoming or outgoing SMSs, and steals data. Since this sample has been detected as SMS malware, we start the process of extracting the names of the classes and methods used to determine maliciousness through our proposed method. We begin by creating a heatmap.
a. Make attention map. First, an attention map is generated, and high attention regions are selected. Figure 6a, shows the DEX of the malicious app converted to an image, Figure 6b shows the attention map for a DEX image generated by our proposed method, and Figure 6c shows the selected regions on the attention map.
b. Convert to dex offset. The Algorithm 2 is used to filter out the high attention regions of the attention map and convert them to dex offset values. When the converted dex offset values are plotted as an image, it looks like (c) in Figure 6. In the following Figure 7, the rectangles of the attention map correspond to sections of the DEX.
We can see that the model emphasized many regions of the method section in DEX when it generated the detection results for an application.
c. Extract information. Using the dex offsets from step b, we can obtain the values of the DEX sections in d e x _ s e c t i o n _ d a t a _ m a p of this sample and filter the values to get the names of the classes and methods. Figure 8 shows the fully qualified names of classes and method names extracted by interpreting the model results with our proposed method. We can sort these based on the appearance frequency or attention score of the extracted class and method names. Sorted by priority, the top 10 are shown in order of importance.
We can obtain the app’s source code using the Android decompiler tool and analyze the source code of the extracted classes and methods. First, by analyzing the ’run’ method of the first-ranked ’install/app/MainActivity$4’ class, we can see that it sends device information such as IMEI, PHONE, COUNTRY, APPID, MODEL, MANUFACTURER, and SDK to the command-and-control (C2) server. The main activity includes the ability to display a fake webview screen.
A snippet of the ‘onReceive’ method of the ‘install/app/MainReceiver/’ class, which appears at the 3rd in Figure 8, is shown in Figure 9.
When the device receives an SMS, the application can check the sender’s phone number and the SMS content and change the malicious application’s settings.
Another class, ‘install/app/Settings’, contains settings for malicious activities related to texts and calls, mainly to delete texts containing a specific string or making a call.
From the analysis, it is clear that the extracted behavior-related information mainly contains features related to malicious behavior, especially for apps categorized as SMS-related. The extracted data can help security experts identify or analyze the behavior of malicious applications.

6. Discussion

In Section 5.5, we compared the performance of Drebin, LIME, XMal, and the malicious behavior extraction method of our proposed approach on the same malware dataset. The average performance of our approach is better than Drebin and LIME, but slightly lower than XMal. However, considering that our proposed method has a very simple interpretation method, it is generally effective and easy to apply. In the future, adding additional features or using alternative machine learning techniques to improve overall performance is possible.
Our findings indicate that there is a correlation between extracted class and method names obtained using our proposed approach and the presence of malicious behavior in apps. This supports the assumption that our proposed method can be a useful approach to the identification of malicious behaviors in Android applications.
This study has some limitations. The study lacks validation for applications that use obfuscation techniques such as packing [45]. In applications where the information available in the source code is limited due to obfuscation, our proposed method may not work properly. If the extracted regions are not DEX sections associated with methods or classes, the information that can be obtained may be limited. The interpretation results are currently provided at the class and method level. This may introduce potential uncertainties and may not provide detailed insights for specific applications. However, this issue can be improved by providing specific code snippet locations, thereby enhancing the way images are generated or interpreted.

7. Conclusions

In AI-based cybersecurity, there is an increasing need for model interpretation. As the use of AI for malware detection increases, there is a need to interpret and explain the decision-making process of AI models. However, there is a trade-off between explainability and detection accuracy. We propose an approach to reduce the trade-off between the accuracy and explainability of malicious app detection models.
With our proposed method, it is possible to provide malicious app detection results, and class and method names related to malicious behavior. This method utilizes an image-based detection model and ViT’s attention mechanism. It detects malicious apps, extracts areas that the model considers important through an attention map, and presents the names of classes and methods used for malicious determination. The performance of the detection model was validated on datasets AndroZoo and CICAndMal2020 collected from the real-world. Our proposed model achieved 80.27% accuracy in detecting malicious apps in a large dataset of over 1 million apps. In interpretability evaluation, our proposed method obtained an interpretability score of 0.70, using an evaluation method similar to the F1-score.
Our proposed method has significant interpretability compared to other similar studies. By analyzing several samples for each malware family, it was found that the source codes of the extracted classes and methods were related to malicious behavior. Our proposed method has limitations when apparent malicious behavior cannot be identified from the source code, such as in the case of obfuscated or packed applications.
A highly accurate malicious application detection model, combined with our proposed interpretation method, can provide human-understandable information about the characteristics of the detected threat that led to the classification of the application as malicious. Consequently, users can trust and rely on AI-based security systems. Our proposed method significantly helps security experts to understand the model’s detection results and identify malicious app behavior. In future work, we aim to study how to describe malware behavior in a format close to natural language.

Author Contributions

Conceptualization, J.J.; methodology, J.J.; software, J.J.; validation, J.C. and J.M.; formal analysis, J.J.; investigation, J.J. and J.C.; data curation, J.J.; writing—original draft preparation, J.J.; writing—review and editing, J.C. and J.M.; visualization, J.J.; supervision, J.M.; project administration, J.M. All authors have read and agreed to the published version of the manuscript.

Funding

This research received no external funding.

Institutional Review Board Statement

Not applicable.

Informed Consent Statement

Not applicable.

Data Availability Statement

The data used in this paper can be obtained by contacting the authors.

Acknowledgments

This research was supported by Korea University.

Conflicts of Interest

The authors declare no conflict of interest.

References

  1. Šembera, V.; Paquet-Clouston, M.; Garcia, S.; Erquiaga, M.J. Cybercrime specialization: An exposé of a malicious Android Obfuscation-as-a-Service. In Proceedings of the 2021 IEEE European Symposium on Security and Privacy Workshops (EuroS&PW), Vienna, Austria, 6–10 September 2021; pp. 213–226. [Google Scholar]
  2. Liu, K.; Xu, S.; Xu, G.; Zhang, M.; Sun, D.; Liu, H. A review of android malware detection approaches based on machine learning. IEEE Access 2020, 8, 124579–124607. [Google Scholar] [CrossRef]
  3. Liu, Y.; Tantithamthavorn, C.; Li, L.; Liu, Y. Deep learning for android malware defenses: A systematic literature review. ACM Comput. Surv. 2022, 55, 1–36. [Google Scholar] [CrossRef]
  4. Freitas, S.; Duggal, R.; Chau, D.H. MalNet: A Large-Scale Image Database of Malicious Software. In Proceedings of the 31st ACM International Conference on Information & Knowledge Management, Atlanta, GA, USA, 17–21 October 2022; pp. 3948–3952. [Google Scholar]
  5. Gerlings, J.; Shollo, A.; Constantiou, I. Reviewing the need for explainable artificial intelligence (xAI). arXiv 2020, arXiv:2012.01007. [Google Scholar]
  6. Perarasi, T.; Vidhya, S.; Ramya, P. Malicious vehicles identifying and trust management algorithm for enhance the security in 5G-VANET. In Proceedings of the 2020 Second International Conference on Inventive Research in Computing Applications (ICIRCA), Coimbatore, India, 15–17 July 2020; pp. 269–275. [Google Scholar]
  7. Iadarola, G.; Martinelli, F.; Mercaldo, F.; Santone, A. Towards an interpretable deep learning model for mobile malware detection and family identification. Comput. Secur. 2021, 105, 102198. [Google Scholar] [CrossRef]
  8. Kinkead, M.; Millar, S.; McLaughlin, N.; O’Kane, P. Towards explainable CNNs for Android malware detection. Procedia Comput. Sci. 2021, 184, 959–965. [Google Scholar] [CrossRef]
  9. Wu, B.; Chen, S.; Gao, C.; Fan, L.; Liu, Y.; Wen, W.; Lyu, M.R. Why an android app is classified as malware: Toward malware classification interpretation. ACM Trans. Softw. Eng. Methodol. TOSEM 2021, 30, 1–29. [Google Scholar] [CrossRef]
  10. Zhang, Z.; Hamadi, H.A.; Damiani, E.; Yeun, C.Y.; Taher, F. Explainable Artificial Intelligence Applications in Cyber Security: State-of-the-Art in Research. arXiv 2022, arXiv:2208.14937. [Google Scholar] [CrossRef]
  11. Liu, H.; Yin, Q.; Wang, W.Y. Towards explainable NLP: A generative explanation framework for text classification. arXiv 2018, arXiv:1811.00196. [Google Scholar]
  12. Alzahrani, N.; Alghazzawi, D. A review on android ransomware detection using deep learning techniques. In Proceedings of the 11th International Conference on Management of Digital EcoSystems, Limassol, Cyprus, 12–14 November 2019; pp. 330–335. [Google Scholar]
  13. Zhang, Y.; Yang, Y.; Wang, X. A novel android malware detection approach based on convolutional neural network. In Proceedings of the 2nd International Conference on Cryptography, Security and Privacy, Guiyang, China, 16–18 March 2018; pp. 144–149. [Google Scholar]
  14. Wang, W.; Zhao, M.; Wang, J. Effective android malware detection with a hybrid model based on deep autoencoder and convolutional neural network. J. Ambient. Intell. Humaniz. Comput. 2019, 10, 3035–3043. [Google Scholar] [CrossRef]
  15. Ren, Z.; Wu, H.; Ning, Q.; Hussain, I.; Chen, B. End-to-end malware detection for android IoT devices using deep learning. Ad Hoc Netw. 2020, 101, 102098. [Google Scholar] [CrossRef]
  16. Hsien-De Huang, T.; Kao, H.Y. R2-d2: Color-inspired convolutional neural network (cnn)-based android malware detections. In Proceedings of the 2018 IEEE International Conference on Big Data (Big Data), Seattle, DC, USA, 10–13 December 2018; pp. 2633–2642. [Google Scholar]
  17. Daoudi, N.; Samhi, J.; Kabore, A.K.; Allix, K.; Bissyandé, T.F.; Klein, J. Dexray: A simple, yet effective deep learning approach to android malware detection based on image representation of bytecode. In Proceedings of the Deployable Machine Learning for Security Defense: Second International Workshop, MLHat 2021, Virtual, 15 August 2021; Springer: Berlin/Heidelberg, Germany, 2021; pp. 81–106. [Google Scholar]
  18. Yadav, P.; Menon, N.; Ravi, V.; Vishvanathan, S.; Pham, T. EfficientNet convolutional neural networks-based Android malware detection. Elsevier Comput. Secur. 2022, 115, 102622. [Google Scholar]
  19. Yakura, H.; Shinozaki, S.; Nishimura, R.; Oyama, Y.; Sakuma, J. Malware analysis of imaged binary samples by convolutional neural network with attention mechanism. In Proceedings of the Eighth ACM Conference on Data and Application Security and Privacy, Tempe, AZ, USA, 19–21 March 2018; pp. 127–134. [Google Scholar]
  20. Dosovitskiy, A.; Beyer, L.; Kolesnikov, A.; Weissenborn, D.; Zhai, X.; Unterthiner, T.; Dehghani, M.; Minderer, M.; Heigold, G.; Gelly, S.; et al. An image is worth 16x16 words: Transformers for image recognition at scale. arXiv 2020, arXiv:2010.11929. [Google Scholar]
  21. Khan, S.; Naseer, M.; Hayat, M.; Zamir, S.W.; Khan, F.S.; Shah, M. Transformers in vision: A survey. ACM Comput. Surv. CSUR 2022, 54, 1–41. [Google Scholar] [CrossRef]
  22. Vaswani, A.; Shazeer, N.; Parmar, N.; Uszkoreit, J.; Jones, L.; Gomez, A.N.; Kaiser, Ł.; Polosukhin, I. Attention is all you need. Adv. Neural Inf. Process. Syst. 2017, 2017, 30. [Google Scholar]
  23. Zhao, H.; Jia, J.; Koltun, V. Exploring self-attention for image recognition. In Proceedings of the IEEE/CVF Conference on Computer Vision and Pattern Recognition, Seattle, WA, USA, 13–19 June 2020. [Google Scholar]
  24. Abnar, S.; Zuidema, W. Quantifying attention flow in transformers. arXiv 2020, arXiv:2005.00928. [Google Scholar]
  25. Selvaraju, R.R.; Cogswell, M.; Das, A.; Vedantam, R.; Parikh, D.; Batra, D. Grad-cam: Visual explanations from deep networks via gradient-based localization. In Proceedings of the IEEE International Conference on Computer Vision, Venice, Italy, 22–29 October 2017; pp. 618–626. [Google Scholar]
  26. Zhou, B.; Khosla, A.; Lapedriza, A.; Oliva, A.; Torralba, A. Learning deep features for discriminative localization. In Proceedings of the IEEE Conference on Computer Vision and Pattern Recognition, Las Vegas, NA, USA, 27–30 June 2016; pp. 2921–2929. [Google Scholar]
  27. Chefer, H.; Gur, S.; Wolf, L. Transformer interpretability beyond attention visualization. In Proceedings of the IEEE/CVF Conference on Computer Vision and Pattern Recognition, Virtual, 19–25 June 2021; pp. 782–791. [Google Scholar]
  28. JADX. Available online: https://github.com/skylot/jadx (accessed on 7 January 2023).
  29. dex2jar. Available online: https://github.com/pxb1988/dex2jar (accessed on 7 January 2023).
  30. Apktool. Available online: https://ibotpeaches.github.io/Apktool/ (accessed on 7 January 2023).
  31. Almomani, I.; Alkhayer, A.; El-Shafai, W. An automated vision-based deep learning model for efficient detection of android malware attacks. IEEE Access 2022, 10, 2700–2720. [Google Scholar] [CrossRef]
  32. Wang, Q.; Li, B.; Xiao, T.; Zhu, J.; Li, C.; Wong, D.F.; Chao, L.S. Learning deep transformer models for machine translation. arXiv 2019, arXiv:1906.01787. [Google Scholar]
  33. Ba, J.L.; Kiros, J.R.; Hinton, G.E. Layer normalization. arXiv 2016, arXiv:1607.06450. [Google Scholar]
  34. Dalvik Executable Format. Available online: https://source.android.com/docs/core/runtime/dex-format (accessed on 14 December 2022).
  35. Arras, L.; Osman, A.; Samek, W. Ground truth evaluation of neural network explanations with clevr-xai. arXiv 2020, arXiv:2003.07258. [Google Scholar]
  36. Allix, K.; Bissyandé, T.F.; Klein, J.; Le Traon, Y. AndroZoo: Collecting Millions of Android Apps for the Research Community. In Proceedings of the 13th International Conference on Mining Software Repositories, Austin, TX, USA, 14–15 May 2016; ACM: New York, NY, USA, 2016; pp. 468–471. [Google Scholar]
  37. Hurier, M.; Suarez-Tangil, G.; Dash, S.K.; Bissyandé, T.F.; Traon, Y.L.; Klein, J.; Cavallaro, L. Euphony: Harmonious unification of cacophonous anti-virus vendor labels for Android malware. In Proceedings of the 14th International Conference on Mining Software Repositories, Buenos Aires, Argentina, 20–28 May 2017; pp. 425–435. [Google Scholar]
  38. Mahdavifar, S.; Kadir, A.F.A.; Fatemi, R.; Alhadidi, D.; Ghorbani, A.A. Dynamic android malware category classification using semi-supervised deep learning. In Proceedings of the 2020 IEEE Intlernational Conference on Dependable, Autonomic and Secure Computing, Intlernational Conference on Pervasive Intelligence and Computing, Intlernational Conference on Cloud and Big Data Computing, Intlernational Conference on Cyber Science and Technology Congress (DASC/PiCom/CBDCom/CyberSciTech), Calgary, AB, Canada, 17–22 August 2020; pp. 515–522. [Google Scholar]
  39. Mahdavifar, S.; Alhadidi, D.; Ghorbani, A.A. Effective and efficient hybrid android malware classification using pseudo-label stacked auto-encoder. J. Netw. Syst. Manag. 2022, 30, 1–34. [Google Scholar] [CrossRef]
  40. He, K.; Zhang, X.; Ren, S.; Sun, J. Deep residual learning for image recognition. In Proceedings of the IEEE Conference on Computer Vision and Pattern Recognition, Las Vegas, NV, USA, 27–30 June 2016; pp. 770–778. [Google Scholar]
  41. Huang, G.; Liu, Z.; Van Der Maaten, L.; Weinberger, K.Q. Densely connected convolutional networks. In Proceedings of the IEEE Conference on Computer Vision and Pattern Recognition, Honolulu, HI, USA, 21–26 July 2017; pp. 4700–4708. [Google Scholar]
  42. Sandler, M.; Howard, A.; Zhu, M.; Zhmoginov, A.; Chen, L.C. Mobilenetv2: Inverted residuals and linear bottlenecks. In Proceedings of the IEEE Conference on Computer Vision and Pattern Recognition, Salt Lake City, UT, USA, 18–22 June 2018; pp. 4510–4520. [Google Scholar]
  43. Arp, D.; Spreitzenbarth, M.; Hubner, M.; Gascon, H.; Rieck, K.; Siemens, C. Drebin: Effective and explainable detection of android malware in your pocket. Ndss 2014, 14, 23–26. [Google Scholar]
  44. Ribeiro, M.T.; Singh, S.; Guestrin, C. “Why should i trust you?”. Explaining the predictions of any classifier. In Proceedings of the 22nd ACM SIGKDD International Conference on Knowledge Discovery and Data Mining, San Francisco, CA, USA, 13–17 August 2016; pp. 1135–1144. [Google Scholar]
  45. Duan, Y.; Zhang, M.; Bhaskar, A.V.; Yin, H.; Pan, X.; Li, T.; Wang, X.; Wang, X. Things You May Not Know About Android (Un) Packers: A Systematic Study based on Whole-System Emulation. In Proceedings of the NDSS, San Diego, CA, USA, 18–21 February 2018. [Google Scholar]
Figure 1. A malware detection and related information extraction method using the ViT attention mechanism.
Applsci 13 06839 g001
Figure 2. The Transformer Encoder used in Vision Transformer [20].
Applsci 13 06839 g002
Figure 3. ROC curves for ’addisplay’ and ’spyware’ categories alongside the macro average ROC curve for all categories within the AndroZoo dataset.
Applsci 13 06839 g003
Figure 4. The attention maps that map have been filtered to remove values below a certain threshold percentage. (ai) are the percentile values, which means 0, 25, 50, 75, 90, 93, 95, 97, and 100.
Applsci 13 06839 g004
Figure 5. Attention points changed to DEX offset values. (a) is a 2D image of the d e x _ m m _ l i s t generated by Algorithm 2. (b) is a selected high attention region of the attention map.
Applsci 13 06839 g005
Figure 6. (a) DEX image of trojan.fakeinst/smsagent, (b) attention map, (c) an image representation of the DEX offset values of the highlighted regions of the DEX.
Applsci 13 06839 g006
Figure 7. The rectangles on the attention map are the regions selected in step a. and indicate which DEX section the rectangle corresponds to. DEX sections are color-coded.
Applsci 13 06839 g007
Figure 8. Class and method names extracted by our proposed method.
Applsci 13 06839 g008
Figure 9. Snippet of the ‘onReceive’ method of the ‘install/app/MainReceiver’ class. This is related to SMS.
Applsci 13 06839 g009
Table 1. The number of samples and the number of families in the datasets.
DatasetNumber of SamplesNumber of Categories
AndroZoo1,046,19037
CICMalDroid202017,2465
Table 2. The number of samples in the categories of the AndroZoo and CICMalDroid2020 datasets.
DatasetCategoryNumber of Samples
AndroZooadware771,299
trojan163,671
riskware30,534
addisplay14,310
spr10,104
spyware7559
smssend7055
troj6139
exploit5395
clicker4412
CICMalDroid2020SMS4822
Riskware4362
Benign4042
Banking2506
Adware1514
Table 4. Configuration of Proposed VIT Model.
ModelLayersHidden Size DMLP SizeHeadsPatch Size
our proposed model121282048814
Table 5. Malware-type detection scores for our proposed model and four popular CNN-based models on the AndroZoo dataset.
ModelAccuracyF1 ScorePrecisionRecallF1 ScorePrecisionRecall
Weighted AvgMacro Avg
our proposed model0.80270.77430.77750.80270.31130.52190.2509
ResNet180.80050.77370.77620.80050.27480.48000.2207
ResNet500.78430.75140.75280.78430.22300.37670.1803
DenseNet1210.80470.77700.77640.80470.23970.38310.1983
MobileNetV20.77010.72580.73330.77010.17760.38030.1381
Table 6. Evaluation of malware type detection on CICMalDroid2020 dataset for our proposed model.
ModelAccuracyF1 ScorePrecisionRecallF1 ScorePrecisionRecall
Weighted AvgMacro Avg
our proposed model0.86810.87010.87530.86810.84220.83860.8521
CNN [7]0.81070.80930.80900.81070.77340.78090.7676
ResNet180.88590.88590.88690.88590.86170.86580.8585
ResNet500.85250.85340.85530.82360.81900.81570.8236
DenseNet1210.90720.90710.90710.90720.88660.88830.8852
MobileNetV20.79440.79250.79130.79440.74230.74640.7392
Table 7. Studies that provide the basis for malicious app detection or extract the functionality of malicious apps through the interpretation of malware detection models.
WorkYearModelFeaturesExplanation MethodExplanation Result
Iadarola et al. [7]2021CNNDEX grayscale ImageGrad-CAMcumulative heatmap image
Kinkead et al. [8]2021CNNopcode sequenceLIMEVisualizing activations
Wu et al. [9]2021XMalAPI calls and Permissionscustomised attention mechanismnatural language descriptions
Our approach-ViTDEX RGB Imageattention mechanismString, Class/Method Name
Table 8. Ground truth example of malware behavior concepts for the Adrd malware family. Wu et al. [9] has created behavioral concepts for malware families through security analysis experts. Data from Wu et al. [9].
No.Concept
1activate
2the mobile device is booted up
3access the Internet
4download components
5steal some info
6send to remote server
Table 9. Example of a semantic that matches an API, permission key. Data from [9].
FeatureSemantic
Ljava/net/URL; ->openConnectionAccess the Internet
Landroid/telephony/TelephonyManager; -> getDeviceIdCollect device ID(IMEI)
Landroid/telephony/gsm/SmsManager; ->sendDataMessageSend SMS message
Ljava/lang/Runtime; ->getRuntimedownload components
android.permission.READ_SMSCollect SMS
android.permission.RECEIVE_BOOT_COMPLETEDActivited by BOOT
Table 10. i r d e s c r i p t i o n values of Drebin, LIME, XMal, and Our Proposed method.
Malware FamilyDrebinLIMEXMalOur Approach
FakeInstaller0.250.250.350.37
DroidKungFu0.440.500.660.83
Plankton0.500.570.800.60
Opfake0.440.850.880.40
Ginmaster0.750.750.920.83
BaseBridge0.200.730.890.88
Iconosys0.440.850.850.86
Kwin0.440.750.930.88
FakeDoc0.500.570.660.56
Geinimi0.400.600.750.82
Average0.430.640.760.70
Disclaimer/Publisher’s Note: The statements, opinions and data contained in all publications are solely those of the individual author(s) and contributor(s) and not of MDPI and/or the editor(s). MDPI and/or the editor(s) disclaim responsibility for any injury to people or property resulting from any ideas, methods, instructions or products referred to in the content.

