Abstract
Although approximately one-tenth of the world’s population lives near volcanoes, most of the 1500 active volcanoes are not monitored by ground-based instruments because of the cost and difficulty of access. Since the development of interferometric synthetic aperture radar (InSAR) in the 1990s, recent advances have allowed the near-real-time detection of surface deformations, one of the earliest markers of volcanic activity. According to the Global Volcanism Program, Turkey’s most recent eruption (involving gas and ash) occurred in the Tendürek volcano in 1885. An explosion in the Tendürek volcano, which continues to actively output gas and steam, would be a critical issue for the life and property of the people living nearby. In this context, we processed the Sentinel-1 data collected by the European Space Agency using the Stanford Method for Persistent Scatterers, and the surface deformations of the Tendürek volcano were investigated. In addition, we applied two different atmospheric correction approaches (linear phase-based tropospheric correction and the Generic Atmospheric Correction Online Service for InSAR) to reduce atmospheric effects and found that the linear phase-based tropospheric correction model produced lower standard deviation values. Subsequently, the mean deformation velocity maps, displacement time series, and deformation components in the line-of-sight direction were calculated. The results showed that the most severe subsidence was −11 mm/yr on the upper slopes of the Tendürek volcano. Although the lower slopes of the subsidence region have a lower settlement rate, the subsidence has a peak-caldera-centered location.
1. Introduction
Natural disasters have negative socioeconomic effects on societies, causing severe threats to people, other living things, and the natural and built environment [1]. Although the effects of volcanic eruptions have been relatively minor compared to other natural disasters in the last two centuries, the eruption of the Pelee volcano (France) in 1902 caused 30,000 deaths, the eruption of the Nevado del Ruiz volcano (Colombia) in 1985 caused 25,000 deaths, and the eruption of the Eyjafjallajokull volcano (Iceland) in 2010 caused the closure of European airspace and losses of more than $1.7 billion in revenue [2,3,4,5]. Furthermore, it is estimated that more than 29 million people worldwide live within 10 km of approximately 1500 Holocene volcanoes, which have been active within the last 10,000 years, and the rapidly increasing world population and expansion of urban centers also increase the exposure of societies to volcanic eruptions [6,7,8]. Although improvements in volcanic activity forecasting and monitoring have shown that the knock-on effects of volcanic eruptions can be minimized and/or avoided, a significant proportion of Holocene volcanoes are not regularly monitored by ground-based methods [8,9,10]. Monitoring surface deformation, which is one of the earliest signs of volcanic activity and can be detected by ground-based methods (e.g., tiltmeter and GPS), requires installation in remote and inaccessible areas, and the temporal and spatial resolution of the measurements is limited [11]. Moreover, recent advances in interferometric synthetic aperture radar (InSAR) have enabled the creation of deformation maps with high temporal and spatial resolution, supporting the detection of unrest in many volcanoes [12,13]. In addition to its frequent use for investigating volcanoes [14,15,16], InSAR has also proven to be a powerful geodetic tool for monitoring ground deformations caused by earthquakes [17,18,19], landslides [20,21,22], and land subsidence [23,24,25,26], owing to its ability to cover large areas, work in all weather conditions, and operate all day. However, the use of InSAR is greatly limited by temporal decorrelation, atmospheric effects, and orbital errors [27]. To overcome these limitations, researchers have developed time series analysis, namely multi-temporal InSAR techniques, e.g., [28,29,30]. Permanent scatterer interferometry (PSI), which is one of these techniques and was first proposed by [28], defines scatterers as exhibiting stable scattering behavior over time; however, this technique is limited in non-urban areas because of the low PS density [31,32]. Unlike other PSI techniques, the Stanford method for persistent scatterers (StaMPS) can be used for all terrains because it uses the spatial correlation of the interferometric phase to detect surface deformations occurring in non-urban areas and does not require a temporal deformation model describing how the deformation changes over time [31,33]. Considering these advantages, StaMPS is frequently used for the long-term monitoring of ground deformations in volcanic areas where other PSI approaches are less successful. In previous studies, StaMPS has been applied worldwide for monitoring surface deformations caused by volcanoes, including the Alcedo volcano in Ecuador [33], Piton de la Fournaise in France [34], the Changbaishan Tianchi volcano in China [35], the Santorini volcano in Greece [36], the Shinmoe-dake volcano in Japan [37], the Medicine Lake volcano in the United States [38], and Mount Etna in Italy [39].
In Turkey, which ranks 14th among 95 countries in terms of volcanic threat and has 10 volcanic systems that have been active within the last 10,000 years according to the Global Volcanism Program, there are limited studies in which the surface deformations caused by volcanoes are monitored using InSAR. In one of these studies, ref. [40] used ERS satellite images and single and double-pass interferometric techniques to detect surface deformations in the Tendürek volcano. As a result of the study carried out between 1993 and 2000, a total of 10–20 cm subsidence was detected at the summit of the Tendürek volcano. Another study performed in the same area, reported by [41], aimed to detect the surface deformations of the Tendürek volcano using 41 Envisat images obtained from descending and ascending orbits between 2003 and 2020. In their study, using the small baseline subset technique, an 11 mm/yr subsidence was reported as a result of the narrowing of a sill located 4.5 km below the volcano peak. The most comprehensive study on surface deformations caused by volcanoes in Turkey was carried out by [42]. They aimed to determine the surface deformations that occur in 10 volcanic systems in Turkey using approximately 5000 Sentinel-1 images obtained from the ascending and descending orbits between 2015 and 2020. The study mainly focused on the seasonal snow cover that reduces the interferometric consistency encountered when monitoring the volcanoes with the InSAR technique and the atmospheric problems that cause misinterpretation of deformation. In the study, in which the multi-time InSAR technique was used, it was reported that no deformation on the cm scale was detected in the 10 volcanic systems in Turkey, which shows that there are significant differences among the results from the limited number of studies on the Tendürek volcano. Considering the studies above, the last detailed InSAR study of the Tendürek volcano was performed with data from 13 years ago [41]. In another subsequent research, it was examined on a national scale, and a detailed study of the Tendürek volcano was not carried out [42]. Therefore, the present study offers two novelties in terms of the literature. The first of these is the use of up-to-date data and a detailed study specific to the Tendürek volcano. The second innovative aspect of the present study is that the permanent scatterer interferometry technique is used for the first time in this volcano. In addition, the current surface deformation maps and findings obtained from the Tendürek volcano, as a result of this study, will contribute significantly to the literature.
In this context, the main purpose of the present study is to determine the current surface deformations of the Tendürek volcano using StaMPS and to reveal the evolution of surface deformations over 5 years using the SAR time series. A total of 150 Sentinel-1 images were obtained from the ascending and descending acquisition geometries between 2018 and 2022, and surface deformations of the Tendürek volcano were determined using the SentiNel application platform (SNAP), snap2stamps, StaMPS, and atmospheric InSAR noise-reduction toolbox (TRAIN). In addition, we applied two different atmospheric correction approaches (linear phase-based tropospheric correction and the General Atmospheric Correction Online Service (GACOS) for InSAR) to minimize the errors caused by atmospheric interactions. Finally, the current deformation velocity maps in the line-of-sight direction (LOS), the displacement time series, and the components of the deformation (horizontal vertical) in the LOS direction were calculated for the Tendürek volcano and its vicinity.
2. Materials and Methods
2.1. Study Area
The Tendürek volcano is located between 39°22′ N and 39°46′ N latitudes and 43°70′ E and 44°05′ E longitudes, covering an area of approximately 600 km2 at an altitude of 3514 m above sea level (Figure 1a). It is located in the Eastern Anatolia region of Turkey, with Çaldıran located to the south of the volcano, Diyadin to the northwest, and Doğubeyazıt to the northeast. Approximately 2 million people live within 100 km. The last eruption (gas and ash) of the Tendürek volcano occurred in 1855.
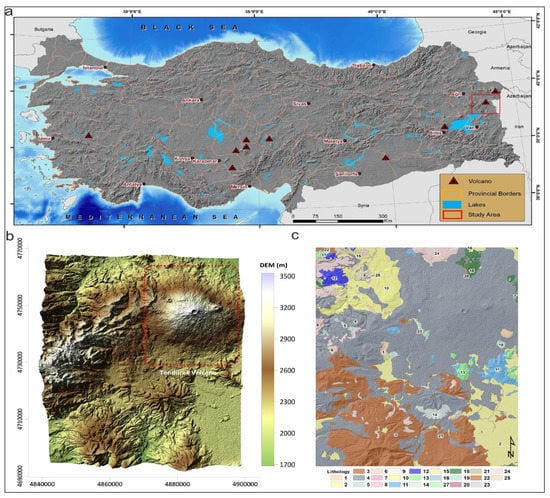
Figure 1.
(a) Overview map of the study area. (b) Topographic map of the study area provided by ALOS-PALSAR DEM (12.5 m). (c) 1—Agglomerate, 2—Alluvium, 3—Andesite, 4—Basalt, 5—Conglomerate, 6—Dacite, 7—Gabbro, 8—Granite, 9—İgnimbrite, 10—Lacustrine Limestone, 11—Limestone, 12—Marble, 13—Metasedimentary rock, 14—Mudstone, 15—Old Alluvium, 16—Olistostrome, 17—Quartzite, 18—Serpentinite, 19—Shale, 20—Spilite, 21—Talus, 22—Trachyandesite, 23—Travertine, 24—Tuff, 25—Volcanic Rock (geology map of and unit of the study area taken from [43]).
Although Tendürek volcano has a polygenic structure, it is a shield volcano located within the strike-slip Balık Gölü fault zone (Figure 1c). The fault passing through the south of Tendürek volcano extends from Iran to the Diyadin plain [44]. However, the stratigraphic and lithological units that crop out in the study area range from Paleozoic to Quaternary in age [45]. The oldest rock outcropping in the area is the Paleozoic-aged metamorphic units composed of mica schist, marble, and quartzite. These units are overlain by Permo-Carbonifer-aged crystallized limestone, which is located around Doğubeyazıt. The basement units are overlain unconformably by Eocene-aged flysch. These units are tectonically overlain by late Cretaceous-aged ophiolitic melange-containing Cretaceous-aged limestone blocks. The basement units are unconformably overlain by Miocene-aged units represented by limestone, sandstone, and mudstone alternations. The above-mentioned units are covered by Late Quaternary-aged Tendürek volcanic rocks. The Tendürek volcano continues to Doğubeyazıt in the north and reaches Çaldıran in the south and many preserved crater structures are observed in this area [46]. The volcanic activity in the region has continued for 250,000 years and has been divided into five different phases [46]. In addition, gas vents and thermal water springs observed in the region demonstrate that volcanic activity continues [44].
2.2. Dataset
Sentinel-1 radar data operating in the C band (~5.6 cm wavelength) was obtained in a joint venture between the European Space Agency (ESA) and the European Commission and we used the data to detect surface deformations. Sentinel-1 data, which can be used to visualize large areas with short revisit times (6 or 12 days) and capture images in all weather conditions day and night, is available free of charge from the ESA open access portal. For this study, 76 images in descending acquisition geometries and 74 images in ascending acquisition geometries, captured between May 2018 and October 2022, were used. SAR acquisition times were 03:09 UTC for the descending orbit and 15:01 UTC for the ascending orbit. Details of the SAR data are given in Table 1. In addition, the GACOS delay products corresponding to each SAR acquisition for the GACOS correction were downloaded by sending a request to the official GACOS website (http://www.gacos.net, accessed on 13 February 2023) along with the study area location and SAR data-acquisition times.

Table 1.
Overview of Sentinel-1 dataset used in this study.
2.3. StaMPS
StaMPS, which was developed by considering previous PSI techniques, has been frequently used in the analysis of crustal movements [33,47]. This method uses the spatial correlation of the interferometric phase to detect pixels with low phase changes in all terrain structures, with or without prominent objects such as buildings and bridges [48,49]. The process consists of three main steps: interferogram generation, PS selection, and atmospheric filtration. First, appropriate sub-swath and bursts are selected in the SAR dataset, and precise orbit files are applied to them. Then, the master image is selected considering the time interval, vertical baseline, and least atmospheric effect, and all dependent images are recorded using the master image with the help of the S-1 Back Geocoding operator. After the coregistration process, interferograms are produced and prepared for StaMPS analysis by removing the topographic phase component. The entire processing block has been performed using SNAP and the freely available snap2stamps scripts developed by [50].
The next steps of the processing block are performed in the StaMPS software, and in the first step, PS candidates are selected based on the amplitude distribution index. The amplitude distribution index is defined as the ratio of the standard deviation of each pixel to the average amplitude value and is calculated using Equation (1) [33,51]:
where defines the amplitude dispersion value, and and define the standard deviation and mean of the amplitude values [33]. The threshold value used is typically between 0.4 and 0.42 [52]. After determining the candidate pixels according to the amplitude distribution, the phase noise is estimated and removed for each candidate pixel using phase analysis. The residual phase of the xth pixel and the ith interferogram is given by Equation (2) [33]:
where W{·} defines the wrapping operator. Then, represent the general terms for phase change due to movement of the pixel in the satellite LOS direction, phase change due to atmospheric delay between satellite passes, residual phase change due to satellite orbital error, phase change due to viewpoint, and phase noise, respectively [33,52]. Then, candidate PS points are filtered according to the noise features estimated and extracted in the previous step so that PS points in the time series are determined based on the amplitude and phase analysis for each pixel in each interferogram. After filtering the PS points, the wrapped phase is corrected for spatially uncorrelated look angle (SCLA) error, and then the phase unwrapping step is performed. In the last step, SCLA errors mostly caused by digital elevation model (DEM) errors are predicted and removed, after this step atmospheric filtering is performed, and the LOS direction velocities for the region of interest are obtained.
In this study, a total of 150 Sentinel-1A SAR images from the descending and ascending acquisition geometries acquired between May 2018 and October 2022 were obtained from ESA and used to detect the surface deformations caused by the Tendürek volcano. The master image selection from the SAR dataset was performed by considering temporal (<1000 days) and vertical baselines (<200 m) (Figure 2). In addition, a one-arc-second shuttle radar topography mission (SRTM) (approximately 30 m × 30 m) was used to extract the topographic phase from the interferograms. StaMPS parameters used in the processing of SAR images are given in Table 2 [33]. Finally, we test two different approaches (linear phase-based tropospheric correction and GACOS) within the TRAIN to predict and correct errors caused by atmospheric interactions. A flowchart for the methodology that was used in this study is presented in Figure 3.
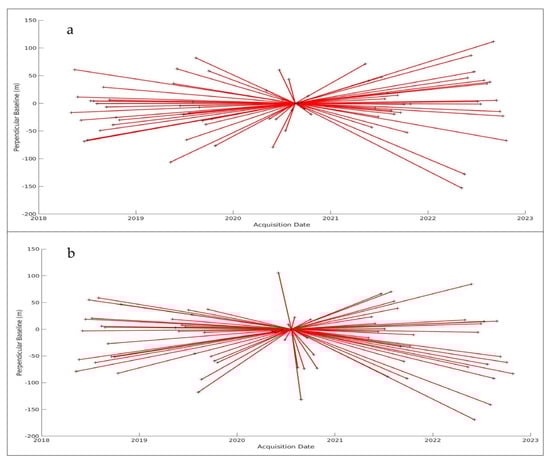
Figure 2.
The temporal and perpendicular baselines for the descending (a) and ascending (b) S1 datasets. The black plus symbols represent the master images of all the pairs.
Table 2.
Parameters used for StaMPS processing.
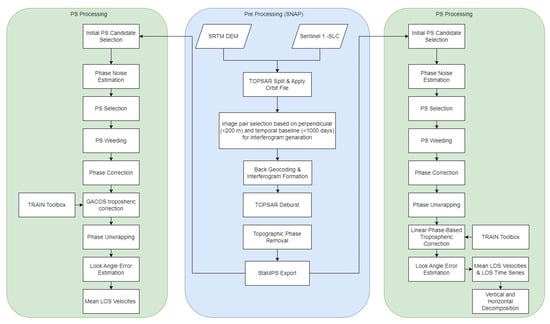
Figure 3.
Processing workflow of the study.
2.4. Atmospheric Filtering
2.4.1. Linear Phase-Based Tropospheric Correction
To reduce the error caused by atmospheric interactions, we used the linear phase-based model available in the TRAIN, a free module developed by [53].
where , , and refer to interferometric tropospheric phase contribution, coefficient relating phase to topography, topography, and a constant phase shift, respectively [54]. After StaMPS processing is complete, linear phase-based correction is applied as the final step. More details on these steps can be found in the references [53,55,56].
2.4.2. GACOS Correction
We used GACOS tropospheric delay products as a second approach to predict and correct errors caused by atmospheric interactions. Developed by Newcastle University in England in June 2017, GACOS is based on numerical weather models [57]. GACOS has become frequently used by many researchers to mitigate or eliminate the effect of atmospheric error, owing to its advantages such as near real-time usability, simplicity, and free implementation [58,59,60,61,62,63]. In the processing of GACOS delay products, SRTM DEM (90 m, S60-N60) and ASTER GDEM (90 m, N60-N83, S60-S83) data are used, which are also high-definition weather models, created by the European Centre for medium-range weather forecasts [64]. GACOS uses an iterative tropospheric decomposition model to separate stratified and turbulent components from tropospheric total delays, and high spatial resolution zenith total delay (ZTD) maps are generated. Then, the ZTD maps obtained at different dates are converted to LOS interferograms and applied after phase correction to minimize or eliminate the effect of atmospheric errors on the interferograms. Finally, the SCLA error is removed after the GACOS-based atmospheric correction and as a result deformation maps and time series in the LOS direction are produced. The procedure of GACOS-based atmospheric correction approaches is shown in Figure 3. In addition, further details about these steps can be found in the references [53,55,56].
3. Results
The Sentinel-1 images obtained from ascending and descending acquisition geometries between May 2018 and October 2022 and the mean deformation velocity maps and standard deviation values in the LOS direction produced as a result of linear phase-based atmospheric correction are shown in Figure 4. The red-colored areas on the average deformation rate map show that they are moving away from the satellite, whereas the blue-colored areas are approaching the satellite. This situation indicates the subsidence of a region centered on the summit caldera with a maximum of −10 mm/yr in the LOS direction, in both the ascending and descending acquisition geometries. In addition, the standard deviation values of the mean deformation maps obtained from descending and ascending acquisition geometries are 0.762 and 1.185 mm/yr, respectively (Figure 4c,d).
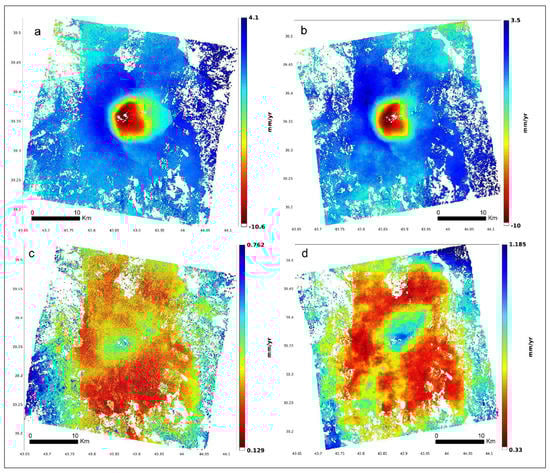
Figure 4.
Linear phase-based mean deformation velocity maps in the LOS direction from descending (a) and ascending (b) acquisition geometries. Standard deviation map of linear phase-based LOS direction velocities from descending (c) and ascending (d) acquisition geometries.
The mean deformation velocity maps and standard deviation values in the LOS direction produced as a result of atmospheric correction based on GACOS are shown in Figure 5. Although the GACOS and linear phase-based atmospheric correction results show a similar deformation pattern, the GACOS-based results detect greater subsidence rates. In addition, the GACOS-based standard deviation values of the mean deformation maps from descending and ascending acquisition geometries are 0.873 and 1.139 mm/yr, respectively.
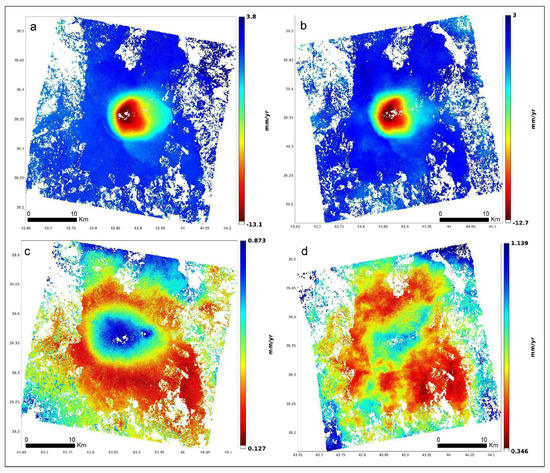
Figure 5.
GACOS-based mean deformation velocity maps in the LOS direction from descending (a) and ascending (b) acquisition geometries. Standard deviation of GACOS-based mean deformation velocity map from descending (c) and ascending (d) acquisition geometries.
Results in the LOS direction from both atmospheric correction approaches show a similar deformation pattern with a caldera-centered −10 mm/yr subsidence. However, the linear phase-based atmospheric correction approach exhibits lower standard deviation values in the areas with maximum subsidence. Therefore, we use the linear phase-based atmospheric correction results in the subsequent analyses.
To examine the deformations in the Tendürek volcano, transverse and longitudinal sections perpendicular to the volcano were selected, and profile analyses were conducted (Figure 6a,b). Profile analyses show that the deformation rate, which shows maximum subsidence at the summit of the volcano, decreases linearly with distance from the summit of the volcano (Figure 6c–f). In addition, the profiles in both the descending and ascending acquisition geometries show a bowl-shaped pattern that continues with a smaller slope from the summit of the volcano to the eastern flanks. Although the E-W directional profiles of the ascending acquisition geometries show a stronger inclination than the E-W directional profiles of the descending acquisition geometries, the results from both the descending and ascending datasets show the subsidence of a similar region centered on the summit caldera.

Figure 6.
Mean deformation velocity maps in the LOS direction from descending (a) and ascending (b) acquisition geometries. (c,d) N-S and E-W profiles of the LOS velocity from the descending geometry (blue dots) and the surface elevation (orange line). (e,f) N-S and E-W profiles of the LOS velocity from the ascending geometry (blue dots) and the surface elevation (orange line).
Time series show the same findings in more detail than the mean deformation velocity maps. Figure 7 shows the deformation time series of four certain PS pixels in ascending and descending orbits at Tendürek volcano. The results show that the Tendürek volcano subsidence gradually evolves between 2018 and 2022, and the temporal evolution of the displacement is linear.

Deformation measurements made in areas where the topography changes suddenly, such as Tendürek volcano, may be adversely affected by atmospheric effects, slope, and satellite LOS directions, and the pixel distributions in the resulting datasets may not be homogeneous. Although two different atmospheric correction approaches were applied in this study, atmospheric artifacts were completely removed, and therefore, sufficient point density could not be established in some regions, especially in the center of the caldera. For this reason, loss velocity values were created using the biharmonic spline interpolation (MATLAB® 4 grid data method) method. In addition, the results obtained in the LOS direction from ascending and descending acquisition geometries show similar deformation patterns. This suggests that vertical deformation is dominant and greater than horizontal deformation [65,66]. However, in order to detect this situation and to determine the dominant deformation pattern in the study area to better the discussion of the analysis results, decomposition is performed using PSI measurements obtained from descending and ascending acquisition geometries. On the other hand, because the SAR satellites move in orbits close to the poles (parallel to the north–south direction) and illuminate the world with small incidence angles, the LOS direction deformation is less sensitive to north–south movements [67,68,69]. Therefore, in this study, the north–south movements were ignored, and displacements in the east–west directions were estimated using Equations (4) and (5), as shown in Figure 8.
where , , , α, and θ refer to the displacements along LOS direction, vertical displacement, horizontal displacement, incidence angle, and azimuth angle, respectively [70].

Figure 8.
Horizontal and vertical deformation derived from LOS direction results. (a) Vertical mean deformation velocity. Positive values (green) represent uplift and negative values (warm colors) represent subsidence. (b) Horizontal E-W mean deformation velocity. Positive values (green) represent movements toward the west direction and negative values (warm colors) toward the east.
The components of the deformation show that the vertical deformation rate is between 5 and −15 mm/yr, and the horizontal deformation rate is between 5 and −5 mm/yr (Figure 8a,b). The vertical deformation component shows the subsidence of a peak caldera-centered region with a maximum of −15 mm/yr. In addition, both the northern and southern parts of the deformed region show an eastward displacement. Regarding deformations in the east–west direction (Figure 8b), the rate of displacement is much smaller, and the maximum rate is approximately −5 to 5 mm/yr. This shows that the deformation in the Tendürek volcano predominantly occurred in the vertical direction, and the horizontal deformation component is negligible.
4. Discussion
In this study, we aimed to determine the surface deformation occurring in the Tendürek volcano. A total of 150 Sentinel-1 images from descending and ascending orbits were used, and two different atmospheric correction approaches were applied to estimate the atmospheric phase contribution in the study area. Although both atmospheric correction approaches show a similar deformation pattern, the deformation rates obtained from the linear phase-based approach were used in the continuation of the study because the linear phase-based approach exhibited lower standard deviation values. In this context, the results obtained from both satellite geometries show that there was a maximum subsidence of −50 mm over 5 years at the Tendürek volcano. The standard deviations of the deformation rates are ∼5 mm, which is approximately 10 times less than the deformation rate in both cases.
Profile analyses of both geometries show a bowl-shaped pattern that continues from the summit of the volcano to the eastern flanks and demonstrates that the maximum subsidence rate decreases linearly with the distance from the summit of the volcano. In addition, when the deformation time series of four PS pixels selected from the ascending and descending orbits are examined, it is observed that the subsidence occurs in a linear structure and there is no increase or decrease in the deformation rate in any period. As a result, the subsidence occurred in a summit caldera-centered region of the Tendürek volcano. However, to investigate whether the horizontal movement affects the obtained deformation rates, the deformation components were calculated, and the horizontal deformation was small enough to be neglected. When the vertical deformation components were examined, a deformation of −15 mm/yr was detected in the Tendürek volcano.
As mentioned above, ref. [40] used ERS satellite images and detected a 10–20 cm subsidence at the Tendürek volcano summit between 1993 and 2000, which is consistent with our study considering that 15–20 mm/yr corresponds to a deformation of 12–16 cm over 8 years. In the study performed by [41] using Envisat satellite images, a subsidence of 11 mm/yr was detected in an area of 10 × 14 km on the Tendürek volcano between 2003 and 2010, and the cause of this subsidence was attributed to a magmatic threshold-like source located 4.5 km below the summit. Another study conducted in the region was carried out by [42] using Sentinel-1 satellite images of 10 volcanic systems in Turkey, including the Tendürek volcano, between 2015 and 2020, and no significant deformation rate was detected in the Tendürek volcano during this period. Their observation is not consistent with the results of our study. In the study conducted by [42], a reliable interpretation cannot be made because a detailed deformation map of the Tendürek volcano or time series of deformation were not given. In addition, the fact that the two studies cover different periods, using different methods and images, may explain this difference. Overall, we obtained similar results to those obtained by [40,41], and we conclude that the deformation in the Tendürek volcano has been ongoing since 1993.
5. Conclusions
In conclusion, the surface deformation of Tendürek volcano was determined using 150 Sentinel-1 SAR images captured between May 2018 and October 2022 using the SNAP-StaMPS integration. In this way, the most up-to-date and comprehensive analysis of the Tendürek volcano was carried out. Since the study area is a mountainous region with a high tendency to be affected by tropospheric delay, we applied two different atmospheric correction approaches. However, in our case, the GACOS atmospheric correction method produced larger standard deviation values for the maximum deformation rate. Therefore, we used the linear phase-based atmospheric correction approach. As a result, 10.6 ± 0.76 and 10 ± 1.18 mm/yr LOS velocities were determined from descending and ascending acquisition geometries, respectively, and updated deformation maps showing annual mean velocity changes for the region were created.
This study confirms that the StaMPS-InSAR analysis on Sentinel-1 datasets has great potential for investigating surface deformations caused by volcanoes. In this context, the findings of this study may have important implications for authorities in disaster management, owing to the ability of this technique to achieve rapid results in large areas. However, this work can be improved in the future. For instance, surface deformations can be detected with higher sensitivity using a local atmospheric model and high-resolution InSAR images. It may also be useful to compare InSAR observations with ground measurements if ground-based monitoring instruments can be established in the future.
Author Contributions
Conceptualization, H.İ.G., F.Y. and O.O.; methodology, H.İ.G.; software, H.İ.G.; formal analysis, H.İ.G., F.Y. and O.O.; investigation, H.İ.G., F.Y. and O.O.; data curation, H.İ.G.; writing—original draft preparation, H.İ.G., F.Y. and O.O.; writing—review and editing, H.İ.G., F.Y. and O.O.; visualization, H.İ.G. and O.O.; supervision, F.Y. All authors have read and agreed to the published version of the manuscript.
Funding
This research received no external funding.
Institutional Review Board Statement
Not applicable.
Informed Consent Statement
Not applicable.
Data Availability Statement
Not applicable.
Acknowledgments
The Sentinel-1A and 1B data used in the present study were accessed through the Sentinel Scientific Data Hub (scihub.copernicus.eu, accessed on 6 January 2023) of the Copernicus Open Access Hub.
Conflicts of Interest
The authors declare no conflict of interest.
References
- Van Westen, C.J. Remote sensing for natural disaster management. Int. Arch. Photogramm. Remote Sens. 2000, 33 Pt 7, 1609–1617. [Google Scholar]
- Cardwell, R.; McDonald, G.; Wotherspoon, L.; Lindsay, J. Simulation of post volcanic eruption land use and economic recovery pathways over a period of 20 years in the Auckland region of New Zealand. J. Volcanol. Geotherm. Res. 2021, 415, 107253. [Google Scholar] [CrossRef]
- Doocy, S.; Daniels, A.; Dooling, S.; Gorokhovich, Y. The Human Impact of Volcanoes: A Historical Review of Events 1900–2009 and Systematic Literature Review. PLoS Curr. 2013, 5, 1–12. [Google Scholar] [CrossRef] [PubMed]
- García, C.; Mendez-Fajury, R. If I Understand, I Am Understood: Experiences of Volcanic Risk Communication in Colombia. In Observing the Volcano World; Springer: Cham, Switzerland, 2017; pp. 335–351. [Google Scholar] [CrossRef]
- Budd, L.; Griggs, S.; Howarth, D.; Ison, S. A Fiasco of Volcanic Proportions? Eyjafjallajökull and the Closure of European Airspace. Mobilities 2011, 6, 31–40. [Google Scholar] [CrossRef]
- Brown, S.K.; Jenkins, S.; Sparks, R.S.J.; Odbert, H.; Auker, M.R. Volcanic fatalities database: Analysis of volcanic threat with distance and victim classification. J. Appl. Volcanol. 2017, 6, 15. [Google Scholar] [CrossRef]
- Chester, D.K.; Degg, M.; Duncan, A.M.; Guest, J.E. The increasing exposure of cities to the effects of volcanic eruptions: A global survey. Glob. Environ. Chang. Part B Environ. Hazards 2000, 2, 89–103. [Google Scholar] [CrossRef]
- Auker, M.R.; Sparks, R.S.J.; Siebert, L.; Crosweller, H.S.; Ewert, J.W. A statistical analysis of the global historical volcanic fatalities record. J. Appl. Volcanol. 2013, 2, 1–24. [Google Scholar] [CrossRef]
- Mei, E.T.W.; Lavigne, F.; Picquout, A.; de Bélizal, E.; Brunstein, D.; Grancher, D.; Sartohadi, J.; Cholik, N.; Vidal, C. Lessons learned from the 2010 evacuations at Merapi volcano. J. Volcanol. Geotherm. Res. 2013, 261, 348–365. [Google Scholar] [CrossRef]
- Anantrasirichai, N.; Biggs, J.; Albino, F.; Hill, P.; Bull, D. Application of Machine Learning to Classification of Volcanic Deformation in Routinely Generated InSAR Data. J. Geophys. Res. Solid Earth 2018, 123, 6592–6606. [Google Scholar] [CrossRef]
- Sparks, R.S.J.; Biggs, J.; Neuberg, J.W. Monitoring volcanoes. Science 2012, 335, 1310–1311. [Google Scholar] [CrossRef]
- Biggs, J.; Anthony, E.; Ebinger, C. Multiple inflation and deflation events at Kenyan volcanoes, East African Rift. Geology 2009, 37, 979–982. [Google Scholar] [CrossRef]
- Biggs, J.; Ebmeier, S.K.; Aspinall, W.P.; Lu, Z.; Pritchard, M.E.; Sparks, R.S.J.; Mather, T.A. Global link between deformation and volcanic eruption quantified by satellite imagery. Nat. Commun. 2014, 5, 3471. [Google Scholar] [CrossRef] [PubMed]
- Massonnet, D.; Briole, P.; Arnaud, A. Deflation of Mount Etna monitored by spaceborne radar interferometry. Nature 1995, 375, 567–570. [Google Scholar] [CrossRef]
- Pritchard, M.E.; Simons, M. An InSAR-based survey of volcanic deformation in the southern Andes. Geophys. Res. Lett. 2004, 31, L15610. [Google Scholar] [CrossRef]
- Rivera, A.M.M.; Amelung, F.; Mothes, P. Volcano deformation survey over the Northern and Central Andes with ALOS InSAR time series. Geochem. Geophys. Geosyst. 2016, 17, 2869–2883. [Google Scholar] [CrossRef]
- Massonnet, D.; Rossi, M.; Carmona, C.; Adragna, F.; Peltzer, G.; Feigl, K.; Rabaute, T. The displacement field of the Landers earthquake mapped by radar interferometry. Nature 1993, 364, 138–142. [Google Scholar] [CrossRef]
- Cakir, Z.; Akoglu, A.M. Synthetic aperture radar interferometry observations of the M = 6.0 Orta earthquake of 6 June 2000 (NW Turkey): Reactivation of a listric fault. Geochem. Geophys. Geosyst. 2008, 9, Q08009. [Google Scholar] [CrossRef]
- Xu, W.; Wu, S.; Materna, K.; Nadeau, R.; Floyd, M.; Funning, G.; Chaussard, E.; Johnson, C.W.; Murray, J.R.; Ding, X.; et al. Interseismic Ground Deformation and Fault Slip Rates in the Greater San Francisco Bay Area From Two Decades of Space Geodetic Data. J. Geophys. Res. Solid Earth 2018, 123, 8095–8109. [Google Scholar] [CrossRef]
- Colesanti, C.; Ferretti, A.; Prati, C.; Rocca, F. Monitoring landslides and tectonic motions with the Permanent Scatterers Technique. Eng. Geol. 2003, 68, 3–14. [Google Scholar] [CrossRef]
- Yin, Y.; Zheng, W.; Liu, Y.; Zhang, J.; Li, X. Integration of GPS with InSAR to monitoring of the Jiaju landslide in Sichuan, China. Landslides 2010, 7, 359–365. [Google Scholar] [CrossRef]
- Béjar-Pizarro, M.; Notti, D.; Mateos, R.M.; Ezquerro, P.; Centolanza, G.; Herrera, G.; Bru, G.; Sanabria, M.; Solari, L.; Duro, J.; et al. Mapping Vulnerable Urban Areas Affected by Slow-Moving Landslides Using Sentinel-1 InSAR Data. Remote Sens. 2017, 9, 876. [Google Scholar] [CrossRef]
- Amelung, F.; Galloway, D.; Bell, J.W.; Zebker, H.A.; Laczniak, R.J. Sensing the ups and downs of Las Vegas: InSAR reveals structural control of land subsidence and aquifer-system deformation. Geology 1999, 27, 483–486. [Google Scholar] [CrossRef]
- Imamoglu, M.; Kahraman, F.; Cakir, Z.; Sanli, F.B. Ground Deformation Analysis of Bolvadin (W. Turkey) by Means of Multi-Temporal InSAR Techniques and Sentinel-1 Data. Remote Sens. 2019, 11, 1069. [Google Scholar] [CrossRef]
- Orhan, O. Monitoring of land subsidence due to excessive groundwater extraction using small baseline subset technique in Konya, Turkey. Environ. Monit. Assess. 2021, 193, 174. [Google Scholar] [CrossRef]
- Gezgin, C. The influence of groundwater levels on land subsidence in Karaman (Turkey) using the PS-InSAR technique. Adv. Space Res. 2022, 70, 3568–3581. [Google Scholar] [CrossRef]
- Jia, H.; Liu, L. A technical review on persistent scatterer interferometry. J. Mod. Transp. 2016, 24, 153–158. [Google Scholar] [CrossRef]
- Ferretti, A.; Prati, C.; Rocca, F. Nonlinear Subsidence Rate Estimation Using permanent scatterers in differential SAR interferometry. IEEE Trans. Geosci. Remote Sens. 2000, 38, 2202–2212. [Google Scholar] [CrossRef]
- Berardino, P.; Fornaro, G.; Lanari, R.; Sansosti, E. A new algorithm for surface deformation monitoring based on small baseline differential SAR interferograms. IEEE Trans. Geosci. Remote Sens. 2002, 40, 2375–2383. [Google Scholar] [CrossRef]
- Hooper, A.; Zebker, H.; Segall, P.; Kampes, B. A new method for measuring deformation on volcanoes and other natural terrains using InSAR persistent scatterers. Geophys. Res. Lett. 2004, 31, L23611. [Google Scholar] [CrossRef]
- Riddick, S.; Schmidt, D.; Deligne, N. An analysis of terrain properties and the location of surface scatterers from persistent scatterer interferometry. ISPRS J. Photogramm. Remote Sens. 2012, 73, 50–57. [Google Scholar] [CrossRef]
- Ducret, G.; Doin, M.-P.; Grandin, R.; Lasserre, C.; Guillaso, S. DEM Corrections Before Unwrapping in a Small Baseline Strategy for InSAR Time Series Analysis. IEEE Geosci. Remote Sens. Lett. 2013, 11, 696–700. [Google Scholar] [CrossRef]
- Hooper, A.; Segall, P.; Zebker, H. Persistent scatterer interferometric synthetic aperture radar for crustal deformation analysis, with application to Volcán Alcedo, Galápagos. J. Geophys. Res. Atmos. 2007, 112, B07407. [Google Scholar] [CrossRef]
- Peltier, A.; Bianchi, M.; Kaminski, E.; Komorowski, J.-C.; Rucci, A.; Staudacher, T. PSInSAR as a new tool to monitor pre-eruptive volcano ground deformation: Validation using GPS measurements on Piton de la Fournaise. Geophys. Res. Lett. 2010, 37, L12301. [Google Scholar] [CrossRef]
- Ji, L.; Xu, J.; Wang, Q.; Wan, Y. Episodic deformation at Changbaishan Tianchi volcano, northeast China during 2004 to 2010, observed by persistent scatterer interferometric synthetic aperture radar. J. Appl. Remote Sens. 2013, 7, 073499. [Google Scholar] [CrossRef]
- Papoutsis, I.; Papanikolaou, X.; Floyd, M.; Ji, K.H.; Kontoes, C.; Paradissis, D.; Zacharis, V. Mapping inflation at Santorini volcano, Greece, using GPS and InSAR. Geophys. Res. Lett. 2013, 40, 267–272. [Google Scholar] [CrossRef]
- Miyagi, Y.; Ozawa, T.; Kozono, T.; Shimada, M. DInSAR/PSInSAR Observations of Kirishima, Shinmoe-dake Volcano, Japan. In Proceedings of the EGU General Assembly Conference Abstracts, Vienna, Austria, 7–12 April 2013. EGU2013-4658. [Google Scholar]
- Parker, A.L.; Biggs, J.; Lu, Z. Investigating long-term subsidence at Medicine Lake Volcano, CA, using multitemporal InSAR. Geophys. J. Int. 2014, 199, 844–859. [Google Scholar] [CrossRef]
- Ramayanti, S.; Achmad, A.R.; Jung, H.C.; Jo, M.-J.; Kim, S.-W.; Park, Y.-C.; Lee, C.-W. Measurement of surface deformation related to the December 2018 Mt. Etna eruption using time-series interferometry and magma modeling for hazard zone mapping. Geosci. J. 2022, 26, 749–765. [Google Scholar] [CrossRef]
- Tolluoglu, D. Monitoring Deformations on Tendürek Volcano by Differential SAR Interferometry; Van Yuzuncu Yil University: Van, Turkey, 2006. [Google Scholar]
- Bathke, H.; Sudhaus, H.; Holohan, E.; Walter, T.R.; Shirzaei, M. An active ring fault detected at Tendürek volcano by using InSAR. J. Geophys. Res. Solid Earth 2013, 118, 4488–4502. [Google Scholar] [CrossRef]
- Biggs, J.; Dogru, F.; Dagliyar, A.; Albino, F.; Yip, S.; Brown, S.; Anantrasirichai, N.; Atıcı, G. Baseline monitoring of volcanic regions with little recent activity: Application of Sentinel-1 InSAR to Turkish volcanoes. J. Appl. Volcanol. 2021, 10, 1–14. [Google Scholar] [CrossRef]
- Akbaş, B.; Akdeniz, N.; Aksay, A.; Altun, İ.E.; Balcı, V.; Bilginer, E.; Bilgiç, T.; Duru, M.; Ercan, T.; Gedik, İ.; et al. 1:1,250,000 Scaled Geological Map of Turkey; General Directorate of Mineral Research and Exploration Publication: Ankara, Turkey, 2011.
- Yılmaz, Y.; Güner, Y.; Şaroğlu, F. Geology of the Quaternary volcanic centres of the East Anatolia. J. Volcanol. Geotherm. Res. 1998, 85, 173–210. [Google Scholar] [CrossRef]
- Oruç, N.; Alpman, N.; Karamanderesi, İ.H. Tendürek volkanı çevresindeki yüksek fluorür içerikli kaynak sularının hidrojeolojisi. Türkiye Jeol. Kurumu Bülteni 1976, 19, 1–8. [Google Scholar]
- Lebedev, V.A.; Chugaev, A.V.; Ünal, E.; Sharkov, E.V.; Keskin, M. Late pleistocene tendürek volcano (eastern Anatolia, Turkey). II. Geochemistry and petrogenesis of the rocks. Petrology 2016, 24, 234–270. [Google Scholar] [CrossRef]
- Poyraz, F.; Hastaoğlu, K. Monitoring of tectonic movements of the Gediz Graben by the PSInSAR method and validation with GNSS results. Arab. J. Geosci. 2020, 13, 1–11. [Google Scholar] [CrossRef]
- Perissin, D.; Rocca, F. High-Accuracy Urban DEM Using Permanent Scatterers. IEEE Trans. Geosci. Remote Sens. 2006, 44, 3338–3347. [Google Scholar] [CrossRef]
- Qu, F.; Zhang, Q.; Lu, Z.; Zhao, C.; Yang, C.; Zhang, J. Land subsidence and ground fissures in Xi’an, China 2005–2012 revealed by multi-band InSAR time-series analysis. Remote Sens. Environ. 2014, 155, 366–376. [Google Scholar] [CrossRef]
- Foumelis, M.; Blasco, J.M.D.; Desnos, Y.-L.; Engdahl, M.; Fernandez, D.; Veci, L.; Lu, J.; Wong, C. ESA SNAP-StaMPS Integrated Processing for Sentinel-1 Persistent Scatterer Interferometry. In Proceedings of the IGARSS 2018—2018 IEEE International Geoscience and Remote Sensing Symposium, Valencia, Spain, 22–27 July 2018; IEEE: Hoboken, NJ, USA, 2018; pp. 1364–1367. [Google Scholar]
- Ferretti, A.; Prati, C.; Rocca, F. Permanent scatterers in SAR interferometry. IEEE Trans. Geosci. Remote Sens. 2001, 39, 8–20. [Google Scholar] [CrossRef]
- Lu, P.; Han, J.; Hao, T.; Li, R.; Qiao, G. Seasonal deformation of permafrost in Wudaoliang basin in Qinghai-Tibet plateau revealed by StaMPS-InSAR. Mar. Geod. 2020, 43, 248–268. [Google Scholar] [CrossRef]
- Bekaert, D.; Walters, R.; Wright, T.; Hooper, A.; Parker, D. Statistical comparison of InSAR tropospheric correction techniques. Remote Sens. Environ. 2015, 170, 40–47. [Google Scholar] [CrossRef]
- Mancini, F.; Grassi, F.; Cenni, N. A Workflow Based on SNAP–StaMPS Open-Source Tools and GNSS Data for PSI-Based Ground Deformation Using Dual-Orbit Sentinel-1 Data: Accuracy Assessment with Error Propagation Analysis. Remote Sens. 2021, 13, 753. [Google Scholar] [CrossRef]
- Bekaert, D.P.S.; Hooper, A.; Wright, T.J. A spatially variable power law tropospheric correction technique for InSAR data. J. Geophys. Res. Solid Earth 2015, 120, 1345–1356. [Google Scholar] [CrossRef]
- Hooper, A.; Bekaert, D.; Spaans, K.; Arıkan, M. Recent advances in SAR interferometry time series analysis for measuring crustal deformation. Tectonophysics 2012, 514, 1–13. [Google Scholar] [CrossRef]
- Xiao, R.; Yu, C.; Li, Z.; He, X. Statistical assessment metrics for InSAR atmospheric correction: Applications to generic atmospheric correction online service for InSAR (GACOS) in Eastern China. Int. J. Appl. Earth Obs. Geoinf. 2020, 96, 102289. [Google Scholar] [CrossRef]
- Murray, K.D.; Bekaert, D.P.; Lohman, R.B. Tropospheric corrections for InSAR: Statistical assessments and applications to the Central United States and Mexico. Remote Sens. Environ. 2019, 232, 111326. [Google Scholar] [CrossRef]
- Albino, F.; Biggs, J.; Syahbana, D.K. Dyke intrusion between neighbouring arc volcanoes responsible for 2017 pre-eruptive seismic swarm at Agung. Nat. Commun. 2019, 10, 748. [Google Scholar] [CrossRef] [PubMed]
- Wang, Y.; Chang, L.; Feng, W.; Samsonov, S.; Zheng, W. Topography-correlated atmospheric signal mitigation for InSAR applications in the Tibetan plateau based on global atmospheric models. Int. J. Remote Sens. 2021, 42, 4361–4379. [Google Scholar] [CrossRef]
- Araya, M.C.; Biggs, J. Deformation associated with sliver transport in Costa Rica: Seismic and geodetic observations of the July 2016 Bijagua earthquake sequence. Geophys. J. Int. 2019, 220, 585–597. [Google Scholar] [CrossRef]
- Vaka, D.S.; Rao, Y.S.; Bhattacharya, A. Surface displacements of the 12 November 2017 Iran–Iraq earthquake derived using SAR interferometry. Geocarto Int. 2019, 36, 660–675. [Google Scholar] [CrossRef]
- Xiao, R.; Yu, C.; Li, Z.; Jiang, M.; He, X. Insar stacking with atmospheric correction for rapid geohazard detection: Applications to ground subsidence and landslides in China. Int. J. Appl. Earth Obs. Geoinf. 2022, 115, 103082. [Google Scholar] [CrossRef]
- Yu, C.; Li, Z.; Penna, N.T.; Crippa, P. Generic Atmospheric Correction Model for Interferometric Synthetic Aperture Radar Observations. J. Geophys. Res. Solid Earth 2018, 123, 9202–9222. [Google Scholar] [CrossRef]
- Caló, F.; Notti, D.; Galve, J.P.; Abdikan, S.; Görüm, T.; Pepe, A.; Balik Şanli, F. Dinsar-Based detection of land subsidence and correlation with groundwater depletion in Konya Plain, Turkey. Remote Sens. 2017, 9, 83. [Google Scholar] [CrossRef]
- Bayik, C.; Abdikan, S. Monitoring of small-scale deformation at sea-filled Ordu-Giresun Airport, Turkey from multi-temporal SAR data. Eng. Fail. Anal. 2021, 130, 105738. [Google Scholar] [CrossRef]
- Arikan, M.; Hooper, A.; Hanssen, R. Radar time series analysis over West Anatolia. In Proceedings of the Fringe 2009 Workshop, Frascati, Italy, 30 November–4 December 2009; ESA: Noordwijk, The Netherlands, 2010; Volume 677, pp. 1–6. [Google Scholar]
- Szűcs, E.; Gönczy, S.; Bozsó, I.; Bányai, L.; Szakacs, A.; Szárnya, C.; Wesztergom, V. Evolution of surface deformation related to salt-extraction-caused sinkholes in Solotvyno (Ukraine) revealed by Sentinel-1 radar interferometry. Nat. Hazards Earth Syst. Sci. 2021, 21, 977–993. [Google Scholar] [CrossRef]
- Bayik, C.; Abdikan, S.; Arıkan, M. Long term displacement observation of the Atatürk Dam, Turkey by multi-temporal InSAR analysis. Acta Astronaut. 2021, 189, 483–491. [Google Scholar] [CrossRef]
- Karanam, V.; Motagh, M.; Garg, S.; Jain, K. Multi-sensor remote sensing analysis of coal fire induced land subsidence in Jharia Coalfields, Jharkhand, India. Int. J. Appl. Earth Obs. Geoinf. 2021, 102, 102439. [Google Scholar] [CrossRef]
Disclaimer/Publisher’s Note: The statements, opinions and data contained in all publications are solely those of the individual author(s) and contributor(s) and not of MDPI and/or the editor(s). MDPI and/or the editor(s) disclaim responsibility for any injury to people or property resulting from any ideas, methods, instructions or products referred to in the content. |
© 2023 by the authors. Licensee MDPI, Basel, Switzerland. This article is an open access article distributed under the terms and conditions of the Creative Commons Attribution (CC BY) license (https://creativecommons.org/licenses/by/4.0/).