Article

Research on Prediction Method of Bolt Tightening for Aviation Components Based on Neural Network

1
School of Mechanical Engineering, Dalian University of Technology, Dalian 116023, China
2
Shenyang Institute of Automation, Chinese Academy of Sciences, Shenyang 110016, China
*
Author to whom correspondence should be addressed.
Appl. Sci. 2023, 13(11), 6771; https://doi.org/10.3390/app13116771
Submission received: 10 April 2023 / Revised: 30 May 2023 / Accepted: 31 May 2023 / Published: 2 June 2023

Abstract

:
Aviation components play an important role in national defense and aviation development. Bolt connections are widely used in the assembly of aviation components, due to their simple structure and convenient disassembly. In addition to the impact of elastic interaction, the gap between the tightened parts also makes it very difficult to obtain a uniform bolt load, to achieve the required tightness during the tightening process. However, the impact of elastic interaction can be reduced by selecting the best tightening sequence, and the optimal tightening sequence of aviation components under different gaps can be predicted by constructing a neural network surrogate model. Based on the predicted optimal sequence, the elastic interaction matrix corresponding to the sequence can be obtained. In order to obtain a uniform preload, the initial load of each bolt is calculated according to an elastic interaction matrix. This research has improved the tightness of aviation components and the real-life efficiency of tightening process planning.

1. Introduction

As the supporting force of the national defense and aerospace industry, aviation has experienced sufficient development in recent years. Aviation components are an important part of the aviation industry. Nowadays, the production mode of aviation components is in small- and medium-sized batches and multiple batches. In the production process, the quality of assembly can directly determine whether aviation components can function normally or not. Due to its precision and complexity, bolt tightening has become the most difficult task in the assembly process of aviation components. The complete assembly of an aviation component requires tightening dozens of bolts. The failure of the tightening of any bolt will increase the risk of aviation component breakdown. Therefore, the degree of tightening of bolted connections directly affects whether aviation components can function. For such precision components, all breakdown risks must be eliminated. There are many factors [1] that can affect the result of bolt tightening, including the friction dispersion caused by the torque–preload relationship, the embedding of the mating surface, the rotational movement of the flange, and the elastic interaction between components. Among these, elastic interaction is the biggest factor that makes the final load different from the target load. When a bolt is tightened, the load alternation between the bolt and the previously tightened bolt is called the elastic interaction. Due to the influence of elastic interaction, the final deformation of the component is different under different tightening sequences, as shown in Figure 1. It can be seen from the figure that different tightening sequences will have different effects on the tightened parts in the case of tightening only three bolts. Therefore, we can conclude that under the influence of elastic interaction, it is not easy to obtain the uniform load needed to make the aviation components work stably. In addition to elastic interaction, the docking process before bolt tightening can result in aviation components tightening with gaps, which have a large influence on the aviation component bolt tightening process. Thus, it is of great significance to study the bolt tightening technology of aviation components.
In order to solve the above problems, researchers at home and abroad have launched research on the bolt tightening process. Coria [2] proposed a new methodology called the tetraparametric assembly method (TAM). It was developed for a specific type of joint and calculates tightening loads using only two load steps and a small number of load measurements, thus presenting a much lower cost than the elastic interaction coefficients method. Nassar [3] developed a three-dimensional nonlinear finite element model for achieving a uniform clamp load in gasketed bolted joints. This model is used for both multiple- and single-pass tightening patterns. Rafal Grzejda [4] studied an asymmetric multi-bolted connection at the preloading state. He tested two methods of bolt tightening and proposed an assembly method. Zhang [5] used finite element simulation and stress test experiments to study the effect of different bolt tightening sequences on the stress of a bolted workpiece. Zhu [6] proposed an analytical model based on the theory of circular beams on the linear elastic foundation. The elastic interaction during the tightening of bolted flange joints was simulated, to reduce the number of passes, while achieving bolt load uniformity. Tao [7] built two sets of mechanical characteristic test systems to test the dynamic parameters of tangential and bending directions of a bolted flange joint interface. He studied the mechanical behavior and the change in regularities of dynamic parameters under different external excitations, bolt distributions, and tightening torques. Abasolo [8] proposed a methodology for the optimization of the tightening sequence. The methodology provided satisfactory results with a very low computational cost. Liu [9] established a mechanical model of the connection structure, and applied state-space theory and numerical calculation methods to numerically simulate an engine system with a bolted connection. Based on the TC4 single-bolt experimental system, Li [10] studied the influence of surface characteristics such as surface roughness and lubrication process parameters on the assembly process characteristics of aeroengine bolts. Nizametdinov [11] analyzed the bending stiffness of bolts when an engine is tightened under different conditions. They obtained the influence of different factors on the bending stiffness of the bolts. Abid [12] presented the results of the effect of different bolt tightening sequences and methods on the performance of a gasketed bolted flange joint using nonlinear finite element analysis. Miao [13] presented a field experiment to study the interaction effects on clamp bolt tightening. Zhang [14] applied the Kriging method to investigate the influence of the tightening sequence for a solid rocket motor.
We can see that scholars at home and abroad have performed in-depth research on bolted connections, but the results of these studies are not suitable for the rapid tightening of small- and medium-sized batch and multiple batch production of aviation components. The above studies did not consider the gap between the tightened parts. Moreover, the gap value and axial inclination angle are different for each docking of aviation components. For precision equipment such as aviation components, the gap between the tightening parts in the tightening process has a huge effect. Therefore, this paper presents a method based on a neural network to predict the best tightening sequence for aviation component bolt tightening. The tightening method is improved based on elastic interaction theory. The results of the aviation component deformation and the bolt residual preload with different sequences were obtained through a finite element simulation method. The finite element simulation results verified the correctness of the improved tightening method. Based on the finite element simulation results, a neural network surrogate model was constructed by taking the bolt tightening sequence, the gap value, and the axial inclination angle as the input and the bolt residual preload as the output. The optimal tightening sequence of aviation components under different joint gaps was predicted. Finally, an elastic interaction matrix was obtained based on the predicted optimal sequence. The initial load value of the bolt was calculated based on the elastic interaction matrix, to obtain a uniform final load under the conditions of the optimal bolt tightening sequence.

2. Docking Process of Aviation Components before Tightening

The aviation component is composed of the control cabin fairing, the control cabin rear section, control cabin front section, control cabin fins, connecting device, and the aviation component front section cabin. The control cabin and the aviation component front section cabin are fixed using a bolt connection. There are eight bolts to tighten in the aviation component, and the bolt type is M10X16. The aviation component front cabin is the main part of the aviation component, which is used to bear many kinds of external forces and to hold an explosive. The control cabin fairing, control cabin rear section, and control cabin front section are the main components of the control cabin. The control cabin fairing protects the aviation components from harmful environmental effects, such as the aerodynamic force, aerodynamic heating, and acoustic vibration. The function of the control cabin is to provide power to the aviation component and control the aviation component to accurately achieve its target. The control cabin fins are used to stabilize the flight state of the aviation component during falling and to prevent it from rotating. The connecting device is the reference for the docking of the aviation component front section cabin and the control cabin front section. The structure of the aviation component is shown in Figure 2.
For an aviation component, docking is the step before tightening. The space docking of the control cabin and the aviation component front section cabin involves the adjustment and matching of six degrees of freedom between the two parts. The docking process of the aviation component is shown in Figure 3.
Under the ideal condition, even if the control cabin and the aviation component front section cabin’s space axis coincide completely, this does not guarantee that the aviation component can dock perfectly in its docking process. In the actual docking process, there are some working conditions such as a machining error of the docking interface or space attitude deviation between the control cabin front section and aviation component front section cabin. There can also be slight deformation during docking. Even though the attitude of the cabin can be adjusted accurately by means of high-precision attitude adjusting and docking equipment, and the attitude of the control cabin and the aviation component front section cabin can be detected and coupled back in real time using 3D measuring instruments, this can only make the docking process of the move towards the ideal state infinitely, and finally reach a minimum critical value.
As the tightening of an aviation component is a precise and complicated task, the gap between the aviation component front section cabin and the control cabin will affect the tightening process. Therefore, the gap between the control cabin and the aviation component front section cabin is considered an important factor in the tightening process of an aviation component.
In order to measure the gap and inclination angle between the cabin and the control cabin accurately, the real docking process of the aviation component was simulated in NX MCD, so that we could obtain the two parameters in the digital space. The two parameters were measured through visual detection in the physical space. A real geometric model of the aviation component in NX MCD was measured and constructed using a 3D scanner. Moreover, the real docking process of the aviation component was modeled and simulated in NX MCD. The real-time position and attitude of the aviation component in the docking process was detected using a visual camera and fed back to the NX MCD. The gap value between the control cabin and the aviation component front section cabin was obtained by measuring the relative position and attitude of the docking cabin in real time with the virtual distance sensor module of NX MCD. Therefore, the gap value between the aviation component front section cabin and the control cabin was a known value in the course of the aviation component bolt tightening.

3. Aviation Component Bolt Tightening

3.1. Tightening Scheme Design Based on the Elastic Interaction Coefficient Method

When a bolt is tightened, the alternating load between the bolt that is tightened later and the bolt that was tightened first is called the elastic interaction. Due to this elastic interaction, different tightening sequences will have different effects on the tightened parts in the process of tightening. In selecting a tightening sequence, the goal is to obtain a uniform final load under the same initial load conditions. The elastic interaction coefficient method (EICM) is used as a benchmark to optimize the bolt tightening sequence of aviation components. The EICM is based on an assumed linear relationship between the load variation of the tightened bolt and the final preload. This relationship can be expressed using an elastic interaction coefficient matrix. Different tightening sequences will result in different elastic interaction matrices. A detailed explanation and solution method for elastic interaction matrix A can be obtained by referring to the literature [15] and this will not be repeated in this paper.
Based on the EICM method, the relationship between the initial load and the final load of bolts in different sequences is as follows:
S f = A S i
where S f is the final load, S i is the initial load, and A is the elastic interaction matrix. In a system composed of n bolts, Formula (1) can be expressed as:
S f 1 S f 2 S f 3 S f n 1 S f n = 1 A 1 , 2 A 1 , 3 A 1 , n 1 A 1 , n 0 1 A 2 , 3 A 2 , n 1 A 2 , n 0 0 1 A 3 , n 1 A 3 , n 0 0 0 1 A n 1 , n 0 0 0 1 S i 1 S i 2 S i 3 S i n 1 S i n
where S f k is the final load of bolt k and S i k is the initial load of bolt k. Taking the final load of bolt 1 as an example, according to Formula (2), the final load of bolt 1 can be expressed as:
S f 1 = S i 1 + A 1 , 2 S i 2 + + A 1 , n S i n
According to Formula (3), the final load of any bolt can be calculated under given conditions.
When two bolts are tightened on the aviation component diagonally and at the same time, Formula (2) can be expressed as follows:
s f 1 s f 2 s f n 1 s f n s f n + 1 s f n + 2 s f 2 n 1 s f 2 n = 1 A 1 , 2 A 1 , n 1 A 1 , n 0 A 1 , n + 2 A 1 , 2 n 1 A 1 , 2 n 0 1 A 2 , n 1 0 0 0 A 2 , 2 n 1 0 0 0 1 0 0 0 0 0 0 A n , 2 A n , n 1 1 0 A n , n + 2 A n , 2 n 1 0 0 A n + 1 , 2 A n + 1 , n 1 A n + 1 , n 1 A n + 1 , n + 2 A n + 1 , 2 n 1 A n + 1 , 2 n 0 0 A n + 2 , n 1 0 0 1 A n + 2 , 2 n 1 0 0 0 0 0 0 0 1 0 0 A 2 n , 2 A 2 n , n 1 0 0 A 2 n , n + 1 A 2 n , 2 n 1 1 s i 1 s i 2 s i n 1 s i n s i n + 1 s i n + 2 s i 2 n 1 s i 2 n
When two bolts are tightened the aviation component apart simultaneously, Formula (2) can be expressed as follows:
s f 1 s f 2 s f n 1 s f n s f n + 1 s f n + 2 s f 2 n 1 s f 2 n = 1 A 1 , 2 A 1 , n 1 A 1 , n 0 A 1 , n + 2 A 1 , 2 n 1 A 1 , 2 n 0 1 0 A 2 , n 0 0 0 A 2 , 2 n 0 A n 1 , 2 1 A n 1 , n 0 A n 1 , n + 2 0 A n 1 , 2 n 0 0 0 1 0 0 0 0 0 A n + 1 , 2 A 1 , 2 n 1 A n + 1 , n 1 A n + 1 , n + 2 A n + 1 , 2 n 1 A n + 1 , 2 n 0 0 0 A n + 2 , n 0 1 0 A n + 2 , 2 n 0 A 2 n 1 , 2 0 A 2 n 1 , n 0 A 2 n 1 , n + 2 1 A 2 n 1 , 2 n 0 0 0 0 0 0 0 1 s i 1 s i 2 s i n 1 s i n s i n + 1 s i n + 2 s i 2 n 1 s i 2 n
By contrasting Formulas (2), (4) and (5), it can be found that when two bolts are used to tighten the aviation component at the same time, the 0 values in the corresponding elastic interaction coefficient matrix increase, and this means that the effect of elastic interaction during the aviation component tightening process is reduced. The correctness of the scheme is verified in theory.
In matrix A, a bolt that has been tightened has no effect on the bolt that is subsequently tightened. So its coefficient in the matrix is zero. Usually the elastic interaction coefficient in the matrix is negative because the change of load is usually a loss. Under the condition that the tightening sequence is known, the elastic interaction coefficient matrix A can be obtained. When the matrix A is known, the initial load can be solved according to Formula (6).
S i = A 1 S f

3.2. Verification of the Tightening Scheme Based on a Finite Element Simulation Method

As the aviation component cannot be seamlessly docked during the docking process, there will be a gap between the control cabin front section and the aviation component front section cabin, as shown in Figure 4. During the process of aviation component bolt tightening, the gap between the control cabin and the aviation component front section cabin will affect the tightening process. Therefore, in the process of bolt tightening and subsequent analysis, the gap between the control cabin front section and the aviation component front section cabin is considered. As described in Section 2, the gap value is known in the process of building the finite element model and subsequent surrogate model of the aviation component bolt tightening.
A finite element simulation model of the aviation component bolt tightening was constructed with Ansys Workbench. The aviation component material and bolt material were all high strength steel, its Young’s modulus was 209 GPa at room temperature, and the Poisson’s ratio was 0.29. In order to improve the accuracy of the calculation, the mesh on the contact surface was subdivided. Due to of the irregular shape of the aviation component, the main volume of the aviation component was divided into different volumes to apply the hex dominant meshing method. The mesh cell size was set to 4 mm. The grid of the bolt and the screwed surface was refined, and the grid of the fixed support (bottom surface) was roughened. The grid was generated following the above method, the aviation component generated 683,712 nodes and 341,801 cells, as shown in Figure 5.
In the connection setting of the finite element simulation model, the contact type between the bolts and the aviation component front section cabin was set as“non-separation”. The contact type between the screw and the bolt hole was set as“frictional” contact, and the contact type between the control cabin front section and the aviation component front section cabin was set as“frictional” contact; the friction coefficient was 0.2 (0.2 is the friction coefficient between a rigid body and another rigid body). The Lagrange algorithm was used as the contact formula in advanced settings to improve the calculation accuracy. In order to improve the convergence of calculation, the contact behavior mode was set to symmetrical contact. The small sliding algorithm was used to improve the convergence rate.
In the case of considering the gap between the control cabin front section and the aviation component front section cabin, tightening the bolts with a small gap first made the bolt tightening face corresponding to the large gap tilt upward. The result was that there was a bigger gap between the control cabin front section and the aviation component front section cabin. This larger gap and the larger deformation of the aviation component would make the bolt tightening more difficult and produce an uneven residual preload of the bolts. Therefore, the bolts located at the larger gap should be tightened first. The bolt at the largest tightening gap was marked as bolt 1. The number of bolts that needed to be tightened between the control cabin front section and the aviation component front section cabin was only eight, and the eight bolts were symmetrically and evenly distributed. After tightening bolt 1, tightening bolt 8 or bolt 2 would have the same effect. Therefore, the following simulation sequence was set in this paper: single-bolt sequence tightening: 1→2→3→4→5→6→7→8; single-bolt interval tightening: 1→3→5→7→2→4→6→8; single bolt interval two-bolt tightening: 1→4→7→2→5→8→3→6; single-bolt diagonal tightening: 1→5→2→6→3→7→4→8.
The preload was set to 72 KN and the time step was used to control the bolt tightening sequence. In order to ensure the accuracy of the simulation results without mutation, a total of 96 steps were set. With 96 load steps, every 8 load steps, the bolt stress value reached 72 KN. At step 96, the preload of all bolts was 72 KN. The maximum gap between the aviation component front section cabin and the control cabin was 0.1 mm, and the axis inclination angle was 0.2°. The maximum deformation curve of the aviation component is shown in Figure 6.
It can be seen from Figure 6 that the maximum deformation of the aviation component corresponding to sequence tightening and interval tightening exceeded 1 mm. Among the four tightening sequences, the deformation of the aviation component caused by sequence tightening was the largest. The deformation of the aviation component caused by interval two-bolt tightening was close to 1 mm, and the deformation caused by diagonal tightening was the smallest, at about 0.8 mm. Using the above four methods to tighten the aviation component, the maximum deformation reached the peak value many times, and the damage was serious.
In addition to observing the maximum deformation of the aviation component, the magnitude and uniformity of the residual preload of bolts were also taken as evaluation parameters. We compared the tightening sequences as good or bad based on these two characteristics. In addition to using finite element simulation to measure the bolts’ residual preload, an ultrasonic measuring instrument was used to measure the residual preload of the bolts. The name of the measuring equipment was an electromagnetic ultrasonic double-wave bolt stress instrument, and the equipment model is ST100, as shown in 
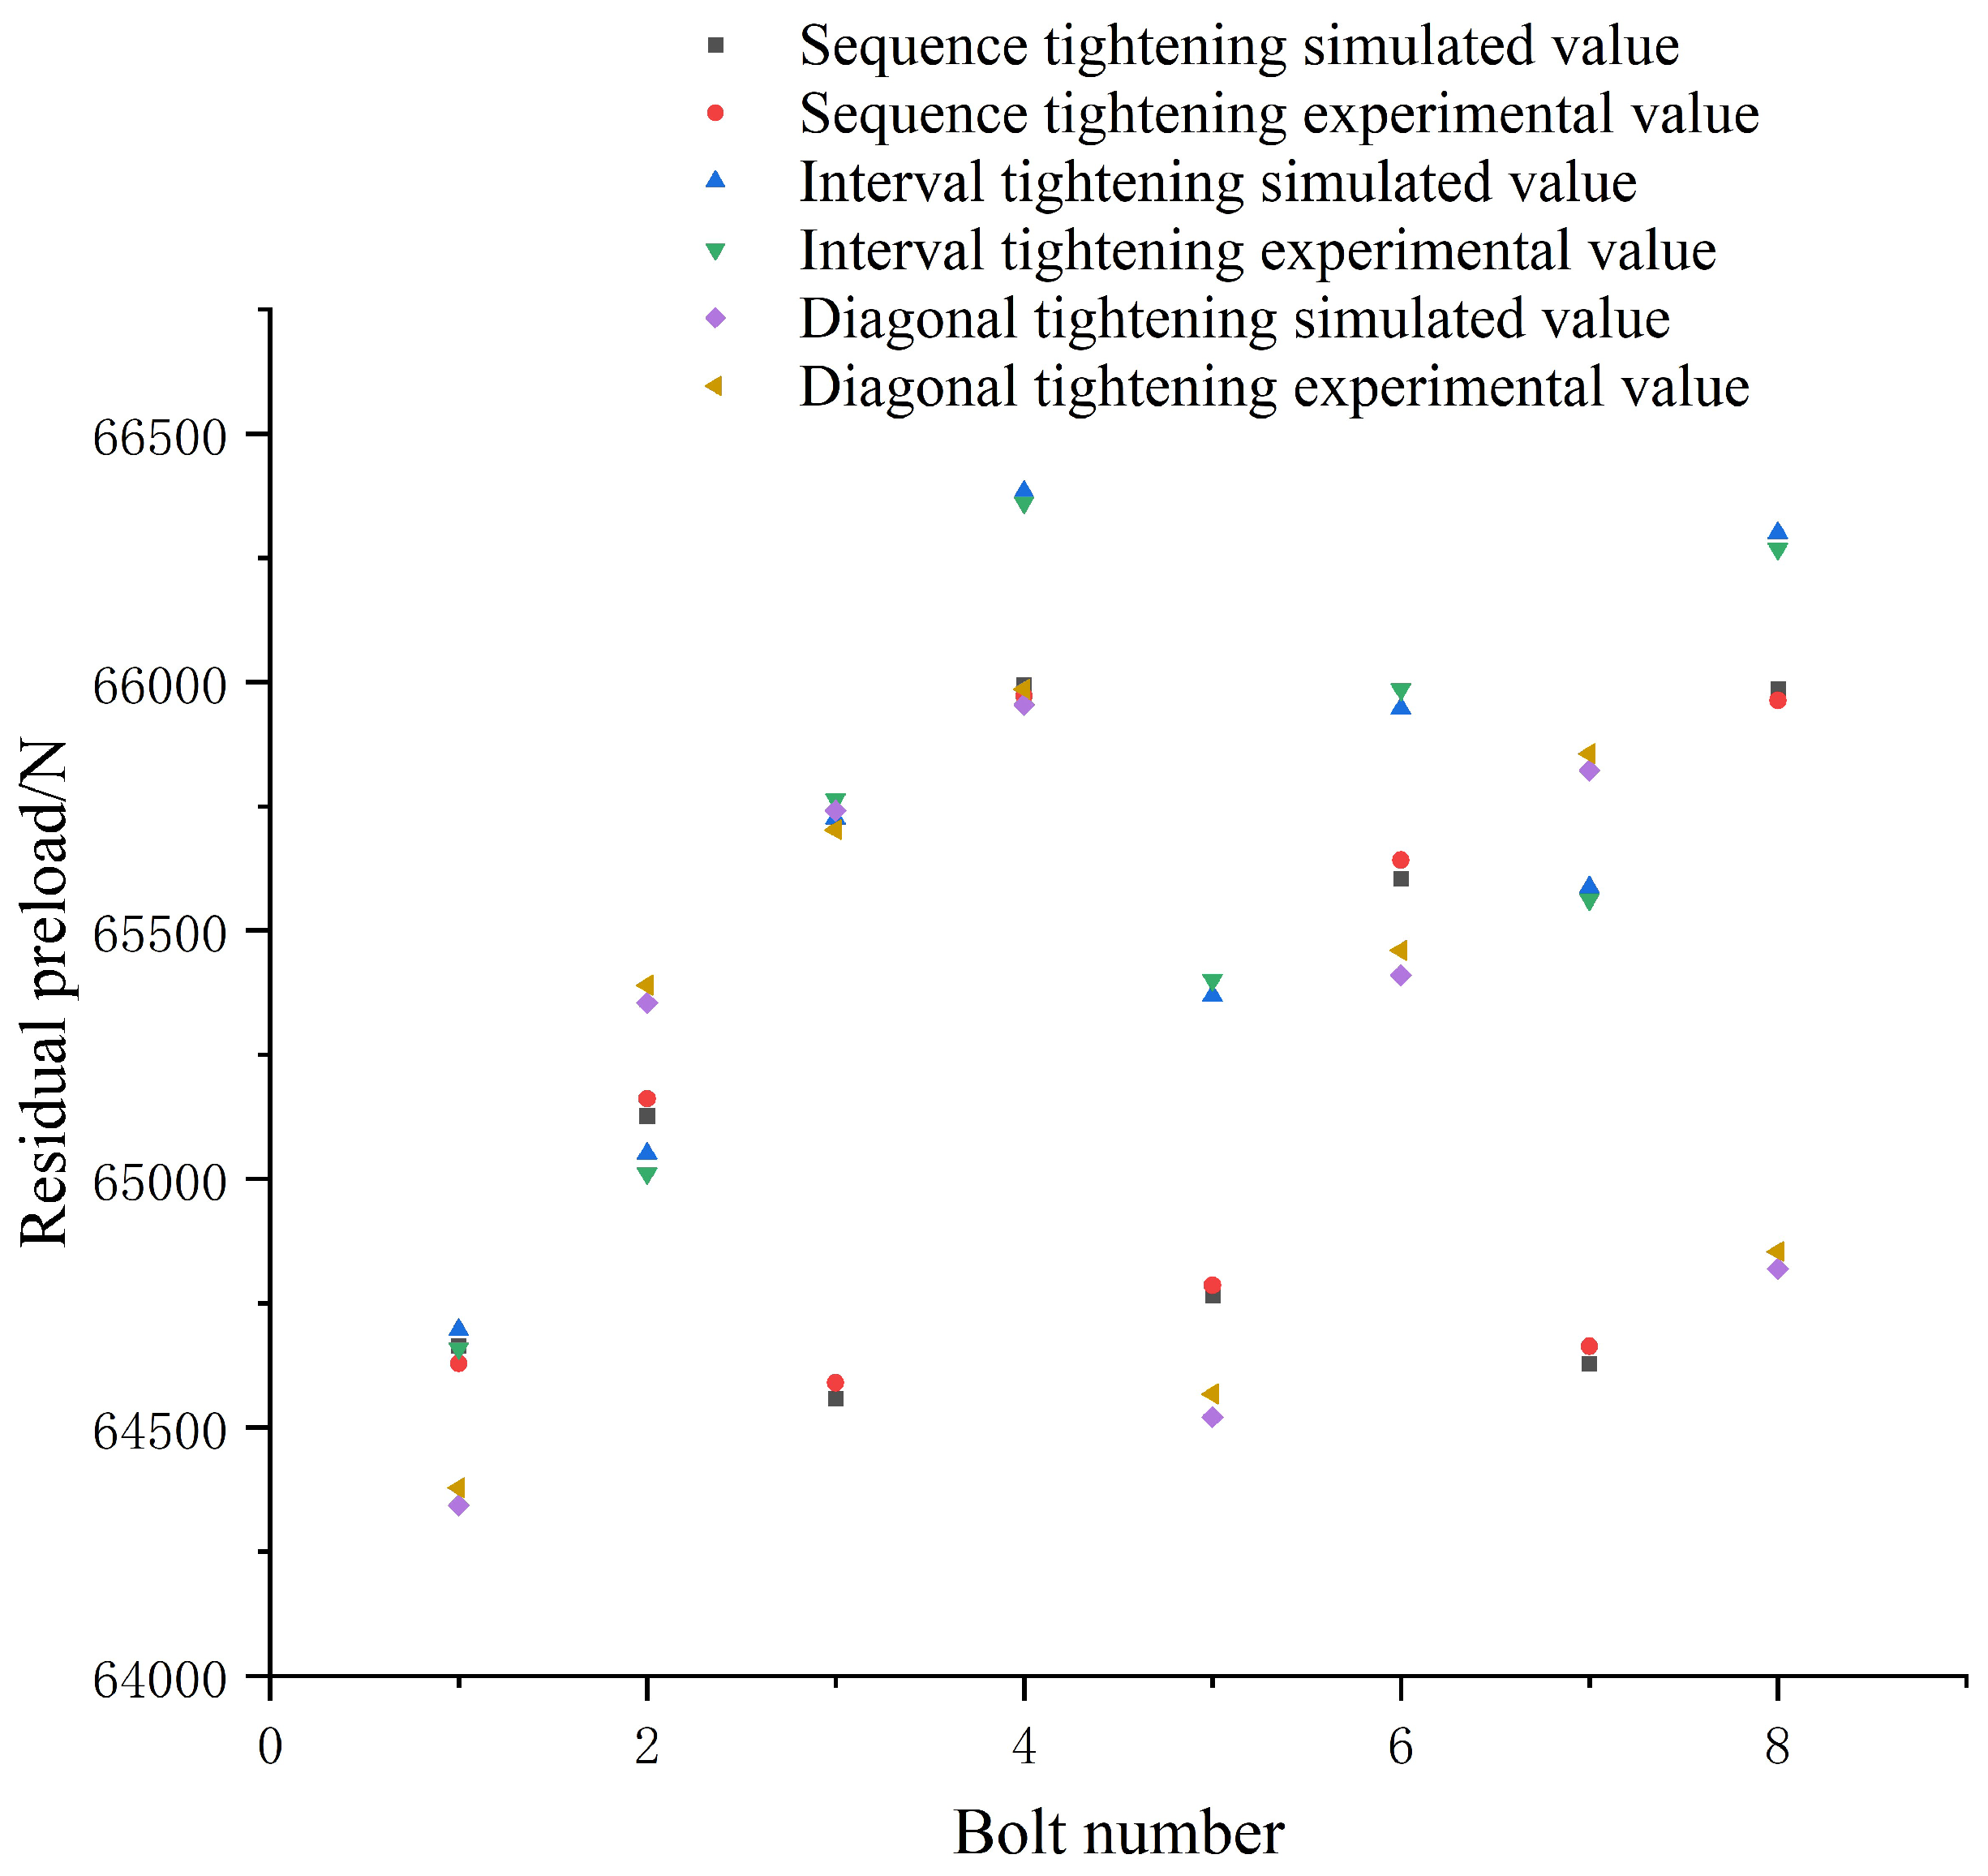
Figure 7. As the temperature affects the speed of the ultrasound, the experiment temperature remained unchanged. The accuracy of the instrument is less than ±3%, which ensured the precision of the experiment. An ultrasonic generator was installed at the bolt end, to measure the time delta between the transmitting and receiving signals of the ultrasonic equipment under the conditions of unscrewed and screwed bolts. The deformation of the bolt during the tightening process was calculated. By multiplying the deformation by the cross-sectional area of the bolt, the elastic modulus of the bolt material, and then dividing by the clamping length of the bolt, the preload of the bolt could be obtained. The residual preload of the bolts in the above four sequences was measured with an ultrasonic measuring instrument and compared with the simulation value under the condition of a 0.1 mm gap. The results are shown in Figure 8.
It can be seen from Figure 8 that the maximum error between the simulation value and the experimental value of the four sequences was less than 45.0, which accounted for 0.75% of the simulation value. This verified the correctness of the simulation results. The average values of the four tightening methods’ residual preload were 59,946 N, 60,915.1 N, 60,847.9 N, and 60,775.5 N, respectively. When we used the interval tightening sequence to tighten the aviation component, the average residual preload value of the aviation component was the largest. The variance was used to judge the average degree of residual preload. The residual preload variance of the sequence tightening was 949.474, which is the lowest average. The residual preload variance of interval tightening was 780.079 and the residual preload variance of interval two-bolt tightening was 862.461. The corresponding variance of the diagonal tightening was 707.967, which was the most uniform. It can be seen that the average degree of unevenness of the diagonal tightening was still large, so the tightening sequence needed to be optimized.According to the optimization scheme proposed above, the optimization was carried out by tightening two bolts simultaneously.
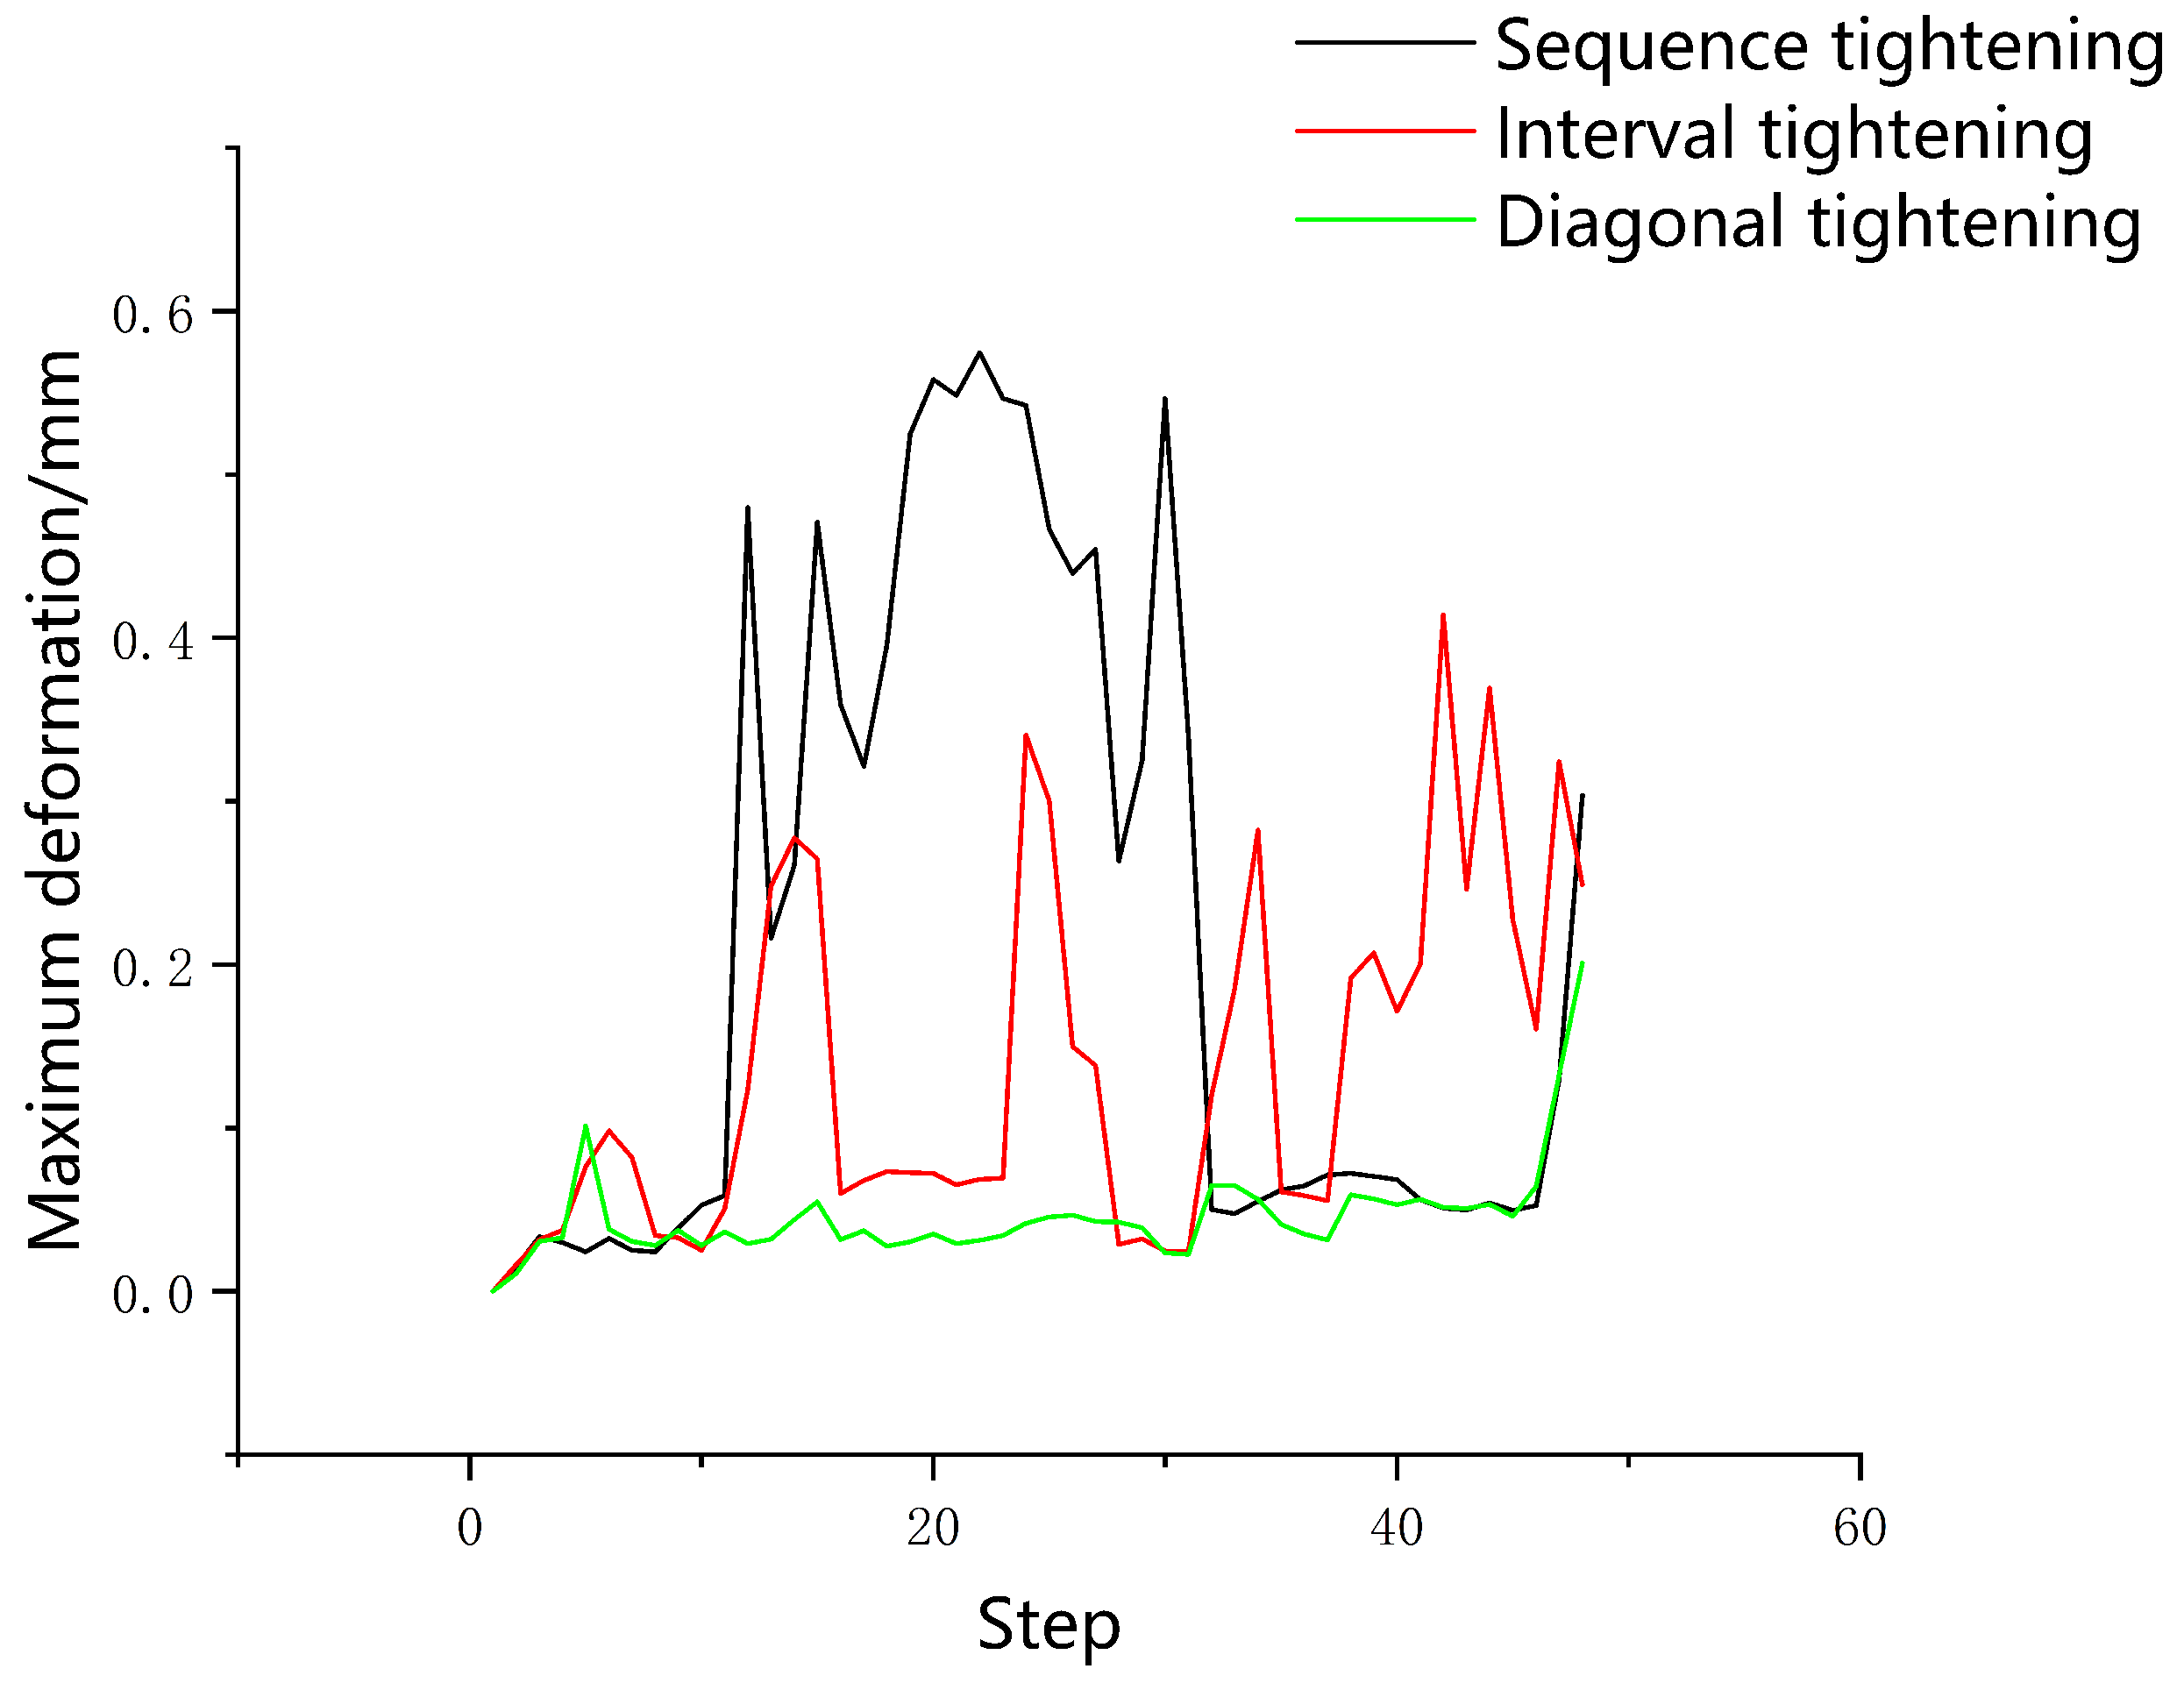
The new method was to use two bolts to tighten the aviation component at the same time, and two diagonal bolts were chosen as a group. The preload was still set to 72 KN, and 48 steps were set. The following simulation sequences were constructed: two-bolt sequence tightening: 1,5→2,6→3,7→4,8; two-bolt interval tightening: 1,5→3,7→2,6→4,8; two-bolt diagonal tightening: 1,5→4,8→2,6→3,7. The maximum deformation of the aviation component in the above three sequences is shown in Figure 9.
It can be seen from 
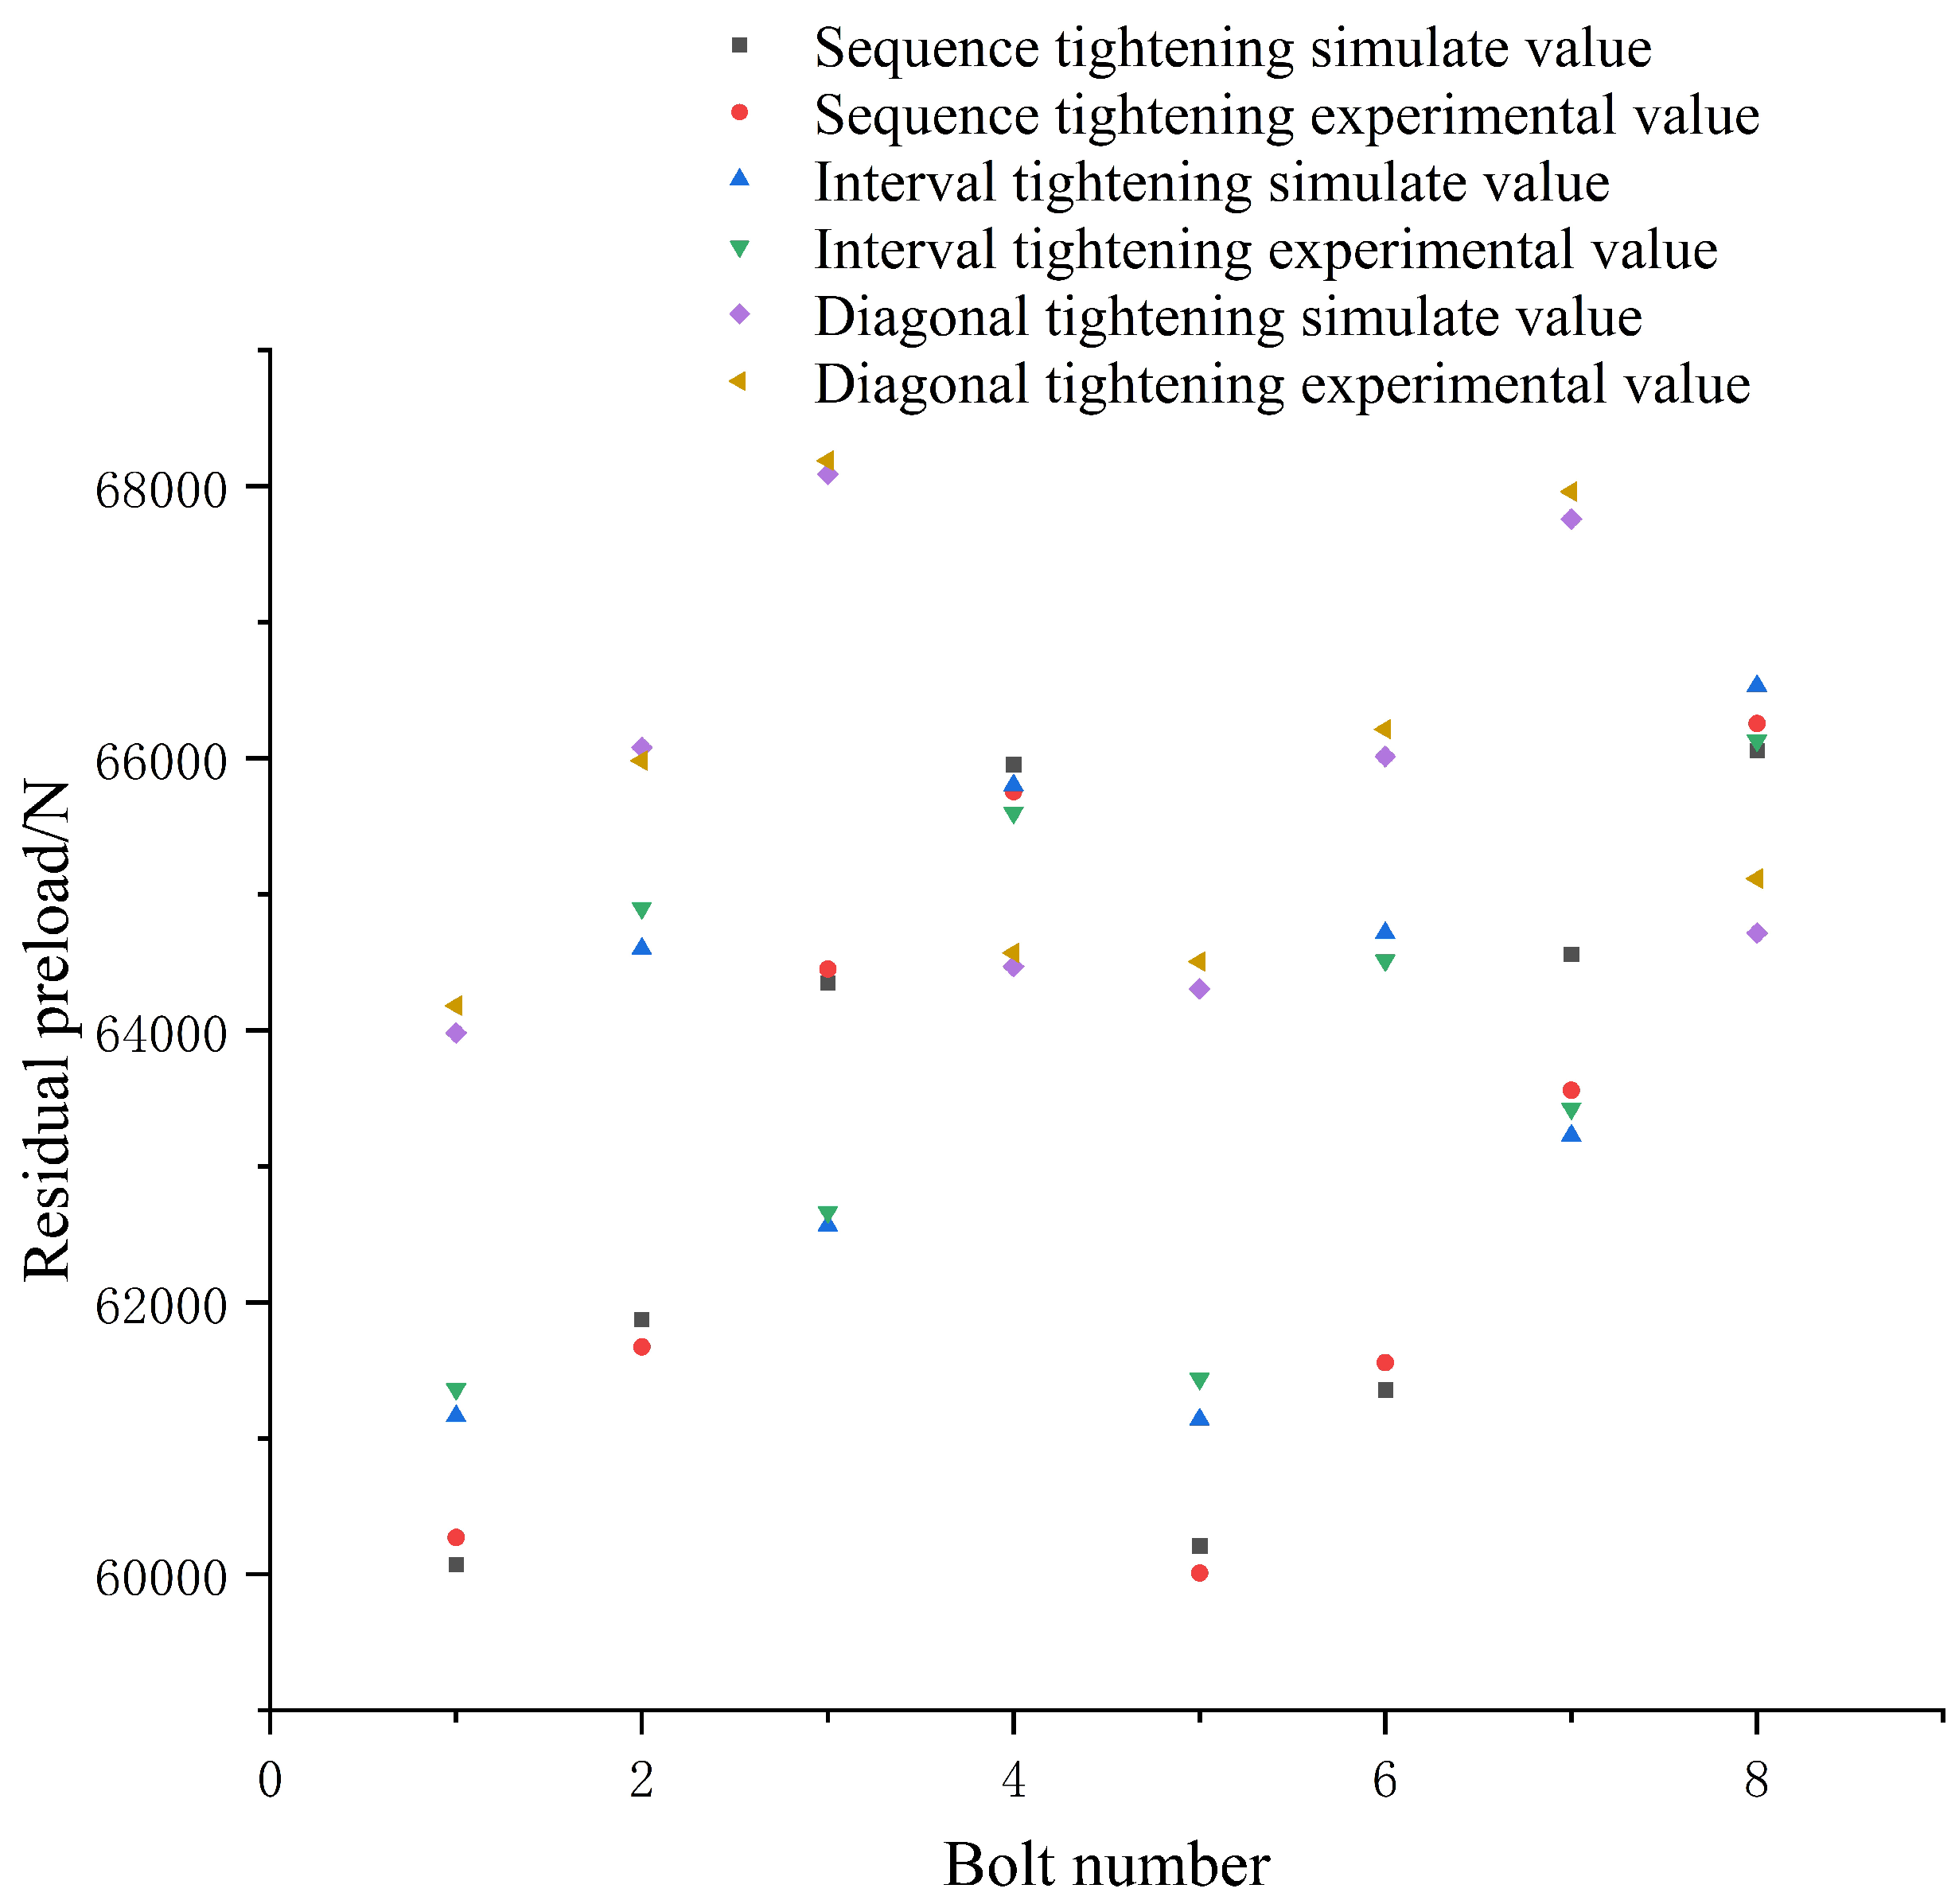
Figure 9 that the deformation caused by the two-bolt sequence tightening was close to 0.6 mm. The maximum deformation caused by two-bolt interval tightening exceeded 0.4 mm, and the deformation reached the peak value many times during the tightening process. The deformation caused by the two-bolt diagonal tightening was about 0.2 mm, and the deformation curve was smooth, with no sudden changes during the tightening process. The simulation and experimental values of the residual preload of the bolts are shown in Figure 10.
It can be seen from Figure 10 that the average value of the residual preload and uniformity of two-bolt tightening were improved compared with single-bolt tightening. The average values of the residual preload of the three sequences were 63,053 N, 63,716 N, and 65,676 N, respectively. The two-bolt diagonal tightening had the highest degree of uniformity, its variance was 478.2. In addition, the average value of two-bolt diagonal tightening of the aviation component was the highest. By comparing all the above sequences, it can be concluded that when the maximum gap was 0.1 mm and the axis inclination angle was 0.2°, two-bolt diagonal tightening was the best tightening sequence for the aviation component.
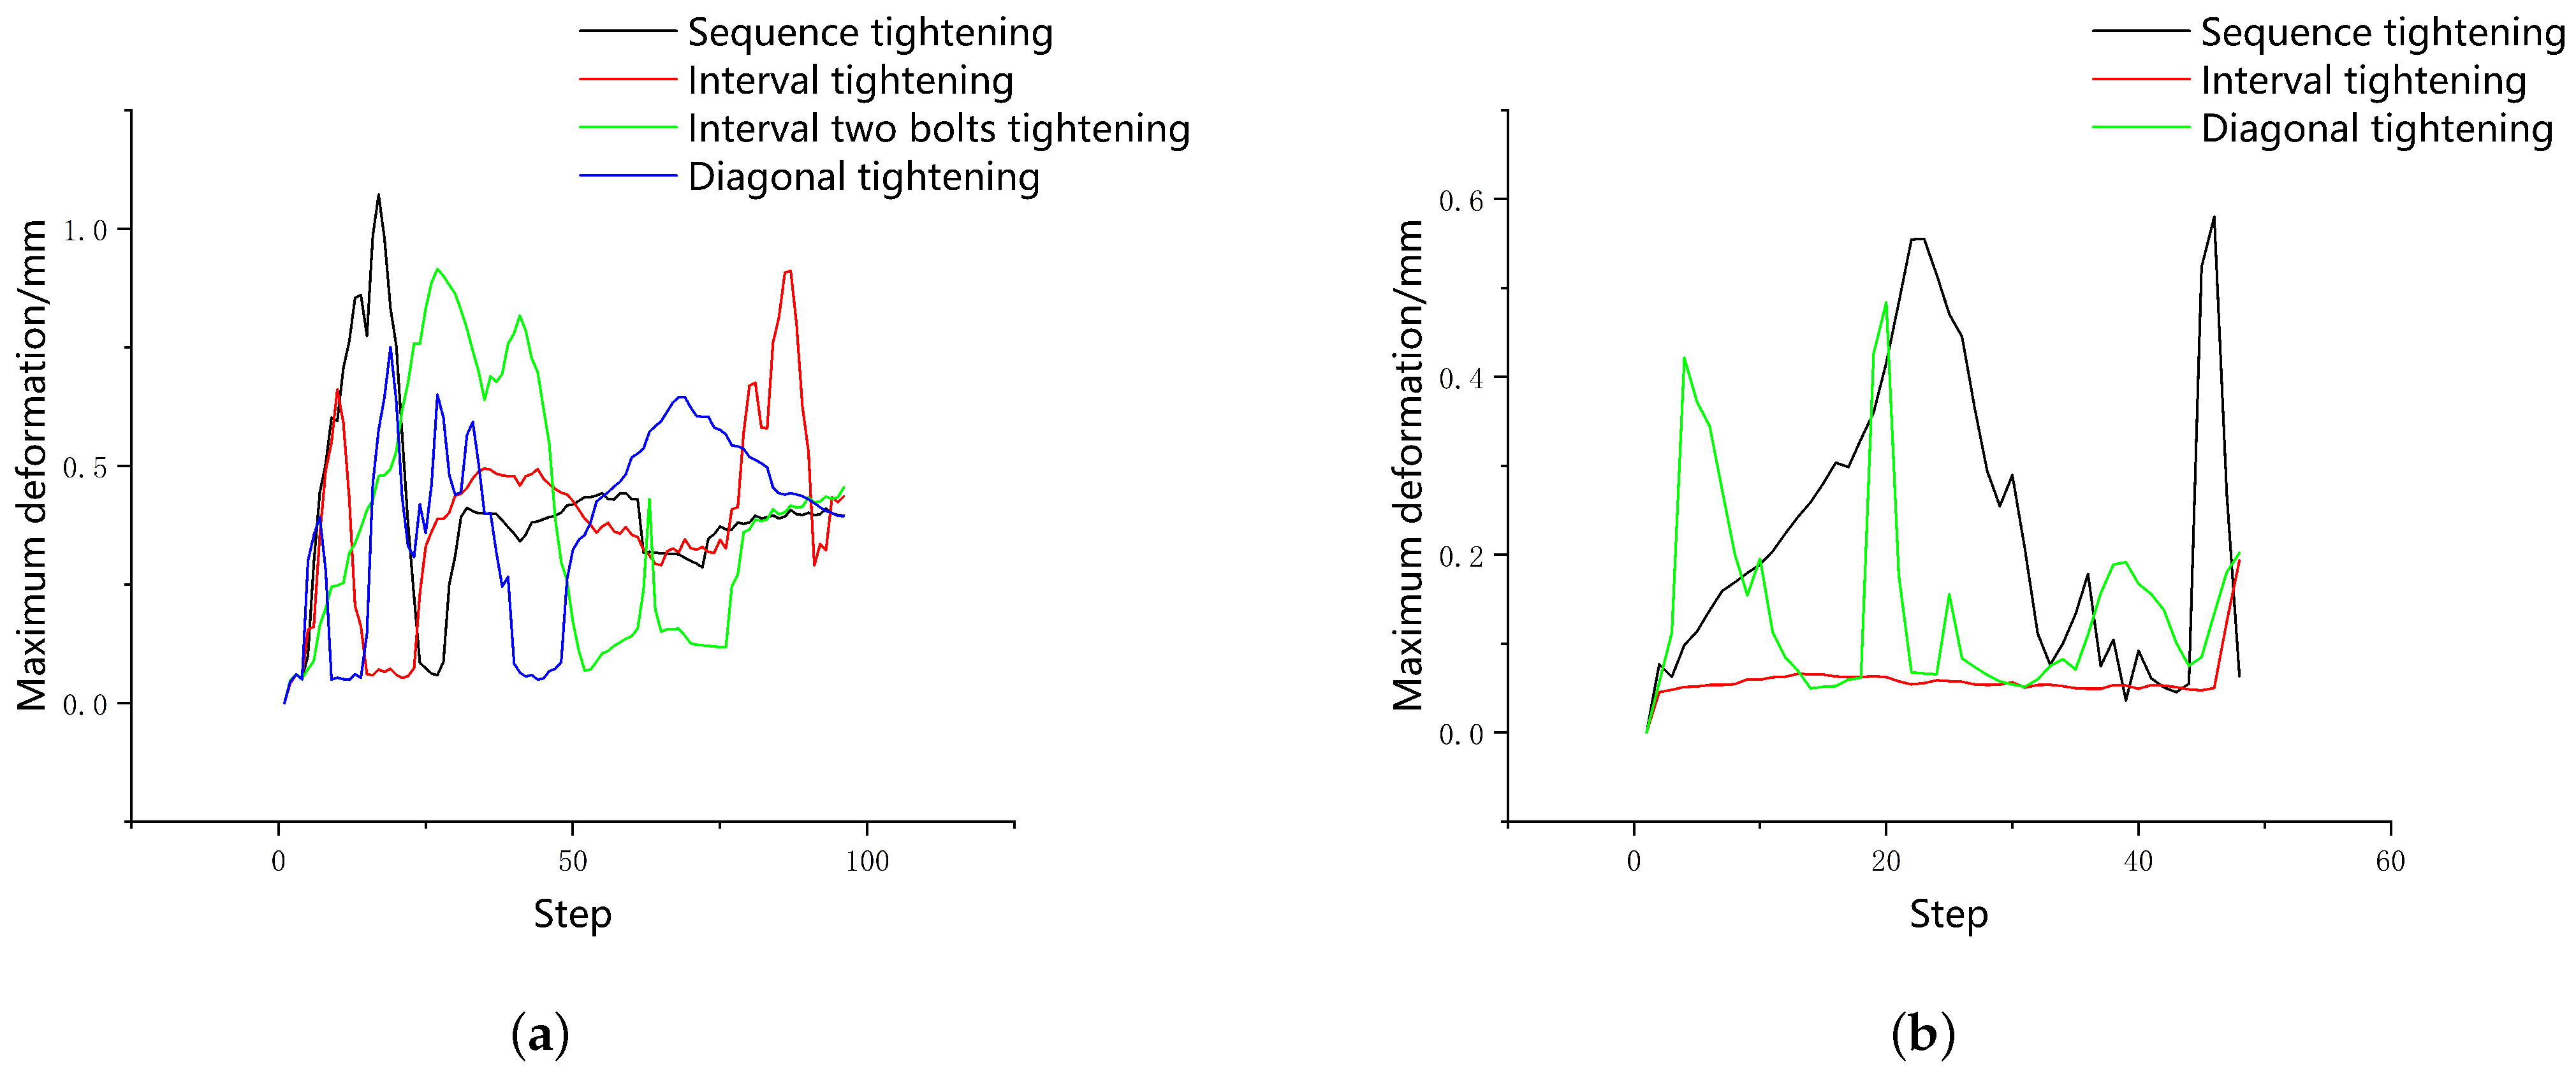
When the maximum gap between the front section cabin and the control cabin was 0.08 mm, and the axis inclination angle was 0.15°, the maximum deformation curve of the aviation component was as shown in Figure 11.
It can be seen from 
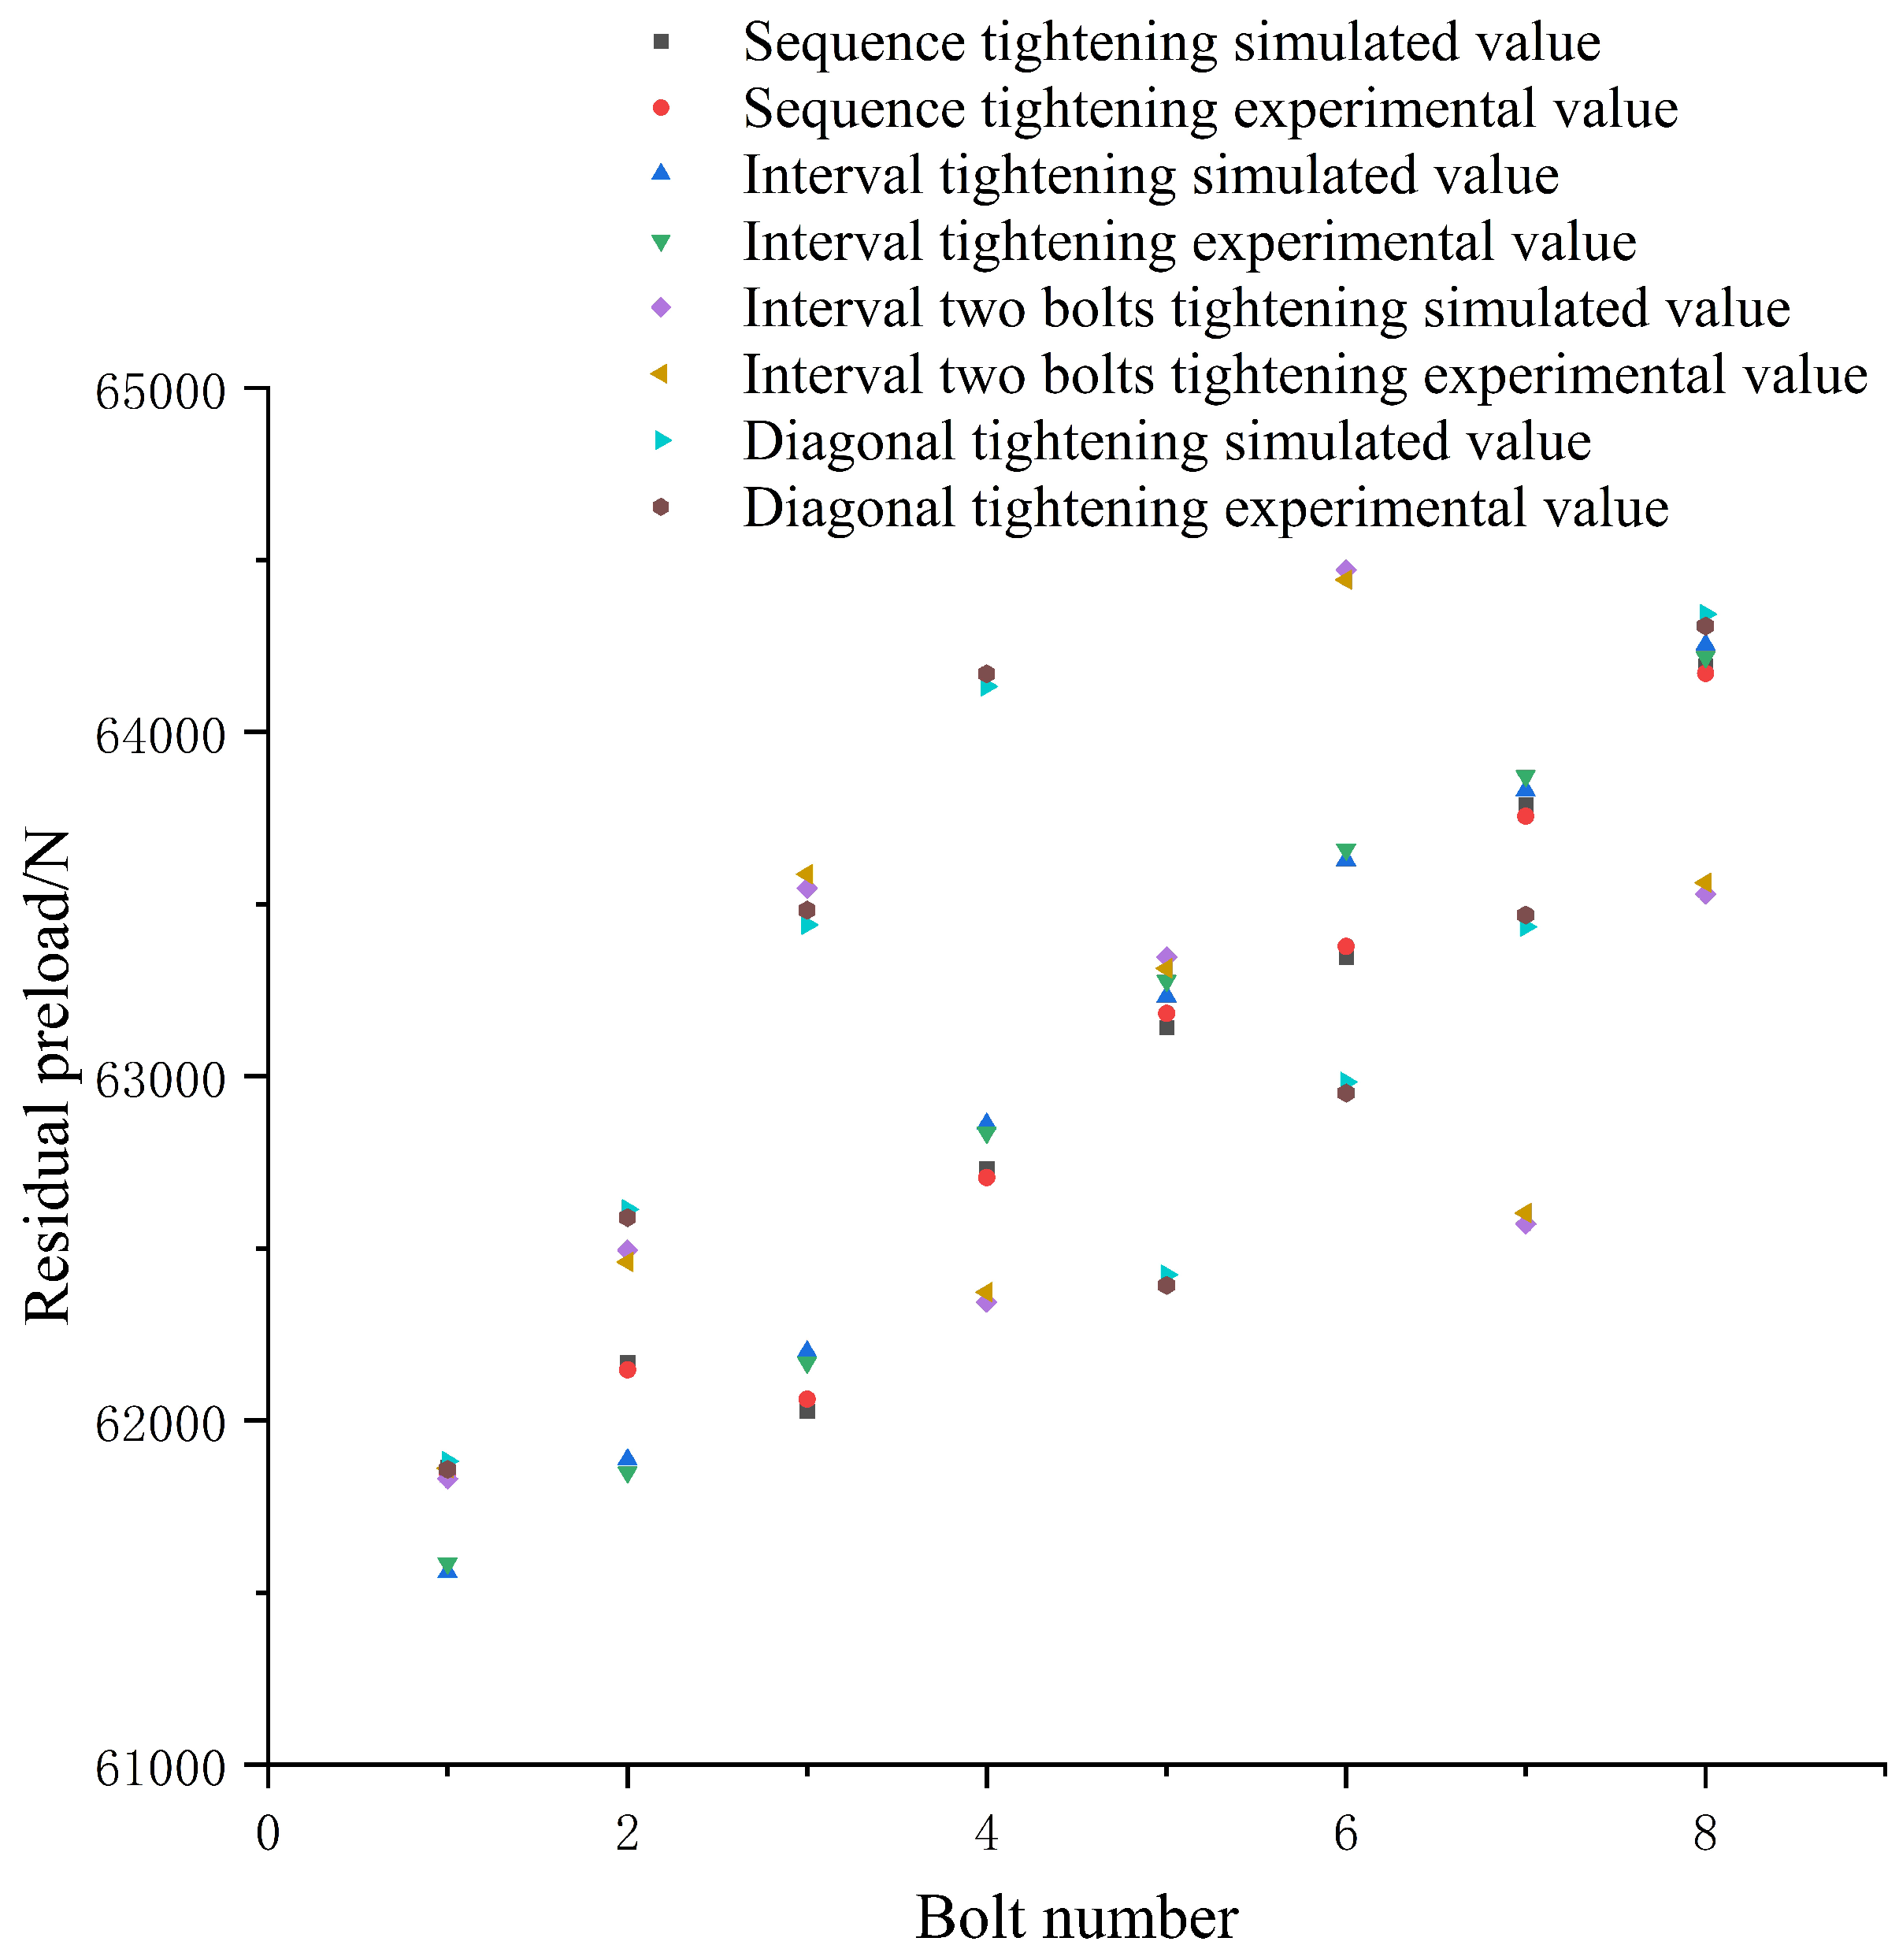
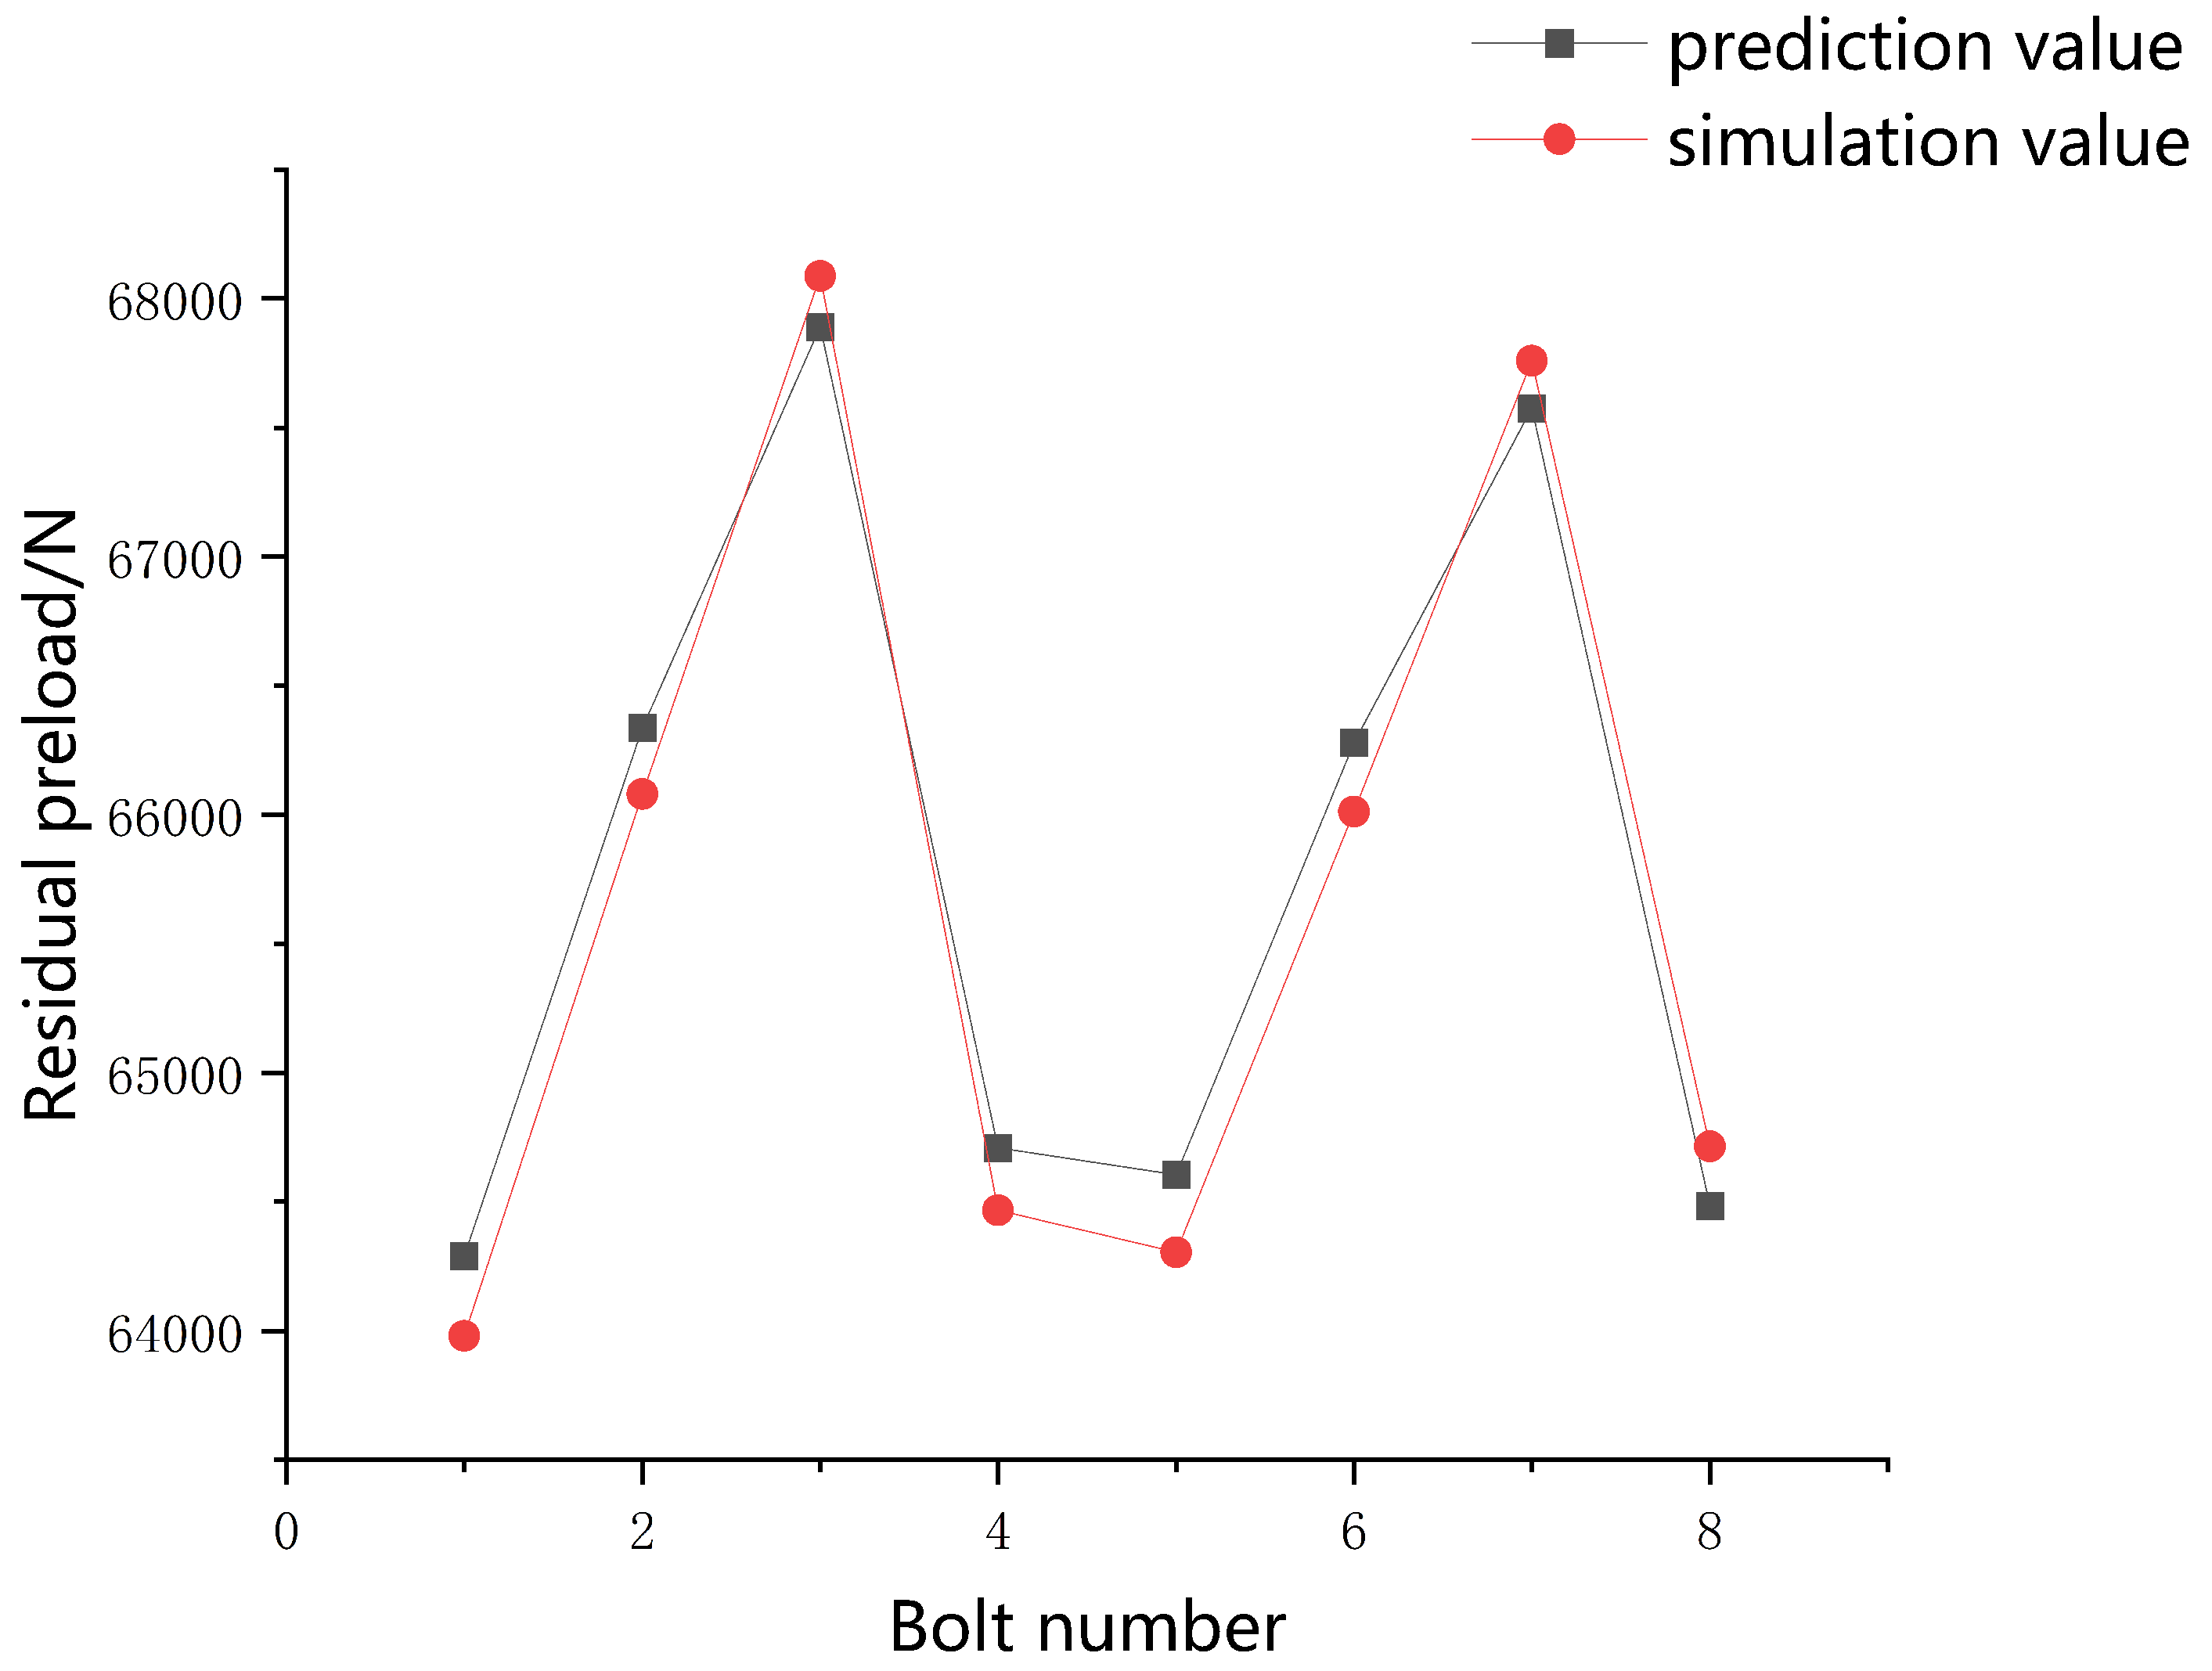
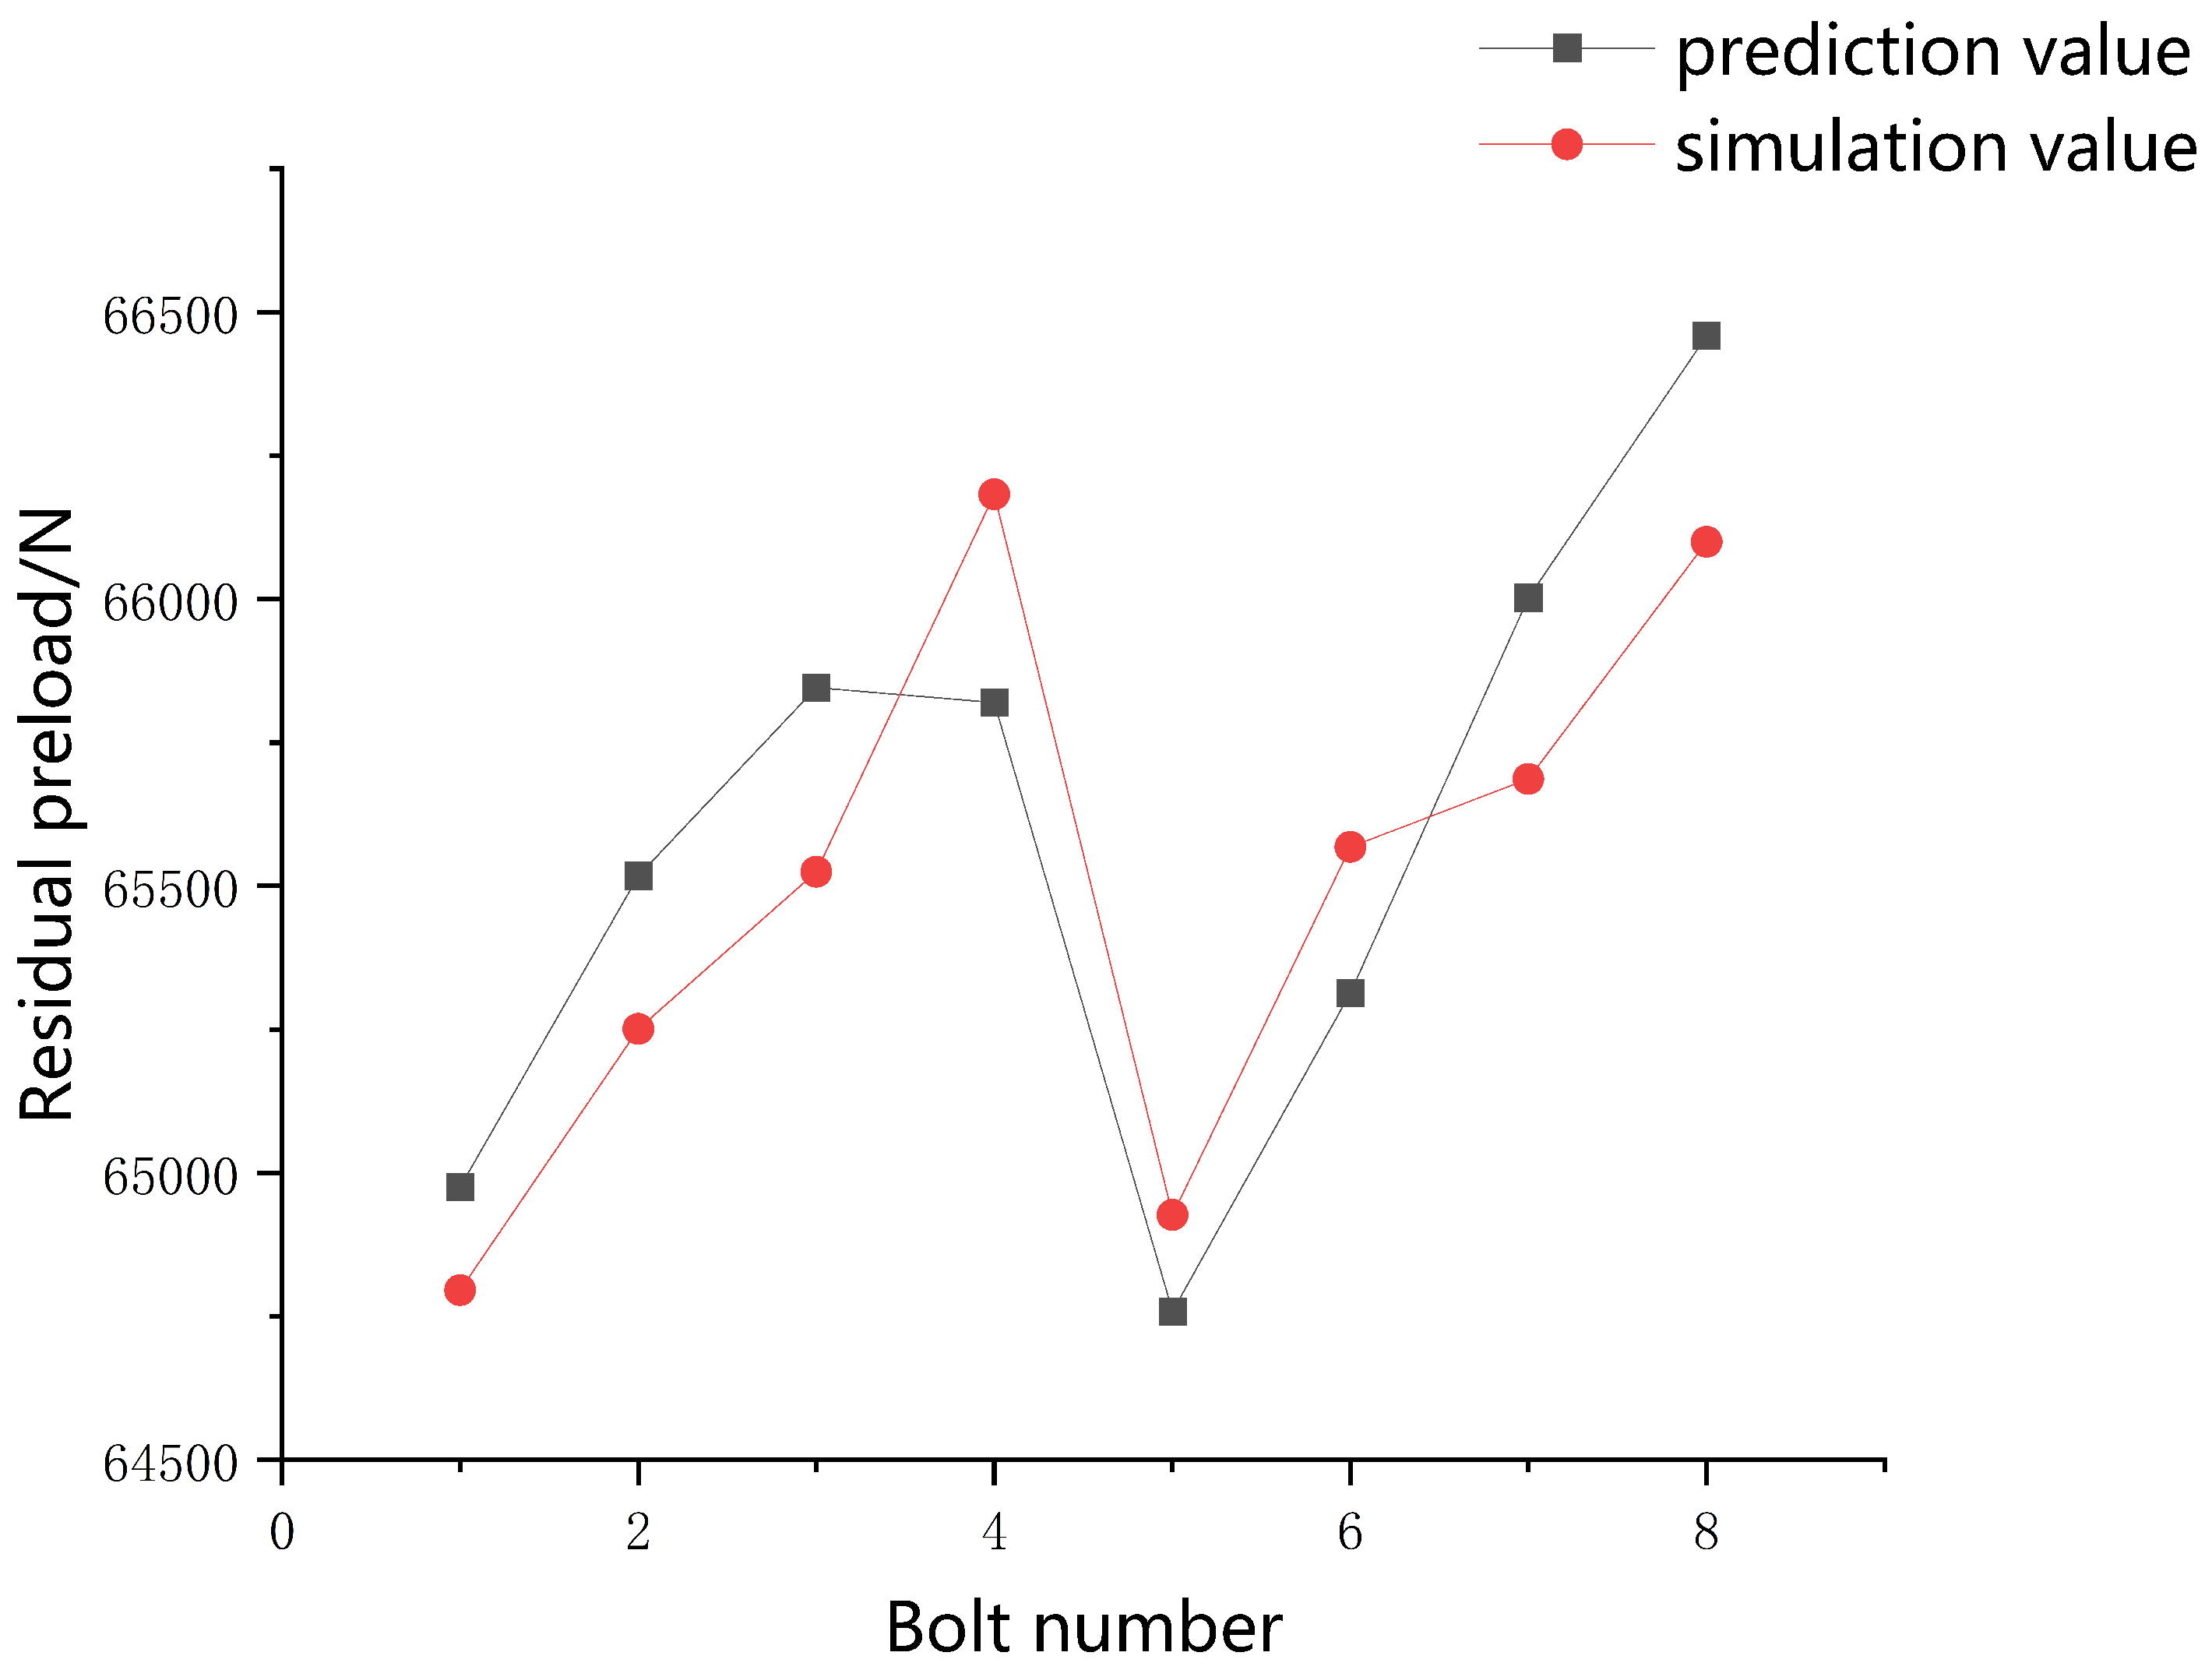
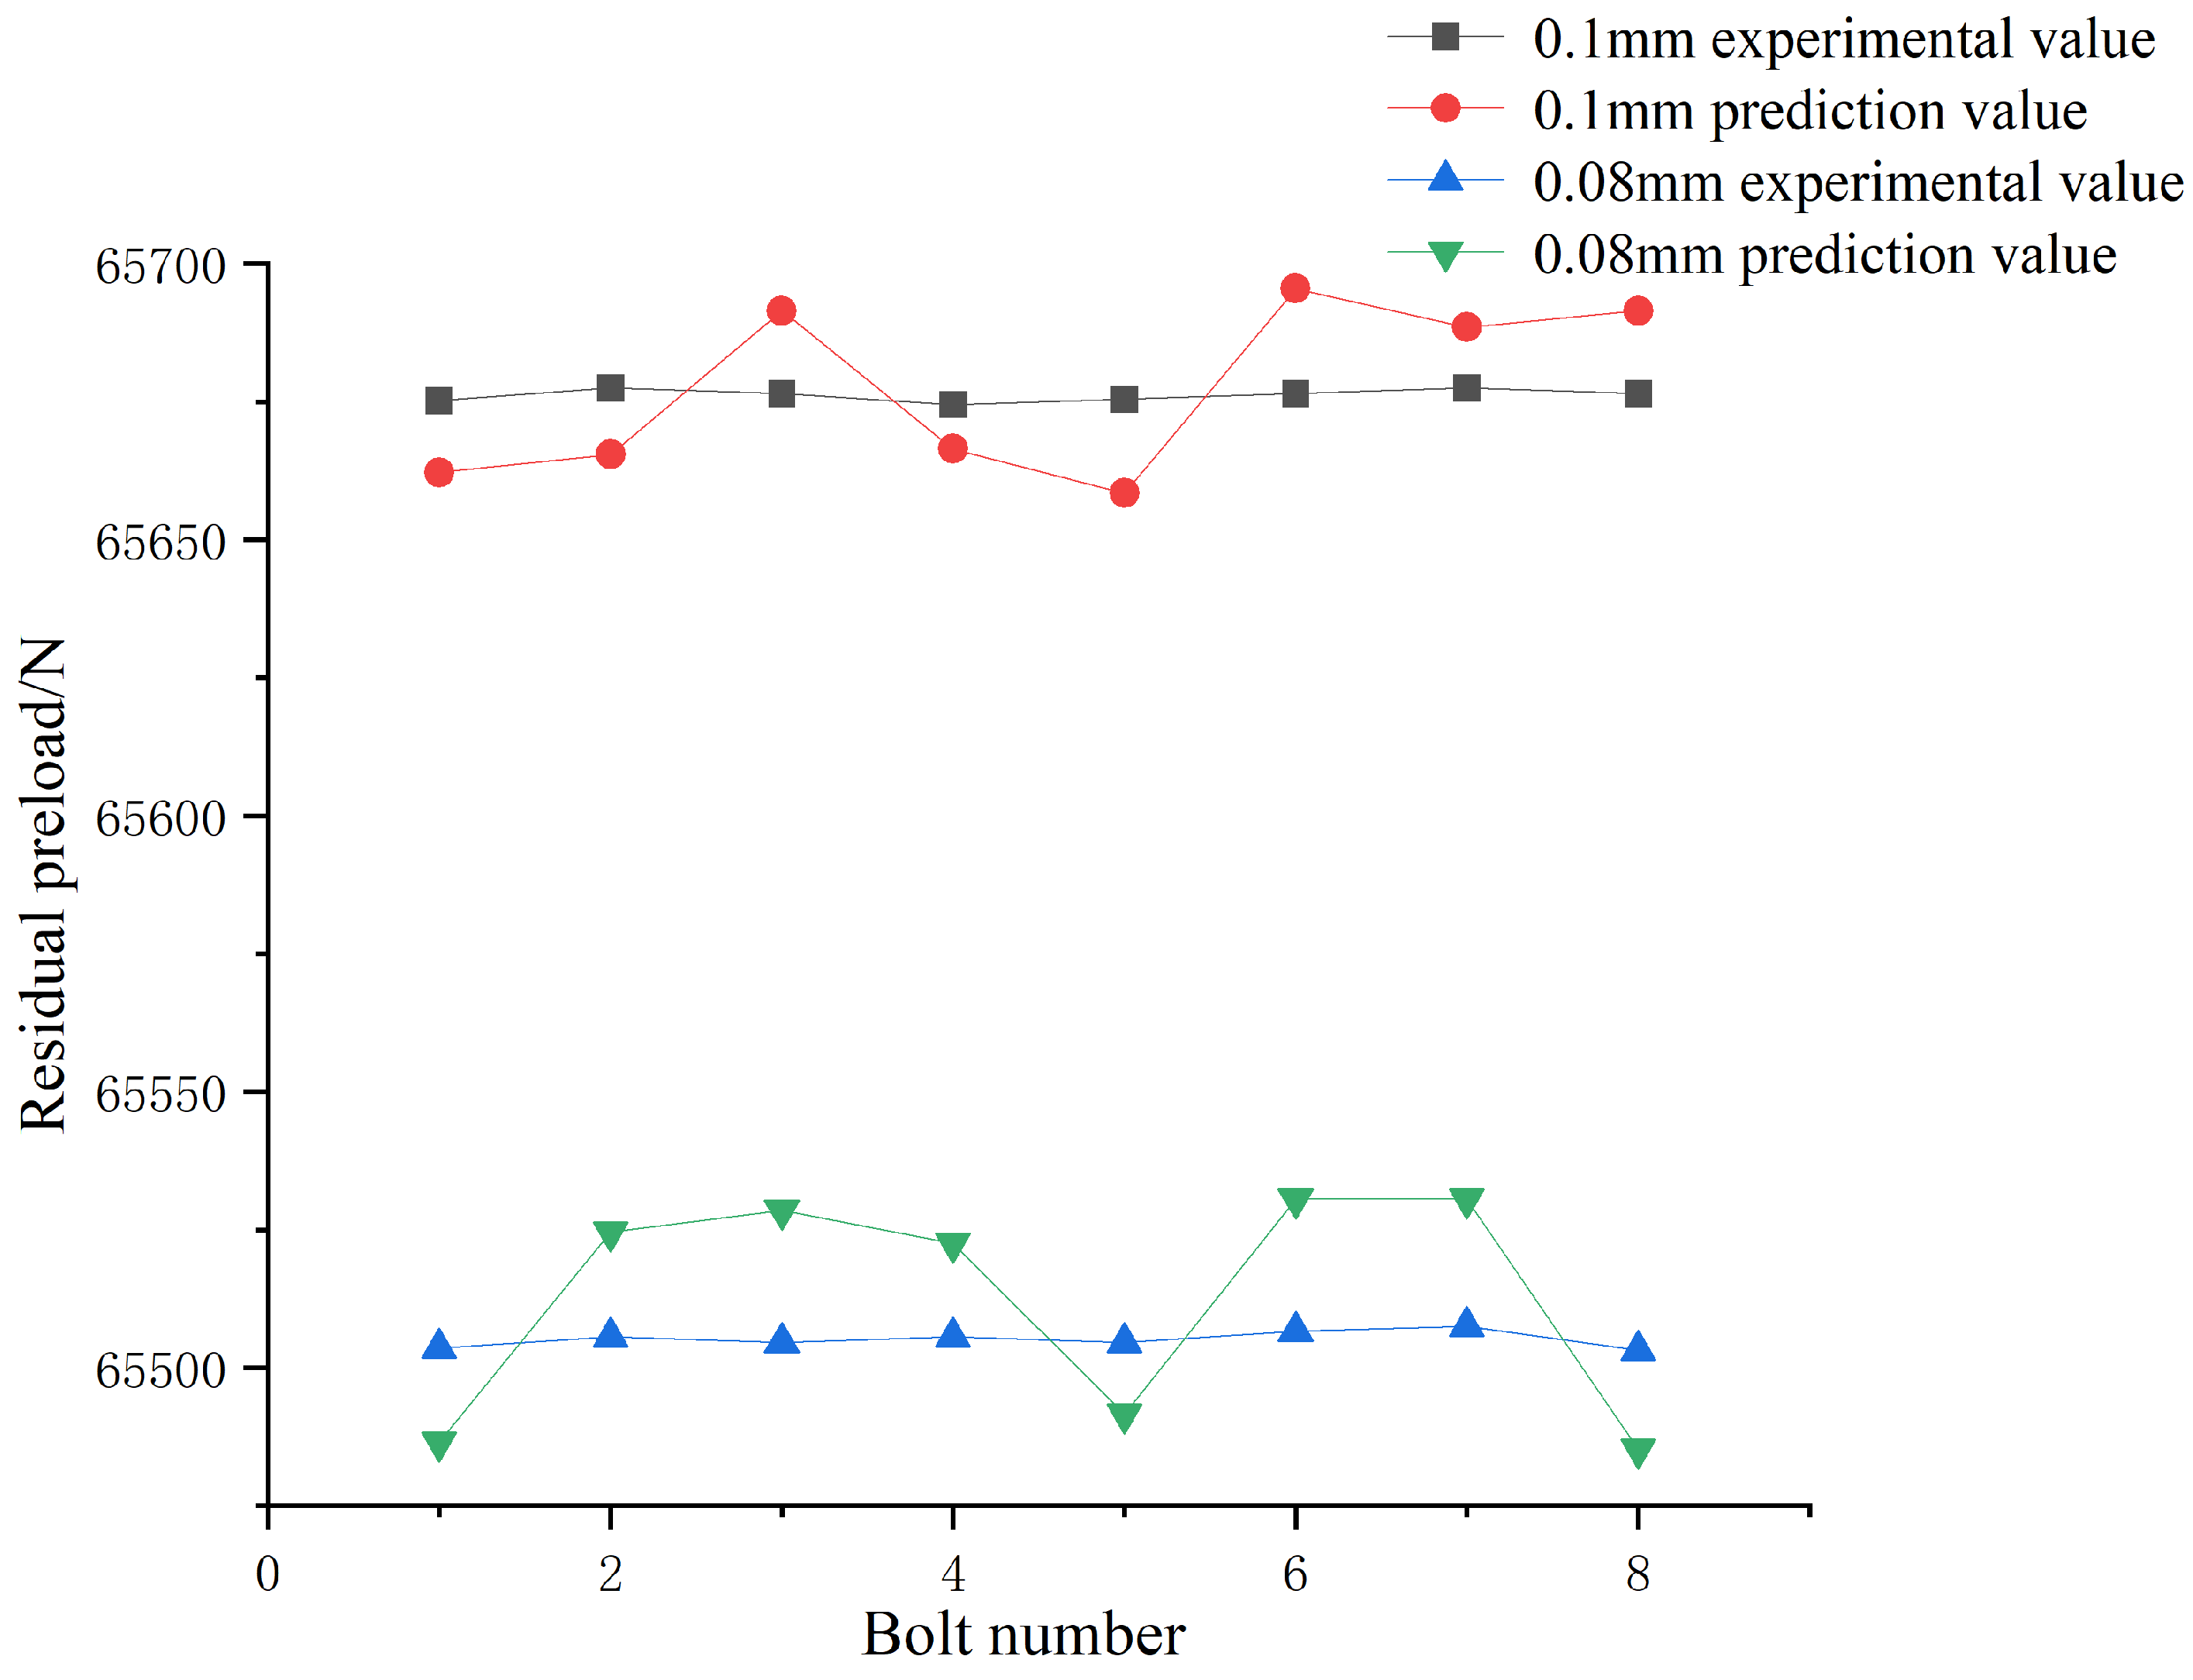
Figure 11 that the maximum deformation of two-bolt tightening was generally lower than that of single-bolt tightening, which verified the correctness of the sequence selection. In the three sequences of two-bolt tightening at the same time, the maximum deformation caused by the two-bolt interval tightening was the smallest, and the deformation curve was the smoothest. The simulation value and experimental value of the residual preload corresponding to the above tightening method are shown in the following Figure 12 and Figure 13:
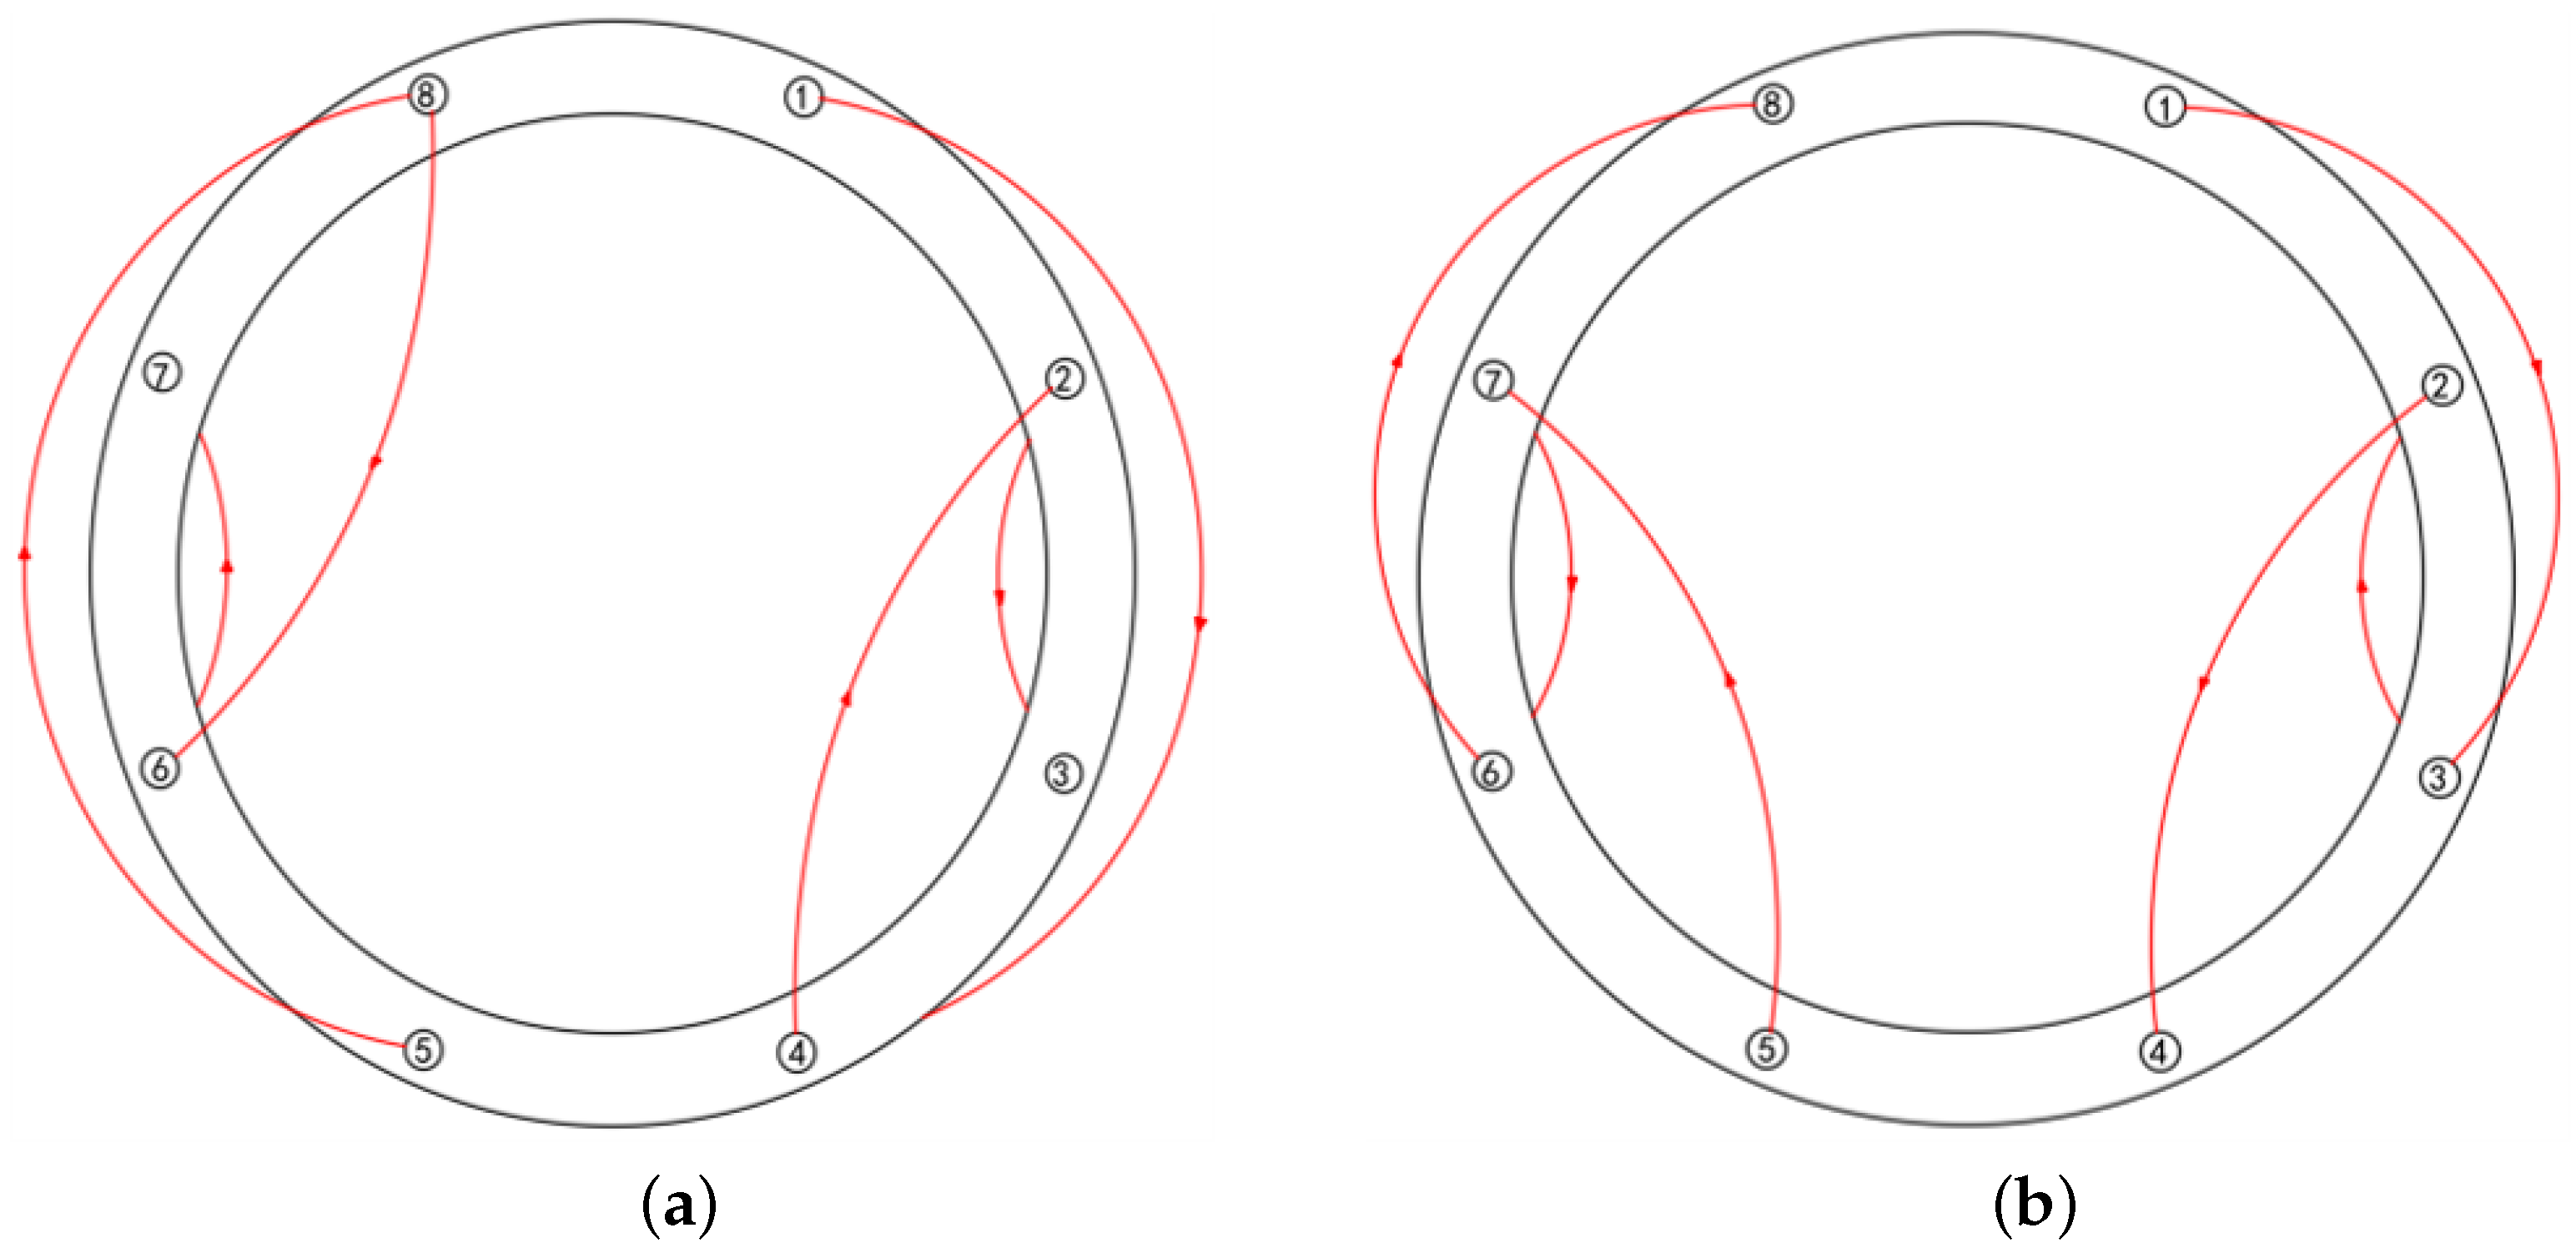
The mean values of the residual preload of the four single-bolt tightening sequences were 62,884.9 N, 62,956.1 N, 62,966.6 N, and 63,006.3 N, respectively. The mean values of the residual preload of the three kinds of two-bolt tightening sequence were 65,090.9 N, 65,504.6 N, and 65,208.1 N, respectively. The average value of the residual preload was the highest when two bolts were tightened at an interval simultaneously. The corresponding variance was 450.3, which was the smallest of all the tightening sequences. Therefore, when the gap value was 0.8 mm and the axis inclination angle was 0.15°, the two-bolt tightening interval at the same time was the best sequence. The two optimal tightening sequences of the aviation component are shown in Figure 14. It can be concluded that the optimal tightening sequence for the aviation component was different under different conditions.

4. Optimal Tightening Sequence Prediction for the Aviation Component Based on a Neural Network Method

From the conclusions of Section 3, it can be seen that the optimal tightening sequence of the aviation component was different under different conditions. Therefore, the optimal tightening sequence for the aviation component under different joint gaps should be calculated separately. As the finite element simulation method takes a long time to calculate, each simulation needed more than 7 h to complete the calculation. If we used the finite element method to plan the bolt tightening sequence of the aviation component, the tightening efficiency would be as low as possible. Therefore, a surrogate model method was proposed to reduce the calculation time and improve the efficiency of the whole tightening process.
The radial basis function (RBF) neural network algorithm has strong robustness and fault tolerance. It uses a parallel processing method to improve the speed of computing, and it has a strong information synthesis ability. Compared with other types of neural network, RBF neural networks have a strong approximation ability. It can approximate any accuracy of the nonlinear function. It also has a global search ability, and its convergence speed is fast. The RBF neural network has a strong input and output mapping function, and it is the forward network that has the best mapping function. Based on the above advantages, this paper used the RBF neural network to establish a surrogate model of the tightening system of the aviation component. This was used to rapidly predict the optimal tightening sequence for the aviation component in the case of different docking gaps and axis inclination angles.

RBF Neural Network

In 1985, Powell [16] proposed the RBF method to solve the multivariable interpolation problem, the method was then applied to the design of neural networks by Broomhead and Lowe in 1988. Then, RBF neural networks were formed. Different from other neural networks, an RBF neural network consists of an input layer, a hidden layer, and an output layer. Therefore, the structure of a RBF neural network is simple. The RBF neural network regards the learning process as finding the surface that can best fit the sample points in high-dimensional space, so that the original linear indivisible problem becomes linear divisible. This surface is then used to interpolate the test data.
The Gauss function has the advantages of simple expression, radial symmetry, and good smoothness; therefore, the Gauss function was chosen as the activation function for the hidden layer. The hidden layer output and neural network output can be expressed as follows:
φ ( x i , c i ) = exp ( x i c i 2 2 σ 2 )
f ( x ) = i = 1 q ω i φ ( x , c j )
where c j is the center point of the j neuron; σ is the width of the Gaussian basis function; x i c i is the Euclidean distance from the sample point to the center point; and ω j is the weight of the j neuron.
The inputs of the neural network surrogate model in this paper are the bolt tightening sequence, the gap value between the aviation component front section cabin and the control cabin front section, and the axis inclination angle between the aviation component front section cabin and the control cabin front section. The network parameters were set as follows: the target value of the network fitting error was 0.0001, and the expansion constant was 0.29. A RBF model was established using MATLAB programming. A total of 200 groups of data were simulated through the finite element method, of which 160 groups were used as training samples, and 40 groups were test samples. The evenness and average value of the residual preload of the bolts were taken as evaluation parameters to select the best tightening sequence. The inputs and outputs of the model were defined. The Latin hypercube method was used to sample data, to ensure the uniformity of data sampling. After the neural network surrogate model of the bolt tightening system of the aviation component had been established, the best tightening process was selected based on this. The selection standard was that the average value of the residual preload of the bolt was the largest and the most uniform. With the help of the genetic algorithm, we could find the best tightening sequence from the surrogate model. Therefore, taking the maximum and average residual preload of the bolts as the optimization objective, the optimal sequence was obtained using the genetic algorithm. Then, the optimal tightening sequence of the aviation component bolts in the design domain was obtained. The neural network prediction process is shown in Figure 15.
Under the conditions of a 0.1 mm gap, 0.2° axis inclination angle, and 0.08 mm gap and 0.15° axis inclination angle, a comparison of the simulation values and the prediction values of the aviation component optimal tightening sequences predicted by the neural network surrogate model is shown in Figure 16 and Figure 17.
As shown in Figure 16 and Figure 17, the basic change curves of the prediction and simulation value were the same. Under the condition of a 0.1 mm gap value, the error between the simulation value and the prediction value of Bolt 1 was the largest, which was 308 N, 0.4% of itself. Under the condition of a 0.08 mm gap value, the error between the simulation value and the prediction value of Bolt 4 was the largest, which was 363 N, 0.5% of itself. Therefore, the deviation between the prediction value and the simulation value could be ignored. The neural network surrogate model could be used to predict the optimal tightening sequence of the aviation component.

5. Calculation of the Initial Preload Based on the Optimal Sequence

In essence, the elastic interaction of the bolts is such that the characteristics of stress and deformation are transmitted in the connected structure under the preload. Then, the preload of each bolt is influenced by the connected structure and the interaction of the bolts. The variation of the preload of each bolt is closely related to the applied preload. The consistency of the residual preload is the main objective of the tightening assembly of the aviation component, to ensure the sealing of the aviation component after bolt tightening.
The results of the neural network prediction experiment and simulation show that under the conditions of a 0.1 mm and 0.08 mm gap value, the best tightening sequences of the two conditions were the two-bolt diagonal tightening and two-bolt interval tightening at the same time. The relationship between the initial load and the final load corresponding to the two tightening modes can be expressed in the following formula:
s f 1 s f 2 s f 3 s f 4 s f 5 s f 6 s f 7 s f 8 = 1 A 1 , 2 A 1 , 3 A 1 , 4 0 A 1 , 6 A 1 , 7 A 1 , 8 0 1 A 2 , 3 0 0 0 A 2 , 7 0 0 0 1 0 0 0 0 0 0 A 4 , 2 A 4 , 3 1 0 A 4 , 6 A 4 , 7 0 0 A 5 , 2 A 5 , 3 A 5 , 4 1 A 5 , 6 A 5 , 7 A 5 , 8 0 0 A 6 , 3 0 0 1 A 6 , 7 0 0 0 0 0 0 0 1 0 0 A 8 , 2 A 8 , 3 0 0 A 8 , 6 A 8 , 7 1 s i 1 s i 2 s i 3 s i 4 s i 5 s i 6 s i 7 s i 8
s f 1 s f 2 s f 3 s f 4 s f 5 s f 6 s f 7 s f 8 = 1 A 1 , 2 A 1 , 3 A 1 , 4 0 A 1 , 6 A 1 , 7 A 1 , 8 0 1 0 A 2 , 4 0 0 0 A 2 , 8 0 A 2 , 3 1 A 4 , 3 0 A 6 , 3 0 A 8 , 3 0 0 0 1 0 0 0 0 0 A 5 , 2 A 5 , 3 A 5 , 4 1 A 5 , 6 A 5 , 7 A 5 , 8 0 0 0 A 6 , 4 0 1 0 A 6 , 8 0 A 2 , 7 0 A 4 , 7 0 A 6 , 7 1 A 8 , 7 0 0 0 0 0 0 0 1 s i 1 s i 2 s i 3 s i 4 s i 5 s i 6 s i 7 s i 8
According to the residual preload obtained using finite element simulation, the elastic interaction matrix A could be worked out. The values of the elastic interaction matrix A under the condition of 0.1 mm gap values are shown in Table 1.
The values of the elastic interaction matrix A under the condition of 0.08 mm gap value are shown in Table 2.
When the elastic interaction matrix is known, the initial preload value could be calculated under the conditions of a 0.1 mm and 0.08 mm gap values, to obtain a uniform residual preload value. The calculated initial preload values are shown in Table 3.
According to the preload in Table 3, the residual preload of the bolts in the two conditions is shown in Figure 18. As can be seen from Figure 18, the stress on the aviation component was uniform when the bolt preload was uniform, and the tightness of the aviation component was improved.
To sum up, when the gap value was 0.1 mm and 0.08 mm, the aviation component was tightened in the manner of two bolts tightening diagonally and two bolts tightening at intervals. When the initial preload in Table 3 was applied to each bolt, the uniformity of the residual preload of each bolt was ensured, thereby ensuring the sealing of the aviation component.

6. Conclusions

In this paper, the tightening problem of an aviation component with different docking gaps was studied. First of all, it was determined that seamless docking between the aviation component front section cabin and control cabin cannot be realized in the process of docking. Therefore, the gap between the aviation component front section cabin and the control cabin was considered as a factor in the tightening process of the aviation component. Second, based on the elastic interaction theory, the reason why the final load was different from the expectation was analyzed. We improved the bolt tightening scheme using elastic interaction theory. Ansys Workbench was used to build a finite element simulation model in real conditions for the aviation component. The maximum deformation and residual preload of the aviation component under different tightening sequences were obtained using a finite element simulation. Through the finite element simulation results, the correctness of the bolt tightening scheme was verified. A neural network surrogate model was generated by taking the sequence of bolt tightening, the value of the gap between the aviation component front section cabin and axis inclination angle between them as the inputs, and the residual preload of each bolt as the output. The best tightening sequence was selected on the basis of the best evenness and the maximum average value of residual preload of each bolt. Finally, a corresponding elastic interaction matrix was obtained under the condition of applying the optimal tightening sequence for prediction. Then the value of the initial preload applied in the optimal sequence to obtain a uniform residual preload was obtained. In this paper, the bolt tightening efficiency of an aviation component was improved, and a time-consuming finite element simulation was avoided through prediction with a neural network surrogate model. The tightness of the aviation component and the uniformity of the residual preload of the bolts were improved.

Author Contributions

Conceptualization, S.L.; methodology, S.L.; software, S.L.; validation, S.L., J.C. and Y.W.; formal analysis, S.L.; writing—original draft preparation, S.L.; writing—review and editing, S.L. All authors have read and agreed to the published version of the manuscript.

Funding

This research was funded by the National Key Research and Development Program of China (No. 2022YFB3306000).

Institutional Review Board Statement

Not applicable.

Informed Consent Statement

Not applicable.

Data Availability Statement

Not applicable.

Acknowledgments

The authors are grateful to other participants of the project for their cooperation.

Conflicts of Interest

The authors declare that there are no conflict of interest regarding the publication of this paper.

References

  1. Wang, Y.Q.; Wu, J.K.; Liu, H.B.; Kuang, K.; Cui, X.W.; Han, L.S. Analysis of elastic interaction stiffness and its effect on bolt preloading. Int. J. Mech. Sci. 2017, 130, 307–314. [Google Scholar] [CrossRef]
  2. Coria, I.; Abasolo, M.; Olaskoaga, I.; Etxezarreta, A.; Aguirrebeitia, J. A new methodology for the optimization of bolt tightening sequences for ring type joints. Ocean Eng. 2017, 129, 441–450. [Google Scholar] [CrossRef]
  3. Nassar, S.A.; Wu, Z.; Yang, X. Achieving uniform clamp load in gasketed bolted joints using a nonlinear finite element model. J. Press. Vessel Technol. 2010, 132, 031205. [Google Scholar] [CrossRef]
  4. Grzejda, R.; Parus, A. Experimental studies of the process of tightening an asymmetric multi-bolted connection. IEEE Access 2021, 9, 47372–47379. [Google Scholar] [CrossRef]
  5. Zhang, D.; Zhou, J.; Mao, K. Simulational and experimental study of stress in bolts work-piece. J. Meas. Eng. 2020, 8, 46–61. [Google Scholar] [CrossRef]
  6. Zhu, L.; Bouzid, A.H.; Hong, J. A Method to Reduce the Number of Assembly Tightening Passes in Bolted Flange Joints. J. Manuf. Sci. Eng. Trans. ASME 2021, 143, 121006. [Google Scholar] [CrossRef]
  7. Li, T.; Yang, D.; Zhao, B.; Sun, Q.; Huo, J.; Sun, W. Measured and investigated nonlinear dynamics parameters on bolted flange joints of combined rotor. J. Mech. Sci. Technol. 2021, 35, 1841–1850. [Google Scholar] [CrossRef]
  8. Abasolo, M.; Aguirrebeitia, J.; Avilés, R.; Bustos, I. Methodology for the Optimization of Bolting Sequences for Wind Generator Flanges. J. Press. Vessel Technol. 2014, 136, 061202. [Google Scholar] [CrossRef]
  9. Liu, Z.; Cao, S.; Guo, H.; Li, L. Vibration characteristics of rotor systems with bolt joints. J. Vib. Shock 2016, 35, 10–19. [Google Scholar]
  10. Li, X.; Meng, Q.; Du, Y.; Chen, F.; Zhao, B. Influence of Tightening Strategy on Pre-tightening Force of Aero-engine Single-bolt Connection. J. Mech. Eng. 2020, 56, 231. [Google Scholar]
  11. Nizametdinov, F.R.; Romashin, Y.S.; Berne, A.L.; Leontyev, M.K. Investigation of Bending Stiffness of Gas Turbine Engine Rotor Flanged Connection. J. Mech. 2020, 36, 729–736. [Google Scholar] [CrossRef]
  12. Abid, M.; Khan, Y.M. The effect of bolt tightening methods and sequence on the performance of gasketed bolted flange joint assembly. Struct. Eng. Mech. 2013, 46, 843–852. [Google Scholar] [CrossRef]
  13. Miao, R.; Shen, R.; Tang, F.; Chen, W.; Que, M. Nonlinear interaction effect on main cable clamp bolts tightening in suspension bridge. J. Constr. Steel Res. 2021, 182, 106663. [Google Scholar] [CrossRef]
  14. Zhang, J.; Wang, Y.; Wang, J.; Cao, R.; Xu, Z. Online O-Ring Stress Prediction and Bolt Tightening Sequence Optimization Method for Solid Rocket Motor Assembly. Machines 2023, 11, 387. [Google Scholar] [CrossRef]
  15. Bibel, G.; Ezell, R. An improved flange bolt-up procedure using experimentally determined elastic interaction coefficients. J. Pressure Vessel Technol. 1992, 114, 439–443. [Google Scholar] [CrossRef]
  16. Broomhead, D.S.; Lowe, D. Radial Basis Functions, Multi-Variable Functional Interpolation and Adaptive Networks; Royal Signals and Radar Establishment: Malvern, UK, 1988. [Google Scholar]
Figure 1. Schematic diagram of elastic interaction.
Applsci 13 06771 g001
Figure 2. Composition of the aviation component.
Applsci 13 06771 g002
Figure 3. Docking process diagram of the aviation component.
Applsci 13 06771 g003
Figure 4. The gap of the aviation component.
Applsci 13 06771 g004
Figure 5. Finite element mesh generation of the aviation component.
Applsci 13 06771 g005
Figure 6. Maximum deformation diagram of 0.1 mm gap value aviation component with single bolt.
Applsci 13 06771 g006
Figure 7. The ultrasonic measuring equipment.
Applsci 13 06771 g007
Figure 8. Comparison of 0.1 mm gap value single bolt tightening residual preload simulation value and experimental value.
Applsci 13 06771 g008
Figure 9. Maximum deformation diagram of the 0.1 mm gap value aviation component with two bolts tightened simultaneously.
Applsci 13 06771 g009
Figure 10. Comparison of 0.1 mm gap value two-bolt tightening residual preload simulation value and experimental value.
Applsci 13 06771 g010
Figure 11. Maximum deformation diagram of the 0.08 mm gap value aviation component. (a) single-bolt tightening; (b) two-bolt tightening.
Applsci 13 06771 g011
Figure 12. Comparison of the 0.08 mm gap value single-bolt tightening residual preload simulation value and experimental value.
Applsci 13 06771 g012
Figure 13. Comparison of the 0.08 mm gap value two-bolt tightening residual preload simulation value and experimental value.
Applsci 13 06771 g013
Figure 14. Two-bolt tightening sequences of the aviation component under different conditions. (a) 0.1 mm gap value; (b) 0.08 mm gap value.
Applsci 13 06771 g014
Figure 15. Neural network prediction flowchart.
Applsci 13 06771 g015
Figure 16. Comparison of 0.1 mm gap value aviation component predicted-simulation value.
Applsci 13 06771 g016
Figure 17. Comparison of 0.08 mm gap value aviation component predicted-simulation value.
Applsci 13 06771 g017
Figure 18. Residual preload of each bolt under different initial preloads.
Applsci 13 06771 g018
Table 1. The 0.1 mm gap value elastic interaction matrix values of two bolts tightened diagonally.
A i , j A 1 , j A 2 , j A 3 , j A 4 , j A 5 , j A 6 , j A 7 , j A 8 , j
A i , 1 1−0.013−0.017−0.0090−0.011−0.015−0.043
A i , 2 01−0.052000−0.0310
A i , 3 00100000
A i , 4 0−0.029−0.04210−0.015−0.0220
A i , 5 0−0.011−0.008−0.0371−0.019−0.013−0.023
A i , 6 00−0.031001−0.0490
A i , 7 00000010
A i , 8 0−0.014−0.01900−0.037−0.0241
Table 2. The 0.08 mm gap value elastic interaction matrix values of two bolts tightened diagonally.
A i , j A 1 , j A 2 , j A 3 , j A 4 , j A 5 , j A 6 , j A 7 , j A 8 , j
A i , 1 1−0.031−0.015−0.0140−0.009−0.014−0.023
A i , 2 010−0.051000−0.045
A i , 3 0−0.0241−0.0410−0.0080−0.014
A i , 4 00010000
A i , 5 0−0.01−0.007−0.0351−0.021−0.014−0.008
A i , 6 000−0.039010−0.042
A i , 7 0−0.080−0.0160−0.0271−0.038
A i , 8 00000001
Table 3. Initial preload of each bolt/N.
Bolt 1Bolt 2Bolt 3Bolt 4Bolt 5Bolt 6Bolt 7Bolt 8
0.1 mm73,12971,01965,67672,89573,43370,82265,67672,010
0.08 mm72,93671,79371,39765,50572,10870,81176,69865,505
Disclaimer/Publisher’s Note: The statements, opinions and data contained in all publications are solely those of the individual author(s) and contributor(s) and not of MDPI and/or the editor(s). MDPI and/or the editor(s) disclaim responsibility for any injury to people or property resulting from any ideas, methods, instructions or products referred to in the content.

