Abstract
People have raised their expectations for UAV performance due to the widespread use of UAVs in both military and non-military settings. One of the most significant fields of research right now is how to enhance UAVs’ endurance capabilities. Many birds in the wild have the ability to fly for extended periods of time or great distances using the wind, which is called energy harvesting. A seabird called an albatross can use the wind’s horizontal gradient on the water’s surface to generate energy. By gliding, they may fly for a very long time without flapping their wings, thus lowering their own energy consumption. Due to the albatrosses’ nostrils sensitive sensory nerves and sensitivity to environmental information, such as airflow, the albatrosses can modify its flight attitude. Similar to this, real-time dynamic planning of the trajectory can only be done for UAVs in order to realize energy-capturing flying if correct and real-time wind field information is obtained. As a result, developing wind field sensing technology is crucial to the realization of energy-capturing gliding. In this study, we built a 3D wind field sensing system with wind vane sensor and pitot tube. Wind tunnel tests were used to calibrate and alter it. The system’s operation is initially validated by real flight, which may give environmental information, enabling UAVs to utilize the wind field as a reference for planning their flight paths.
1. Introduction
Unmanned aerial vehicles have been created for more than a century, and as time goes on, they are growing smarter and performing more consistently. At the moment, the onboard energy system of unmanned aerial vehicles restricts their endurance. Unmanned aerial vehicles’ onboard energy weight and endurance are constrained due to the load weight they carry, such as photoelectric detecting equipment, as well as structural strength and flying performance requirements [1,2].
The remarkable ability of albatrosses to harvest energy from the wind field was focused on by the researchers. For the first time, Rayleigh [2] made the observation that birds can obtain energy from the environmental wind field, which focused on the influence of the characteristics of the wind field environment on capacitive gliding [3]. The albatross, a seabird, can take advantage of the horizontal gradient of wind near sea level for long-duration glides. Alerstam et al. [4] used radar and optical measuring instruments to observe the flight of albatross and other seabirds. The observation results showed in Figure 1A that the flight trajectory of albatross is closely related to the wind field. The two nostrils of albatross have sensitive sensory nerves, as shown in Figure 1B, which are sensitive to information, such as air pressure and smell. Through careful study of GPS data, Weimerskirch and Wakefield et al. discovered a linear connection between changes in ground speed and wind speed during albatross flight [5,6,7]. Researchers believe that this is similar to the function of the pitot tubes used on aircraft, and can be used to monitor the total number of albatrosses during their flight. At the same time, it uses the difference in the flow of the two nostrils to sense the wind direction [8]. Sachs et al. [9] examined the energy changes and trajectory strategies during the flight of albatrosses, performed in-depth study of the energy-harvesting mechanism and trajectory of dynamic gliding, and solved the minimal wind gradient necessary under dynamic gliding trajectory circumstances [9,10,11].
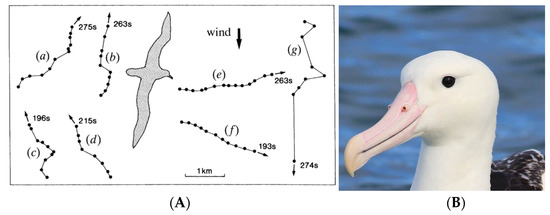
Figure 1.
(A) Albatross’s trajectory in the wind field [4], (B) Albatross’s unique nostril structure.
It is clear that the real-time perception of the wind field is the basis for employing the wind field to achieve energy harvest gliding, whether it is a bird or a UAV. UAVs are known for their inexpensive price, compact size, high mobility, and flexibility. As a result, scientists started using drones to assess meteorological factors, including wind field habitats. UAVs have the characteristics of low cost, small size, and strong mobility and flexibility. Therefore, researchers began to use drones to measure meteorological conditions, such as wind field environments. In 2001, Egger et al. [12,13,14] used fixed-wing unmanned aerial vehicles to measure wind speed, temperature, humidity and other meteorological parameters at a height of 2000 m in Kali Gandaki Valley in the Himalayas several times, supplementing the local meteorological data. The measuring range is constrained, and a skilled pilot must maintain steady control of the drone. In 2008, Van Den Kroonenberg et al. [15,16] used a small meteorological UAV called M2AV to conduct wind field measurements. Temperature, humidity, and porous probes were all installed in the aircraft. The airspeed meter is comparable with the measurements made by the radar and the measuring tower. It can measure the wind speed and direction along the route, average wind and turbulence with a resolution of 40 Hz, and high spatial resolution of 55 cm. In 2017, Shimura et al. [17] installed an ultrasonic anemometer on a six-rotor UAV to measure the wind profile at 1000 m above the ground. The Aerosonde [18,19] high-performance long-range UAV was created by Holland et al. and carried a number of sensors to assess the meteorological environment. The Aerosonde UAV obtained the measurement of the wind field by establishing the ‘S’ flight path, right angle turning, circling around the point, and other flight modes, which employed the horizontal ground speed detected by GPS and the pitot tube to estimate the horizontal wind. The wind parameter measurement resolution is around 300 m. Due to the inability to detect the airflow angle, the recorded wind speed is a scalar, necessitating unique flight procedures to provide a measurement of the horizontal wind with subpar horizontal precision. However, due to their flight characteristics, such drones have a limited battery life and range. As mentioned above, ultrasonic wind measuring equipment has high measurement accuracy, but it can only measure wind speed in the horizontal direction. The flow field around the rotor can easily disturb the installation on the multi-rotor UAV, necessitating the installation of a longer support rod, which could compromise the UAV’s stability and safety. The usage of a fixed-wing UAV platform must therefore be taken into consideration for the task of continuously measuring the wind field over a wide area. The above research status shows that the technology of using UAVs to measure wind fields has attracted more and more attention from scholars at home and abroad. Among the current measurement schemes, only the German M2AV meteorological detection drone equipped with a miniature five-hole airspeed meter has realized the detection of three-dimensional wind field information. Its measurement accuracy is high, and the frequency and resolution of wind field detection are higher than other methods. There are many restrictions in the actual usage process of the micro five-hole airspeed meter because it has high requirements for the processing accuracy of the sensor and also has to adjust the measurement data under various airflow situations. The horizontal airspeed zeroing method and the two-dimensional wind field calculation method currently used have problems, such as low measurement frequency, incomplete acquisition of wind field information, and low measurement resolution. Therefore, this paper studies the three-dimensional wind field measurement technology based on the wind vane sensor and pitot tube airspeed meter. By evaluating and comparing existing wind field measurement methods and UAV-based wind measurement schemes, a real-time wind field perception scheme based on UAV platforms in this study was proposed, system integration research was carried out, and wind tunnel experiments were conducted to test the wind field. A system integration study was carried out, and a wind tunnel experiment was conducted to evaluate the performance of the wind measurement system. The main research work of this paper is as follows: (1) analysis of wind field measurement scheme based on UAV, (2) modeling and prediction of wind field environment, (3) real-time measurement system for three-dimensional wind field information., (4) the main sensors of the measurement system are evaluated and calibrated based on wind tunnel experiments, (5) flight experiment of the three-dimensional wind field measurement system.
2. Wind Field Calculation Method and Measurement System Construction
The following measuring systems are some of the most widely employed as a result of recent development: the horizontal airspeed zeroing method, the dead reckoning method, and the plane vector triangle method. The methods mentioned above have several restrictions due to the differing measuring principles and necessary sensors. A three-dimensional wind field measuring method appropriate for local continuous flight measurements will be introduced in this section.
2.1. Three-Dimensional Wind Field Calculation Method Based on UAV
The relative motion between the airplane and the air allows the aircraft to fly in the air. The lift produced by the aircraft overcomes gravity when the relative speed between the aircraft and the air reaches a specific level, allowing the aircraft to fly through the air. Airspeed Va, or the speed of motion of the aircraft relative to the airflow, and ground speed Vg, or the speed of motion of the aircraft relative to the earth’s surface, are two ways that people categorize the speed of an aircraft during flight based on different coordinate axes. In the windless state, the ground speed and the airspeed are equal, and when there is wind in the movement process, the ground speed is equal to the vector sum of the airspeed and the wind speed. The vector relationship is as follows:
The measurement principle of three-dimensional wind speed [20] is introduced as follows: the airspeed is calculated based on the the measured static pressure, dynamic pressure, static temperature and other parameters. Then, the three-dimensional wind speed is calculated based on the flight parameters of the UAV, attitude angle, ground speed, and airflow angle. The measurement principle is shown in Figure 2.
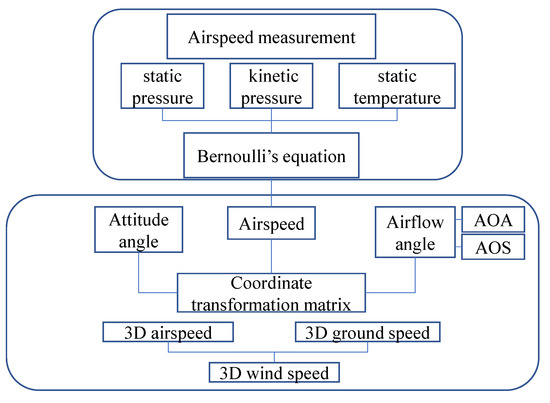
Figure 2.
Three-dimensional wind speed calculation principle.
2.2. Axis System Conversion and Solution
Since different variables have different reference systems, axis system conversion is required during calculation. In this paper, we mainly use the conversion between the body axis system and the ground axis system, and the conversion between the airflow axis system and the body axis system.
Body Axis System—Ground Axis System
The motion attitude of the aircraft in the air or the orientation of the body axis system Oxbybzb relative to the ground axis system Ogxgygzg is usually represented by three Euler angles, namely pitch angle θ, roll angle φ, and yaw angle ψ. The pitch angle is the angle between the body axis Oxb and the horizontal plane Oxgyg. When the aircraft is looking up, it is stipulated that the angle θ at this time is positive. The yaw angle is the angle between the projection of the body axis Oxb on the horizontal plane Ogxgyg and the Oxg axis, and the angle formed when yawing right is defined as positive. The roll angle is the angle between the symmetry plane of the aircraft and the vertical plane containing the body axis Oxb. The angle at which the aircraft rolls to the right is defined as positive. The body axis system first rotates the angle φ around the Oxb axis, then rotates the angle θ around the Oy axis at this time, and then rotates the angle ψ around the rotated Oz axis (the Ozg axis in Figure 3); that is, it completes the body axis system to the ground axis system conversion. According to the principle of coordinate axis transformation, the transformation matrix from Oxbybzb to Ogxgygzg can be obtained,
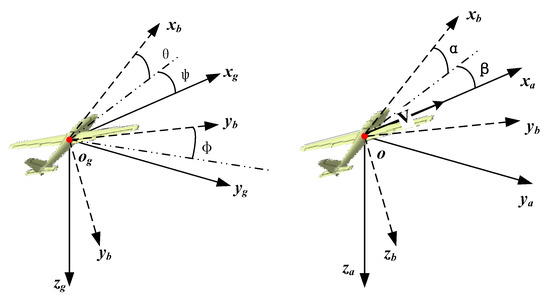
Figure 3.
The relationship between the ground axis system, the body axis system and airflow axis system.
Among them, Lz, Ly, and Lx are all single-axis transformation matrices, and the expressions are as follows:
After sorting, the rotation matrix is:
In the actual flight process, due to the existence of wind, there is an angle between the direction of the aircraft’s motion velocity vector and the fuselage, that is, the airflow angle. The airflow angle includes two types: the angle of attack α and the angle of sideslip β, i.e., the angle between the projection of V on the symmetry plane of the aircraft and the body axis Oxb. The projection line of the velocity vector V is above Oxb, and α is defined as positive. The sideslip angle is the angle between the flight speed vector V and the plane of symmetry of the aircraft, expressed by β. The velocity vector V is on the right side of the vertical symmetry plane of the fuselage, and β is defined as positive. Rotating the airflow axis system around the Oza axis by β angle first, and then rotating around the Oya axis by α angle completes the transformation from the airflow system to the machine system. The corresponding rotation matrix is:
The airspeed vector under the aircraft system in the formula is
The airspeed in the ground coordinate system is
Then, the wind vector expression in the ground coordinate system is obtained as
Among them, is the ground speed vector, is the airspeed vector in the ground coordinate system, and is the wind speed vector. Through the above process, the three-dimensional wind speed can be obtained, and the three components of the wind speed vector are the speed components in the x, y, and z directions.
2.3. Wind Field Measurement System Scheme Design
According to the overall demand analysis of the measurement system, a 3D wind field measurement system scheme based on the wind vane sensor is designed in this paper (Figure 4), and it is integrated on a certain type of UAV platform. The overall system scheme is shown in the figure. In this system, the UAV can be manually controlled by the operator, and can also fly autonomously according to the flight mission uploaded by the ground station. When the data link is lost, the UAV can automatically switch to the return mode according to the preset setting. The real-time transmission to the ground station is also all recorded in the memory card of the flight controller.
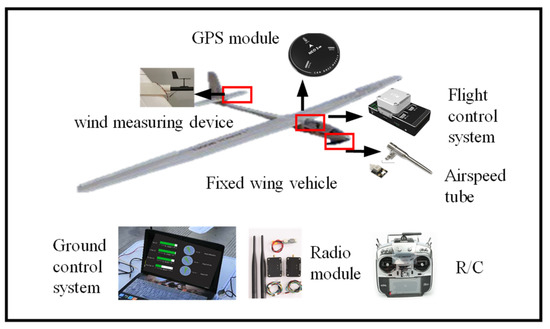
Figure 4.
Schematic diagram of system composition.
The UAV wind field measurement system is mainly composed of three parts (Figure 5): a fixed-wing UAV system, airflow information measurement system, and ground control and display system. Of these, the airspeed of the UAV is determined by the digital airspeed. The airflow angle is measured by the wind vane sensor. In this paper, a wind vane angle sensor is used to measure the angle of attack (AOA) and the angle of sideslip (AOS). The angle sensor is composed of symmetrical airfoil carbon fiber blades (wind vane), a mechanical shaft, precision micro potentiometer, counterweight, and other parts. In order to obtain the movement speed of the UAV relative to the incoming flow, we use a digital airspeed meter for measurement, which is a small ceramic-based pressure sensor powered by a 3.3 V or 5.0 V power supply. The three-dimensional ground speed is obtained by data fusion of GPS and IMU units, and the processor on the flight controller is used to calculate the attitude angle, airflow angle, and three-dimensional ground speed to obtain the three-dimensional wind speed.
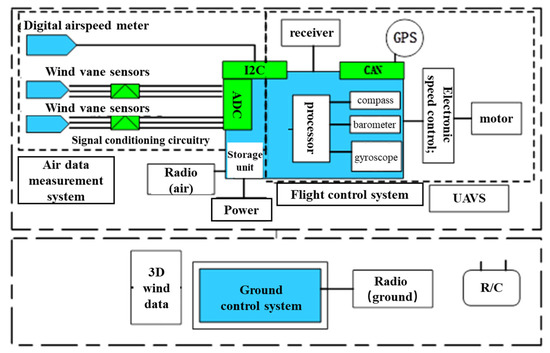
Figure 5.
Interface relationship of wind speed measurement system.
In this paper, a UAV with a large aspect ratio is used as a flight test platform, a 6 s 5300 mAh lithium battery is used as a power source, and a propeller is used to provide forward power. Some parameters are shown in Table 1:

Table 1.
The parameters of the UAV.
This paper uses Tornado aerodynamic estimation software to evaluate the UAV’s aerodynamic performance. The UAV is modeled in the software in accordance with the relevant UAV parameters and in accordance with the geometric parameters of the actual UAV airfoil (the Boeing16 airfoil in the airfoil library is used for the main wing in this paper). The symmetrical airfoil NACA0011 is used as well, shown in Figure 6, and the vortex grid method is used to estimate the flight performance of the established model. According to the calculation, the stall speed of the UAV is about 6.3 m/s, and the lift-to-drag ratio curve at the cruising speed is shown in Figure 7.
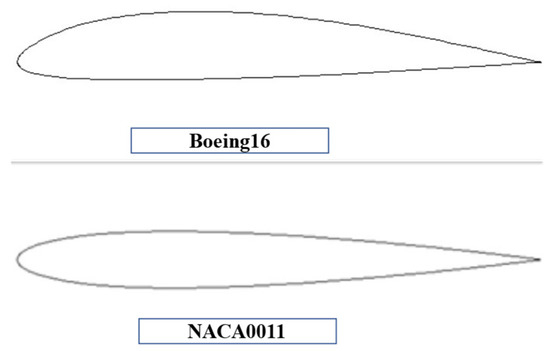
Figure 6.
Geometric shape of the wing.
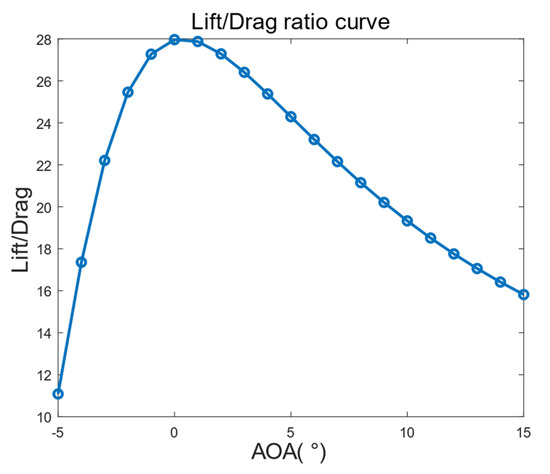
Figure 7.
Estimated lift-to-drag ratio curve.
The formula used to calculate the cruise speed is
where W is the take-off weight, g is the acceleration of gravity, CL,0 is the lift coefficient at 0 angle of attack, S is the reference area of the wing, and ρ is the air density. The cruising speed can be calculated by substituting the parameters into 11 m/s.
2.4. Wind Tunnel Experiment of Wind Field Measurement System
The angle of attack and sideslip angle measured by the angle sensor installed on the aircraft may be different from the actual angle of attack and sideslip angle of the aircraft because the local airflow is affected by the flow field of the aircraft body and what it feels is the direction of the local airflow. It is different from the actual airflow angle of the aircraft. Therefore, the relationship between the airflow angle measured by the sensor and the actual airflow angle must be established, which needs to be determined through wind tunnel experiments. The experiment consists of the following parts:
- Airspeed meter calibration and evaluation experiment
The measurement accuracy of the airspeed meter is related to the ambient temperature, air pressure, etc. The airspeed meter used in this paper integrates temperature and pressure measurement devices with the flight control. The measured values under the pressure and temperature conditions have been compensated during the delivery stage, but in actual use, under different wind speed conditions and different measurement environments, there is still a certain difference between the air velocity measured by the pitot tube air velocity meter and the actual air velocity. This corrected relationship is important for obtaining the corrected airspeed.
This can be achieved by adjusting the wind tunnel output wind speed through the wind tunnel control computer and setting the airspeed meter at 5 m/s, 6 m/s, 7 m/s, 8 m/s, 9 m/s, 10 m/s, 11 m/s, 12 m/s, 13 m/s, 14 m/s, and 15 m/s for full-range wind tunnel wind speed measurement. Waiting for the output wind speed to be stable and then record the airspeed meter measurement data. Measuring for 20 s and continuing to adjust the wind speed setting until the next wind speed is stable, then measuring again, recording the measurement data, and repeating the experiment for all 5 groups. Therefore, in order to simulate the influence of different environments on the measurement, five sets of experiments were carried out for airspeed calibration at different temperatures and at different time periods, and the above steps were repeated for each experiment. The evaluation standard is the correlation coefficient R2 between the fitted calibration curve and the measured value. The closer the coefficient is to 1, meaning that the higher linearity of the function, and the better the measurement characteristics of the airspeed.
- Angle sensor calibration
Since the measured value of the angle sensor is actually the magnitude of the voltage, its measurement accuracy is affected by the characteristics of the circuit. The factory-set voltage and angle conversion curve is only a reference curve under the standard state. In actual use, it is related to the power supply voltage of the sensor. Therefore, it is necessary to calibrate the measured value of the angle sensor and evaluate the measurement characteristics of the sensor, that is, the relationship between the measured angle and the actual angle under a certain airflow angle. The experiment is not only for the angle of attack sensor but also for the angle of sideslip sensor.
By changing the horizontal rotation angle of the angle deflection mechanism in the wind tunnel system, the simulation experiment of different sideslip angles is realized, and the control operation is realized through the computer control interface. This can be achieved by inputting the expected deflection side slip angle on the computer control interface and confirming it. The angle deflection mechanism will rotate according to the command. Recording the data at this time after the rotation mechanism reaching the designated position and stabilizes. In order to determine the experimental angle range, these steps were carried out several times in the early stages. In the flight test, the estimated flight angle of attack based on the UAV navigation system and angle sensor is between −6°~+6°, and the variation range of the sideslip angle is between −10°~+10°. In order to better calibrate the sensor, the experimental calibration range should be larger than the estimated angle range, and the side slip angle sensor calibration range is selected as −12°~+12°.
2.5. Three-Dimensional Wind Field Measurement System Flight Test
Several wind field measurement experiments have been carried out based on the wind field measurement system constructed in the previous research. Here, we mainly introduce two of the flight experiments. In the two experiments, the wind field information in different regions was collected and analyzed. The first experiment is made at the Chang’an Campus of Northwestern Polytechnical University (Figure 8a), and the second experimental area is located in the transitional zone of plains and mountains in Lantian County, Xi’an City, Shaanxi Province (Figure 8b). Due to the high cost of professional measurement equipment, such as wind profile radar, and the limitation of experimental conditions, the experimental group was not able to set up such wind field measurement equipment to collect and compare regional wind field data, and could not obtain accurate information on regional wind fields. The accuracy of the measured wind field data is evaluated, but the power is not turned on during the measurement phase. We can judge based on the changes in the flight status of the UAV under different airflow conditions and the characteristics of the environmental reference. The relationship between the flight status (descent rate) of the UAV during the unpowered flight phase and the measured updraft speed is analyzed. The horizontal wind direction was compared, and the function of the wind field measurement system based on the UAV platform was initially verified.
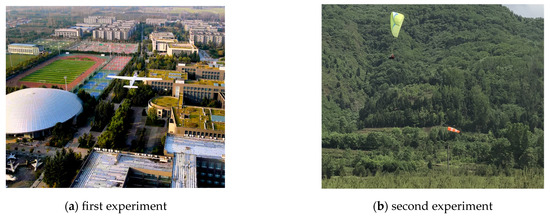
Figure 8.
Aerial photography record of flight experiment.
3. Results
3.1. The Results of the Wind Tunnel Experiment
3.1.1. Calibration Curve of On-Board State Airspeed Meter
Two calibration experiments were carried out on the airspeed meter, and the curve fitting of the all data was used as the final calibration curve of the airspeed meter.
The airspeed data in the two measurement experiments are summarized and then fitted. The calibration curve scale coefficient is 1.0019 and the intercept is 0.97423. According to Figure 9, it can be clearly seen that when the wind speed is set at a low level (below 7 m/s). When the wind speed increases, the measurement data of the airspeed meter fluctuates greatly, especially at the set wind speed of 5 m/s, where the data fluctuation range reaches ±1 m/s. As the wind speed increases, the measurement data gradually tends to be stable. As for estimation of the stall speed and cruising speed of the UAV, the stall speed of the UAV is greater than 6.3 m/s, and the cruising speed is approximately 11 m/s, that is, the airspeed in normal flight status is relatively high. Considering the impact of the measured data on the calibration results, we selected the data of 8 m/s and above to refit the data. The calibration results are shown in Figure 10; the scale coefficient of the final calibration curve is 1.1259, and the intercept is 0.24221.
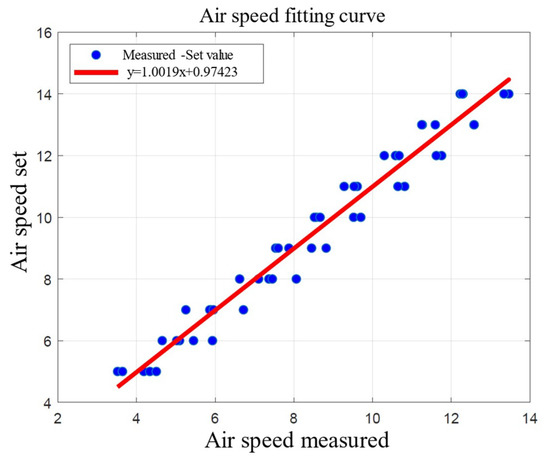
Figure 9.
Airspeed calibration curve.
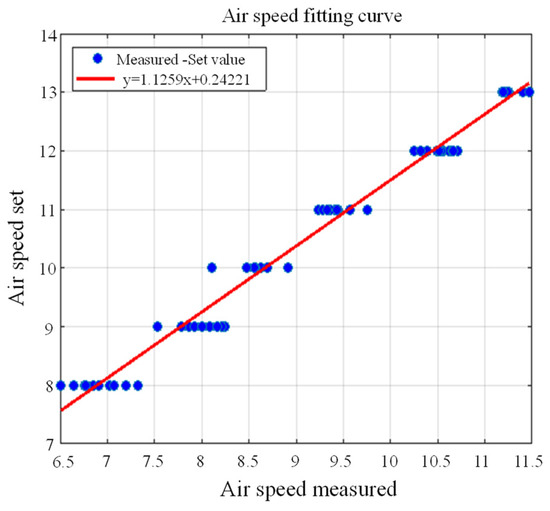
Figure 10.
Airspeed fitting curve.
3.1.2. Side Slip Angle Calibration Experiment Results
According to the comparison of the actual measurement results, it is found that in the airborne state, the side slip angle sensor data fluctuation is about ±0.6°, and the non-airborne state data fluctuation is about ±0.3, indicating that the airborne state measurement data fluctuation increases. During the experiment, it was found that the vertical tail part has a slight vibration under airflow conditions. Therefore, in the actual-use process, it is necessary to eliminate the influence of the vertical tail vibration on the measurement. Therefore, in this paper, the sideslip angle data is filtered to eliminate the data fluctuation, which is regarded as high-frequency noise. The high-frequency noise is processed by using the moving filter method (Figure 11).
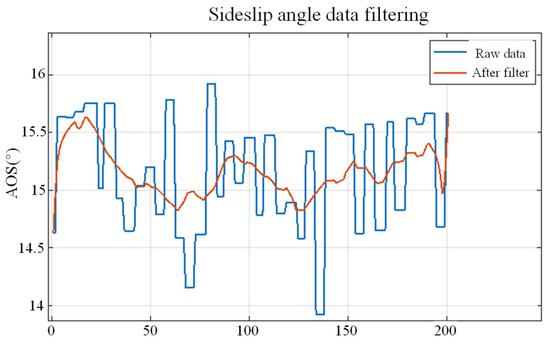
Figure 11.
Sideslip angle data filtering.
The two experiments of sideslip angle sensor were conducted. From the above data analysis, it can be seen that the measured value of the sideslip angle sensor in the airborne state is generally greater than the actual value, and the difference increases with the increase of the actual sideslip angle. Therefore, it is necessary to compensate for the difference through the calibration curve. In the experiment, the determination coefficient R2 of the curve is greater than 0.99, the measurement data of the angle sensor is linear, and the calibration ratio coefficients are 0.6252 and 0.6396, respectively, indicating that the ratio between the real value and the measured value is 0.6, which needs to be determined by the ratio coefficient. A correction was later made; the intercepts of calibration curves are 0.1993 and 0.2839, respectively. In order to avoid the influence of installation and other operations on the experimental results in a single experiment, the two measurement data are summarized here and then fitted. The calibration curve scale coefficient is 0.6319, the intercept is 0.2396, and the coefficient of determination is greater than 0.99, indicating that the calibration curve is accurate. The fitting effect is better (Table 2).
Table 2.
Fitting parameter table.
3.1.3. Angle of Attack Calibration Curve
After fixing the UAV fuselage on the rotating test platform, the longitudinal deflection angle of the test platform was changed to simulate the state of the UAV at different angles of attack. At this time, the data of the sensor for the angle of attack were recorded in order to reduce the impact caused by installation and other operations. Therefore, two sets of experiments were carried out and the data of the two experiments were summarized for fitting (Table 3).
Table 3.
Fitting parameter table.
From the above data analysis, it can be seen that the measured value of the angle sensor is basically kept close to the real value, and the sensor performance is stable in most cases. The determination coefficient R2 of the curve in the two calibration experiments is greater than 0.99. The measurement scale coefficients were 0.9086 and 0.9350, respectively, and the intercepts of the calibration curves were 0.1599 and 0.0348, respectively. The scale coefficient of the calibration curve after fitting the two times of data was 0.9148, and the intercept was 0.1030.
3.2. The Results of the Flight Experiment
The aspect ratio of the UAV used in the experiment is about 13, and it has a high lift-to-drag ratio. The altitude drop rate of the UAV is affected by the vertical wind speed. The reference system of the three-dimensional wind speed calculated by the system is the ground coordinate system, and its vertical axis is defined as the positive direction downward. Therefore, the wind speed in the Z direction is a negative value, meaning that the airflow direction is upward at this time. In order to compare the change of the vertical wind and the change of the movement speed of the UAV in the Z direction more intuitively, a negative sign is added when drawing the vertical wind data of this period in Figure 12 (the sign is changed during the comparison stage only in Figure 12).
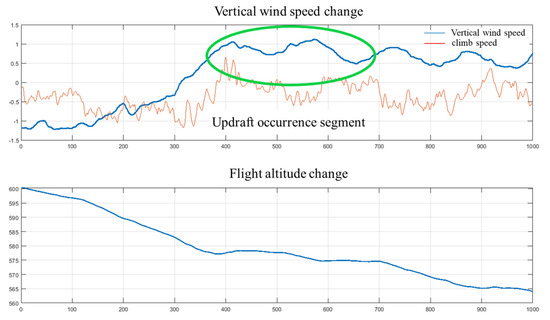
Figure 12.
Vertical wind speed (blue) and UAV climb rate (red); flight altitude change (bottom).
The wind speed in the X and Y directions collected by the wind measuring system can draw a wind compass diagram. The direction of the arrow in the compass indicates the direction of the horizontal wind vector, and the length of the arrow indicates the magnitude of the horizontal wind speed. This is a part of the horizontal wind vector information measured in the flight experiment, as shown in Figure 13, the angle between the direction of the horizontal wind speed vector and the true north direction of the geographic coordinate system during this period is about 180°, that is, the wind moves from north to south, which is basically consistent with the direction of the windsock at the experimental site.
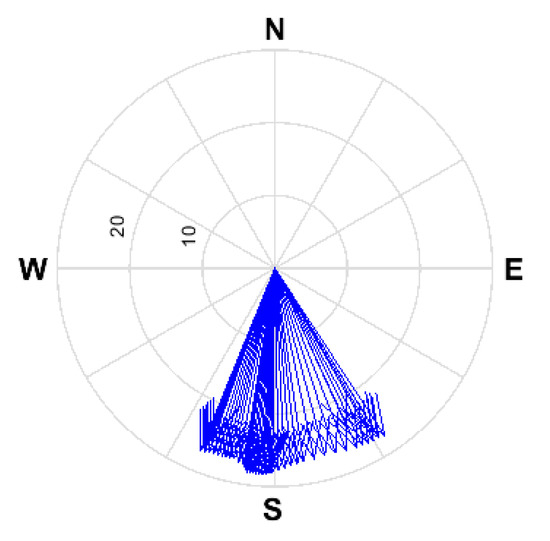
Figure 13.
Horizontal wind compass chart.
4. Discussion
Analysis of the Attack Angle’s Lateral Features
After the experiments of the angle, we find that under various sideslip angle, the angle of attack sensor’s measurement accuracy will be impacted. We assess the angle of attack sensor’s measurement capabilities under various sideslip angle (lateral) and the angle of attack sensor’s measurement features under various sideslip angle conditions in the airborne state (Figure 14). The values measured by the angle of attack sensor are mostly steady (in the red region) within the short range of sideslip angle (−8–8°), and the data swings between (−0.3–0.3°), however there is a certain fixed inaccuracy. The angle of attack measurement value is low when the sideslip angle is negative and high when the sideslip angle is positive, although the absolute error values are all within 0.5°. Therefore, error correction can increase data accuracy during the range. However, in the case of sideslip angles above 8°, the measurement error of the angle of attack significantly increases. As a result, we must either increase the system’s accuracy over a wider range of sideslip angle or apply particular changes to the attack angle data above 8° sideslip angles.
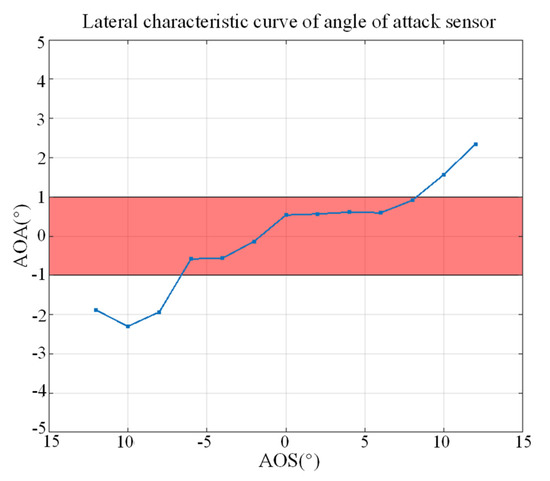
Figure 14.
Lateral characteristic curve of angle of attack sensor.
From the flight data and the wind data, we found that when the direction of the airflow gradually changes from downward to upward, the flying height of the drone decreased slowly, that is, the rate of descent becomes smaller. When the rising air velocity in the middle period of the above figure was large, the altitude of the drone changed slightly, even it maintained a level flight.
Some problems and deficiencies were also found in the research. However, due to the limitation of objective conditions, such as time and personal ability, some research content in the paper still needs to be discussed and explored in depth. Based on the current research content, the following points are proposed:
(a) Further research on airborne sensors. Further analysis and research will be carried out, including the error source and error characteristics of the airspeed gauge. It is expected that research be conducted on the working principle of the sensor and the data correction algorithm, etc., and improvements to the measurement accuracy and robustness of the airspeed gauge through these studies are also expected;
(b) In the wind tunnel experiment, it was found that the measurement accuracy of the airflow sensor under the condition of an angle of attack above 10° is disturbed, so the system layout needs to be further optimized to meet the measurement requirements of a wider range;
(c) There is a lot of noise and many outliers in the wind field information measured during the actual flight. How to process the data to obtain more real and reliable wind field information is also an important research topic. In the current experiment process, there is a lack of professional regional wind field measurement equipment to obtain the wind field data in the experimental airspace. Therefore, the current wind field data collected by drones cannot be compared with the standard measurement values. In the follow up research, it is expected to obtain professional regional wind field measurement equipment. The reference value of the measurement equipment is compared and analyzed, and the current system measurement performance is improved and enhanced.
5. Conclusions
In this paper, a set of UAV wind field measurement system based on wind vane sensors is constructed based on the previous research on wind field characteristics, measurement equipment, and calculation methods. The three-dimensional wind information is calculated, and the processor in the flight controller is used to calculate and transmit the three-dimensional wind information in real time, and it is displayed and recorded in real time on the ground station. Through the technical means of a wind tunnel experiment, the main sensors in the system are calibrated and analyzed. Then, several flight experiments were carried out, and the processing of the flight experiment data was performed, including the filtering processing of the actual measurement data, etc. From the analysis of the experimental results, the research plan in this paper has certain feasibility, and the wind field information has been preliminarily realized.
Some of the research content in the paper still requires in-depth discussion and exploration: Further research will be conducted on airborne sensors, including the analysis and study of the error sources and characteristics of the airspeed meter. Research on the working principle of the sensor, data correction algorithms, and other aspects are expected to be researched in order to improve the measurement accuracy and robustness of the airspeed meter through these studies. In wind tunnel experiments, it was found that the measurement accuracy of the airflow sensor was disturbed under conditions of attack angles above 10°. Therefore, further optimization of the system layout is needed to adapt to larger measurement requirements.
Author Contributions
Conceptualization, B.S.; formal analysis, L.L.; funding acquisition, W.A.; writing—original draft, L.L.; writing—review and editing, J.X. and X.Y. All authors have read and agreed to the published version of the manuscript.
Funding
This study was supported by the Shenzhen Science and Technology Program and Research (Grant No. JCYJ 20220530161808018), the Guangdong Basic and Applied Basic Research Foundation (Grant No. 208273626031), the Basic Research Program of Shenzhen (Grant No. JCYJ 20190806142816524), the Key R&D Program in Shaanxi Province (Grant No. 2023-YBGY-372), the National Natural Science Foundation of China (Grant No. 52175277), the Youth Program of National Natural Science Foundation of China (Grant No. 51905411), and the National Key Laboratory of Science and Technology on Aerodynamic Design and Research (Grant No. 61422010301). This work was supported in part by the Basic Research Program of Shenzhen under Grant JCYJ 20190806142816524.
Institutional Review Board Statement
Not applicable.
Informed Consent Statement
Not applicable.
Data Availability Statement
Not applicable.
Conflicts of Interest
The authors declare no conflict of interest.
References
- Gupta, S.G.; Ghonge, D.; Jawandhiya, P.M. Review of Unmanned Aircraft System (UAS). SSRN Electron. J. 2013, 2, 9. [Google Scholar] [CrossRef]
- Rayleigh. The Soaring of Birds. Nature 1883, 27, 534–535. [Google Scholar] [CrossRef]
- Richardson, P.L. How do albatrosses fly around the world without flapping their wings? Prog. Oceanogr. 2011, 88, 46–58. [Google Scholar] [CrossRef]
- Alerstam, T.; Gudmundsson, G.A.; Larsson, B. Flight Tracks and Speeds of Antarctic and Atlantic Seabirds: Radar and Optical Measurements. Philos. Trans. R. Soc. B Biol. Sci. 1993, 340, 55–67. [Google Scholar]
- Weimerskirch, H. GPS Tracking of Foraging Albatrosses. Science 2002, 295, 1259. [Google Scholar] [CrossRef] [PubMed]
- Weimerskirch, H.; Wilson, R.P. Oceanic respite for wandering albatrosses. Nature 2000, 406, 955–956. [Google Scholar] [CrossRef] [PubMed]
- Wakefield, E.D.; Phillips, R.A.; Matthiopoulos, J.; Fukuda, A.; Higuchi, H.; Marshall, G.J.; Trathan, P.N. Wind field and sex constrain the flight speeds of central-place foraging albatrosses. Ecol. Monogr. 2009, 79, 663–679. [Google Scholar] [CrossRef]
- Quindlen, J.; Langelaan, J. Flush Air Data Sensing for Soaring-capable UAVs. In Proceedings of the 51st AIAA Aerospace Sciences Meeting, Grapevine, TX, USA, 7–10 January 2013. [Google Scholar]
- Sachs, G.; Bussotti, P.; Zaslavski, A. Application of Optimal Control Theory to Dynamic Soaring of Seabirds. In Variational Analysis and Applications. Nonconvex Optimization and Its Applications; Springer: Boston, MA, USA, 2005. [Google Scholar]
- Sachs, G.; Traugott, J.; Nesterova, A.P.; Dell’Omo, G.; Kümmeth, F.; Heidrich, W.; Vyssotski, A.L.; Bonadonna, F. Flying at No Mechanical Energy Cost: Disclosing the Secret of Wandering Albatrosses. PLoS ONE 2012, 7, e41449. [Google Scholar] [CrossRef] [PubMed]
- Sachs, G.; Traugott, J.; Nesterova, A.P.; Bonadonna, F. Experimental verification of dynamic soaring in albatrosses. J. Exp. Biol. 2013, 216 Pt 22, 4222–4232. [Google Scholar] [CrossRef] [PubMed]
- Egger, J.; Bajrachaya, S.; Heinrich, R.; Kolb, P.; Lämmlein, S.; Mech, M.; Reuder, J.; Schäper, W.; Shakya, P.; Schween, J.; et al. Diurnal Winds in the Himalayan Kali Gandaki Valley. Part III: Remotely Piloted Aircraft Soundings. Mon. Weather Rev. 2002, 130, 2042–2058. [Google Scholar] [CrossRef]
- Egger, J.; Bajrachaya, S.; Egger, U.; Heinrich, R.; Reuder, J.; Shayka, P.; Wendt, H.; Wirth, V. Diurnal Winds in the Himalayan Kali Gandaki Valley. Part I: Observations. Mon. Weather Rev. 2000, 128, 1106–1122. [Google Scholar] [CrossRef]
- Zängl, G.; Egger, J.; Wirth, V. Diurnal winds in the Himalayan Kali Gandaki valley. Part II: Modeling. Mon. Weather Rev. 2001, 129, 1062–1080. [Google Scholar] [CrossRef]
- van den Kroonenberg, A.; Martin, T.; Buschmann, M.; Bange, J.; Vörsmann, P. Measuring the Wind Vector Using the Autonomous Mini Aerial Vehicle M2AV. J. Atmos. Ocean. Technol. 2008, 25, 1969–1982. [Google Scholar] [CrossRef]
- Spiess, T.; Bange, J.; Buschmann, M.; Vörsmann, P. First application of the meteorological Mini-UAV ‘M2AV’. Meteorol. Z. 2007, 16, 159–169. [Google Scholar] [CrossRef] [PubMed]
- Shimura, T.; Inoue, M.; Tsujimoto, H.; Sasaki, K.; Iguchi, M. Estimation of Wind Vector Profile Using a Hexarotor Unmanned Aerial Vehicle and Its Application to Meteorological Observation up to 1000 m above Surface. J. Atmos. Ocean. Technol. 2018, 35, 1621–1631. [Google Scholar] [CrossRef]
- Holland, G.J.; Mcgeer, T.; Youngren, H. Autonomous aerosondes for economical atmospheric soundings anywhere on the globe. Bull. Am. Meteorol. Soc. 1992, 73, 1987–1998. [Google Scholar] [CrossRef]
- Holland, G.J.; Webster, P.J.; Curry, J.A.; Tyrell, G.; Gauntlett, D.; Brett, G.; Becker, J.; Hoag, R.; Vaglienti, W. The Aerosonde robotic aircraft: A new paradigm for environmental observations. Bull. Am. Meteorol. Soc. 2001, 82, 889–902. [Google Scholar] [CrossRef]
- Li, J.; Zhang, M.; He, C.; Hua, X.; Li, Y. Wind field measurement and data processing methods of atmosphere UAV based on aerodynamic angle. Intell. Comput. Appl. 2019, 9, 107–111. [Google Scholar]


Disclaimer/Publisher’s Note: The statements, opinions and data contained in all publications are solely those of the individual author(s) and contributor(s) and not of MDPI and/or the editor(s). MDPI and/or the editor(s) disclaim responsibility for any injury to people or property resulting from any ideas, methods, instructions or products referred to in the content. |
© 2023 by the authors. Licensee MDPI, Basel, Switzerland. This article is an open access article distributed under the terms and conditions of the Creative Commons Attribution (CC BY) license (https://creativecommons.org/licenses/by/4.0/).