Article

Performing Fatigue State Characterization in Railway Steel Bridges Using Digital Twin Models

1
CONSTRUCT-LESE, Faculty of Engineering (FEUP), University of Porto, 4200-465 Porto, Portugal
2
Department of Civil Engineering, Faculty of Engineering (FEUEM), Eduardo Mondlane University, Av. de Moçambique, Km 1.5, Maputo 257, Mozambique
3
ISISE, School of Engineering, University of Minho, Campus de Azurém, 4800-058 Guimarães, Portugal
4
CONSTRUCT-GEQUALTEC, Faculty of Engineering (FEUP), University of Porto, 4200-465 Porto, Portugal
5
BUILT CoLAB, Rua do Campo Alegre 760, 4150-003 Porto, Portugal
*
Author to whom correspondence should be addressed.
Appl. Sci. 2023, 13(11), 6741; https://doi.org/10.3390/app13116741
Submission received: 12 May 2023 / Revised: 26 May 2023 / Accepted: 30 May 2023 / Published: 1 June 2023
(This article belongs to the Section Civil Engineering)

Abstract

:
Railway infrastructures play a pivotal role in developing the national transportation system. Recently, the strategy of the railway engineer has been significantly shifted; along with the development of new assets, they tend to pay increasing attention to the operation and management of existing railway assets. In this regard, this paper proposes a Digital Twin (DT) model to improve fatigue assessment efficiency in the operational processes of railway steel bridges (RSBs). The DT concept mainly lies in the federation and interaction of a Fatigue Analysis System (FAS), which is based on Eurocodes principles, and a model in Building Information Modeling (BIM). Along with the proposed DT concept, a prototyping system for a real bridge is initiated and curated. The FAS is validated in good-agreement results with the ambient vibration test of the bridge (about 1.6% variation between numerical and experimental values), and close values were found between numerical and experimental stresses, the latter obtained by installing strain gauges on the bridge. The BIM model provides access to the numerical values of fatigue state results in a given bridge connection detail but also automatically represents that information in a 3D environment using a color-scale-based visualization process. Furthermore, a simulation model with the main input variables being the traffic and geometric conditions of the bridge is continuously updated for timely re-evaluation of the damage state, which shows promise for the lifecycle management of the bridge.

1. Introduction

Several recent indicators point to a future increase in rail traffic volume in Portugal and many other parts of the world. In contrast, several railway bridges have already reached or exceeded their useful life. A continuous improvement of the structural assessment methodologies of railway infrastructures that better assist decision making in the operation processes and maintenance is required. In the case of existing railway steel bridges (RSBs), fatigue is seen as one of the significant threats to structural integrity that can significantly affect the bearing capacity for new load scenarios and limit residual life [1,2,3,4,5]. Regarding structural integrity, phenomena, such as corrosion, deterioration, and other defects, including those arising from the manufacturing process, must be taken seriously, as they have a significant impact on the evolution of fatigue, which in the case of corrosion, for example, can lead to geometric irregularities in components and promote stress concentration [6]. These situations call for the use of appropriate methodologies, which are beyond the scope of this work. Fatigue may be defined as initiating and propagating cracks through a steel structural element due to fluctuating stresses [7]. In railway bridges, the action caused by passing trains is the most responsible for causing fatigue.
In the range of methodologies for structural integrity monitoring or that assist bridge operation and maintenance processes, including fatigue-related cases, the use of Digital Twin (DT) models currently stands out. Several definitions are attributed to Digital Twins (DTs) in the literature and extensive reviews on these models [8,9,10,11,12,13]. The origin of DTs dates back to 1970 when NASA created mirror images of the Apollo 13 (physical twin) [14]. The modern concept of DT was first proposed in 2003 by Michael Grieves [15] in an executive course on “Product Lifecycle Management”, which can be considered a white paper for modern DT research. It was gradually updated to different contexts and fields, which is defined as a digital representation of a physical entity (asset, process, or system) that serves as a living digital simulation model fed by continuously collected data, such as operational data collected at bridges and other processing data linked to specific routines [16]. Although the basic definition of DT seems consensual, certain aspects surrounding it have still generated discussion. For instance, some consider that similar to Building Information Modeling (BIM), DTs are a process, not a technology [17]. However, regardless of the controversy, everything suggests that the application of DTs extends to engineering and non-engineering fields.
Although the elemental composition of the DT follows a nearly universal pattern, there is no clear guideline or rule for creating these models. Three components are typically mentioned as making up the basic structure of DT: the physical entity in real space, the virtual entity (virtual model), and the connection between the physical and virtual parts through data flow [18]. In creating the DT model (e.g., for structural integrity assessment of a bridge), two approaches to virtual model processing should be highlighted: the physics-based approach and the data-driven approach. The first one, the virtual model, is built according to known physical laws and principles, i.e., it is a surrogate representation of a preconceived physical reality. In contrast, the second involves using data alone (from sensors and other sources) to create a model, generally relying on statistical models and/or machine learning algorithms that analyze the given data to identify patterns and correlations to determine the structural condition and performance. However, there are more direct data-driven systems that do not involve Artificial Intelligence and are more focused on creating 3D geometric models using parametric modeling algorithms (so-called data-driven design). For instance, in the context of BIM, to create a DT to automate a maintenance system of pre-stressed concrete bridges, the researchers of [19,20] applied the concept of parametric modeling to create the 3D model (using an open-source application programming interface) in which through algorithms, isolated concrete objects were created (including their position, orientation, or restrictions), identified by an ID, and then combined to form a single 3D model (Figure 1 [20]).
This BIM-based digital bridge model was then overlapped on another Bridge Reality Model/Inverted 3D Surface Model, as the authors refer to it (created through a 3D scanning procedure, reflecting the current state of the bridge), forming a federated model (which is also referred to as the “initial model” and represent the current actual state model), and through the interoperability of the BIM solution, a Mechanical Model was derived, allowing analysis based on the finite element method (FEM), taking into account the actual state of the bridge.
BIM has been explored as a starting point for creating DT of bridges and other infrastructures, either via parametric modeling or direct modeling with pre-existing objects in software for creating 3D geometric models (such as the procedure used in this work). BIM not only serves to create 3D models, but it is also an excellent platform for integration, storage, and sharing of information covering the entire life cycle of a project [21]. The aid of BIM for Bridge DT creation for various purposes of bridge lifecycle management, resilience, and climate change was further reported in the literature [10,22,23].
In the particular case of fatigue in bridges, taking into account the complexity of its analysis and considering that DTs in the bridges sector and architecture, engineering, and construction (AEC) generally are still in their “embryonic” stages, works aimed at the implementation of these models in this field are still scarce. Regarding some results in the literature, we can refer to [24], which studies the “orthotropic steel deck of a cable-stayed bridge” in which, while admitting that the welding residual stress is an essential cause of fatigue cracking, the author attempts to synthesize the monitoring data and the finite element model (FEM) through a DT to reconstruct the un-monitoring structure responses. The operationalization of the model proposed by the author relies fundamentally on updating the FEM based on regular measurements of the bridge and identifying fatigue cracks at strategic locations that may be inaccessible, thus being able to simulate loads to predict the response of the structure. However, the proposed model is unclear regarding the automation process and visualization, which are essential characteristics of a DT. It should be noted that a DT representing fatigue in steel bridges consists of two complex parts: the fatigue analysis part, which is generally complex and little understood, and the difficulties in the technology for the construction of the DT [25].
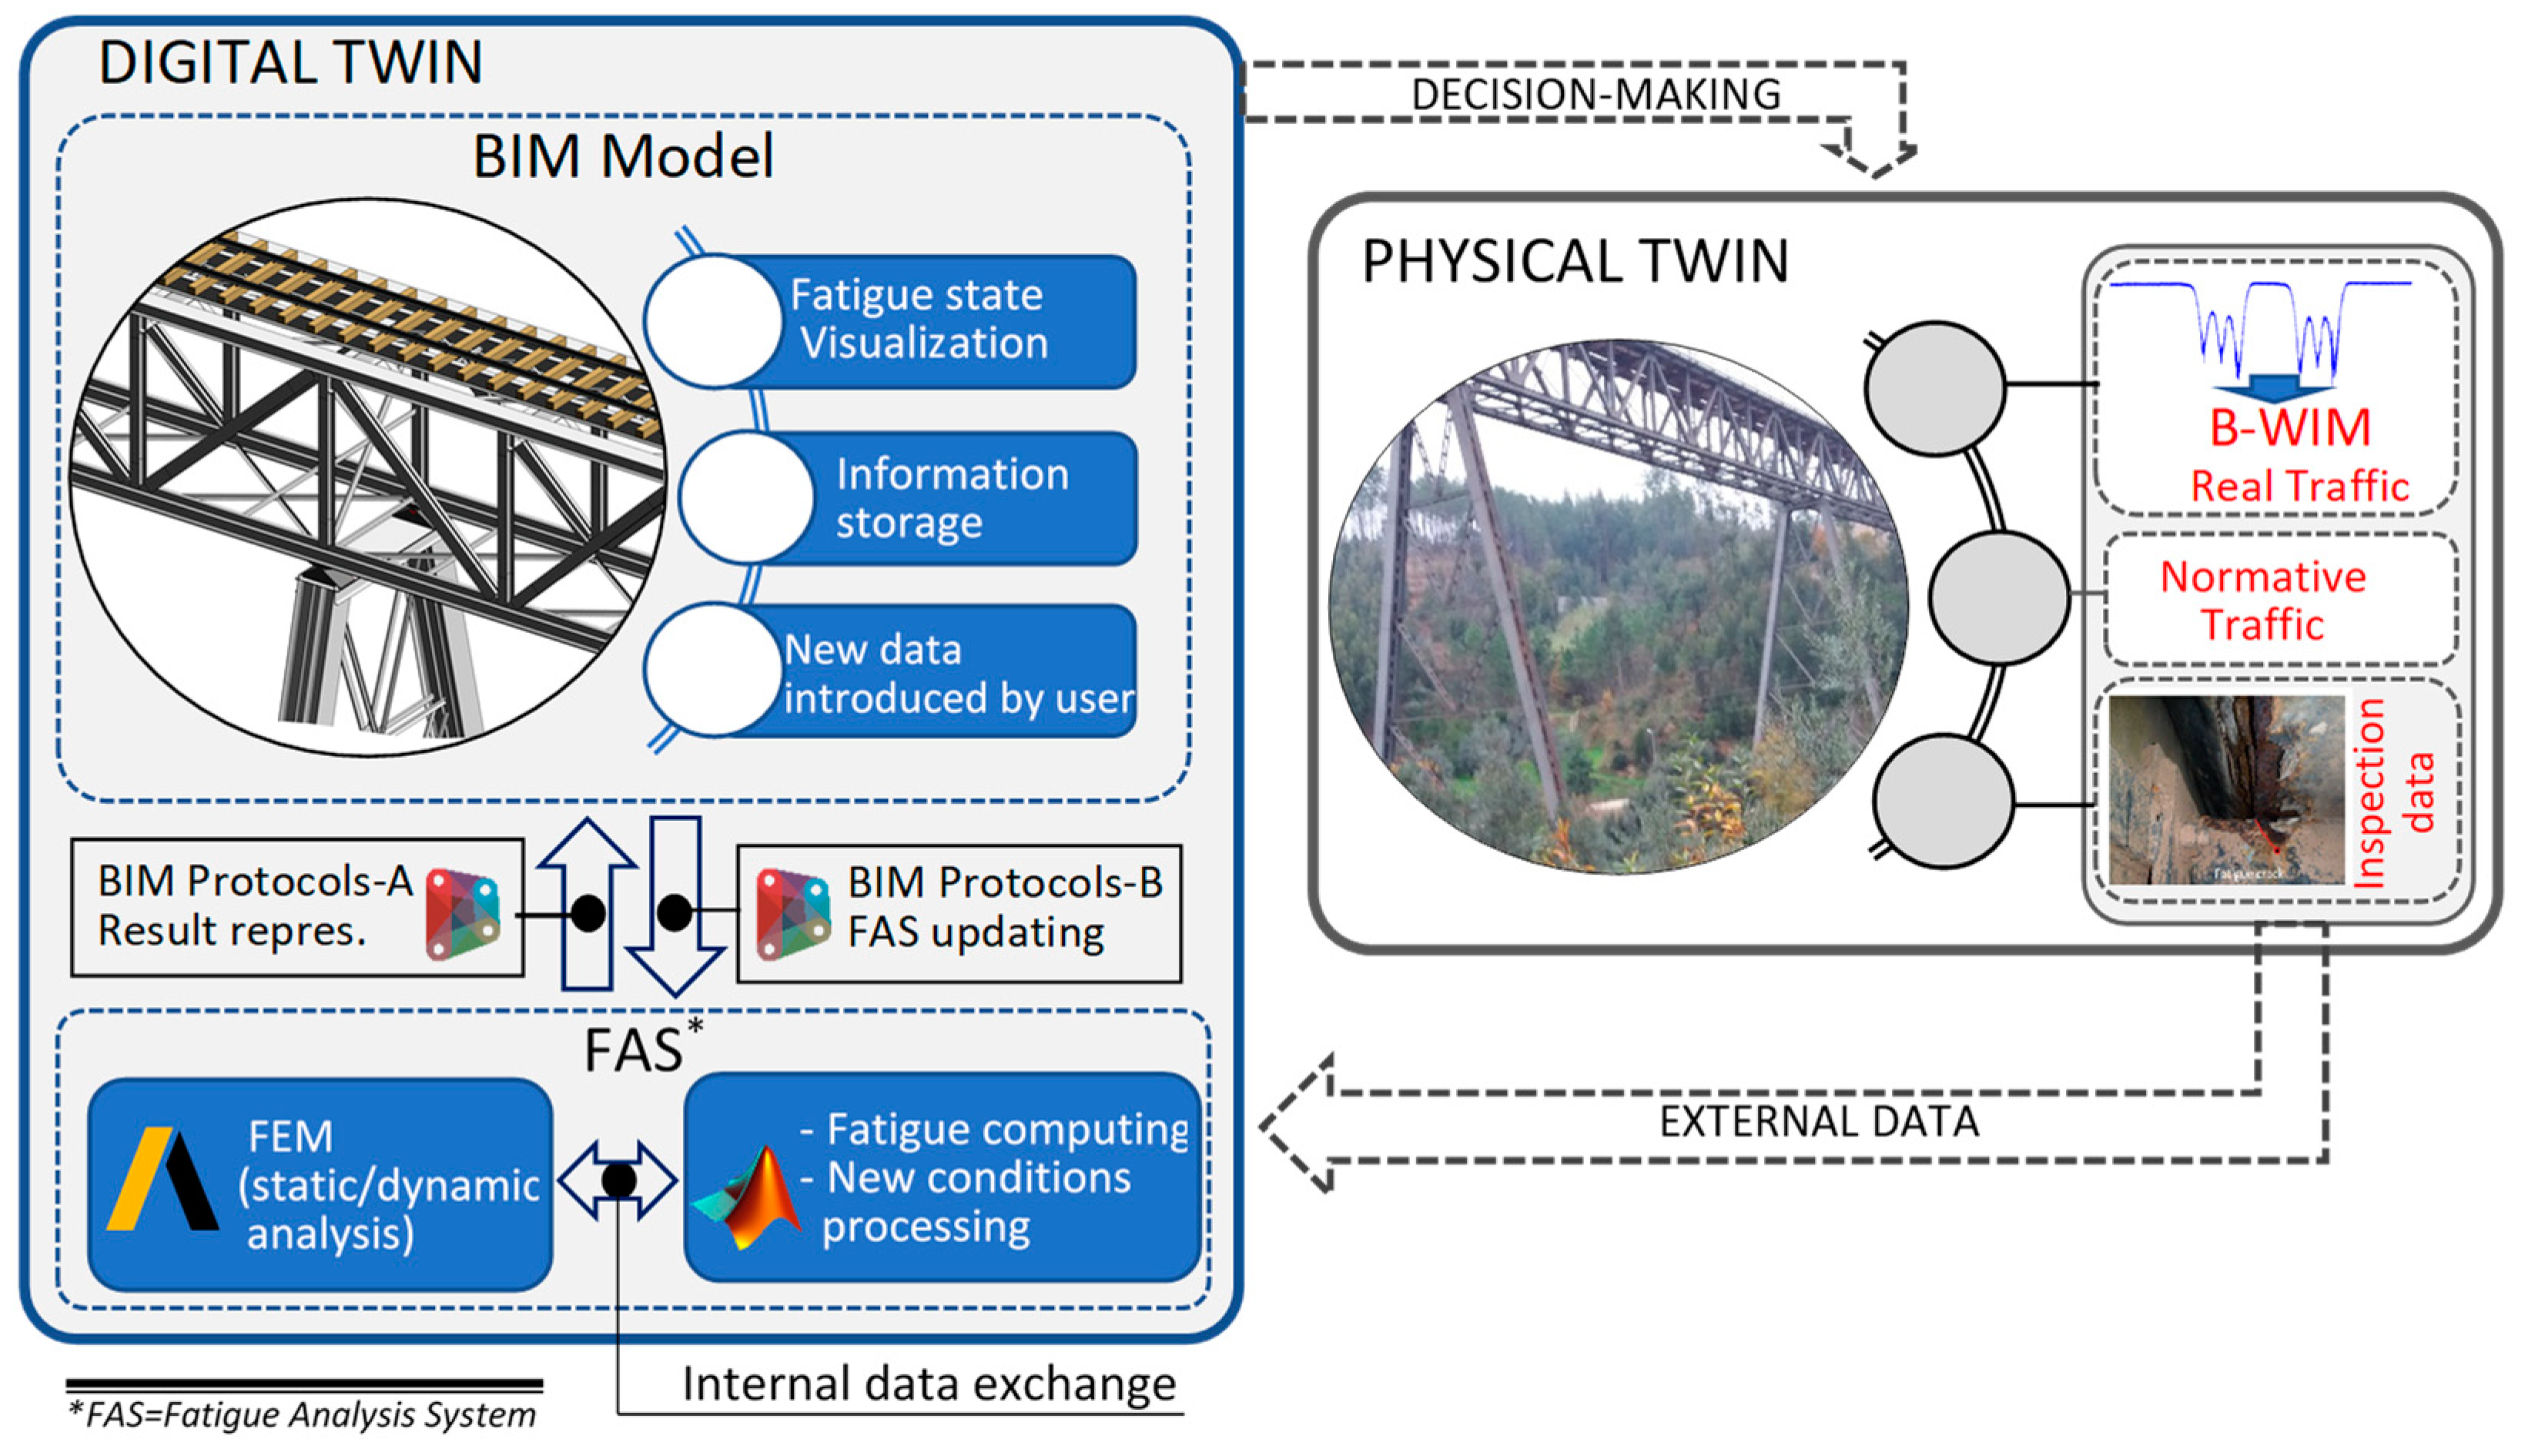
Inspired by the different research works previously reported, this paper proposes an integrated model of a Fatigue Analysis System (FAS) based on a FEM and the BIM model of the bridge in the process of continuous automatic updating of the two parts to form a DT model (Figure 2).
The FAS is divided into two parts: the first is implemented in ANSYS® v.2021 software and is responsible for the static or dynamic analyses required to obtain part of the data necessary to evaluate the fatigue damage in certain detail. The second part is implemented in MATLAB® v2021a, following the steps for fatigue damage calculation specified in the Eurocodes, specifically implementing the Linear Damage Accumulation Method (LDAM). The input of both internal data (from static/dynamic analyses) and external data (e.g., real traffic obtained from weigh-in-motion systems) is also handled by the algorithms implemented in MATLAB® v2021a. The BIM model is developed in Autodesk REVIT® v2021 using 2D drawings (existing project design and as-built drawings), photographic survey, and other available information. This BIM model is, above all, responsible for the representation/visualization of the fatigue evolution and enabling the input of new information the user can introduce). Additionally, in turn, the integration between FAS and BIM that make up the DT model is supported by the Application Programming Interface (API) DYNAMO (coupled to REVIT® v2021) for data driving and routines either implemented in MATLAB® v2021a or through Ansys Parametric Design Language (APDL).
The primary purpose of developing this model is to achieve what is complicated or impractical with the isolated FAS, namely the representation/visualization of the fatigue evolution and automatic change of the geometric and load (traffic) conditions of the model, essentially enabling:
-
Quick mapping of the condition of the connection details regarding the fatigue evolution;
-
“What if scenarios” to quickly evaluate various scenarios affecting fatigue evolution.

2. Fatigue Analysis System (FAS)

Summary: This section addresses the fatigue analysis methodologies, focusing on the methods outlined in the Eurocodes, part of which was implemented in this work. Additionally, reference is made to the enhancement implemented in an existing FAS through the use of a DT model.
The fatigue analysis methodology in steel bridges is fundamentally based on three approaches, namely the Stress-Life Approach, Strain-Life Approach, and the Fracture Mechanic Approach, each with its field of application, with use depending on the interest of the analysis, which is also associated with the global or local approach [26,27]. The Stress-Life Approach (also known as the S-N method) is a global method on which the Eurocode 3, part 1-9 (EC3-1-9 [7]) and many other standards are based and is the most widely used in design [2,26]. The method is based on S-N curves (stress number of cycles to failure) and assumes that the elastic stress state controls the fatigue behavior, generally an accurate representation of high cycle fatigue (HCF). Depending on the stress analysis of the structural detail, this method can be subdivided into the Nominal Stress Method, Hot Spot Stress Method, and Effective Notch Stress Method [25,26]. The first is the most common, and according to EC3-1-9 [7], is called nominal stress, the stress in the parent material adjacent to a potential crack location, calculated by elastic theory without considering any stress concentration effects. When, however, stress concentration is essential, the last two may be used according to the specific situation. Based on the Stress-Life Method, the Eurocodes establish two different methodologies for assessing fatigue resistance in particular structural detail:
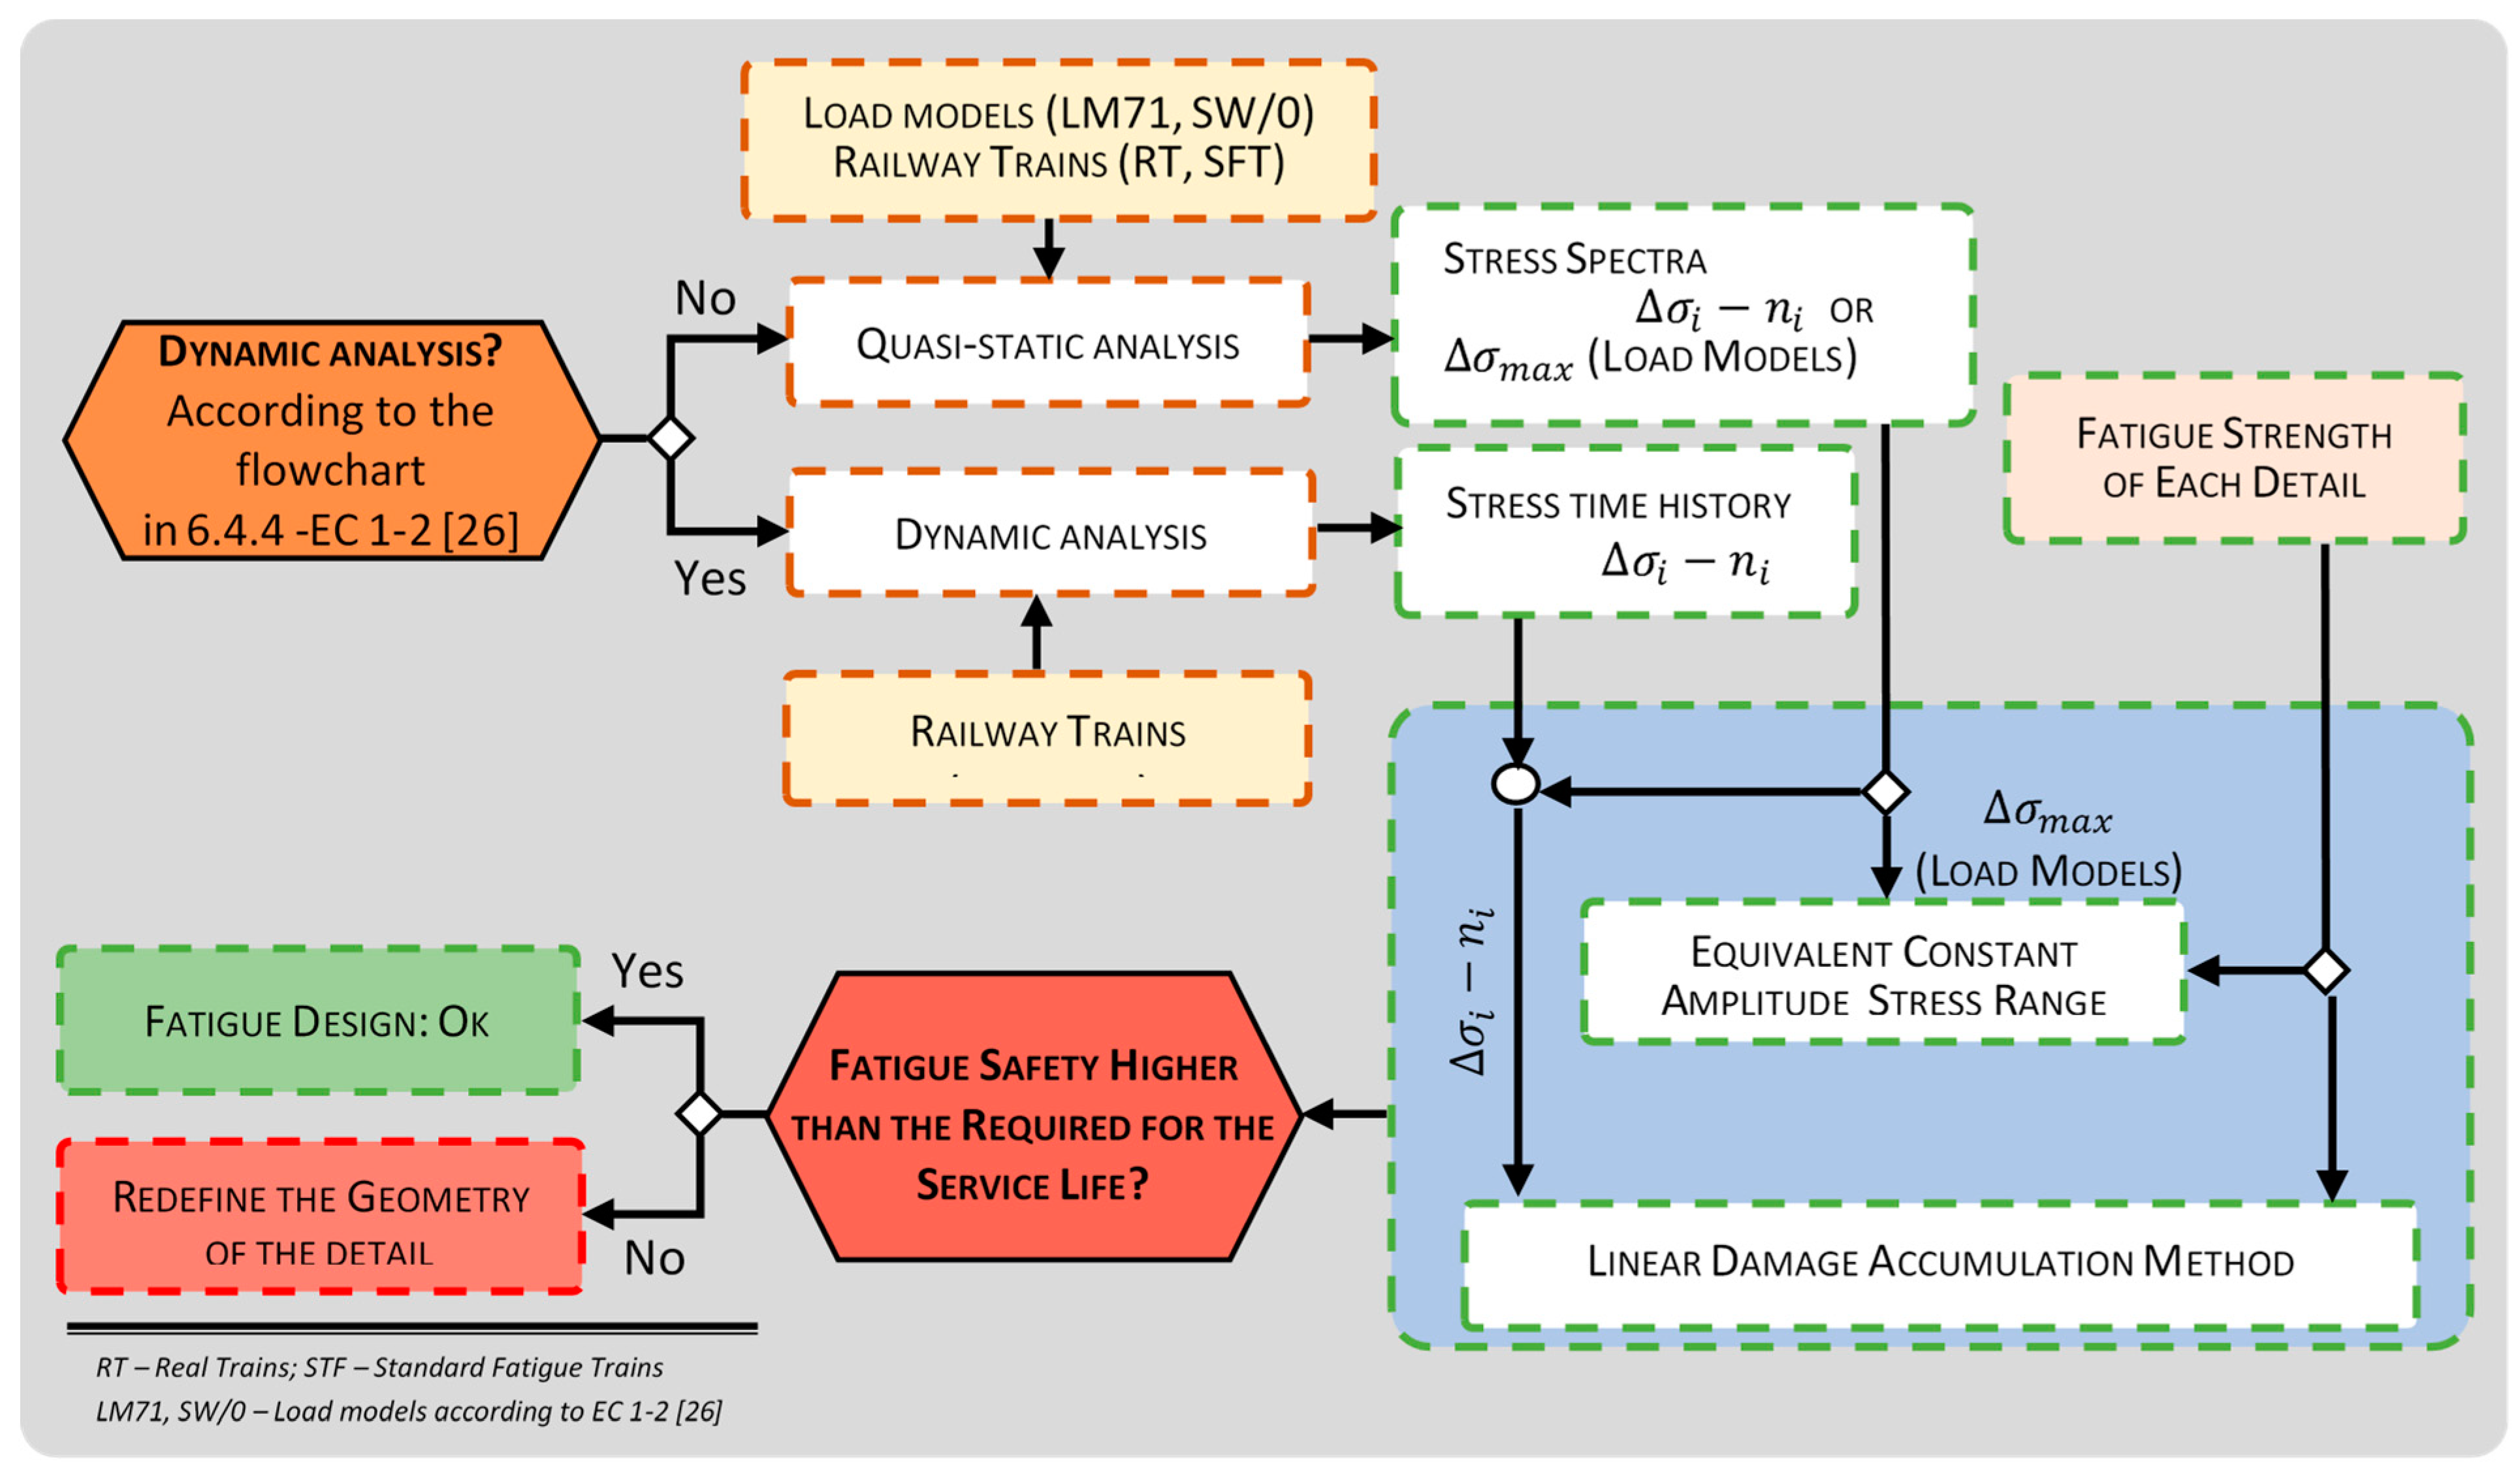
  • The Equivalent Constant Amplitude Stress Range Method (ECASRM) (also known as λ-coefficient method): the method is significantly simplified as it does not consider variation in stress amplitude and is suitable for evaluations under quasi-static effects when dynamic analyses are not necessary, considering the applicable load models defined in EC1-2 [28]. Safety is considered satisfied when the conditions expressed by the inequalities (1) and (2) below are verified:
γ F f . σ E 2 σ c γ M f
γ F f . τ E 2 τ c γ M f
In the above expressions, γ M f and γ F f represent partial safety factors (resistance and loading sides, respectively), σ c and τ c represent the fatigue resistance at 2 × 10⁶ cycles, and σ E 2 and τ E 2 express the equivalent constant amplitude stress range at 2 × 10⁶ cycles. When direct and shear stresses act simultaneously, the following condition must be satisfied (Equation (3)):
γ F f . σ E 2 σ c / γ M f 3 + γ F f . τ E 2 τ c / γ M f 5 1.0
2.
Linear Damage Accumulation Method (LDAM) (also known as Palmgren-Miner rule): the most comprehensive method provided by the Eurocodes and has been widely used in several research projects. Both quasi-static and dynamic analyses can be associated with actual or normative traffic for fatigue specified in EC1-2 [28]. To assess safety, the accumulation of partial fatigue damage corresponding to stress amplitudes σ i generated from a given stress history is computed (Equation (4)).
D = n i N i = n 1 N 1 + n 2 N 2 + + n k N k 1
where D represents the accumulated fatigue damage considering a certain cyclic loading; n i represents the number of load cycles at σ i ; and N i represent the fatigue life expressed in cycles of the detail submitted to the same stress range, σ i , with i ranging from 1 to k .
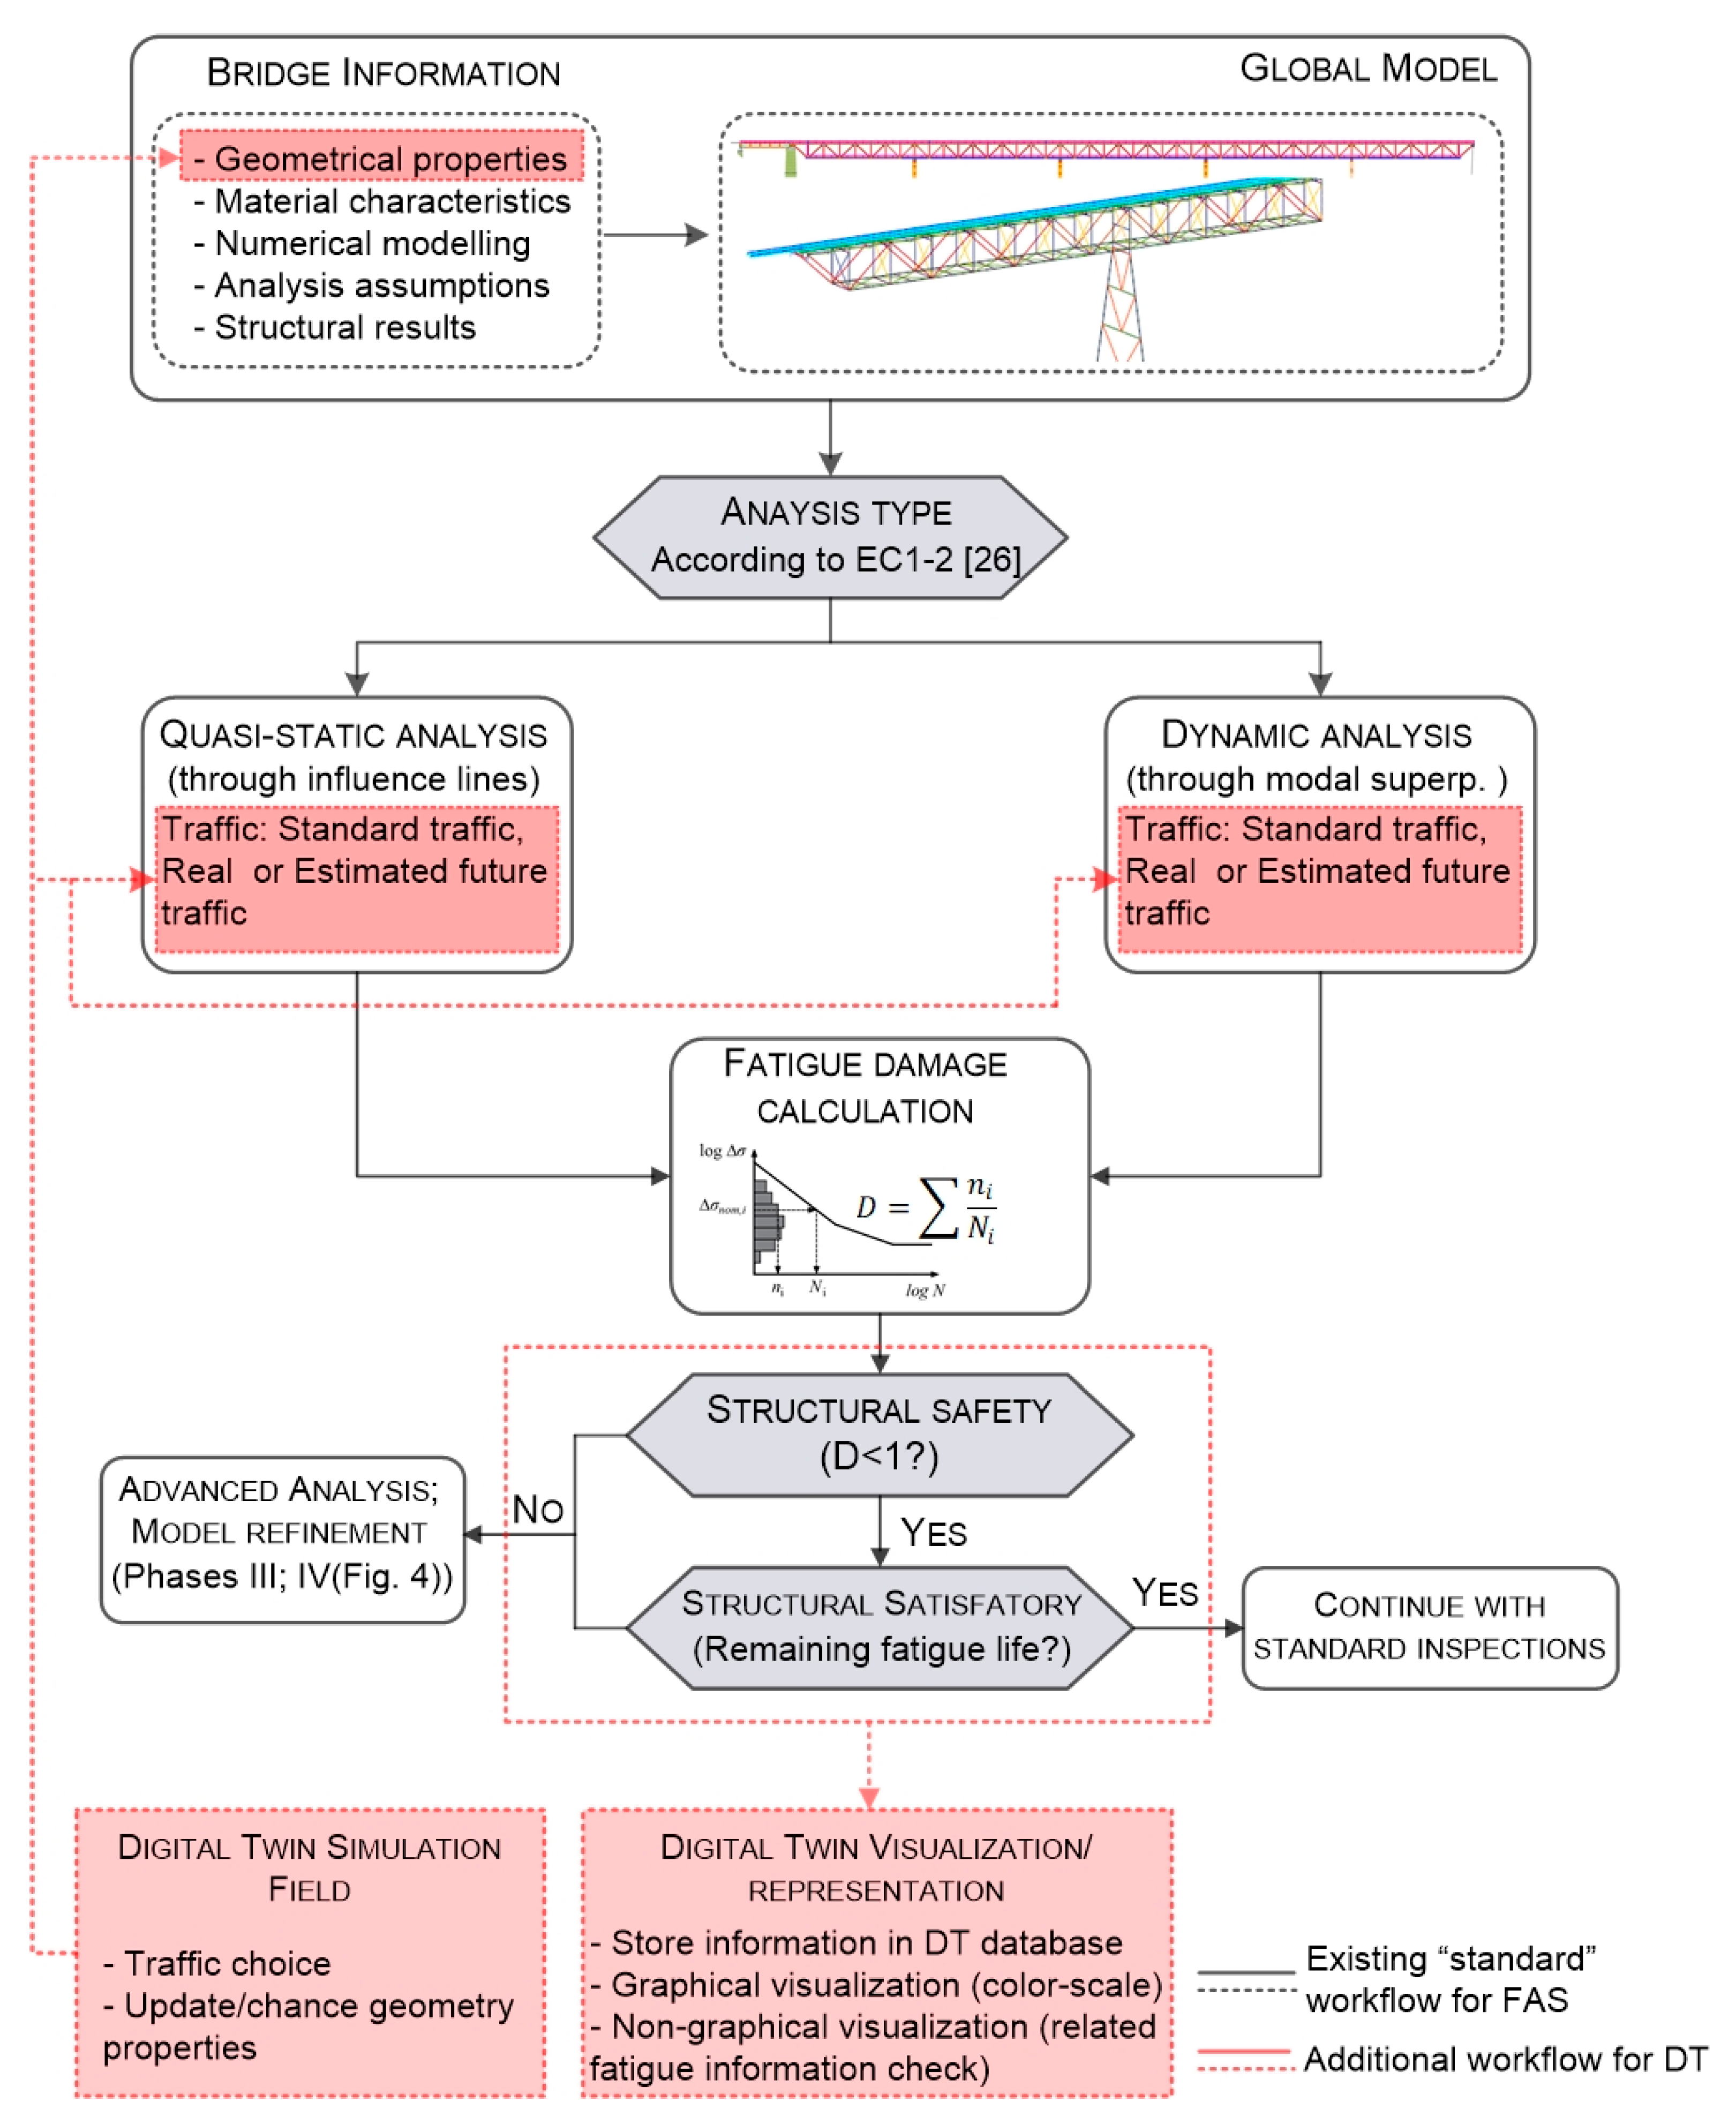
Figure 3 [26] depicts the general scheme of the fatigue analysis methodology for RSBs according to the Eurocodes.
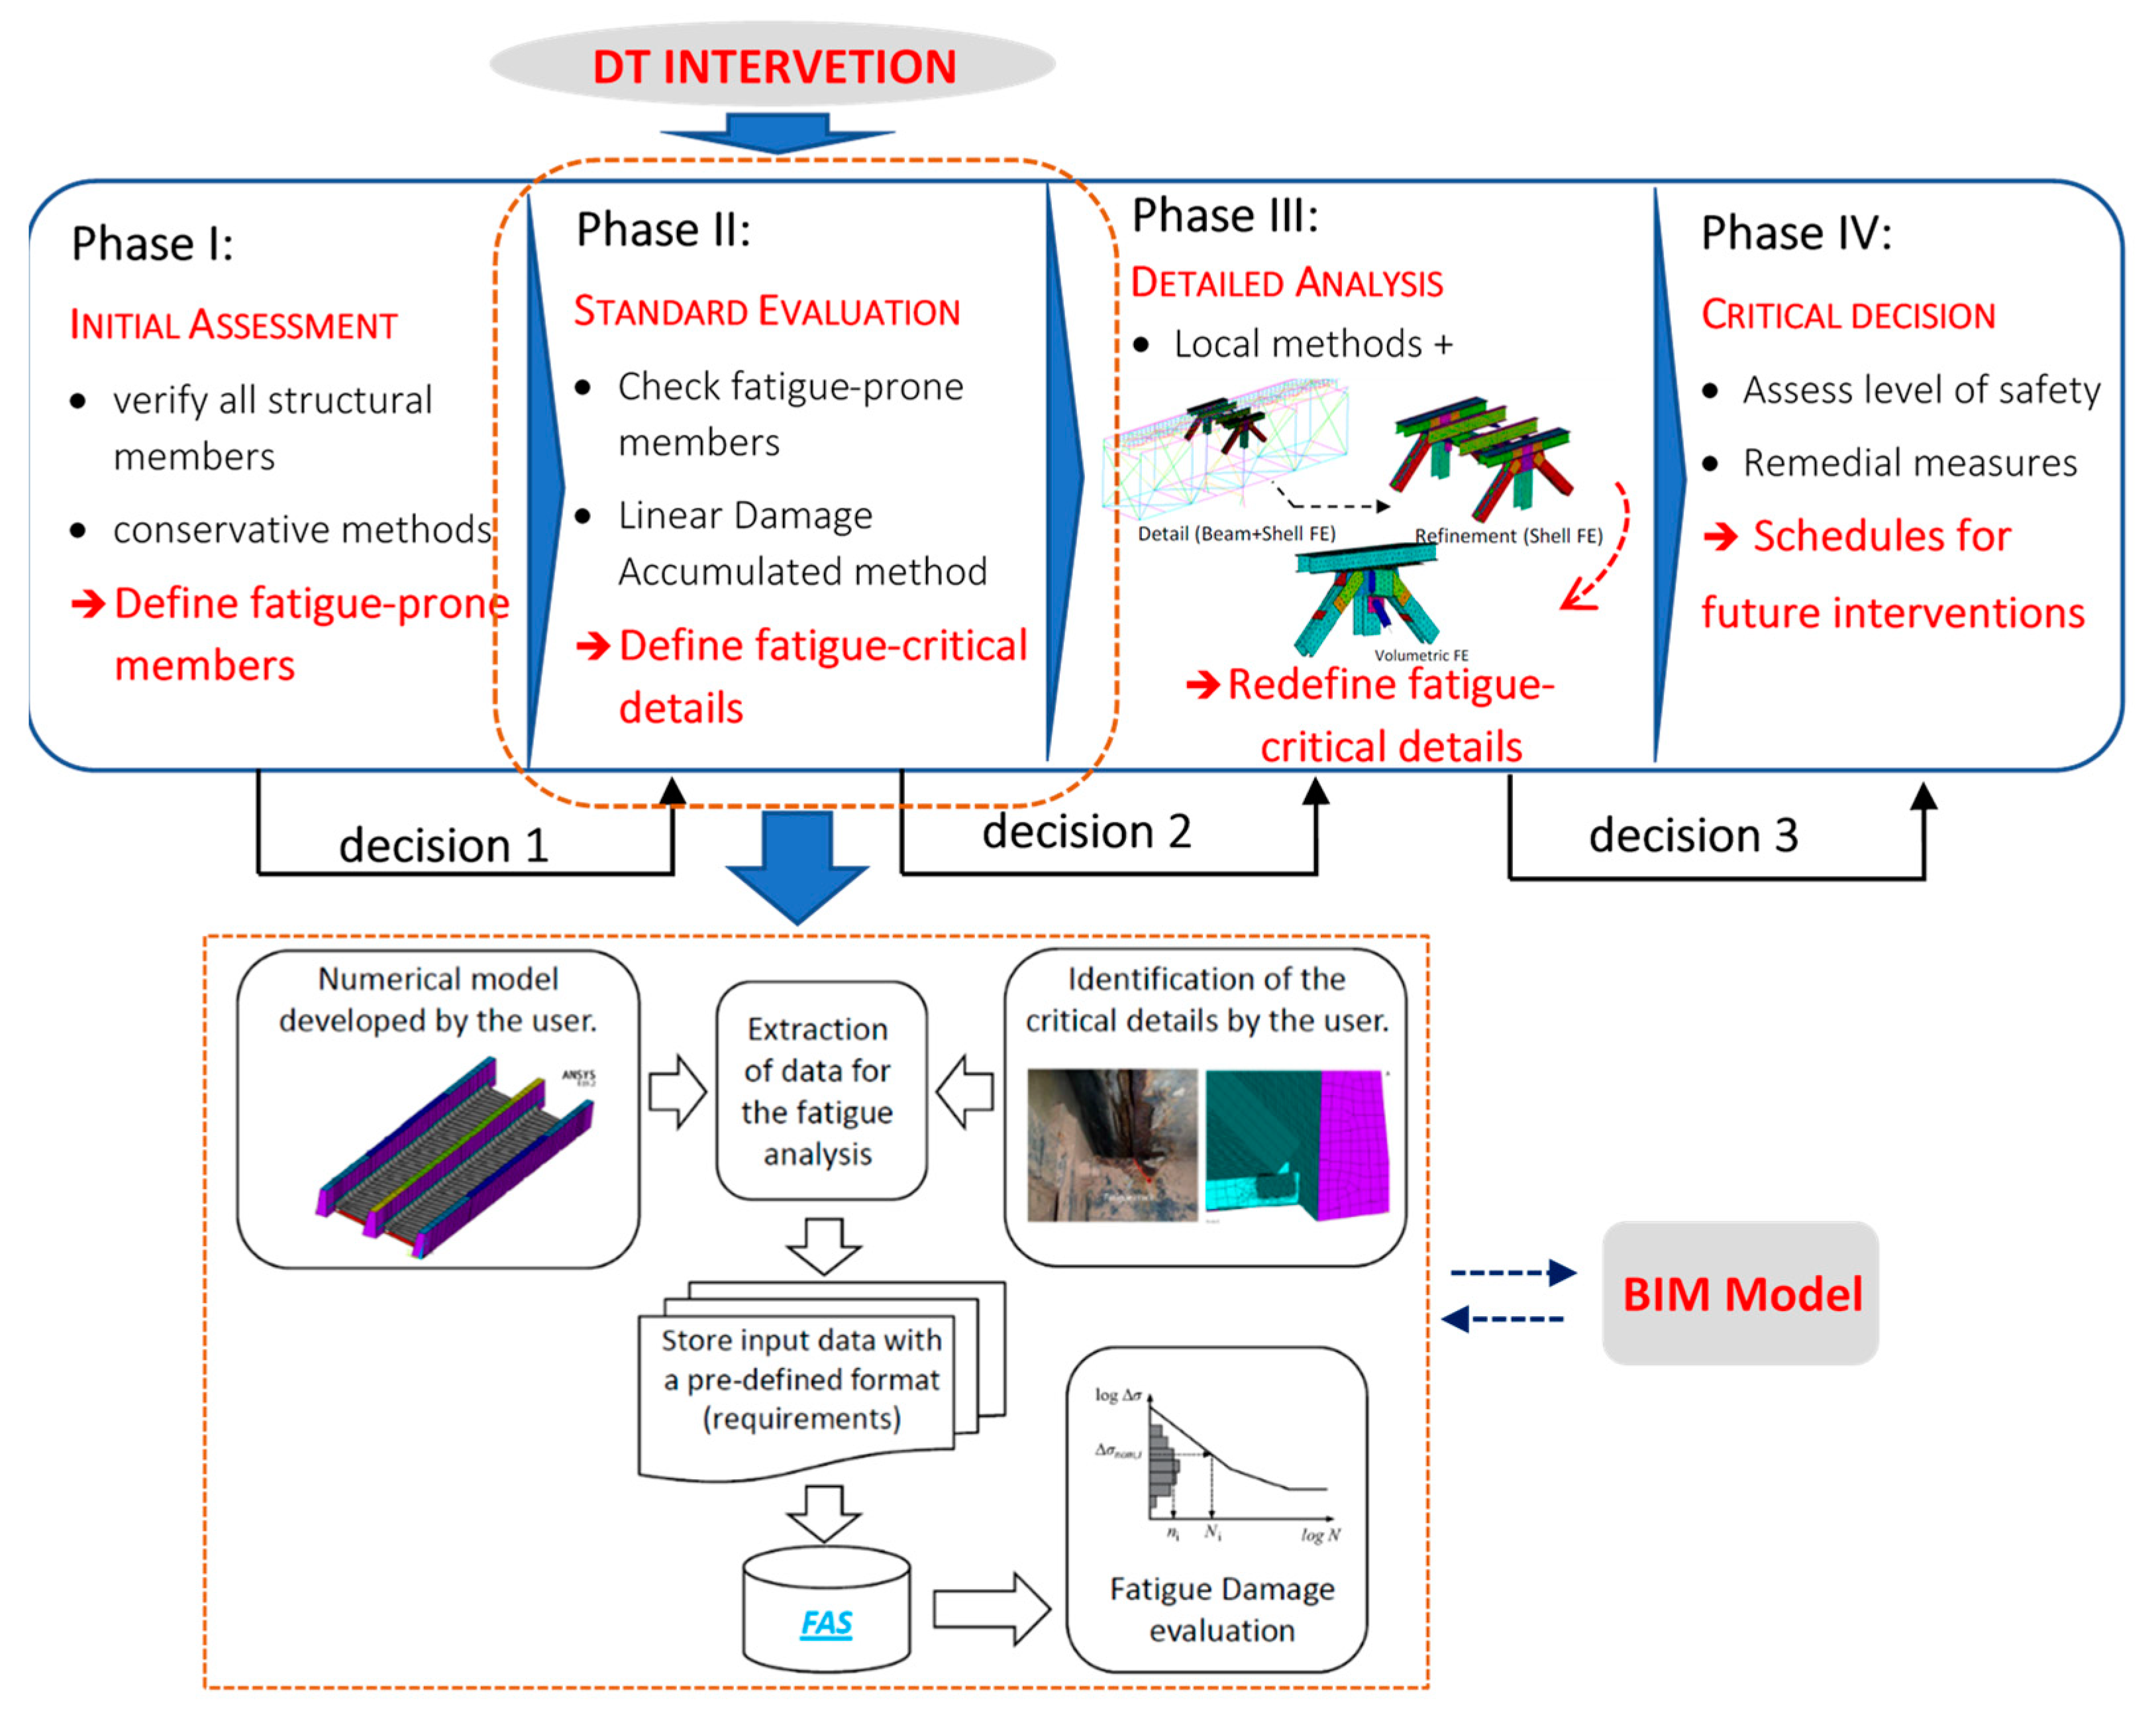
The FAS implemented in this work is one of four phases of a four-phase process covering preliminary to advanced fatigue analysis of RSBs in the study initiated by [1,29] and that, in the scope of the development of the proposed DT model, was continued by the team responsible for this present work. The proposed DT approach aims to increase the performance of one of these phases and, thus, the process as a whole (Figure 4).
As seen in Figure 4, the digital DT links up with the second phase, which is a so-called standard phase and based on the LDAM, already described above. It is a crucial phase, as it is a determinant for partial decision making in the sense of performing or not more advanced local analysis. Making this phase more flexible with the proposed DT model can significantly improve the asset management process, considerably reducing the manual effort for checking critical details and simulating effects that affect fatigue evolution.

3. Approach to the Proposed Digital Twin Model

Summary: The proposed methodology for developing and implementing the DT model, with the goal of analyzing the evolution of the fatigue state, is presented in detail in this section. Along with data storage, processing, and information flow, which form the backbone of the proposed model’s operation, the relationship with BIM and its support for model creation are also discussed.

3.1. Data Scheme for the Proposed Digital Twin Model

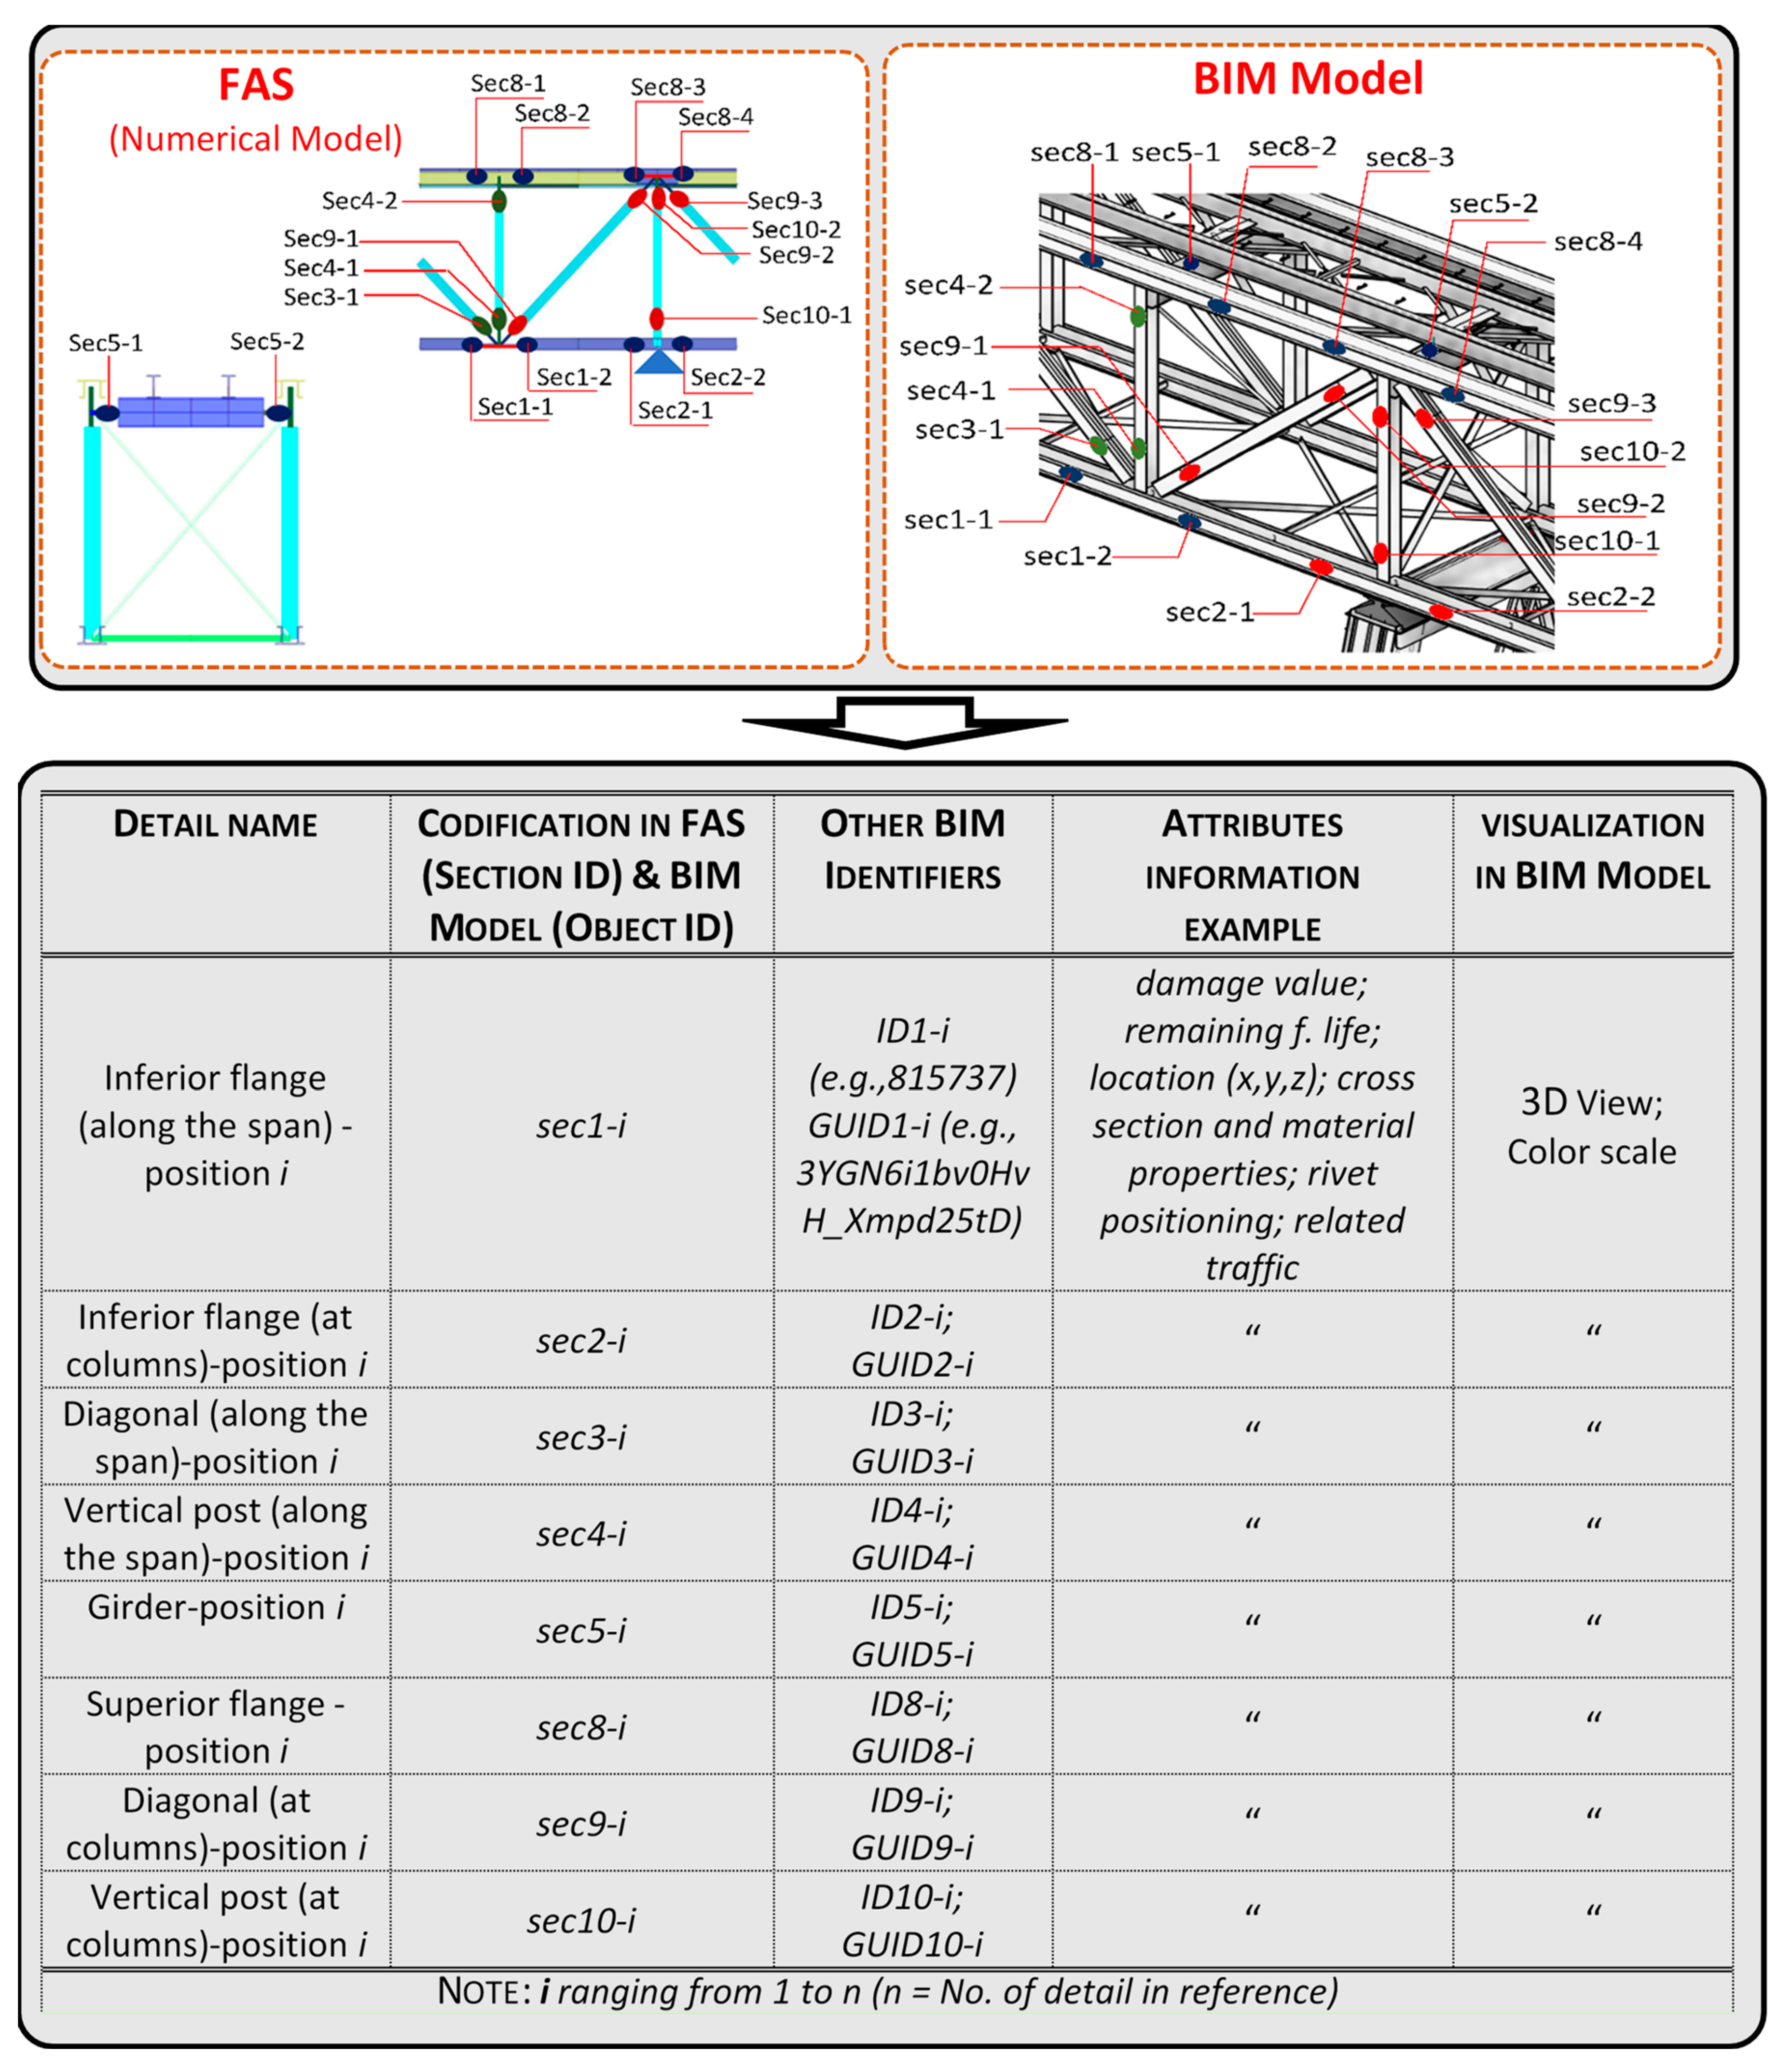
Since the numerical model (in FAS) and the BIM model of the bridge are initially created separately, what links and makes them interact is the data flow, so the geometries of the two parts, for example, must be in full agreement. Both geometries are created via direct modeling from existing design and other information, such as as-built drawings and photographic surveys. For example, the procedure adopted by [30] uses data to create geometric models (data-driven design approach). Therefore, in this scheme, what matters most is the data flow between the parts of the FAS (which includes FEM and fatigue computation) and the BIM model. These data are related to the different connection details coded in the FAS and BIM model (Figure 5) (only a sample of principal connection details is shown). For example, the details of the inferior flanges of the bridge truss along the span are coded “sec1-i” (with i ranging from 1 to the number of this type of detail), which is in charge of the data flow and exchange between the FAS and the BIM model. The BIM model has additional object identifiers (Element ID and GUID) that are inherent to the BIM authoring tool and employed for other scopes.
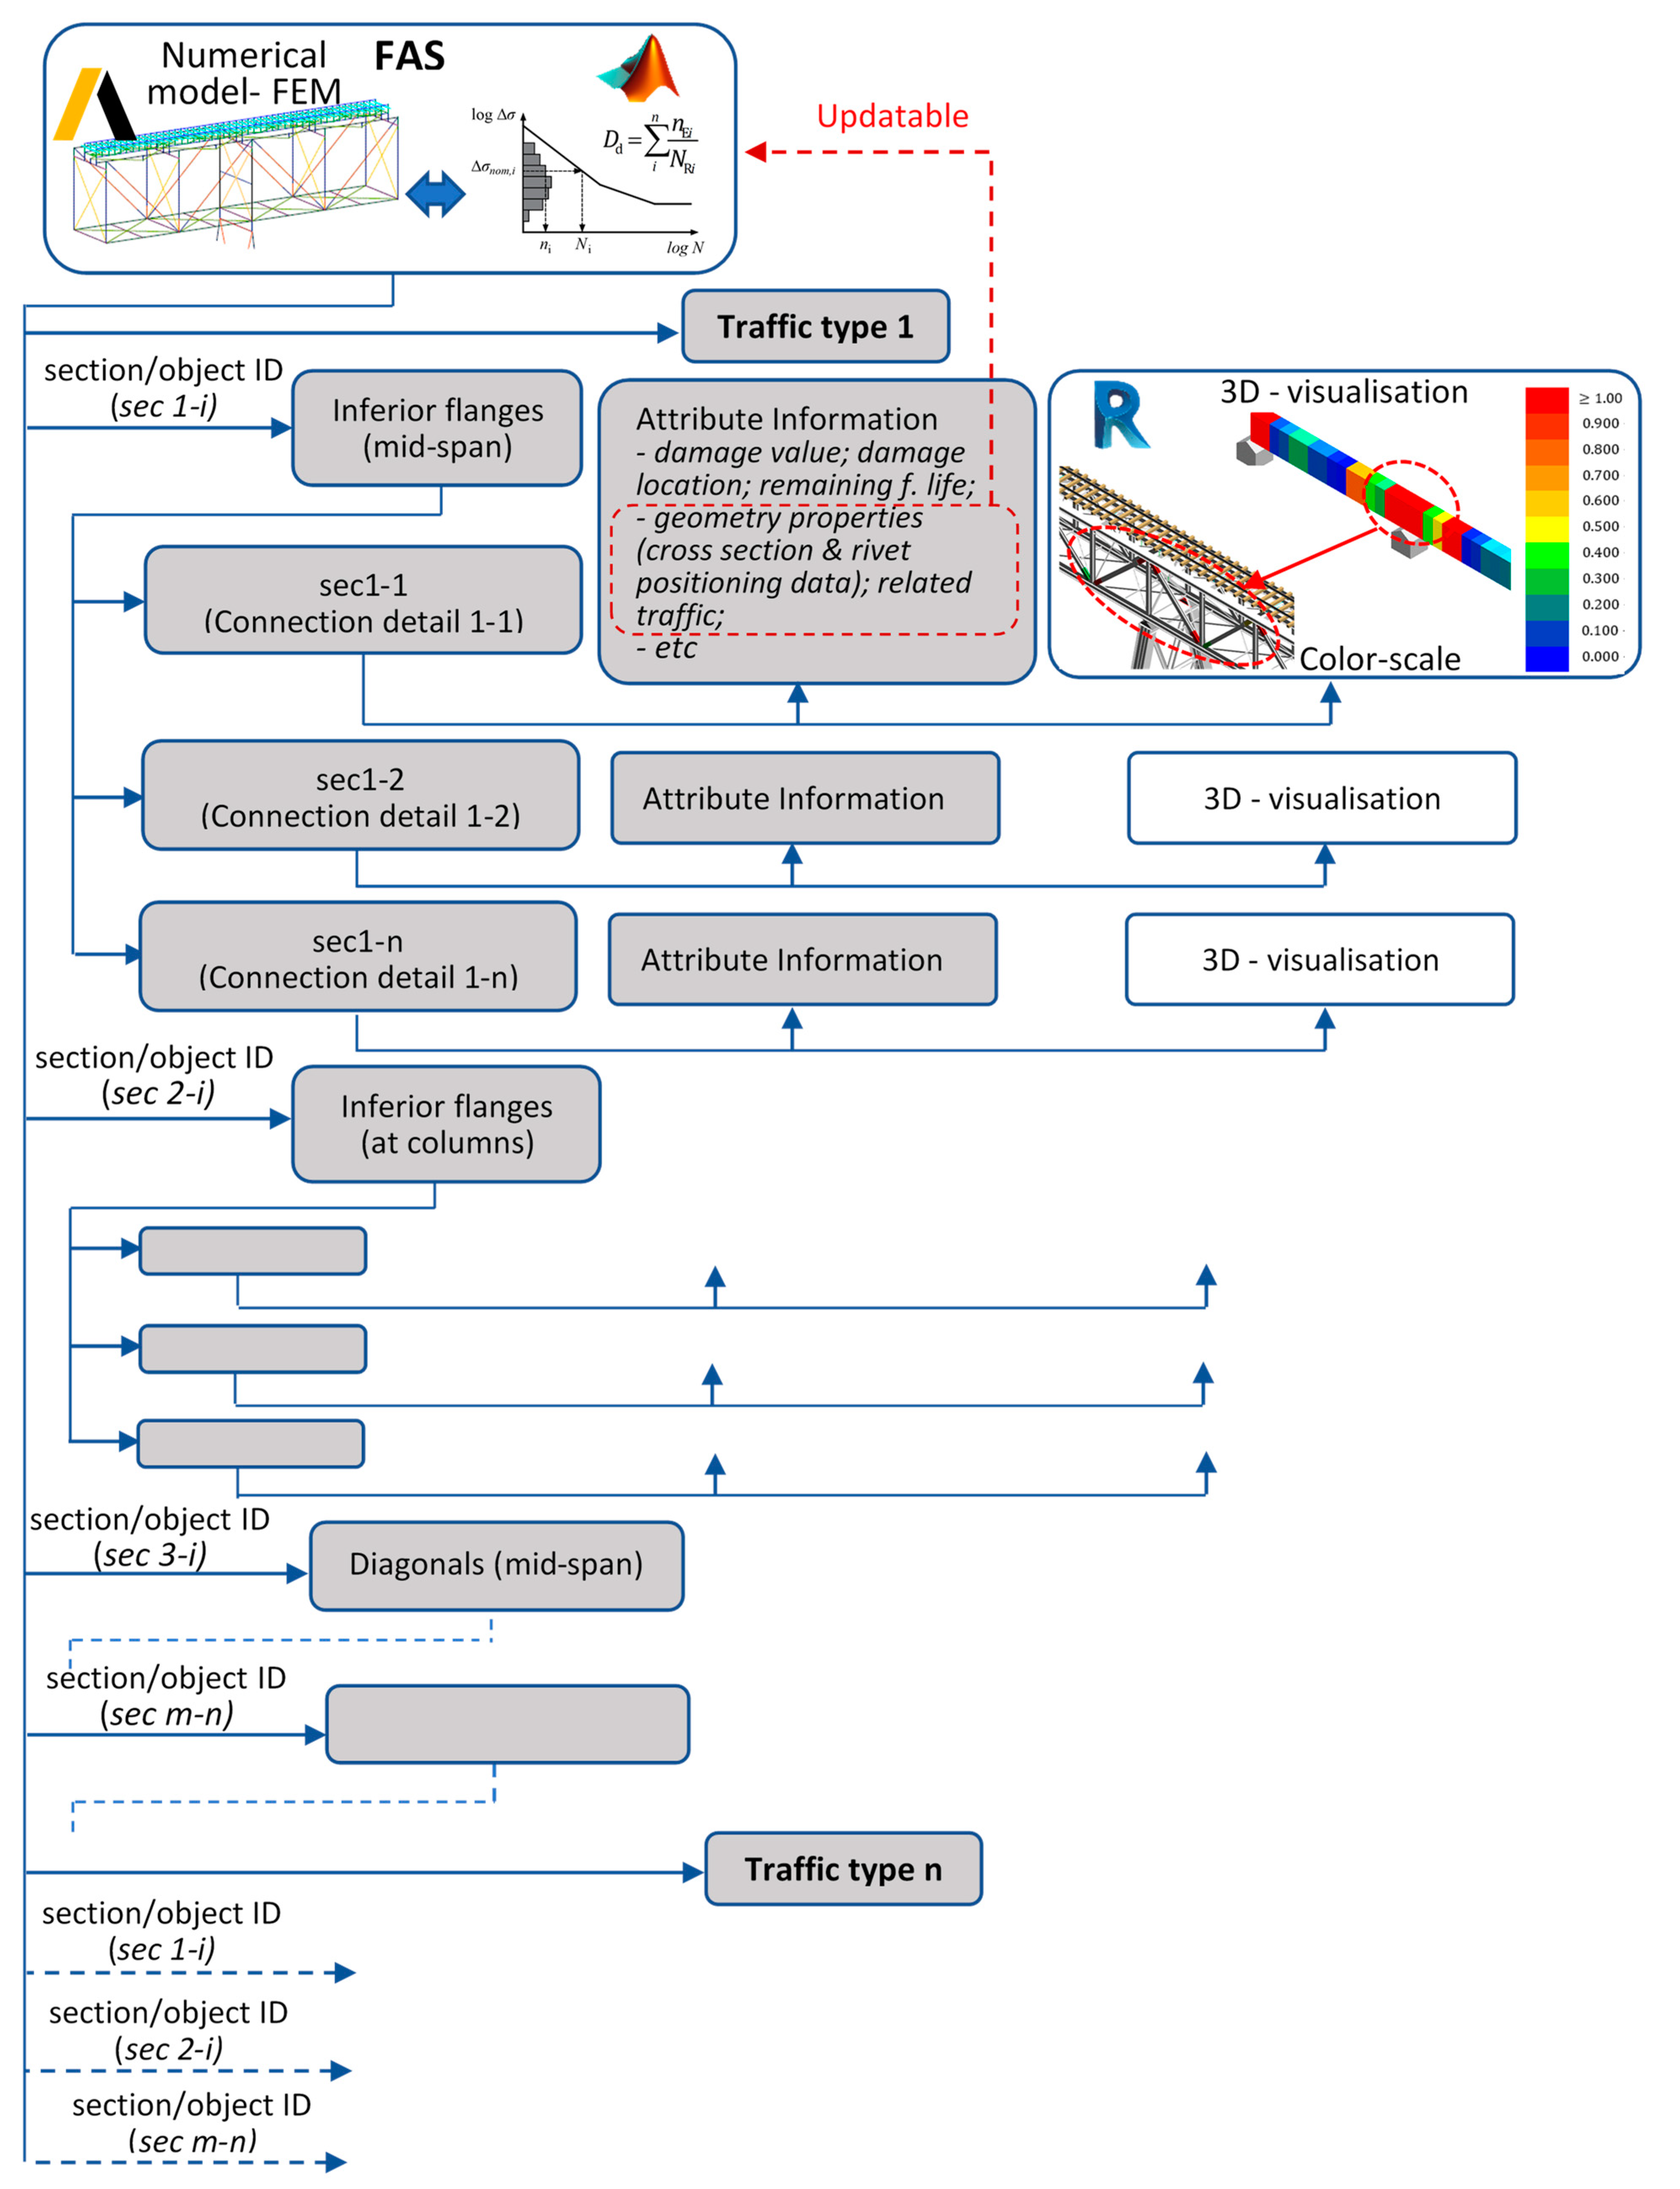
As shown in Figure 6, within the scope of the proposed DT model, the FAS is responsible for ultimately computing the accumulated fatigue damage in the various connection details (see Figure 5), taking into account several variables, the most important of which are traffic levels and geometry properties near the fatigue-prone location. The challenge is to represent the damage and its location in the BIM model in real time once the damage has been computed and located. The representation in the BIM model is performed graphically and non-graphically (attributes). The graphical representation consists of a color-based visualization of the damage that is somewhat analogous to the representation of result analysis in numerical programs, such as finite element analyses (e.g., stress levels, deformation, etc.). Since the LDAM establishes a damage variation from 0 to 1, with 1 being the most critical situation, the detail reflects the reddish color at that level. The data flow begins with a routine implemented in MATLAB® v2021a in FAS for information preparation and output (excel files), followed by DYNAMO visual programming routines for (a) converting the damage into color levels and allocating them to the relevant detail in the BIM model and (b) sending damage extent values and other pertinent information (attributes) to the BIM model. The attributes are made up of parameters created in the BIM model and others specific to the BIM authoring tool (e.g., cross-section type and material). The created parameters are, for instance, those that indicate the damage extent value of a particular detail selected in the model, the type of traffic associated with the damage at a detail, etc.
On the other hand, aiming to achieve one of the main characteristics of a DT, which is the simulation capability (“what if”), a simulation process involving conditions that affect the fatigue evolutions, namely traffic (traffic variation) and geometry (possibility of changing the cross-section properties near the fatigue-prone location and possible change in rivet positioning, assuming here details of riveted connections which compose the bridge case study of the proposed DT model) is implemented. For this purpose, which involves updating data (see Figure 6), the following steps are taken:
  • Create parameters in the BIM platform to (a) choose a particular type of traffic for analysis and (b) introduce geometry properties data to update the numerical model;
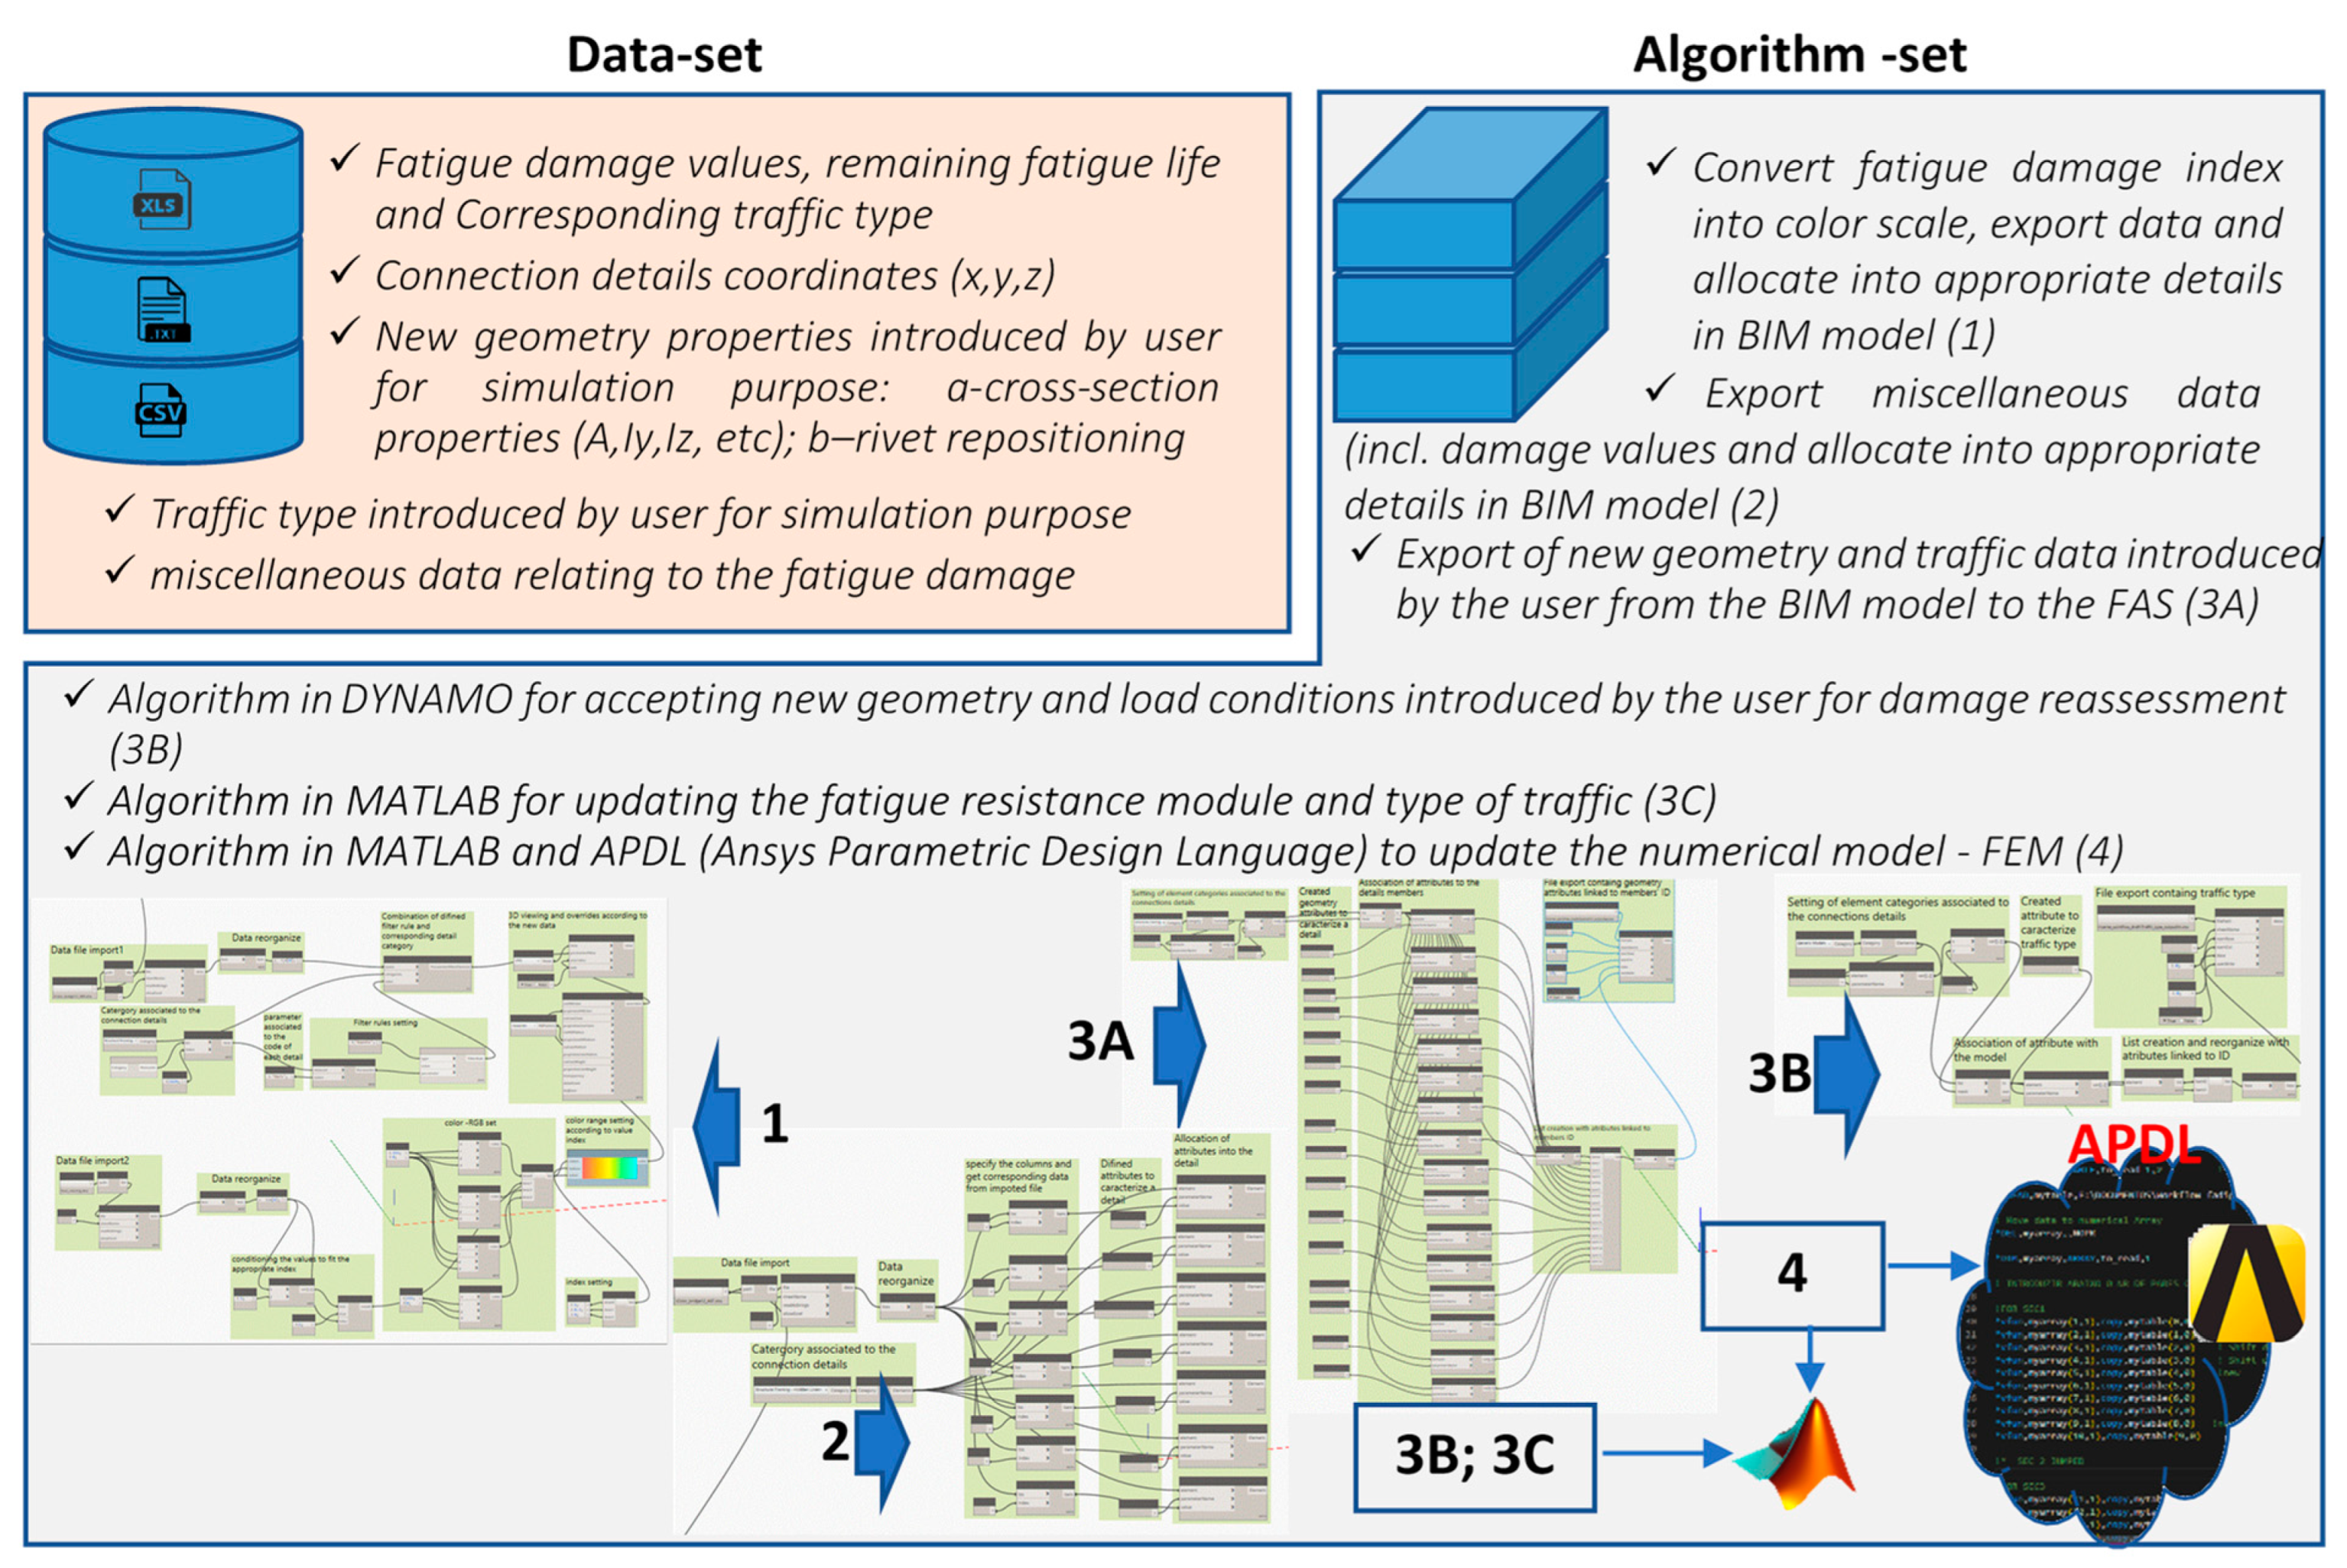
  • Implement a routine in a visual programming DYNAMO to extract the data mentioned above and forward it to FAS;
  • Create new routines based on MATLAB® v2021a and APDL in the previously created FAS so that the system can receive new data, be updated (including the FEM), and issue new results.

3.2. Integrated Data-Flow Process for Fatigue Damage Representation and Simulation

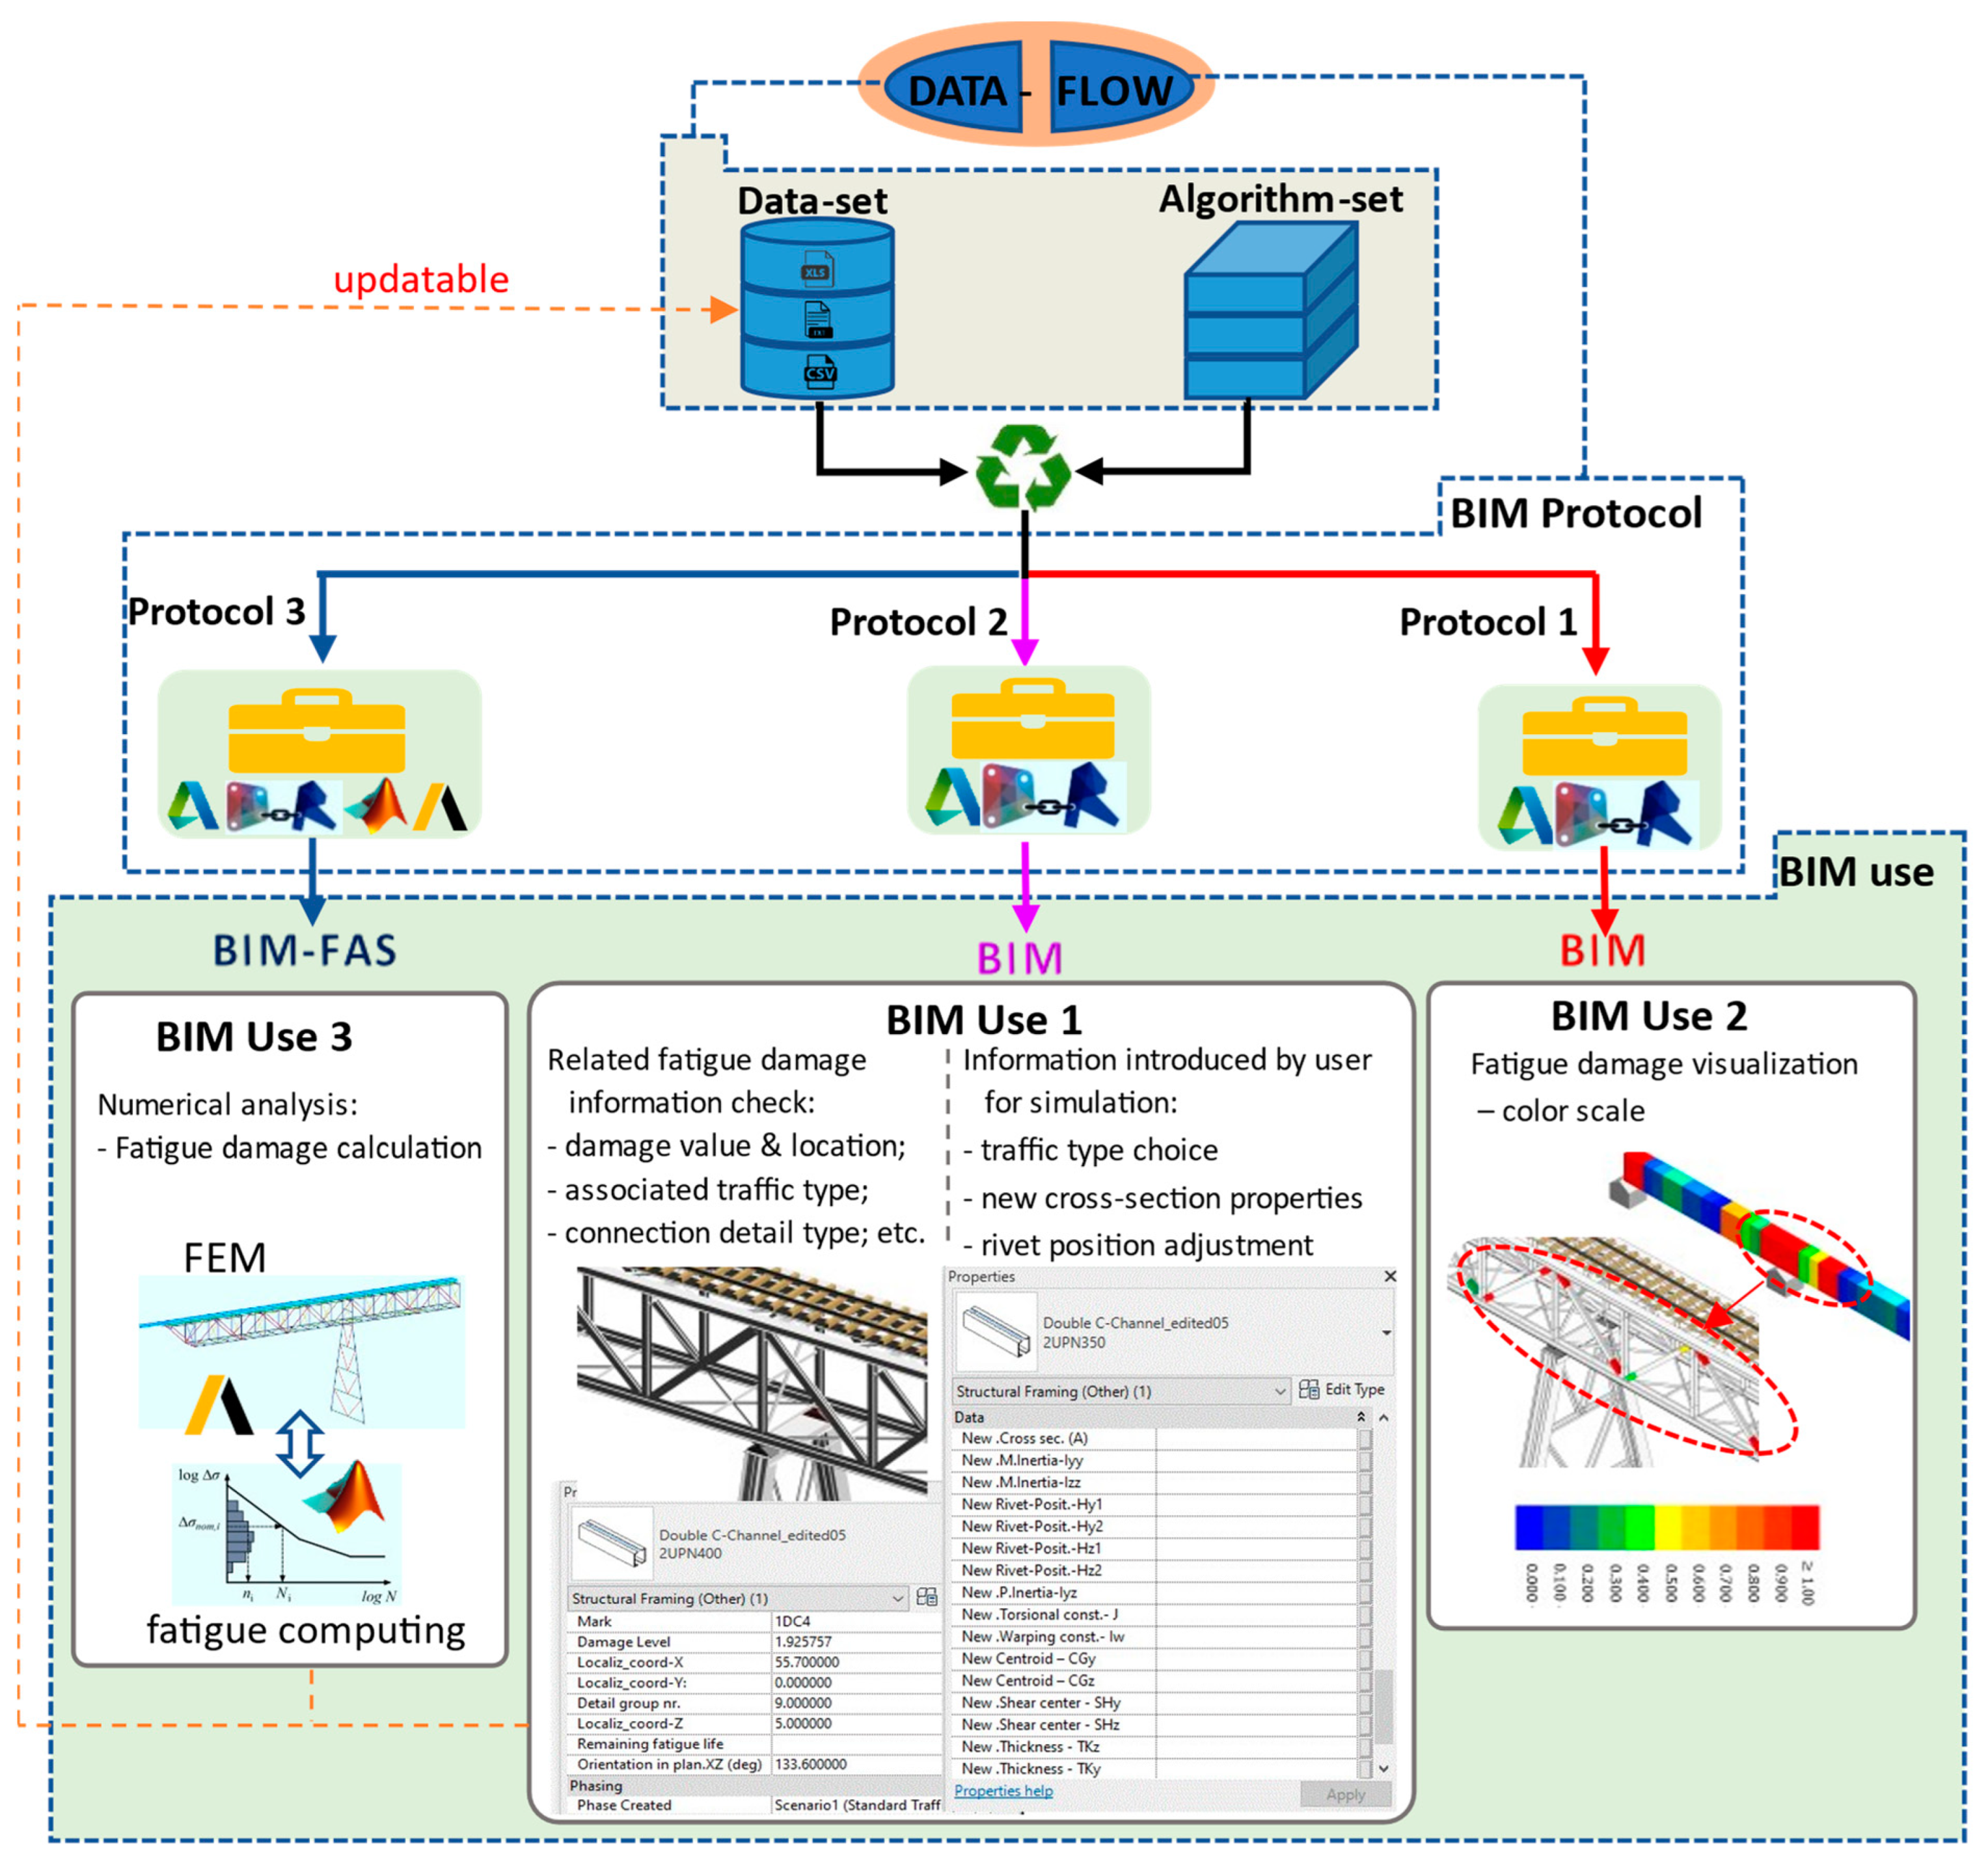
As described in the previous subchapter, the global model relies on the data flow between the two main parts that make up the DT model (FAS and BIM model) for visualization of the state of fatigue evolution and simulation of different conditions affecting this evolution. The integrated data-flow process for various uses in the scope of the proposed DT model is shown in Figure 7. With the FAS established and the 3D geometric model of the bridge created in BIM, the following data is produced:
(a)
The FAS produces the accumulated damage in the different details, the location of the respective details, and the associated traffic. These data and other relevant data from the FAS are forwarded for representation in the BIM model.
(b)
The information introduced by the user in the BIM platform to update the FAS (FEM and other variables of the fatigue resistance module).
This database is stored on a specified server (for example, a BIM server). Different BIM protocols can bridge the information, manipulate it, and release it to other tools/algorithms to achieve the desired result.
The data set and algorithm set indicated in Figure 7 are detailed in Figure 8.

4. Bridge Case Study

Summary: The application of the proposed methodology is demonstrated in this section through a case study involving a RSB that was previously subjected to a FAS. As a part of this study, the system is enhanced through its federation with the BIM model to form the DT model. The numerical model of the bridge, analysis methods, system validation, and the achieved results are discussed.

4.1. Description of the Bridge

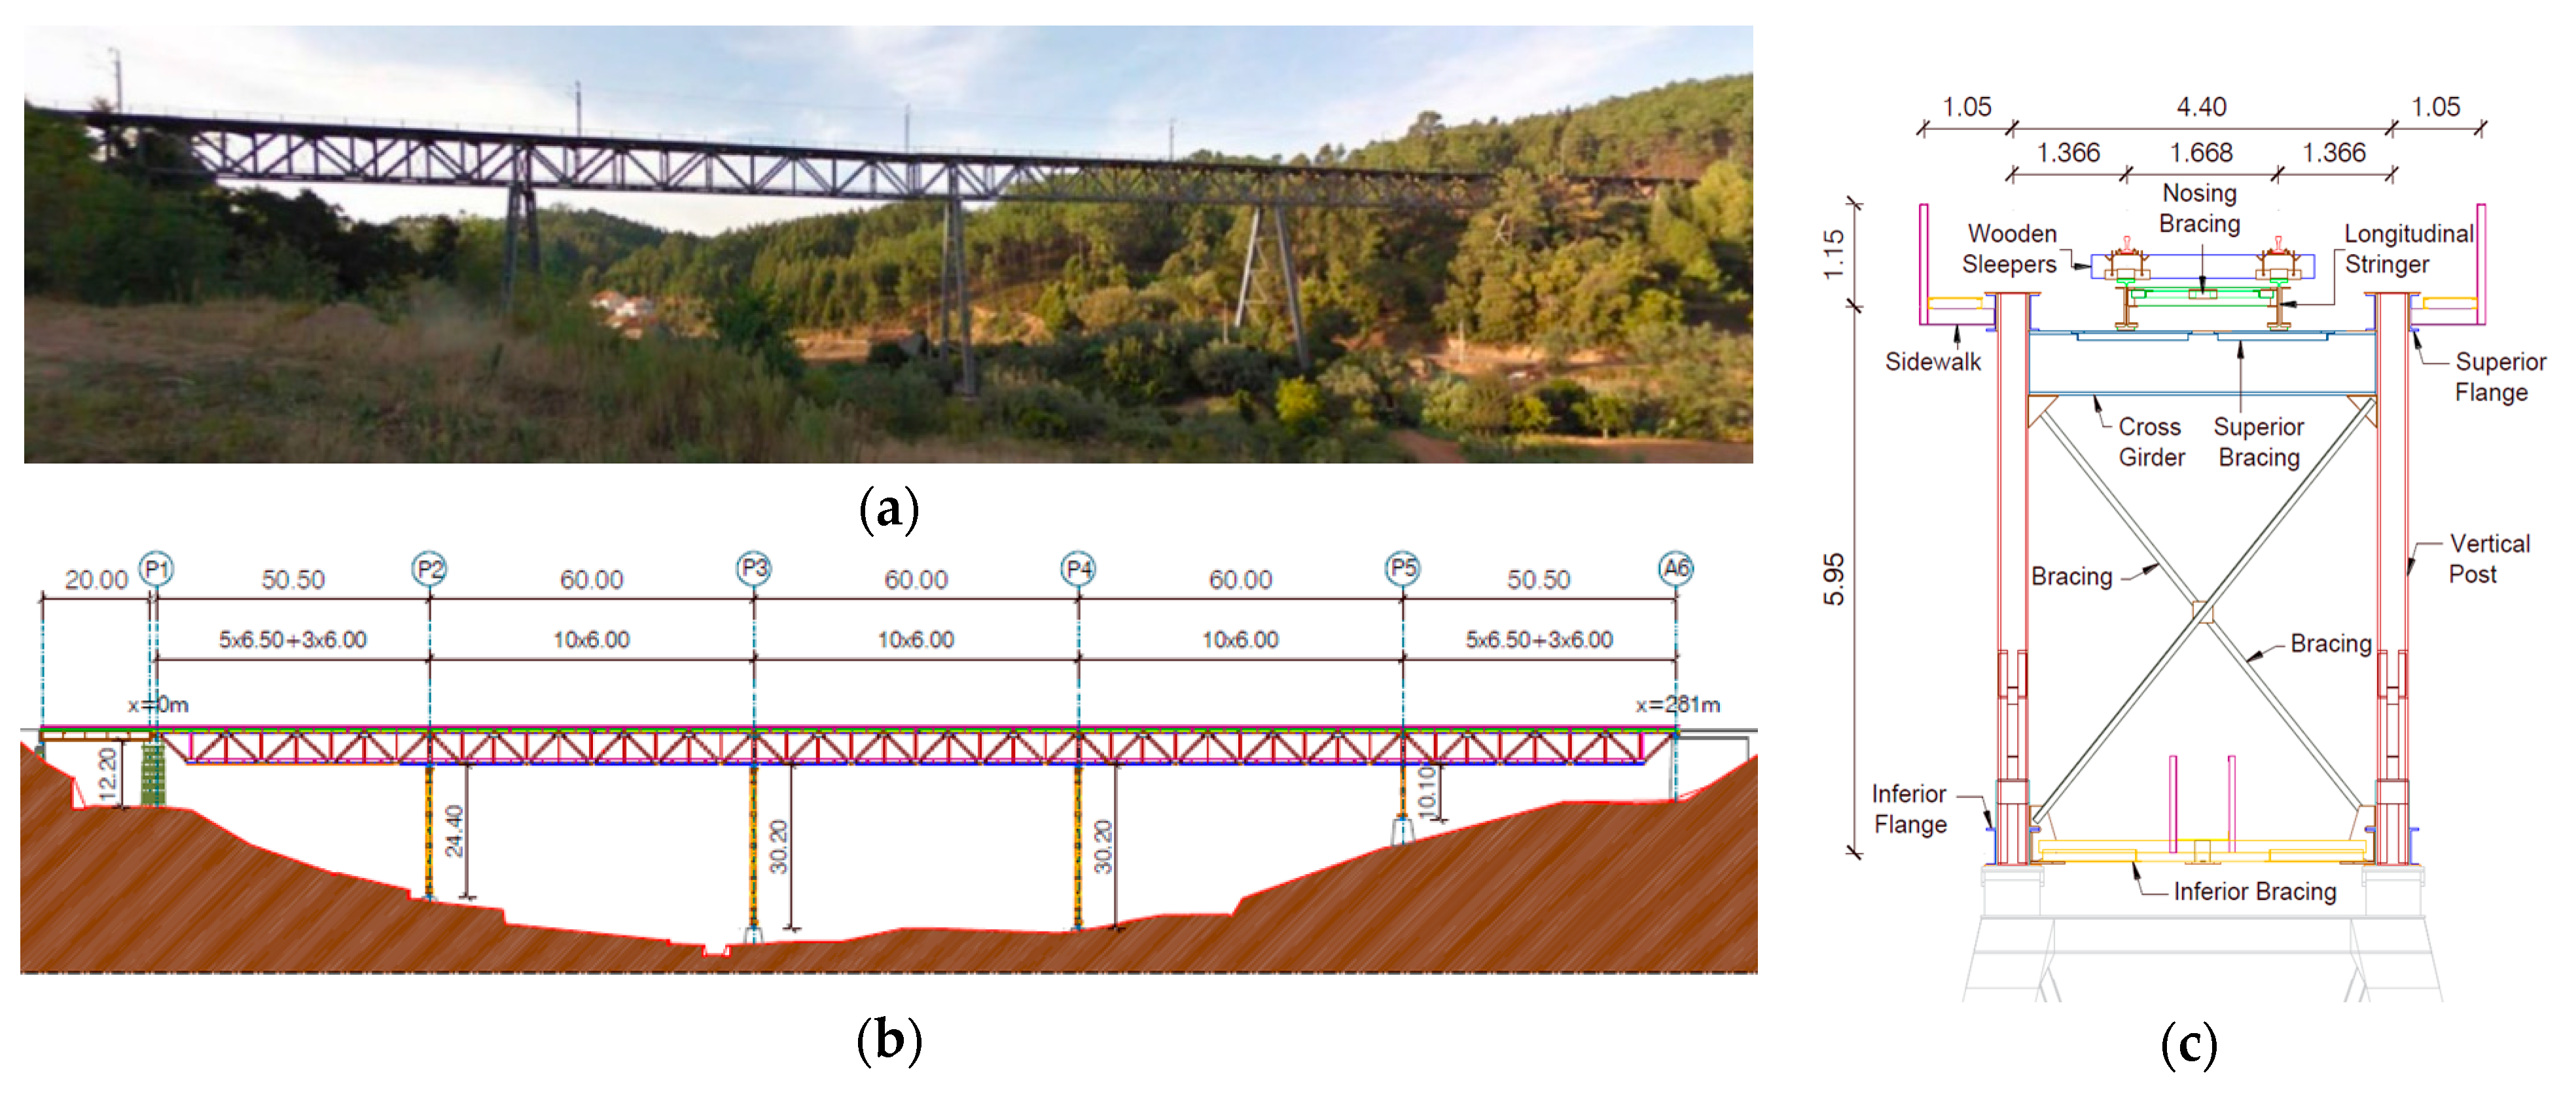
The bridge under study, named Várzea Bridge, is located in Aveiro district, Portugal, at km +59.478 along the Beira Alta international railway line (Figure 9). The bridge, constructed in 1958, is entirely steel, except for one of the columns and the abutments, which are of stone. The bridge’s main structure consists of five continuous spans of 50.5 + 50.5 + 60 × 3 + 50.5 and an additional simple supported span of 20 m at one end. The bridge also has four trapezoidal-shaped steel truss columns with heights ranging from 10.10 m to 30.20 m and a stone column with 12.20 m height (on the side of the additional simple supported span) and stone abutments.
The continuous deck is made up of two inverted warren trusses 5.95 m high and 4.40 m wide connected by transversal bracings at two levels, lower and upper, connecting the truss’s lower and upper chords, respectively, and a robust upper transversal girder at the edge of each truss panel which supports the longitudinal track girders. Regarding the cross sections and connections of the various components, the structure has both simple and composite section profiles, and the connections are generally riveted. The characterization of the main elements that compose the truss structure of the bridge and are the target of fatigue assessment is presented in Table 1.
The implementation of the proposed model and the results are presented in the next subchapters.

4.2. Fatigue Analysis System Implementation

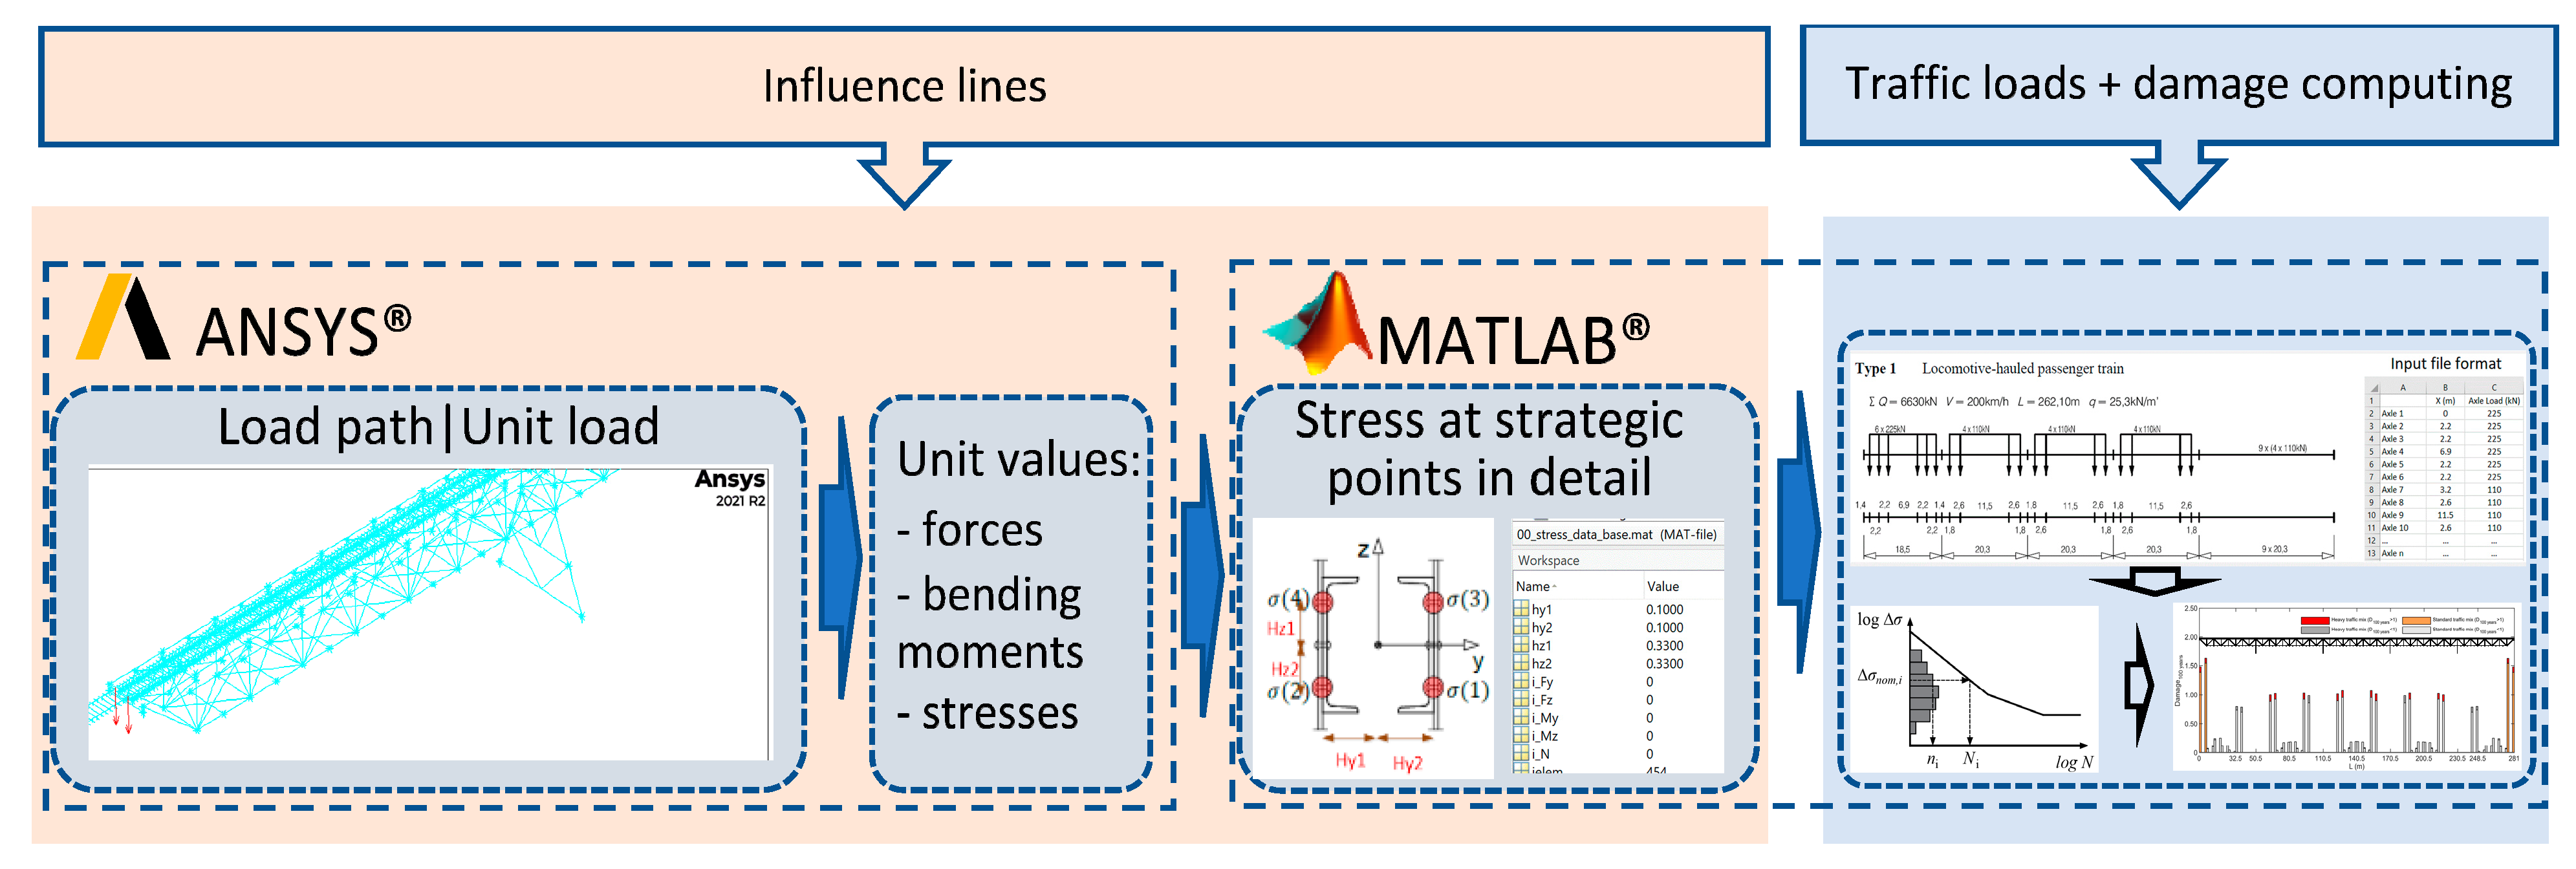
As described in Chapter 2, of the four phases that are part of a global fatigue analysis process, the one that integrates the proposed DT model is the second phase based on LDAM (see Figure 4). This FAS was modified to meet the scope of the proposed DT model. The details of such steps and the modifications implemented for this present case study are presented in Figure 10. The modifications (in the “standard FAS”) are fundamental to give new input conditions to the system regarding loads (traffic) and geometry. Thus, besides being a system that performs analyses (calculation of accumulated damage) for fixed conditions, it becomes flexible for various situations.
The above conditions’ implementation and automation are achieved through implementing routines via APDL and MATLAB® v2021a. In terms of analyses that lead to obtaining nominal stresses in connection details, given that the speeds of the trains traveling over the bridge under study do not exceed 200 km/h, according to EC1-2 [28], dynamic analysis was dispensed, and static analysis was carried out through the implementation of influence lines for determining internal forces, bending moments, and stresses (Figure 10 and Figure 11).
If it were a dynamic analysis, modal superposition would be the most efficient methodology (see Figure 10, and a more in-depth approach to the methodologies can also be found in previous studies [1,5]). The respective numerical model was based on finite elements implemented in the ANSYS® v.2021 software. Beam elements (BEAM 188) available in ANSYS APDL v.2021 [31] were used to design the model. This included the non-ballasted railway track, where the rail and wooden sleepers were also modeled using BEAM 188. Regarding the material properties (steel), two classes were considered depending on the type of metallic member: S355 (with yield strength, fy, equal to 355 MPa, Young’s modulus, E, of 210 GPa, density, ρ, of 7850 kg/m³, and Poisson’s ratio, ν, equal to 0.27) and S235, with all properties similar to the S355, except for the yield stress, fy, which is equal to 235 Mpa.
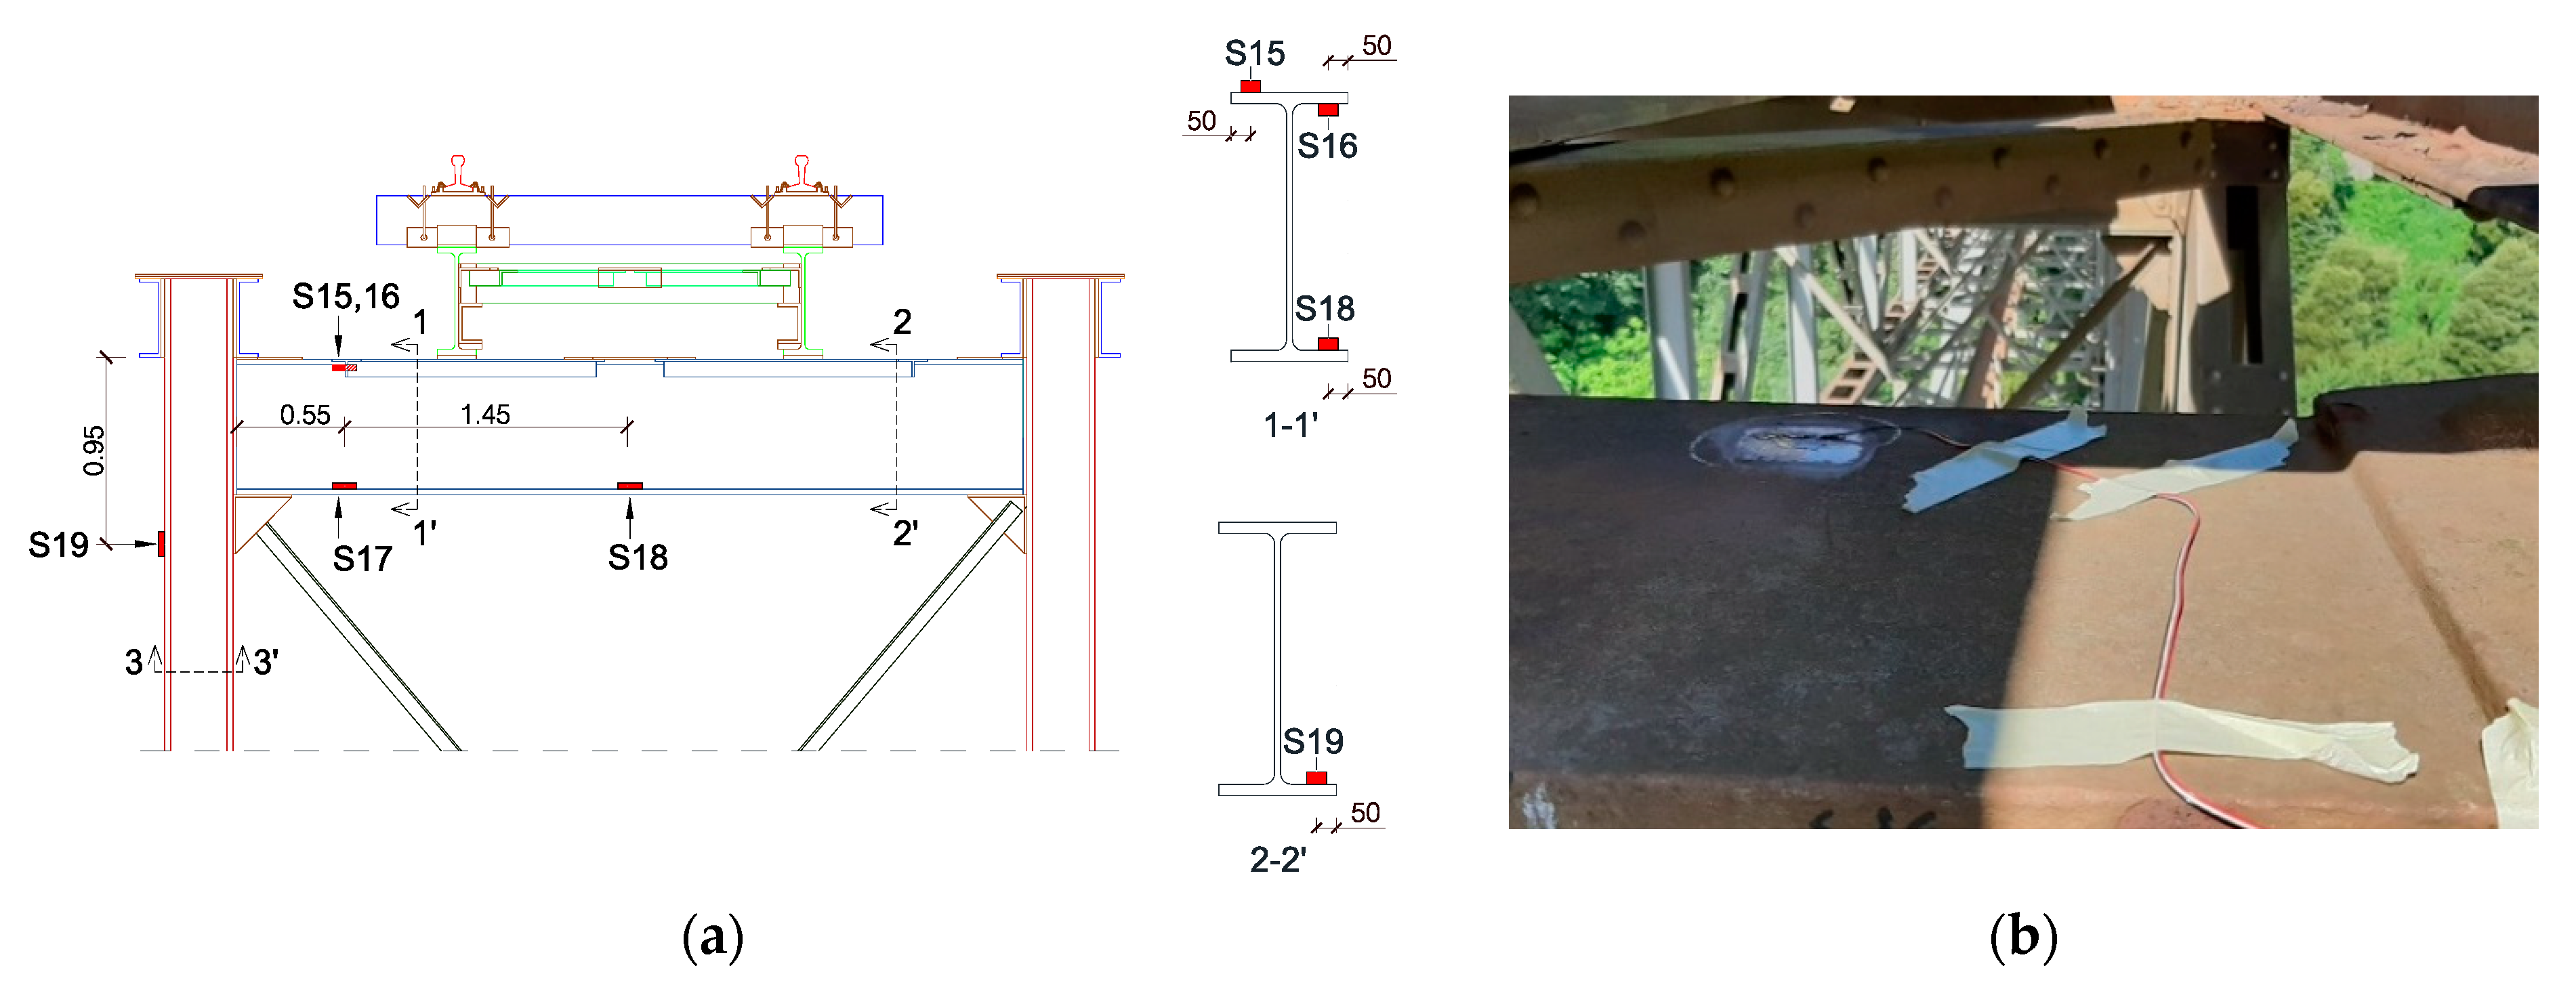
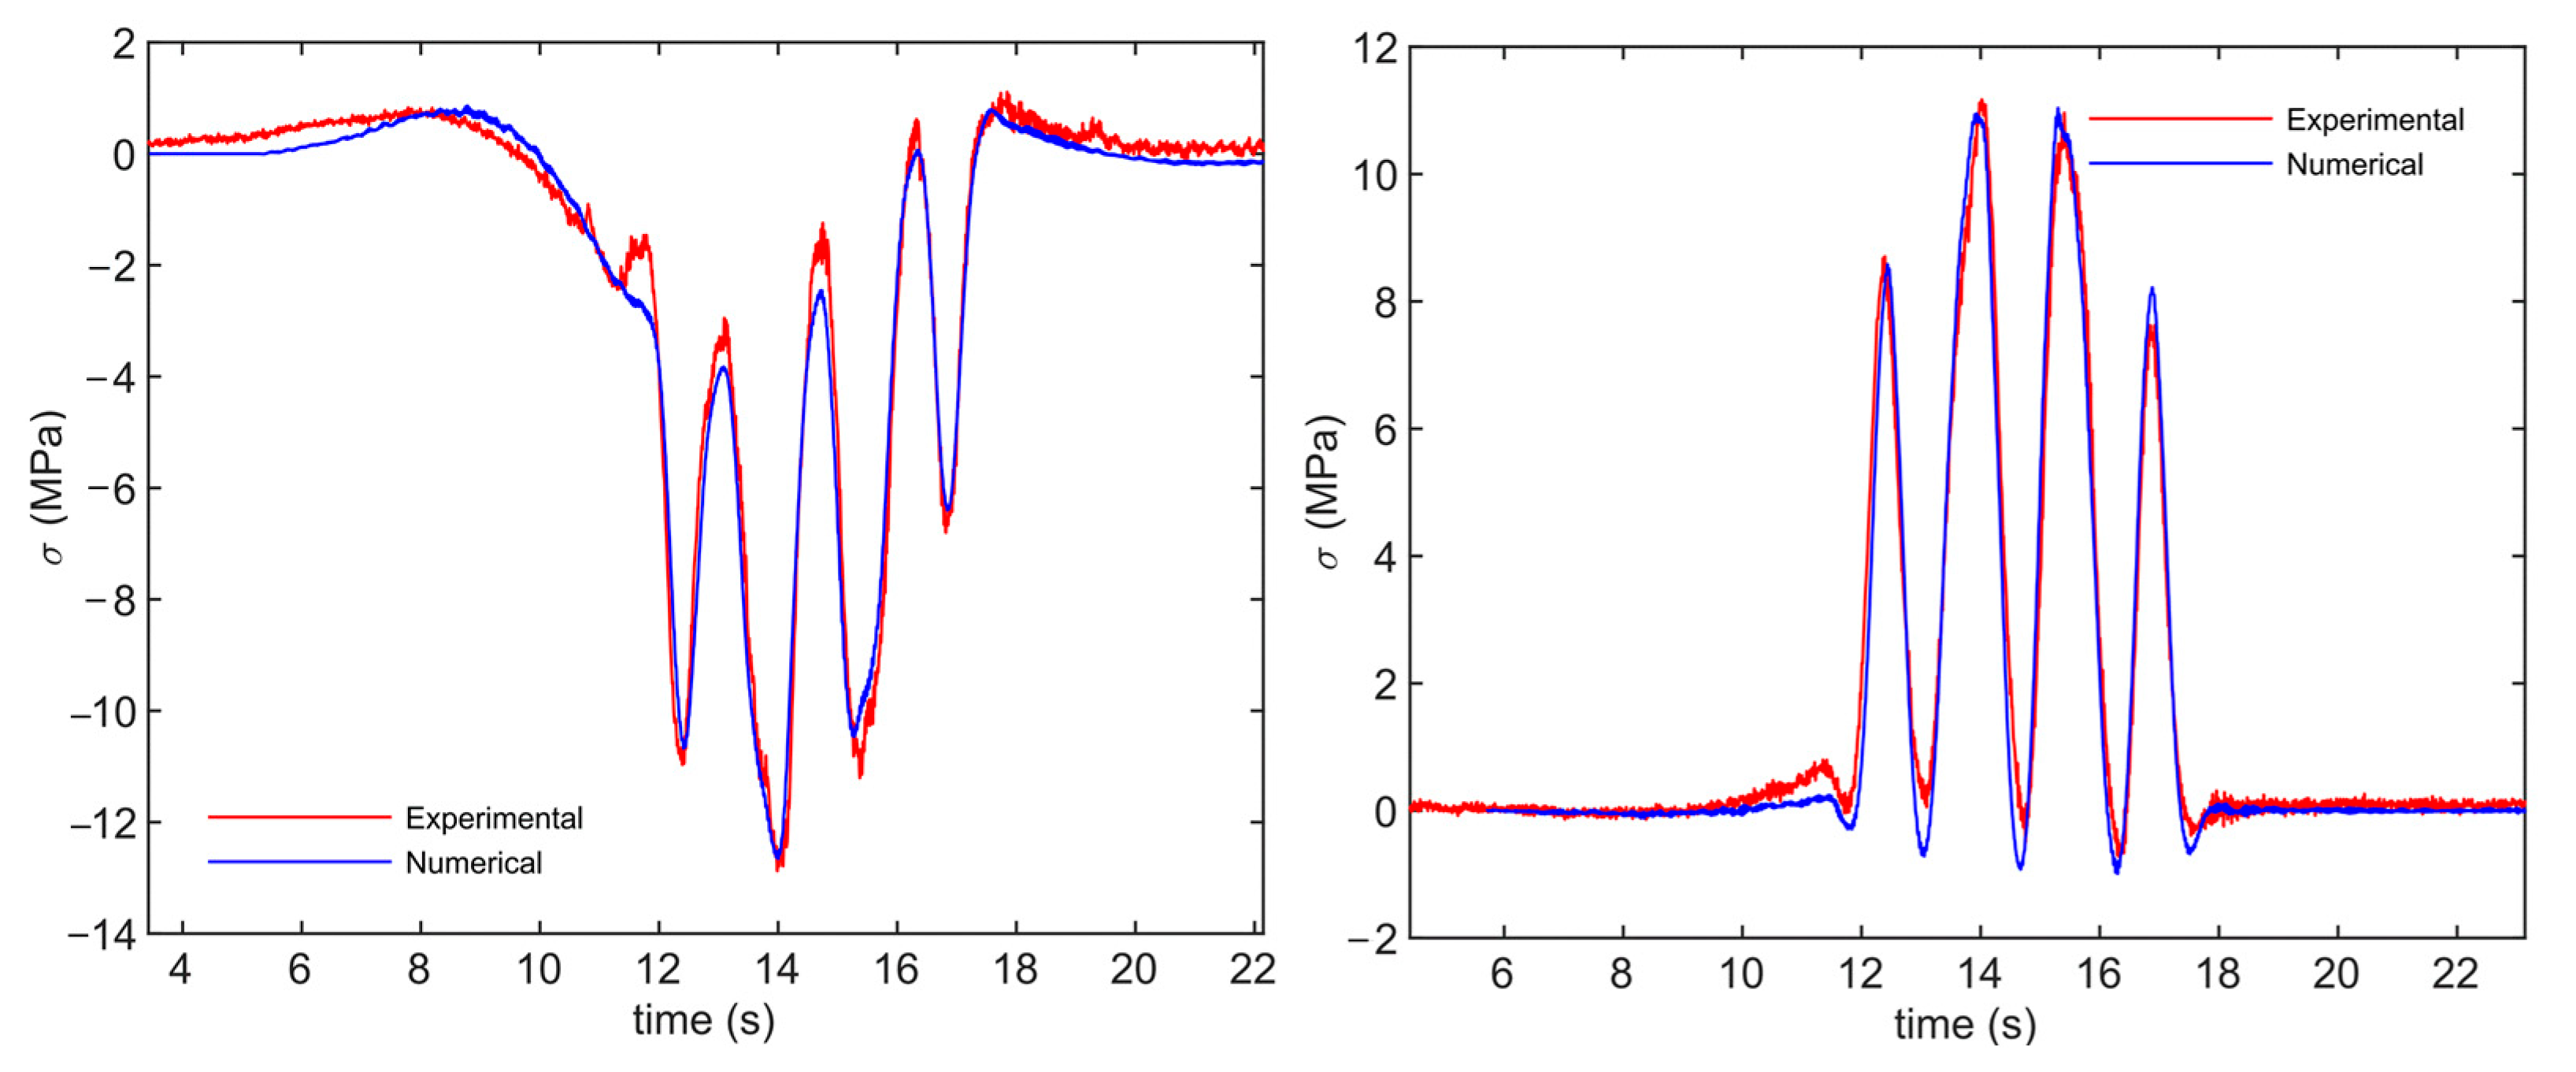
To validate the numerical model, which led to the computation of fatigue damage, and in the context of conducting a detailed analysis (not covered in this work), in addition to an ambient vibration test of the bridge, to obtain experimental vibration modes and frequencies and subsequent comparison with those obtained numerically (Table 2), a forced vibration campaign was conducted regarding the passage of a regular passenger train (composed of 12 axles with an average weight of 115 kN per axle) through the bridge, at a speed of 53 km/h. To this end, 14 strain gauges were installed to evaluate the stresses at locations of interest. Figure 12 [32] shows the position of four sensors that are part of this set and the installation process of one of these. Figure 13 [32] shows an overlap of numerical time history stress and experimental stresses in two of the four previously mentioned positions, calculated from strain values and considering a purely elastic material. As for the vibration modes, the numerical and experimental stress values show good agreement, which suggests that the model provides reliable and accurate results for stresses. For the vibration modes, the average percentage variation between the corresponding experimental and numerical frequencies (only for the frequencies presented here, out of a total of 28 obtained correspondences) is approximately 1.6%. A more in-depth discussion of this issue can be found in the previous study [32], which was solely concerned with the fatigue analysis of the same bridge.

4.3. Bridge BIM Model

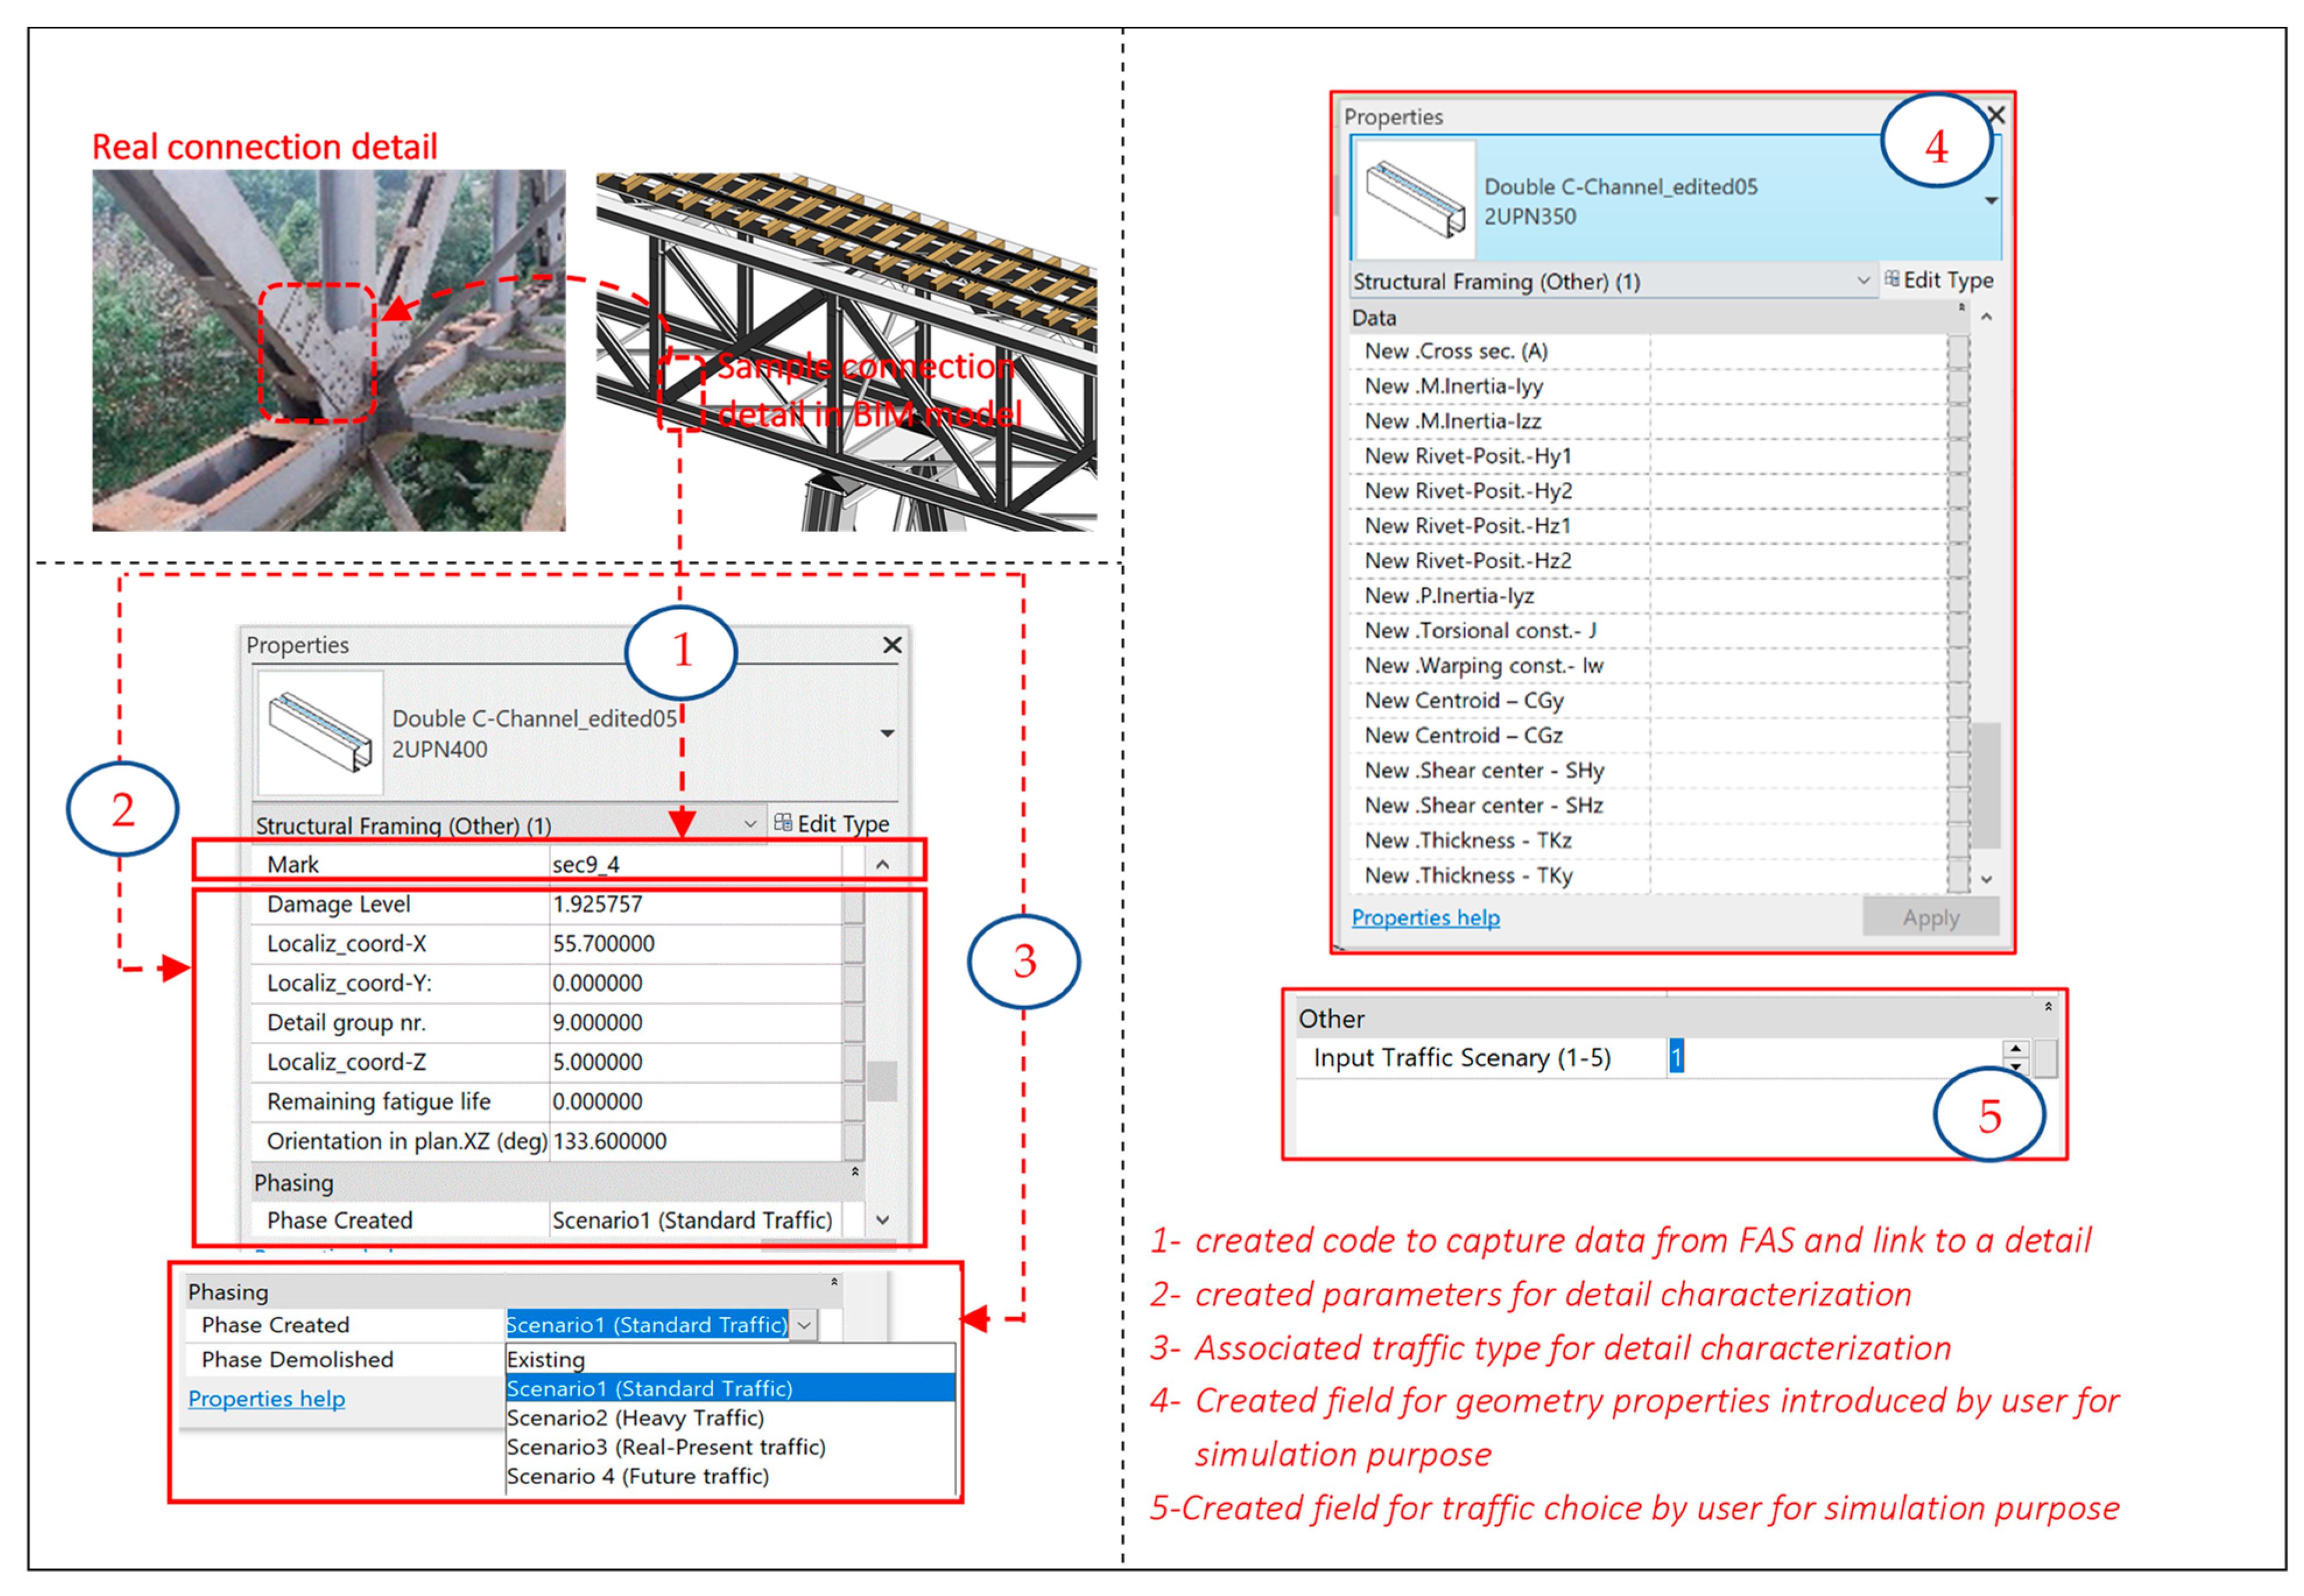
The BIM model of the bridge has been modeled using Autodesk REVIT® v.2021 software, for a LOD 300, based on existing 2D drawings (design and as-built drawings), a photographic survey, and other available information (Figure 14). After modeling, two main actions were taken: prepare the model to be embedded with fatigue data from FAS for fatigue evolution visualization and prepare an input field for the user to introduce information for simulation.
It was achieved by creating additional codes linked to the connection detail (to capture data from FAS) and parameters (to represent different fatigue data) (Figure 15).

4.4. Integrated Model: Sample Representation of Fatigue State

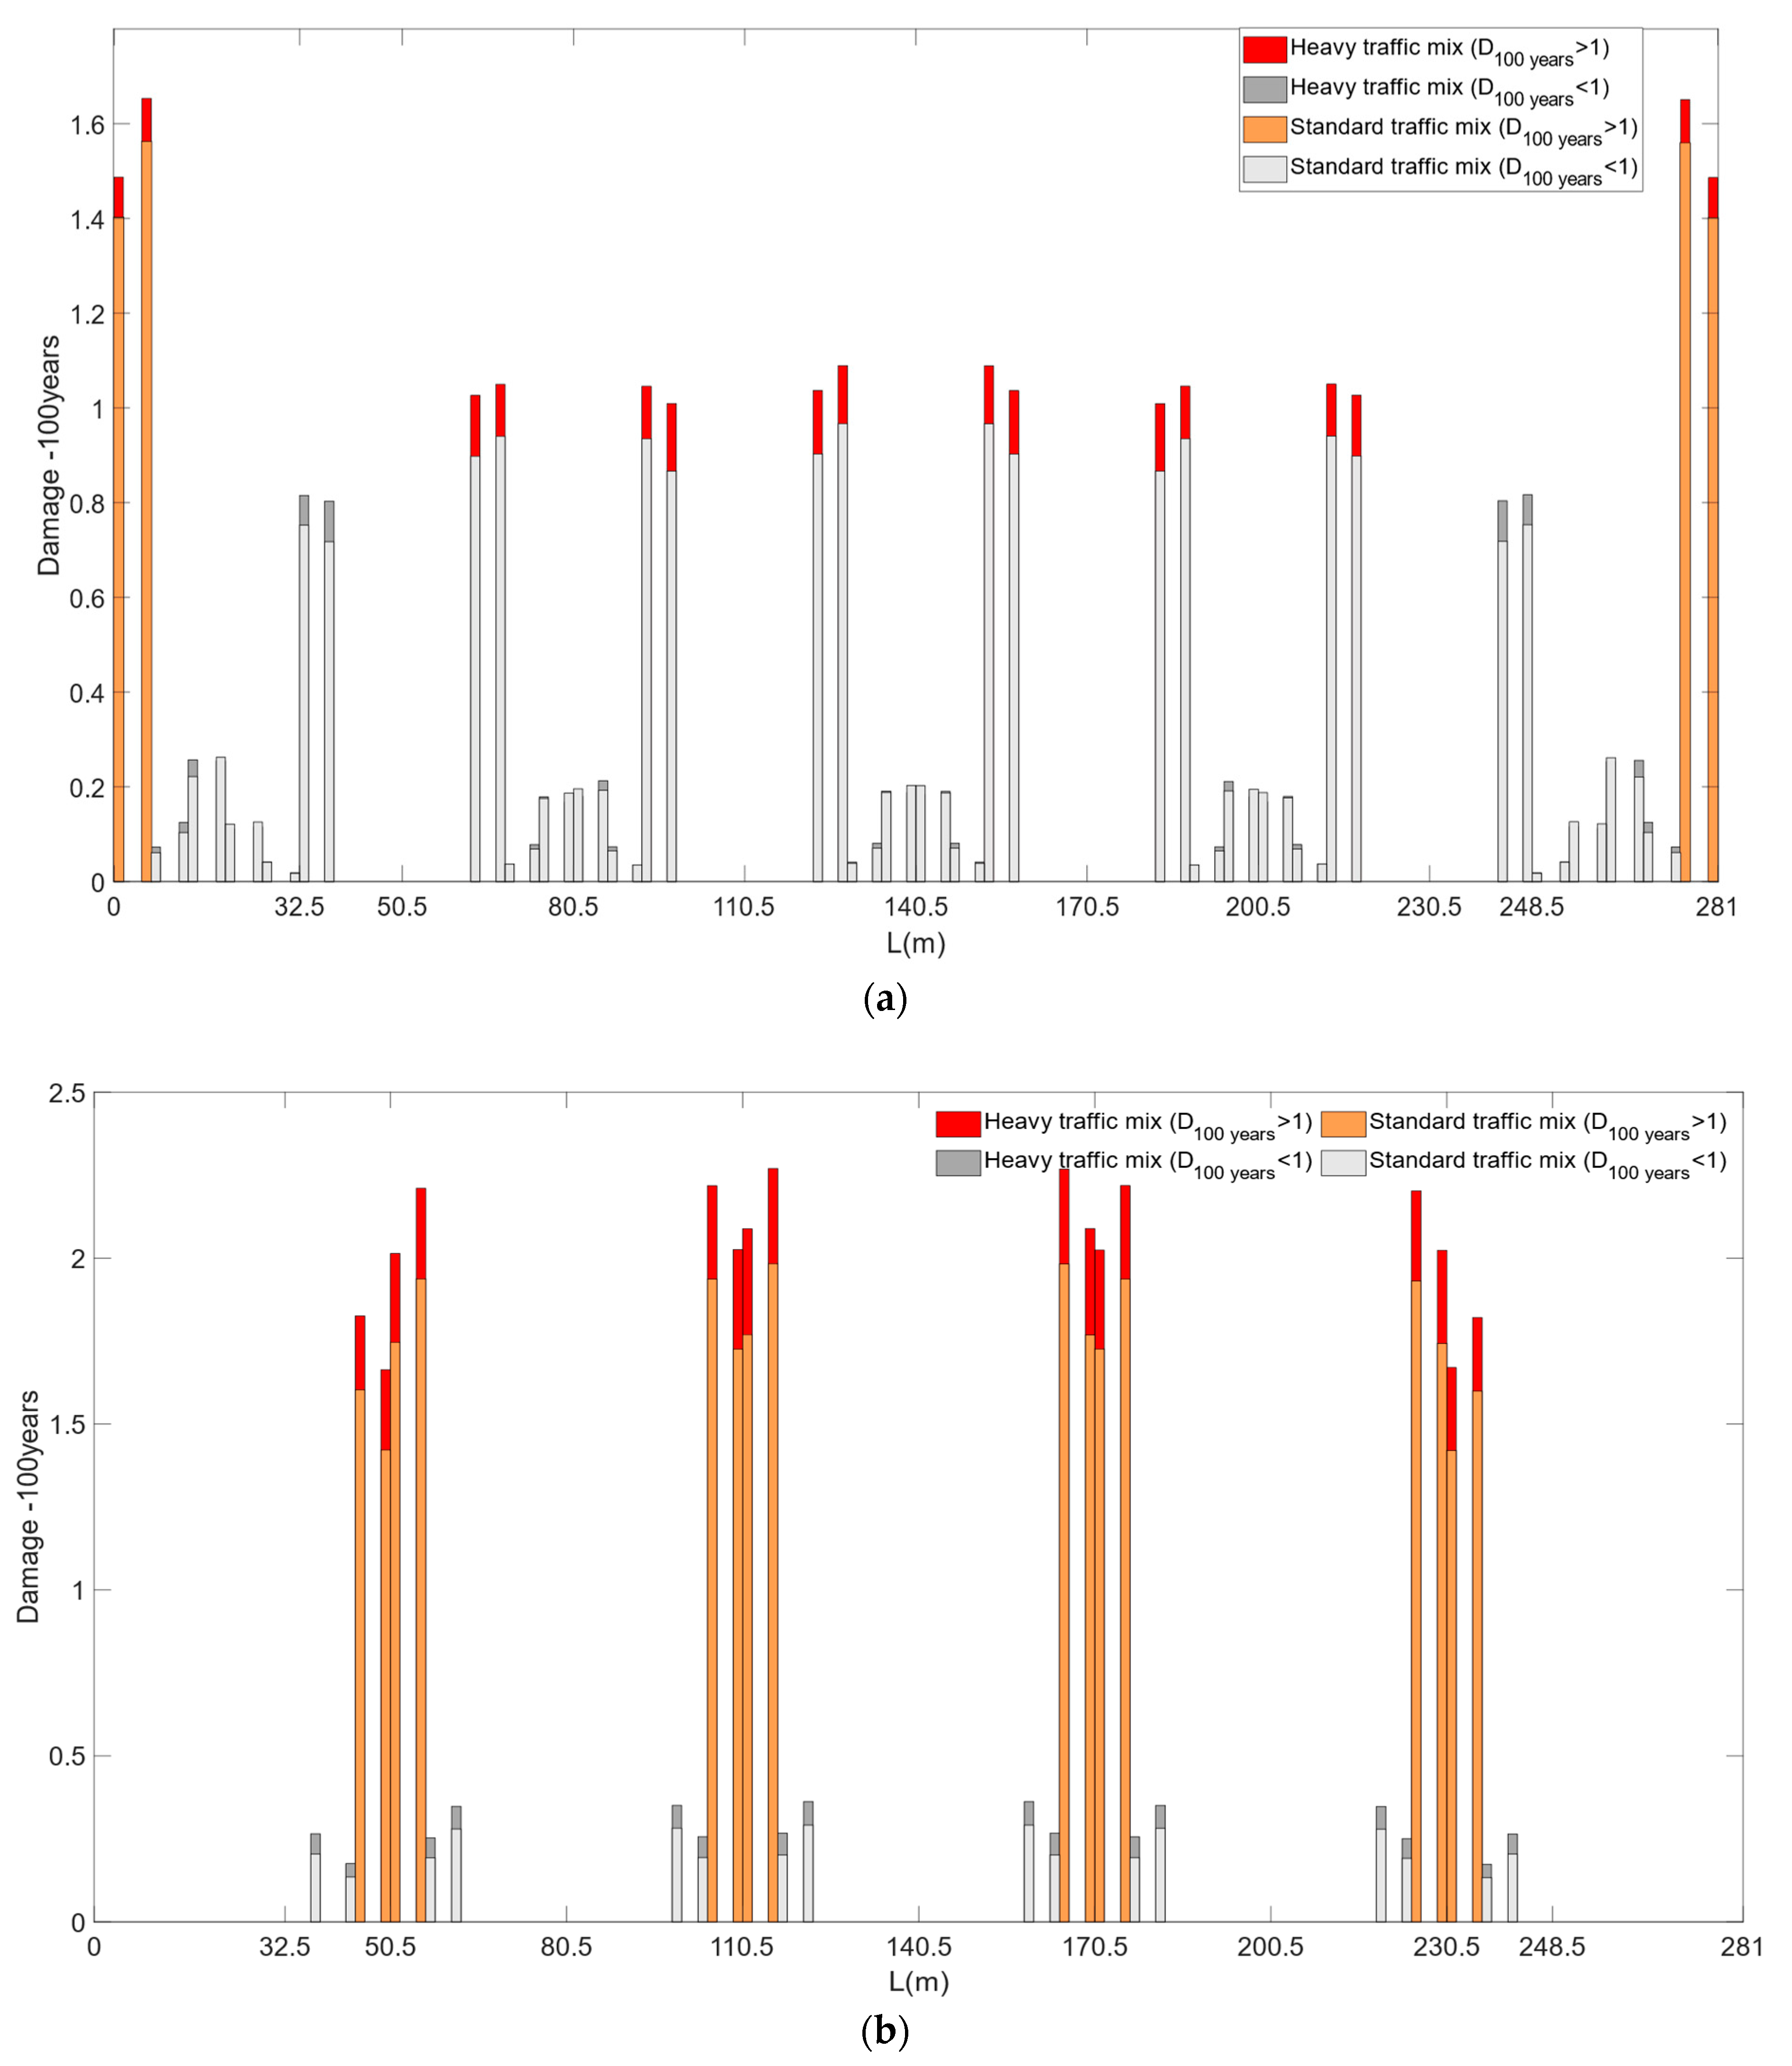
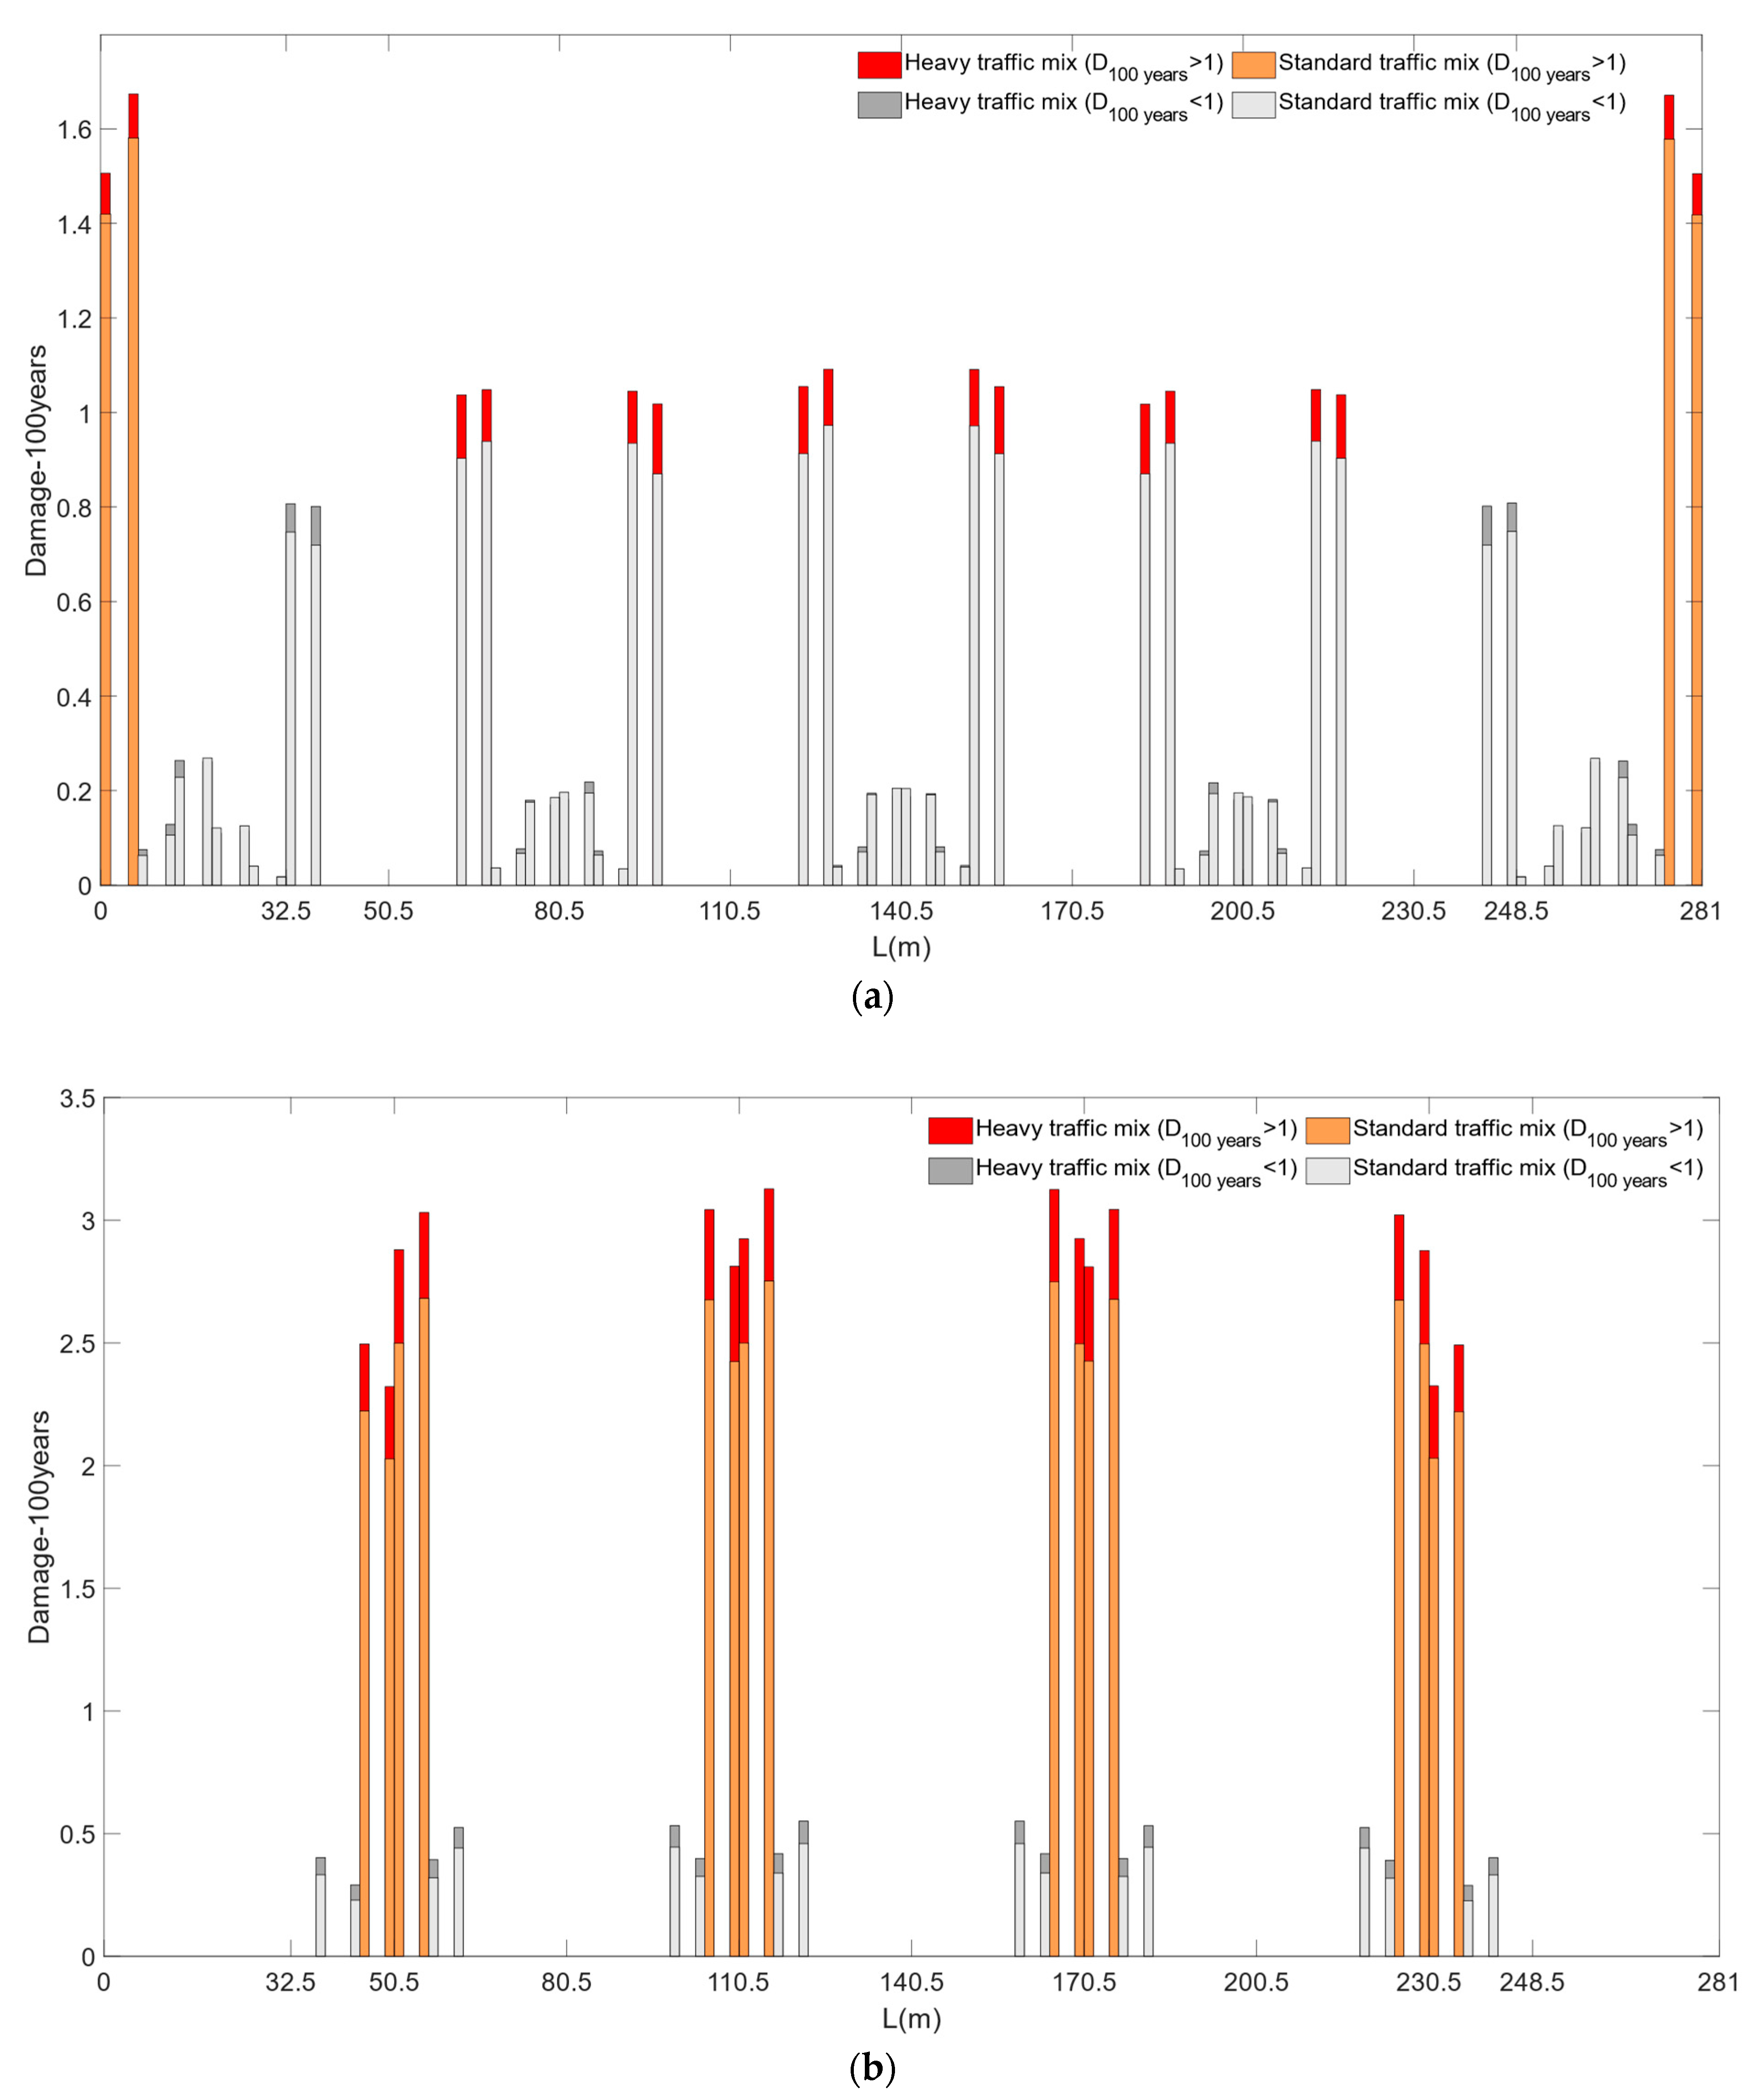
In this demonstration, four scenarios are studied to evaluate the fatigue state in the connections details of the main diagonals of the bridge truss structure (Figure 16, Figure 17, Figure 18 and Figure 19). The first two scenarios involve the use of standard traffic mix and heavy traffic mix, as specified in EC1-2 [28], with the geometric properties of the truss structure members shown in Table 1 (Figure 16 and Figure 17). The last two scenarios (Figure 18 and Figure 19) involve the use of standard traffic mix and heavy traffic mix again but with a change in geometrical properties, where the cross-section of the diagonals and vertical posts close to the columns are all replaced by the general ones (those along the spans). The accumulated damage levels are visualized analogous to finite element analysis (e.g., stress levels, deformation, etc.), with a color scale illustrating the damage variation, where a completely reddish color indicates higher damage levels. Following the principle of LDAM, the detail is considered non-critical when the accumulated damage is less than 1. The accumulated damage corresponds to a period of 100 years after the bridge’s construction, which in the case of the bridge under study (built-in 1958), would still take approximately 35 years to reach the service life. Details with a reddish tendency (D100 ≥ 1) suggest further investigation. A solid continuous beam (representing the whole bridge truss) was also idealized to provide a global view, allowing for more quick and global visualization of the diagonal detail state.
More localized information (including the extent of damage) can be observed and consulted in detail by clicking on it (see Figure 20).

5. Conclusions

This work addressed the development of a DT model to increase the flexibility of the fatigue evolution assessment process for railway steel bridges. For this purpose, a Fatigue Analysis System (FAS) and BIM modeling were combined. The FAS incorporates a numerical finite element part, implemented in ANSYS® v.2021 software, to obtain part of the input parameters for fatigue computation and the other function related to fatigue damage computation, based on the Linear Damage Accumulation Method (LEAM) proposed in the Eurocodes, and using MATLAB® v2021a software for its implementation. The Várzea bridge in Portugal was chosen for model implementation, and the connection details on the diagonals of the bridge truss structure were evaluated. Four scenarios involving the normative traffic specified in EC1-2 and changes to the geometric properties of some truss members were tested as part of this evaluation, expecting to evaluate more scenarios and involve other connections details within the scope of this ongoing research. The results achieved are promising, highlighting the following issues to improve the performance of fatigue assessment:
  • Development of a data flow scheme for interaction between the FAS and BIM model for fatigue evolution representation and visualization;
  • Creation of an open system that allows inputs related to various traffic conditions and geometric properties, resulting in an automatic representation of fatigue evolution;
  • Flexibilization in global fatigue evaluation through automatic mapping of fatigue evolution, allowing for a quick decision-making process regarding the need or not for advanced local analysis or inspection levels to be implemented.

Author Contributions

Conceptualization, I.A.N., N.-S.D. and C.S.H.; methodology, I.A.N. and C.S.H.; software, I.A.N. and C.H; validation, I.A.N. and C.S.H.; formal analysis, I.A.N.; investigation, I.A.N.; resources, I.A.N. and C.S.H.; data curation, I.A.N. and C.S.H.; writing—original draft preparation, I.A.N.; writing—review and editing, N.-S.D. and J.P.M.; visualization, I.A.N.; supervision, J.A.M. and R.C.; project administration, J.A.M. and R.C.; funding acquisition, N.-S.D., J.A.M. and RC. All authors have read and agreed to the published version of the manuscript.

Funding

This work was financially supported by: Base Funding—UIDB/04708/2020 of the CONSTRUCT—Institute of R&D In Structures and Construction—funded by national funds through the FCT/MCTES (PIDDAC) and by national funds through FCT—Fundação para a Ciência e a Tecnologia; SFRH/BD/151229/2021. This work was also carried out in the framework of Shift2Rail projects IN2TRACK3 [101012456- H2020-S2RJU-CFM-2020] for the development of a DT framework. This work is also co-funded by the European Social Fund (ESF) through the Northern Regional Operational Programme (Norte 2020) [Funding Reference: NORTE-06-3559-FSE-000176]; And was partly financed by FCT/MCTES through national funds (PIDDAC) under the R&D Unit Institute for Sustainability and Innovation in Structural Engineering (ISISE), under reference UIDB/04029/2020, and under the Associate Laboratory Advanced Production and Intelligent Systems ARISE under reference LA/P/0112/2020.

Institutional Review Board Statement

Not applicable.

Informed Consent Statement

Not applicable.

Data Availability Statement

The data presented in this study are available on request from the corresponding author. The data are not publicly available due to ethical and privacy concerns.

Acknowledgments

The authors would like to acknowledge ANI (“Agência Nacional de Inovação”) for the financial support given to the R&D Project “GOA Bridge Management System—Bridge Intelligence”, with reference POCI-01-0247-FEDER-069642, co-financed by European Regional Development Fund (FEDER) through Operational Competitiveness and Internationalization Program (POCI)”.

Conflicts of Interest

The authors declare no conflict of interest.

References

  1. Horas, C.S.; De Jesus, A.M.; Calçada, R. New multiphase methodology for fatigue damage screening of aging metallic railway bridges. Int. J. Fatigue 2023, 169, 107498. [Google Scholar] [CrossRef]
  2. Haghani, R.; Al-Emrani, M.; Heshmati, M. Fatigue-Prone Details in Steel Bridges. Buildings 2012, 2, 456–476. [Google Scholar] [CrossRef]
  3. Jiang, F.; Ding, Y.; Song, Y.; Geng, F.; Wang, Z. Digital Twin-driven framework for fatigue life prediction of steel bridges using a probabilistic multiscale model: Application to segmental orthotropic steel deck specimen. Eng. Struct. 2021, 241, 112461. [Google Scholar] [CrossRef]
  4. Jiang, F.; Ding, Y.; Song, Y.; Geng, F.; Wang, F. An architecture of lifecycle fatigue management of steel bridges driven by Digital Twin. Struct. Monit. Maint. 2021, 8, 187–201. [Google Scholar] [CrossRef]
  5. Horas, C.S.; De Jesus, A.M.; Calçada, R. Efficient progressive global-local fatigue assessment methodology for existing metallic railway bridges. J. Constr. Steel Res. 2022, 196, 107431. [Google Scholar] [CrossRef]
  6. Zhang, Y.; Zheng, K.; Heng, J.; Zhu, J. Corrosion-Fatigue Evaluation of Uncoated Weathering Steel Bridges. Appl. Sci. 2019, 9, 3461. [Google Scholar] [CrossRef]
  7. CEN. Eurocode 3: Design of Steel Structures, Part 1–9: Fatigue; Instituto Português da Qualidade (IPQ): Lisbon, Portugal, 2010. [Google Scholar]
  8. Errandonea, I.; Beltrán, S.; Arrizabalaga, S. Digital Twin for maintenance: A literature review. Comput. Ind. 2020, 123, 103316. [Google Scholar] [CrossRef]
  9. Naderi, H.; Shojaei, A. Digital twinning of civil infrastructures: Current state of model architectures, interoperability solutions, and future prospects. Autom. Constr. 2023, 149, 104785. [Google Scholar] [CrossRef]
  10. Honghong, S.; Gang, Y.; Haijiang, L.; Tian, Z.; Annan, J. Digital twin enhanced BIM to shape full life cycle digital transformation for bridge engineering. Autom. Constr. 2023, 147, 104736. [Google Scholar] [CrossRef]
  11. Boje, C.; Guerriero, A.; Kubicki, S.; Rezgui, Y. Towards a semantic Construction Digital Twin: Directions for future research. Autom. Constr. 2020, 114, 103179. [Google Scholar] [CrossRef]
  12. Jiang, F.; Ma, L.; Broyd, T.; Chen, K. Digital twin and its implementations in the civil engineering sector. Autom. Constr. 2021, 130, 103838. [Google Scholar] [CrossRef]
  13. Gao, Y.; Qian, S.; Li, Z.; Wang, P.; Wang, F.; He, Q. Digital Twin and Its Application in Transportation Infrastructure. In Proceedings of the 2021 IEEE 1st International Conference on Digital Twins and Parallel Intelligence (DTPI), Beijing, China, 15 July–15 August 2021. [Google Scholar]
  14. Pan, Y.; Zhang, L. A BIM-data mining integrated digital twin framework for advanced project management. Autom. Constr. 2021, 124, 103564. [Google Scholar] [CrossRef]
  15. Grieves, M. Digital twin: Manufacturing excellence through virtual factory replication. White Pap. 2014, 1, 1–7. [Google Scholar]
  16. Ye, C.; Butler, L.; Bartek, C.; Iangurazov, M.; Lu, Q.; Gregory, A.; Girolami, C. A Digital Twin of Bridges for Structural Health Monitoring. In Proceedings of the 12th International Workshop on Structural Health Monitoring 2019, Stanford, CA, USA, 10–12 September 2019; DEStech Publications, Inc.: Lancaster, UK. [Google Scholar]
  17. Wenner, M.; Meyer-Westphal, M.; Herbrand, M.; Ullerich, C. The concept of digital twin to revolutionise infrastructure maintenance: The pilot project smartBRIDGE Hamburg. In Proceedings of the 27th ITS world congress, Hamburg, Germany, 11–15 October 2021. [Google Scholar]
  18. Qi, Q.; Tao, F.; Hu, T.; Anwer, N.; Liu, A.; Wei, Y.; Wang, L.; Nee, A. Enabling technologies and tools for digital twin. J. Manuf. Syst. 2019, 58, 3–21. [Google Scholar] [CrossRef]
  19. Dang, N.; Shim, C. Bridge assessment for PSC Girder Bridge using Digital Twins Model. In CIGOS 2019, Innovation for Sustainable Infrastructure. Lecture Notes in Civil Engineering, vol 54; Springer: Singapore, 2020; pp. 1241–1246. [Google Scholar] [CrossRef]
  20. Shim, C.-S.; Dang, N.-S.; Lon, S.; Jeon, C.-H. Development of a bridge maintenance system for prestressed concrete bridges using 3D digital twin model. Struct. Infrastruct. Eng. 2019, 15, 1319–1332. [Google Scholar] [CrossRef]
  21. Kaewunruen, S.; Sresakoolchai, J.; Ma, W.; Phil-Ebosie, O. Digital Twin Aided Vulnerability Assessment and Risk-Based Maintenance Planning of Bridge Infrastructures Exposed to Extreme Conditions. Sustainability 2021, 13, 2051. [Google Scholar] [CrossRef]
  22. Kaewunruen, S.; AbdelHadi, M.; Kongpuang, M.; Pansuk, W.; Remennikov, A.M. Digital Twins for Managing Railway Bridge Maintenance, Resilience, and Climate Change Adaptation. Sensors 2022, 23, 252. [Google Scholar] [CrossRef]
  23. Tao, F.; Xiao, B.; Qi, Q.; Cheng, J.; Ji, P. Digital twin modeling. J. Manuf. Syst. 2022, 64, 372–389. [Google Scholar] [CrossRef]
  24. Yu, S.; Li, D.; Ou, J. Digital twin-based structure health hybrid monitoring and fatigue evaluation of orthotropic steel deck in cable-stayed bridge. Struct. Control. Heal. Monit. 2022, 29, e2976. [Google Scholar] [CrossRef]
  25. Ye, X.W.; Su, Y.H.; Han, J.P. A State-of-the-Art Review on Fatigue Life Assessment of Steel Bridges. Math. Probl. Eng. 2014, 2014, 1–13. [Google Scholar] [CrossRef]
  26. Horas, C.S. Integrated Methodology for Fatigue Life Prediction of Existing Metallic Railway Bridges; Faculty of Engineering, University of Porto: Porto, Portugal, 2021. [Google Scholar]
  27. Bannantine, J.A.; Handrock, J.L.; Comer, J.J. Fundamentals of Metal Fatigue Analysis; Prentice Hall: Hoboken, NJ, USA, 1990. [Google Scholar]
  28. CEN. Eurocode 1: Actions on structures. Part 2: Traffic Loads on Bridges; European Committee for Standardization (CEN): Brussels, Belgium, 2003. [Google Scholar]
  29. Horas, C.S.; De Jesus, A.M.P.; Calçada, R. Integrated Methodology for Fatigue Assessment of Existing Metallic Railway Bridges. In Proceedings of the Fifth International Conference on Railway Technology: Research, Development and Maintenance, Montpellier, France, 22–25 August 2022. [Google Scholar]
  30. Dang, N.-S.; Rho, G.-T.; Shim, C.-S. A Master Digital Model for Suspension Bridges. Appl. Sci. 2020, 10, 7666. [Google Scholar] [CrossRef]
  31. ANSYS, I. ANSYS Mechanical APDL Element Reference; ANSYS Inc.: Canonsburg, PA, USA, 2017. [Google Scholar]
  32. Horas, C.S.; De Jesus, A.M.; Ribeiro, D.; Calçada, R. Efficient multiscale methodology for local stress analysis of metallic railway bridges based on modal superposition principles. Eng. Fail. Anal. 2022, 138, 106391. [Google Scholar] [CrossRef]
Figure 1. Example of a parametric flowchart for parametric modeling of pre-stressed concrete (PSC) bridge.
Applsci 13 06741 g001
Figure 2. Concept of the proposed DT model.
Applsci 13 06741 g002
Figure 3. Fatigue analysis for RSBs according to the Eurocodes.
Applsci 13 06741 g003
Figure 4. Fatigue Analysis System (FAS) adopted for proposed DT model (adapted from [1,26]).
Applsci 13 06741 g004
Figure 5. Fatigue example of conversion and coding of connection details for data flow.
Applsci 13 06741 g005
Figure 6. Example of conversion and coding of connection details for data flow.
Applsci 13 06741 g006
Figure 7. Integrated data flow for the proposed DT model.
Applsci 13 06741 g007
Figure 8. Data-flow concept.
Applsci 13 06741 g008
Figure 9. Várzea Bridge: (a) overview of the bridge; (b) elevation view of the bridge; (c) general bridge section.
Applsci 13 06741 g009
Figure 10. Implemented FAS to reach the proposed digital twin.
Applsci 13 06741 g010
Figure 11. General scheme implemented for calculating fatigue damage via static analysis.
Applsci 13 06741 g011
Figure 12. Part of strain gauges installed in experimental campaign; (a) strain gauges on the cross-sections close to column, at position x = 104.5 m; (b) installation process.
Applsci 13 06741 g012
Figure 13. Stress comparison between experimental and numerical results (shell refinement).
Applsci 13 06741 g013
Figure 14. Three-dimensional model of the bridge developed using Autodesk REVIT® v.2021.
Applsci 13 06741 g014
Figure 15. Additional parameters created to characterize the fatigue state in the connection detail and simulation fields.
Applsci 13 06741 g015
Figure 16. Fatigue damage results in the details located at diagonals of the bridge truss for scenarios 1 and 2: (a) diagonals along the spans and (b) diagonals close to columns.
Applsci 13 06741 g016
Figure 17. Automatic fatigue damage visualization in the details located at diagonals of the bridge truss for scenarios 1 and 2: (a) scenario 1 (use of standard traffic mix) and (b) scenario 2 (use of heavy traffic mix).
Applsci 13 06741 g017
Figure 18. Fatigue damage results in the details located at diagonals of the bridge truss for scenarios 3 and 4: (a) diagonals along the spans and (b) diagonals close to columns.
Applsci 13 06741 g018
Figure 19. Automatic fatigue damage visualization in the details located at diagonals of the bridge truss for scenarios 3 and 4: (a) scenario 3 (use of standard traffic mix) and (b) scenario 4 (use of heavy traffic mix).
Applsci 13 06741 g019
Figure 20. Example of information check at a connection detail.
Applsci 13 06741 g020
Table 1. Main members of the bridge truss structure and characterization of the respective cross-sections.
MemberDesignation of Corresponding Connection Detail in FASCross Section
Inferior flangessec 1 (general section)2 UPN400 + 13 mm flangeApplsci 13 06741 i001
sec 2 (close to intermediate columns)2 UPN400 + 20 mm flangeApplsci 13 06741 i002
Diagonalssec 3 (general section)2 UPN350Applsci 13 06741 i003
sec 9 (close to intermediate columns)2 UPN400Applsci 13 06741 i004
Vertical postssec 4 (general section)(297 × 18) × (348 × 10.5) mmApplsci 13 06741 i005
sec 10 (close to intermediate columns)560 × 30) × (348 × 25) mmApplsci 13 06741 i006
Cross- girderssec 5(688 × 28) × (297 × 15) mmApplsci 13 06741 i007
Superior flangessec 82 UPN400 + 12 mm flangeApplsci 13 06741 i008
Table 2. Comparison of experimental and numerical frequencies for numerical model validation (three modes out of a total of 28 determined vibration modes).
Global Mode No.Deformation Shape f (%)
1
(Transversal, yy direction)
Applsci 13 06741 i009
fnum = 2.1100 Hz
1.627
Applsci 13 06741 i010
fexp = 2.129 Hz
5
(Vertical, zz direction)
Applsci 13 06741 i011
fnum = 3.7467 Hz
Applsci 13 06741 i012
fexp = 3.810 Hz
7
(Torsion, yy & zz direction)
Applsci 13 06741 i013
fnum = 4.7730 Hz
Applsci 13 06741 i014
fexp = 4.665 Hz
Disclaimer/Publisher’s Note: The statements, opinions and data contained in all publications are solely those of the individual author(s) and contributor(s) and not of MDPI and/or the editor(s). MDPI and/or the editor(s) disclaim responsibility for any injury to people or property resulting from any ideas, methods, instructions or products referred to in the content.