Article

A New Approach to Production Process Capability Assessment for Non-Normal Data

1
Faculty of Security, Logistics and Management, Military University of Technology, ul. gen. Sylwestra Kaliskiego 2, 00-908 Warszawa, Poland
2
Faculty of Management, Lublin University of Technology, Nadbystrzycka 38, 20-618 Lublin, Poland
3
Faculty of Mechanical Engineering and Aeronautics, Rzeszow University of Technology, al. Powstańców Warszawy 8, 35-959 Rzeszow, Poland
*
Author to whom correspondence should be addressed.
Appl. Sci. 2023, 13(11), 6721; https://doi.org/10.3390/app13116721
Submission received: 11 May 2023 / Revised: 28 May 2023 / Accepted: 30 May 2023 / Published: 31 May 2023
(This article belongs to the Special Issue Innovative Insights into Sustainable Manufacturing Technologies)

Abstract

:
The process quality capability indicators Cp and Cpk are widely used to measure process capability. Traditional metric estimation methods require process data to be explicit and normally distributed. Often, the actual data obtained from the production process regarding the measurements of quality features are incomplete and do not have a normal distribution. This means that the use of traditional methods of estimating Cp and Cpk indicators may lead to erroneous results. Moreover, in the case of qualitative characteristics where a two-sided tolerance limit is specified, it should not be very difficult. The problem arises when the data do not meet the postulate of normality distribution and/or a one-sided tolerance limit has been defined for the process. Therefore, the purpose of this article was to present the possibility of using the Six Sigma method in relation to numerical data that do not meet the postulate of normality of distribution. The paper proposes a power transformation method using multiple-criteria decision analysis (MCDA) for the asymmetry coefficient and kurtosis coefficient. The task was to minimize the Jarque–Bera statistic, which we used to test the normality of the distribution. An appropriate methodology was developed for this purpose and presented on an empirical example. In addition, for the variable after transformation, for which the one-sided tolerance limit was determined, selected process quality evaluation indices were calculated.

1. Introduction

Six Sigma is a method of managing organizations with the goal of striving for excellence. This method evolved from the Total Quality Management (TQM) theory and is seen as the most modern stage in the evolution of quality management [1,2]. It is defined as a management system that aims to improve process efficiency and reduce defects [3,4]. It is a business strategy enabling identification and later elimination of the causes of problems, errors or anything that can lead to customer dissatisfaction. Numerous scientific considerations indicate that Six Sigma implementation is an effective way to improve processes and reduce costs, contributing to significantly better results [5].
The origins of Six Sigma date back to the 1980s. Its forerunner was Motorola, and the premise was to reduce the number of errors in the manufacturing process and the cost of poor-quality products, which at the time accounted for 15–20% of revenue from all sales [6,7]. The low efficiency of production processes and the high proportion of products that did not meet customer requirements required radical changes. Since then, Six Sigma methodology has been successfully applied in a multitude of organizations, primarily in the production industry, to improve customer satisfaction, reduce costs and increase productivity and competitiveness. It is used by large corporations such as Sony, Texas Instruments, Honeywell, Kodak, Allied Signal, Du Pont, Boeing and General Electric [8,9,10]. Its effectiveness caused its rapid spread into other areas and industries as well. It is implemented for a number of business processes, products and services.
It is used, for example, in the medical industry, primarily to improve patient treatment results, reduce medical errors and increase the efficiency of the treatment process [11,12]. It is used to improve the quality of healthcare services by identifying factors that contribute to patient satisfaction, including in the administrative area [10,13,14]. It is used in areas such as pharmaceutics, internal logistics, equipment maintenance and medical records [15,16].
It has been successfully employed in the field of education to improve the methods used by improving the process of designing, developing and implementing curricula and conducting courses to ensure the desired learning outcomes. Six Sigma can be used to improve student achievements by identifying factors that contribute to their potential success, measuring the effectiveness of teaching methods and implementing strategies to improve results. It also promotes the streamlining of administrative processes, such as registration, recruitment, and financial assistance. Identifying inefficiencies in these areas allows the development of strategies, reducing errors and increasing productivity [14,17]. Six Sigma can be used to improve business processes, reduce costs and increase customer satisfaction in the financial industry. The method can be used to identify and eliminate inefficiencies in financial processes, improve compliance and ensure standards in accordance with requirements governing financial practices or profitability [18,19,20].
Six Sigma can be used to improve quality and increase efficiency in almost any process, including telecommunications (identifying and eliminating the source of network failures, reducing customer complaints and optimizing network capacity [21,22]), in logistics (streamlining supply chain processes, reducing errors and increasing efficiency, reducing lead times and improving delivery performance [23,24]) or in the service sector (improving service quality, reducing customer complaints, optimizing service delivery processes and increasing efficiency). This practice has been successfully used, for example, in the hotel industry [13,25,26], retail [27,28] and banking [29,30]. The multitude of applications shows that there is a need to develop and improve the method itself as well, so that its application is also possible for less typical enterprises or processes whose characteristics differ from the classic assumptions of the method.
Six Sigma projects typically involve an interdisciplinary team of employees [31,32] who work together to identify and resolve process inefficiencies, eliminate waste and improve quality. Six Sigma methodology is based on decision-making using data extracted from the process, its statistical analysis and continuous improvement. It can be used in two varieties: DMAIC (an acronym from the first letters of the words Define—Measure—Analyze—Improve—Control), which aims to improve the performance of business processes and will be discussed in more detail below, and DMADV (an acronym from the first letters of the words Define—Measure—Analyze—Design—Verify), to design new objects [33,34,35].
The DMAIC methodology involves a structured approach with five phases: defining, measuring, analyzing, improving and control. Defining the problem is the first and crucial step for the success of the project. It requires defining the relevant issue for the company and type of business in a clear way, including its current and desired value, as well as ways to verify (measure) the results. In doing so, it is worth noting the nature of the variable under study—better results are provided by continuous rather than discrete variables. The measurement phase involves a numerical characterization of the current performance of a process, product or service and allows the current state to be determined, especially from the customer’s perspective. In the analysis phase, the product or service is considered to determine the source or sources of variability that are causing the problem. This provides an opportunity to make sure that the true root cause is identified, not just the symptom. In this regard, process capacity indicators are used to identify whether the produced goods are within the accepted specification limits defined by the customer.
The last two phases are improvement, which involves the presentation of implementable changes to the process, product or service to ensure the desired outcome of the project; and control, where the proposed changes are implemented, the supporting systems are updated, and the process, product or service, is audited—usually a statistical control of the process—to ensure that the solution is fully implemented in a sustainable manner [36,37].
The key assumption of the presented method Is the postulate that the random variables under study, such as the number of products produced, working time, etc., are described by a normal distribution. This is justified because, in practice, most business processes tend to follow a normal distribution. In the Six Sigma method, the normal distribution is used to define specification limits and control process quality. It defines the variability expressed in standard deviation σ, meaning that no more than 3.4 defects/errors per million possibilities of occurrence can be expected in a process. Thus, the basic assumption of the Six Sigma method is to achieve production correctness of 99.997%. The remaining 0.003% is 6σ, which is six times the standard deviation [38,39].
Normal distribution is therefore a key condition for using the Six Sigma method. Moreover, research indicates that abandoning this assumption leads to erroneous results [29]. If this postulate is not met, alternative statistical tools and methods, based on appropriate nonparametric tests, can be used to analyze the data and make improvements [40]. An example of such a method is an approach that focuses on ranking data and comparing the distribution of different groups using, for example, the Wilcoxon rank-sum test, which can be used to compare the distribution of a process before and after an improvement initiative [41,42]. Another approach is to transform the data to obtain a more normal distribution. Typical transformations include logarithmic, elemental and Box–Cox transformations [40]. Methods of approximating the normal distribution by replicating the data are also]. The transformed data can then be analyzed using standard Six Sigma tools such as control cards used [43] and process capability analysis. However, classical transformations do not always yield the expected results, and ignoring the form of the distribution leads to a higher probability of Type I or II error [43,44]. This is why data for further analysis must be properly prepared [45,46].
Therefore, this paper proposes a power transformation method using multiple-criteria decision analysis (MCDA) for the asymmetry coefficient and kurtosis coefficient. The task is to minimize the Jarque–Bera statistic, which we used to test the normality of the distribution.
The adopted test method is discussed in detail in the statistical background of the study. Summarizing the above, the aim of the article was to present the possibility of using the Six Sigma method in relation to numerical data that do not meet the postulate of normality of distribution. An appropriate methodology was developed for this purpose, which was then presented on an empirical example. Additionally, selected process indicators were calculated for the variable after transformation.

2. Indicators for Assessing the Quality Capability of the Process

Process quality capability indicators are measures used to assess whether a process meets certain quality standards and is capable of producing products or services that meet customer requirements. These indicators allow an objective assessment of process capability and identification of potential areas for improvement [47,48,49].
Testing the qualitative capability of a process involves determining how well a process meets the requirements for a particular characteristic. Quality indicators refer to the requirements set by the customer. These requirements usually relate to one specific feature [50,51,52].
The basic indicators of process quality capability include the Cp and Cpk indicators. The Cp indicator is used to determine the spread of the process given the specification limits and how much the process is centered, i.e., how much the value of a feature is equal to the nominal capacity. It also implies the possibility of systematic errors in the production process [53,54]. The Cp indicator is calculated as follows (1):
C p = U S L L S L 6 σ
where: USL—upper specification limit; LSL—lower specification limit; σ—standard deviation of sample.
The Cp value helps to better understand the performance of the process. If it is more than 1.33, which corresponds to a percentage of incompatible elements of 63 parts per million (ppm), the process performance is satisfactory for a centered process. The quality conditions and corresponding Cp values are shown in Table 1 [50,54].
The Cpk indicator is used to relate the variability of a process, showing how the process conforms to its specifications. Cpk is usually used to relate “Natural tolerances (±3 σ.” with the specification limits. Cpk describes how well a process falls within specifications, relative to the process average [50,55]. The Cpk indicator, which refers to the actual offset from the nominal value, is determined according to Formula (2):
C p k = min   ( U S L x ¯   3 σ ;     x ¯ L S L 3 σ )
where USL—upper specification limit; LSL—lower specification limit; x ¯ and σ —mean value and standard deviation of sample. From among the calculated values, the lower value is selected. The desired value of the Cpk indicator to be able to speak of a qualitatively stable process, as in the case of the Cp indicator, is at least 1.33 (Table 1).

3. Problem Formulation

The indicators of process quality capability, Cp and Cpk, are widely used to measure process capability. Traditional methods of estimating indicators require process data to be explicit and have a normal distribution [55,56]. Often, however, actual data on measurements of quality features are ambiguous and do not have a normal distribution, and therefore using traditional methods to estimate them can lead to erroneous results. Therefore, in order to determine these indicators, incomplete data and data that do not have a normal distribution are not analyzed, because the results of the analysis may contain errors and high uncertainty [45,57]. In addition, in the case of quality features, where a bilateral specification limit has been defined and the basic principles of sampling and measurement have been observed, the determination of these indicators should not be very difficult. However, a problem can arise with products where only a unilateral specification limit, i.e., USL or LSL, is specified.
The article is structured as follows: Section 4 describes the methods used. Section 5 discusses in detail the proposed data transformation method. Section 6 contains the results and analysis of the empirical data. The article closes with conclusions and directions for further research.

4. Statistical Background of the Study

4.1. Box-Cox Transformation

Let x 1 , x 2 , , x n denote the sequence of realizations of the analyzed feature X . In some cases, Box–Cox transformations were used to satisfy certain properties [58]
y i λ = x i λ 1 λ , for λ 0 , ln x i , for λ = 0 .
in order to minimize the variance [59]. Nevertheless, such a designated parameter λ does not ensure that the transformed feature Y λ meets the postulate of normality of distribution.

4.2. Normality Test

To test the normality of the distribution, among the available tests, [60] the Jarque–Bera test was chosen [61]. For the sample x i 1 i n of feature X at the level of significance 0 < α < 1 , we define a null hypothesis:
H 0 :   X N m , σ 2  
against an alternative hypothesis
H 0 :   X N m , σ 2
The Jarque–Bera test is based on measures of skewness and kurtosis. At the same time, it takes into account deviations from the normality of the distribution caused by both the coefficient of the skewness as well as flattening. The test statistics are described by following the formula:
J B = n 6 S 2 + K 3 2 4
The estimator of skewness S is calculated as follows:
S = 1 n i = 1 n x i x ¯ 3 1 n i = 1 n x i x ¯ 2 3 / 2
whereas kurtosis K is:
K = 1 n i = 1 n x i x ¯ 4 1 n i = 1 n x i x ¯ 2 2
where the estimator of the mean x ¯ is equal:
x ¯ = 1 n i = 1 n x i .
The test statistic (6) has χ 2 distribution with two degrees of freedom. Test probability for Jarque–Bera test is equal p . v a l = 1 F χ 2 2 J B , where F χ 2 2 denotes the χ 2 distribution function with two degrees of freedom.

4.3. Quality Capability Indicators for Unilateral Specification Limit

Let x i 1 i n be the sample drawn from a population with normal distribution N m , σ 2 , and an unilateral specification limit defined as LSL or USL be assumed. In the case of a unilateral specification limit, the probability of obtaining good products:
P L S L   X U S L = P X U S L P X L S L
can be determined by numerically determining the integral (10) or (11) depending on whether the tolerance is specified as LSL or USL.
P X L S L = L S L 1 2 π σ e x m 2 2 σ 2 d x
P X U S L = U S L 1 2 π σ e x m 2 2 σ 2 d x
This probability can also be determined using the properties of the distribution of the standard normal distribution N 0 , 1 —(12) or (13) for LSL or USL, respectively:
P X L S L = F N 0 , 1 L S L m σ
P X U S L = F N 0 , 1 U S L m σ
where F N 0 , 1 z = z 1 2 π σ e x 2 2 d x . The method of determining the probability and values of Cp and Cpk indicators should include the following steps:
1.
Determination of the mean value from the collected sample x ¯ and standard deviation σ .
2.
Calculation and determination of the absolute value from (14) or (15) depending on whether the specification limit is specified as LSL or USL.
F N 0 , 1 L S L x ¯ σ
F N 0 , 1 U S L x ¯ σ
3.
Determine the probability of obtaining of goods products
P L S L   X U S L = F N 0 , 1 U S L x ¯ σ F N 0 , 1 L S L x ¯ σ
4.
Read the Cp value from the graph (Figure 1) corresponding to the determined probability value.
5.
The Cpk value should be determined from Equation (2) depending on whether the specification limit is specified as LSL or USL. The value of this indicator should be referred to the value in Table 1.

5. Proposed Solution for Non-Normal Data

Let x i 1 i n denote the sample, representing the product treatment times. To determine the interval ± 3 s i g m a , it is necessary to perform a transformation of the product treatment times, so that the realization x i 1 i n meets the postulate of normality. Below, a power transform is used, and therefore determines the interval ± 3 s i g m a based on the sample x i λ 1 i n , where λ 0 . To determine the optimal value of λ , the statistic (6) is minimized and the following task is solved:
min λ 0 1 n i = 1 n x i λ x ¯ λ 3 2 1 n i = 1 n x i λ x ¯ λ 2 3 + 1 4 1 n i = 1 n x i λ x ¯ λ 4 1 n i = 1 n x i λ x ¯ λ 2 2 3 2
where:
x ¯ λ = 1 n i = 1 n x i λ .
By solving (16), the power of λ is determined, where for the sequence x i λ 1 i n the highest test probability for the postulate of normality of distribution is reached. As an estimator of the standard deviation, the following is assumed:
σ ^ λ = 1 n i = 1 n x i λ x ¯ λ 2
For transformed values, the interval ± 3   s i g m a is given as x ¯ λ 3 σ ^ λ , x ¯ λ + 3 σ ^ λ , while for actual operating times are defined as:
x ¯ λ 3 σ ^ λ 1 / λ , x ¯ λ + 3 σ ^ λ 1 / λ

6. Research Results

6.1. Scope of Analysis

Product treatment time was analyzed for three selected production stations. The Jarque–Bera test was used to test the normality postulate. In the absence of normality of the data distribution, the proposed solution was used to transform the data. Process quality capability indicators were determined for the transformed data.

6.2. Distribution Normality Analysis and Transformation for Machine 1

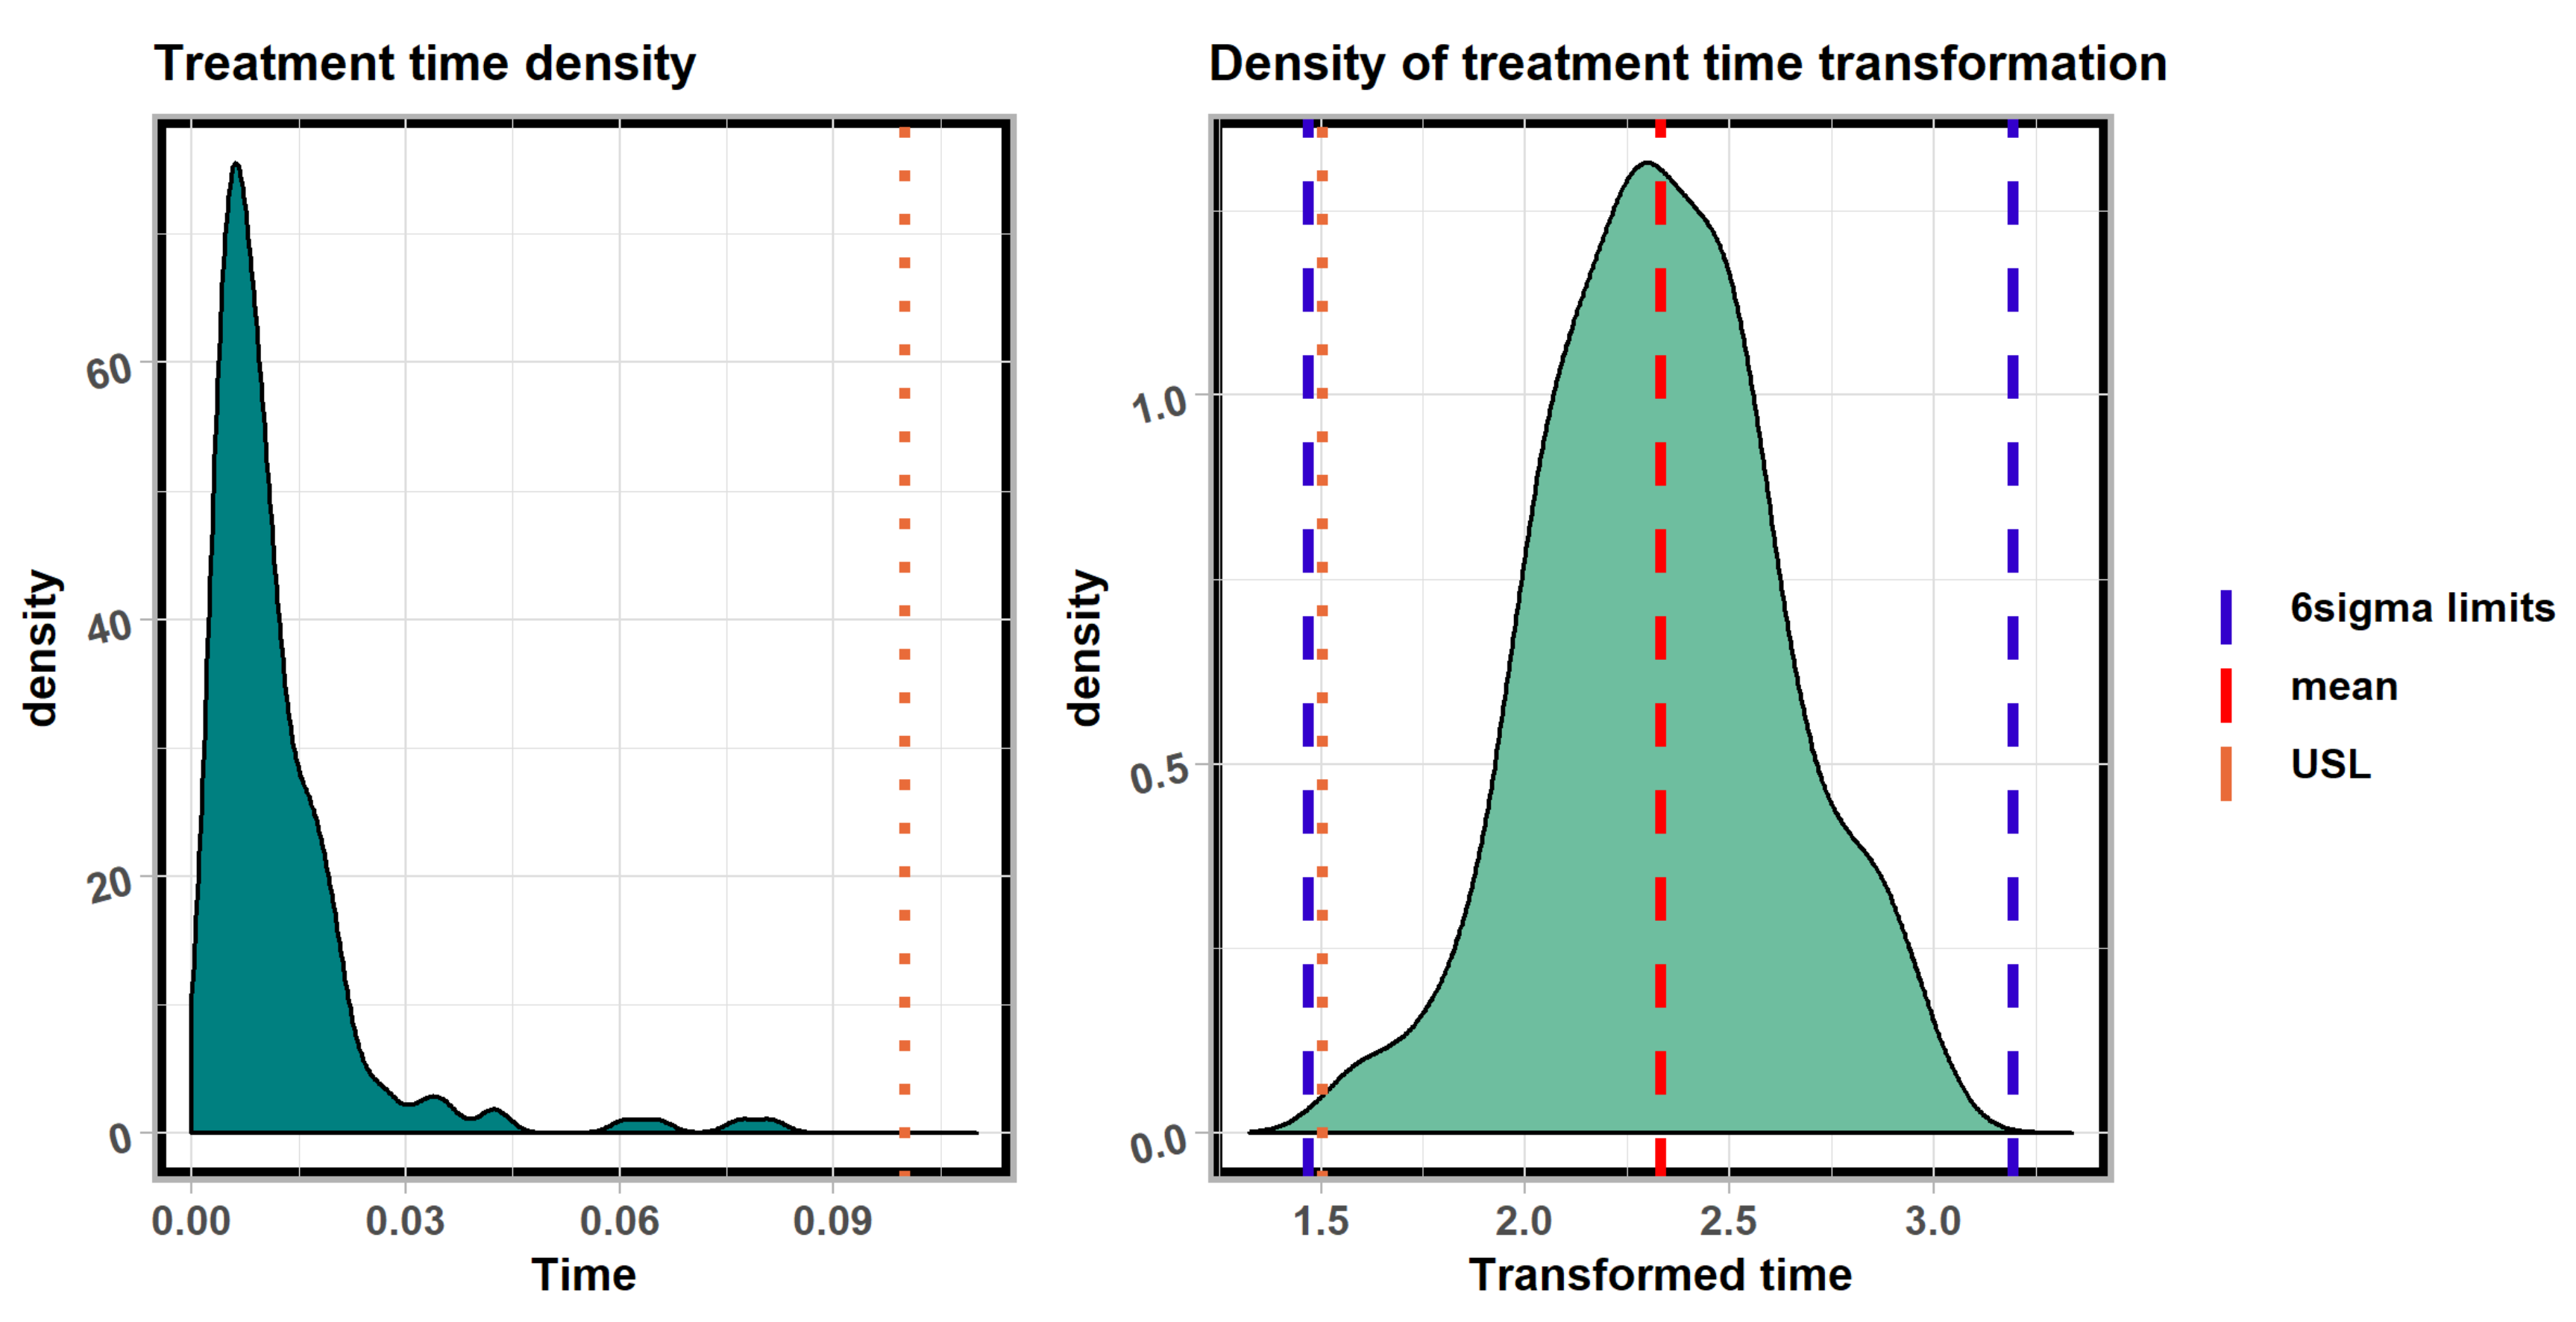
Figure 2 shows the distribution of treatment time for actual values and post-transformation values for machine 1. Meanwhile, Table 2 shows the basic statistics and results of the Jarque–Bera test for both real and transformed data. The p-value < 0.0001 for the actual data clearly indicates the non-normality of the data distribution. In addition, the skewness value (3.4916) shows their asymmetry, while the kurtosis value (15.6714) shows more extreme outliers than in a normal distribution (Figure 2).
After applying the proposed power transform, the p-value (0.9403) for the transformed data clearly indicates that the data distribution is close to a normal distribution. In addition, the value of skewness (−0.0165) and the value of kurtosis (−0.1170) show no major asymmetry or outliers. The value of the transformation parameter for machine 1 is λ = −0.1775. For the transformed values, the interval 6 s i g m a is (1.4684; 3.1929), while after the inverse transformation we obtain (0.0014; 0.1149).

6.3. Distribution Normality Analysis and Transformation for Machine 2

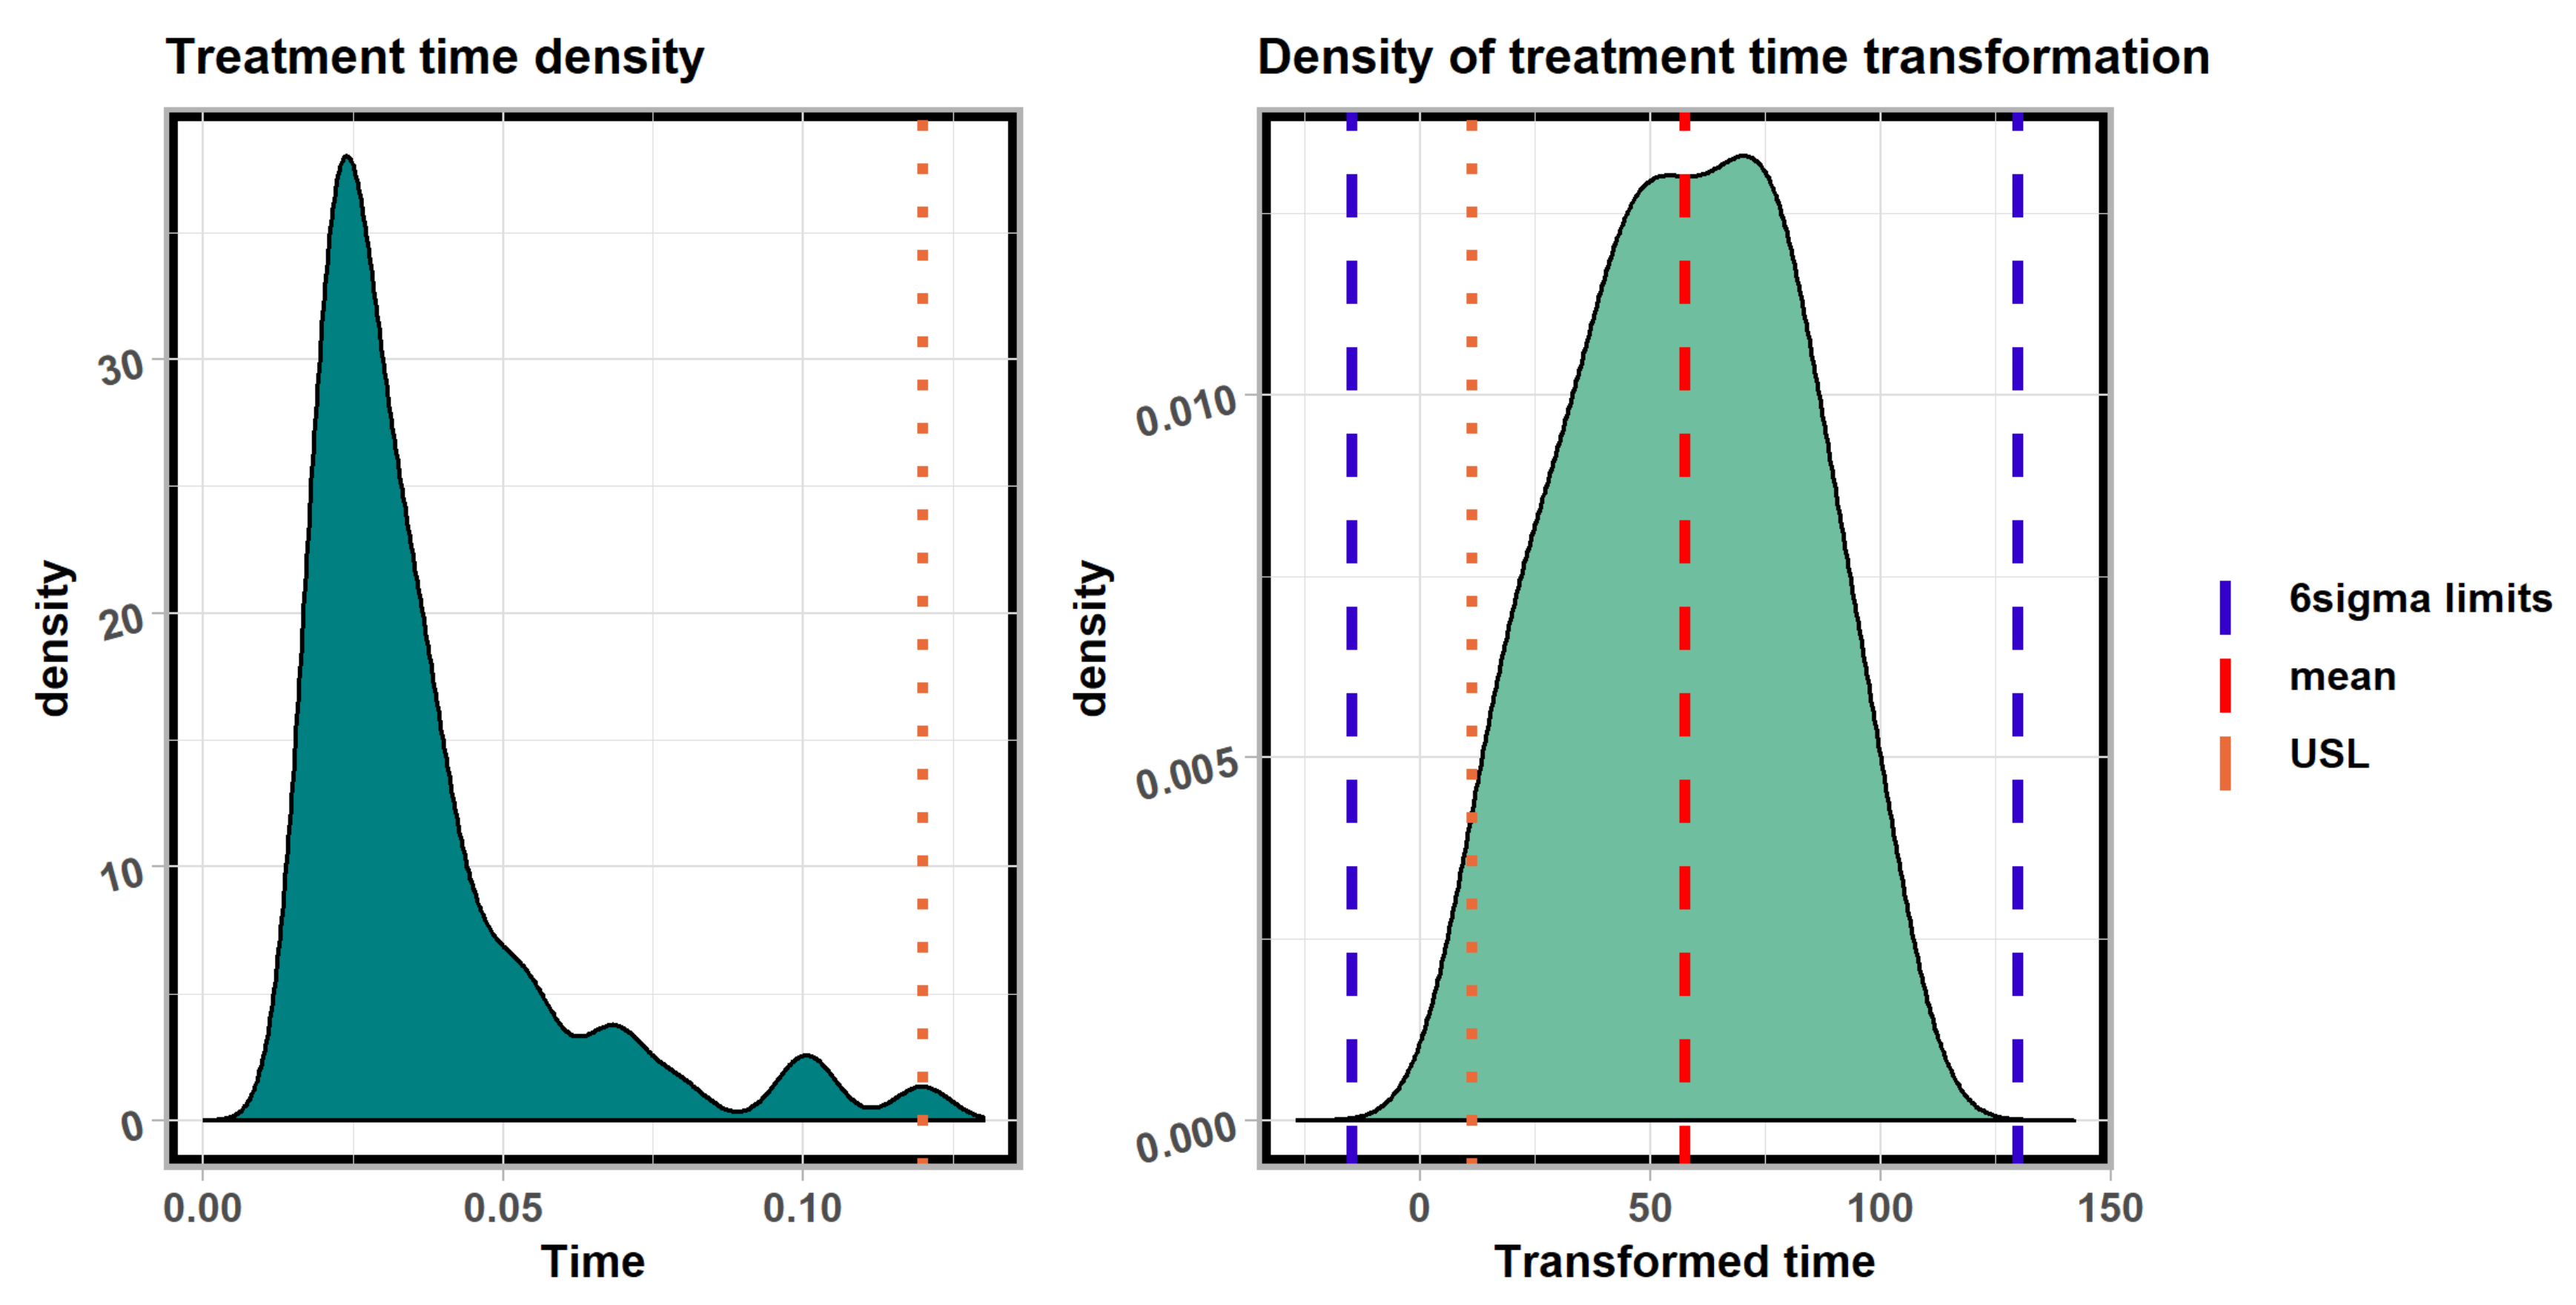
Figure 3 shows the distribution of treatment time for actual values and post-transformation values for machine 2. Meanwhile, Table 3 shows the basic statistics and results of the Jarque–Bera test for both real and transformed data. As with machine 1, the p-value (0.0000) for the actual data clearly indicates non-normality of the data distribution. Additionally, the value of skewness (2.0826) shows their greater asymmetry, while the value of kurtosis (4.3153) indicates the presence of numerous outliers (Figure 3).
After applying the proposed power transform, the p-value (0.2998) for the transformed data clearly indicates that the data distribution is close to a normal distribution. As with machine 1, the value of skewness (−0.0974) and the value of kurtosis (−0.9380) show no major asymmetry or outliers. The value of the transformation parameter for machine 3 is λ = −1.1468. For the transformed values, the interval 6 s i g m a is (−14.7956; 129.9583), while after the inverse transformation we obtain (−0.0878; 0.0143).

6.4. Normality Analysis and Transformation for Machine 3

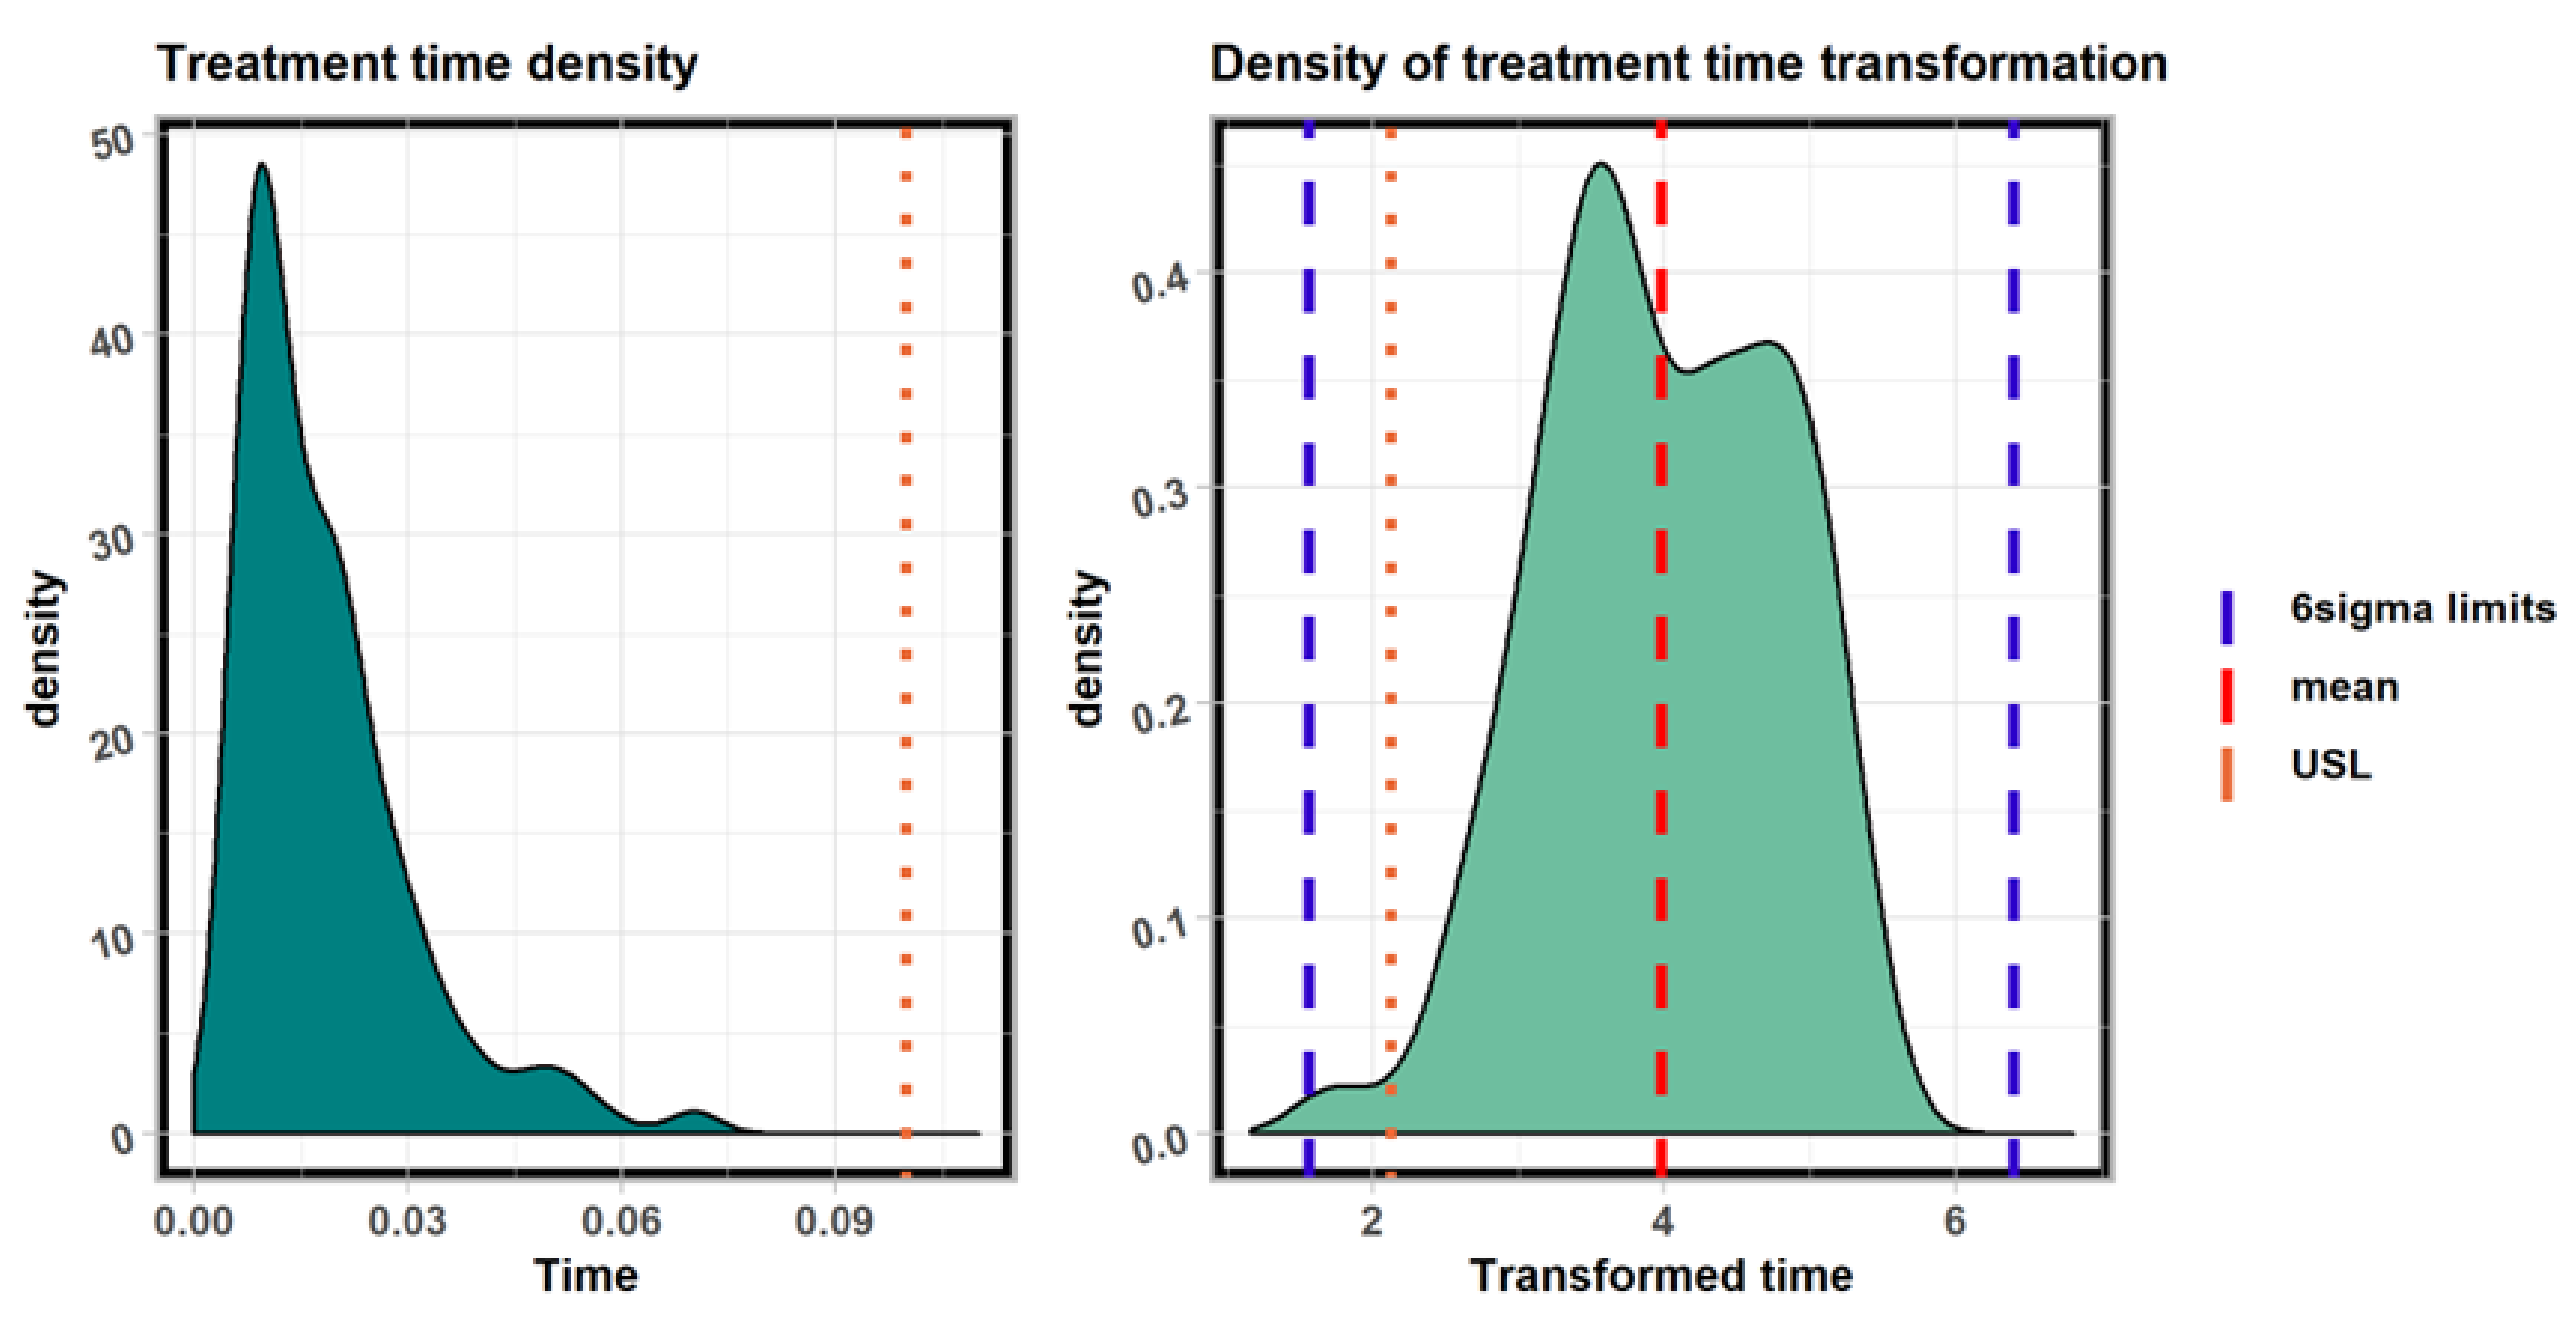
Figure 4 shows the distribution of treatment time for actual values and post-transformation values for machine 3. In addition, Table 4 shows the basic statistics and results of the Jarque–Bera test for both real and transformed data. As with Machine 1 and Machine 2, the p-value (0.0000) for the actual data clearly indicates the non-normality of the data distribution. Additionally, the value of skewness (1.6794) shows their asymmetry, while the value of kurtosis (3.2309) indicates the presence of extreme values (Figure 4).
As in the case of machine 1 and 2 using the proposed power transform, the p-value (0.0172) for the transformed data clearly indicates that the distribution of the data is close to a normal distribution, whereas the value of skewness (−0.0189) and the value of kurtosis (−0.9942) also show no major asymmetry or outliers. The value of the transformation parameter for machine 3 is λ = −0.3279. For the transformed values, the interval 6 s i g m a is (1.7249; 6.3091), while after the inverse transformation it is (0.0036; 0.1897).

6.5. Process Quality Capability Analysis

According to the methodology outlined in item 4.3, the values of Cp and Cpk indices were determined for each production site analyzed for the data after transformation. Each process had a unilateral specification limit for the product treatment time—USL. Table 5 shows the results obtained: the statistical values for each machine, including the upper specification limit (USL) for the data before and after the transformation, the absolute values, the values of the distribution and the process performance indicators (Cp, Cpk). It should be noted that the parameter indicators λ for the proposed power transform obtained negative values, which resulted in the specification limit for the transformed data being “swapped”. Its value and location for the transformed data (red dotted line) are marked for each machine in Figure 2, Figure 3 and Figure 4.
For Machine 1, the Cp and Cpk indicators are 1, which means that the process is capable of producing products within tolerance. For Machine 2, the Cp indicator is 0.8 and Cp is 0.7, suggesting that the process is less stable and may lead to more defective products. For Machine 3, the Cp indicator is 0.9, and Cpk is 0.8, which means the process is less stable than Machine 1, but more stable than Machine 2.
Analysis of these results can help identify machines that require additional investigation and improvements to the production process to improve process performance and production quality.
The values of the distributions for all three machines are very high, which means that almost all products produced by these machines are within tolerance. At the analyzed stations, if the manufacturer wants to improve product quality, the focus should be placed on machines that have lower process performance indicators. For Machine 2, whose Cpk indicator is the lowest, the cause of the low performance should be identified and appropriate corrective action taken.
It is also important to consider other factors, such as the costs associated with streamlining the process and making changes. Depending on the situation, it may be more cost-effective to focus on machines with higher process performance indicators that also have a low deviation from the specification limit.
Identifying machines that need to be improved in process performance helps ensure higher production quality and increase customer satisfaction, but it is equally important to consider costs and choose corrective actions that are most cost-effective for the company. Therefore, the next step after analyzing the results for individual machines should be to conduct a more detailed study of the production process for each machine. A more accurate identification of factors affecting the quality of production and the identification of specific areas that need improvement slowly to implement solutions dedicated to the diagnosed problems.
For example, a manufacturer can focus on reducing deviations in the production process, such as reducing the number of rejected products and ensuring that each machine is calibrated and set to optimal operating parameters.
It is necessary to carry out in-depth studies especially in the case of Machine 2, whose Cpk indicator is the lowest. This will allow to identify the causes of low productivity, which may be calibration problems, tool wear or improper parameters of the production process. Only after they are identified will the manufacturer be able to take effective corrective action.
It is also important, to constantly monitor the production process and conduct regular tests to ensure optimal production efficiency and quality. This will allow problems to be detected and resolved quickly, minimizing costs and reducing the risk of producing defective products [36].

7. Conclusions

The results achievable in a company through the use of the Six Sigma method prompt us to expand its applicability to non-normal distributions as well. This article presents a method that makes this possible. The transformation of the data developed by the authors made it possible to obtain from the original set of observations that did not meet the postulate of normality one that, in statistical tests, did not allow the rejection of the hypothesis that the studied empirical distribution was consistent with a normal distribution. This made it possible to use Six Sigma and calculate the basic indicators that characterize the process. The indicators chosen were Cp and Cpk. Calculations were made for three selected machines, and the results were compared and recommendations for further action were presented.
A particular strength of the article, however, is the proposed transformation. Failure to confirm that the data obtained from production conforms to a normal distribution causes entrepreneurs to abandon the implementation of Six Sigma tools, or worse, to overlook this assumption and perform further analysis. This can lead to false results. Making decisions based on them can result in negative consequences for the company. Poor evaluation of the quality of the production process or adoption of wrong directions for improvement can have dire consequences.
The next step of the research will be the development of models using other methods, as well as the comparison and evaluation of the obtained results. This will allow enterprises to expand the methods of analysis and evaluation of the implemented processes. Not only will it enable the use of the Six Sigma tool in relation to distributions other than normal, but it will indicate the possibilities of implementing other methods dedicated to parametric distributions.

Author Contributions

Conceptualization, A.B. and E.K.; methodology, A.B., E.K. and K.A.; software, E.K.; validation A.B. and E.K.; formal analysis, A.B. and E.K.; investigation, A.B., E.K. and K.A.; resources, R.P., data curation, R.P.; writing—original draft preparation, A.B., E.K., and K.A.; writing—review and editing, A.B., E.K., K.A. and R.P.; visualization, E.K.; supervision, A.B. and K.A.; project administration, A.B. and K.A.; funding acquisition, K.A. All authors have read and agreed to the published version of the manuscript.

Funding

This research received no external funding.

Institutional Review Board Statement

Not applicable.

Informed Consent Statement

Not applicable.

Data Availability Statement

Not applicable.

Conflicts of Interest

The authors declare no conflict of interest.

References

  1. Rogalewicz, M.; Kujawińska, A.; Feledziak, A. Ensuring the reliability and reduction of quality control costs by minimizing process variability. Eksploat. Niezawodn.—Maint. Reliab. 2023, 25, 162626. [Google Scholar] [CrossRef]
  2. Ahmed, A.; Page, J.; Olsen, J. Enhancing Six Sigma methodology using simulation techniques: Literature review and implications for future research. Int. J. Lean Six Sigma 2020, 11, 211–232. [Google Scholar] [CrossRef]
  3. Gijo, E.V.; Antony, J.; Sunder, M.V. Application of Lean Six Sigma in IT support services—A case study. TQM J. 2019, 31, 417–435. [Google Scholar]
  4. Martinez, F. Process excellence the key for digitalisation. Bus. Process Manag. J. 2019, 25, 1716–1733. [Google Scholar] [CrossRef]
  5. Yanamandra, R.; Alzoubi, H.M. Empirical investigation of mediating role of six sigma approach in rationalizing the COQ in service organizations. Oper. Supply Chain. Manag. Int. J. 2022, 15, 122–135. [Google Scholar]
  6. Narula, V.; Grover, S. Six Sigma-Literature Review And Implications For Future Research 2019. Int. J. Ind. Eng. Prod. Res. 2015, 26, 13–26. [Google Scholar]
  7. Anthony, S.G.; Antony, J. The History of Lean Six Sigma. In Lean Six Sigma in Higher Education Institutions; Emerald Publishing Limited: Bingley, UK, 2022; pp. 15–21. [Google Scholar]
  8. Excellence, M.B. Viewpoint: Six sigma implementation. In Measuring Business Excellence; Emerald Group Publishing Limited: Bingley, UK, 2003; Volume 7. [Google Scholar] [CrossRef]
  9. Brun, A. Critical success factors of Six Sigma implementations in Italian companies. Int. J. Prod. Econ. 2011, 131, 158–164. [Google Scholar] [CrossRef]
  10. Mathew, J.; Kurudkar, P.; Singh, S.; Singh, K.; Singh, B.; Mahajan, S. Quality and productivity improvement using Six Sigma—A literature review. Int. J. Innov. Eng. Sci. 2017, 2, 15–23. [Google Scholar]
  11. Antony, J.; Forthun, S.C.; Trakulsunti, Y.; Farrington, T.; McFarlane, J.; Brennan, A.; Dempsey, M. An exploratory study into the use of Lean Six Sigma to reduce medication errors in the Norwegian public healthcare context. Leadersh. Health Serv. 2017, 32, 509–524. [Google Scholar] [CrossRef]
  12. Trakulsunti, Y.; Antony, J.; Dempsey, M.; Brennan, A. Reducing medication errors using lean six sigma methodology in a Thai hospital: An action research study. Int. J. Qual. Reliab. Manag. 2012, 38, 339–362. [Google Scholar] [CrossRef]
  13. Niñerola, A.; Sánchez-Rebull, M.V.; Hernández-Lara, A.B. Quality improvement in healthcare: Six Sigma systematic review. Health Policy 2020, 124, 438–445. [Google Scholar] [CrossRef] [PubMed]
  14. Pyzdek, T.; Keller, P.A. The Six Sigma Handbook: A Complete Guide for Green Belts, Black Belts, and Managers at All Levels; McGraw Hill Professional: New York City, NY, USA, 2014. [Google Scholar]
  15. Samanta, A.K.; Gurumurthy, A. Implementing lean six sigma in health care: A review of case studies. Int. J. Lean Six Sigma 2023, 14, 158–189. [Google Scholar] [CrossRef]
  16. Ahmed, S. Integrating DMAIC approach of Lean Six Sigma and theory of constraints toward quality improvement in healthcare. Rev. Environ. Health 2019, 34, 427–434. [Google Scholar] [CrossRef] [PubMed]
  17. Cudney, E.A.; Venuthurumilli, S.S.J.; Materla, T.; Antony, J. Systematic review of Lean and Six Sigma approaches in higher education. Total Qual. Manag. Bus. Excell. 2020, 31, 231–244. [Google Scholar] [CrossRef]
  18. Gupta, S.; Arora, A. Six Sigma in financial services. Int. J. Adv. Res. Comput. Sci. Softw. Eng. 2012, 2, 76–80. [Google Scholar]
  19. Madhani, P.M. Lean six sigma deployment in finance and financial services: Enhancing competitive advantages. IUP J. Oper. Manag. 2020, 19, 25–49. [Google Scholar]
  20. Madhani, P.M. Lean Six Sigma in finance and accounting services for enhancing business performance. IJSSMET 2020, 12, 141–165. [Google Scholar] [CrossRef]
  21. Čaušević, S.; Avdagić-Golub, E. The challenges and opportunities of introducing six sigma at customer support telecommunication company. TEM J. 2019, 8, 1307. [Google Scholar]
  22. CR, A.; Thakkar, J.J. Application of Six Sigma DMAIC methodology to reduce the defects in a telecommunication cabinet door manufacturing process: A case study. Int. J. Qual. Reliab. Manag. 2019, 36, 1540–1555. [Google Scholar]
  23. Tay, H.L.; Aw, H.S. Improving logistics supplier selection process using lean six sigma—An action research case study. J. Glob. Oper. Strateg. Sourc. 2021, 14, 336–359. [Google Scholar] [CrossRef]
  24. Praharsi, Y.; Jami’in, M.A.; Suhardjito, G.; Wee, H.M. The application of Lean Six Sigma and supply chain resilience in maritime industry during the era of COVID-19. Int. J. Lean Six Sigma 2021, 12, 800–834. [Google Scholar] [CrossRef]
  25. Ramadan, M.A.; Al Dhaheri, M.K.; Maalouf, M.; Antony, J.; Bhat, S.; Gijo, E.V. Application of Six Sigma methodology to enhance the productivity and performance of a hotel in the UAE. TQM J. 2023, 35, 554–576. [Google Scholar] [CrossRef]
  26. Shofia, A.; Bakhtiar, A.; Prastawa, H. The impact of critical success factor of lean six sigma implementation towards the improvement of business performance on low-cost hotel industry: A literature review. In AIP Conference Proceedings; AIP Publishing LLC: Melville, NY, USA, 2020; Volume 2217, p. 030072. [Google Scholar]
  27. Madhani, P.M. Performance optimisation of retail industry: Lean Six Sigma approach. ASBM J. Manag. 2020, 13, 74–91. [Google Scholar]
  28. Panayiotou, N.A.; Stergiou, K.E. A systematic literature review of lean six sigma adoption in European organizations. Int. J. Lean Six Sigma 2021, 12, 264–292. [Google Scholar] [CrossRef]
  29. Sunder, M.V.; Ganesh, L.S.; Marathe, R.R. Lean Six Sigma in consumer banking—An empirical inquiry. IJQRM 2019, 36, 1345–1369. [Google Scholar] [CrossRef]
  30. Zhuo, Z. Research on using Six Sigma management to improve bank customer satisfaction. IJQI 2019, 5, 3. [Google Scholar] [CrossRef]
  31. Ahmed, S.; Abd Manaf, N.H.; Islam, R. Effects of Six Sigma initiatives in Malaysian private hospitals. Int. J. Lean Six Sigma 2019, 10, 44–57. [Google Scholar] [CrossRef]
  32. Alshraideh, M.; Ababneh, S.; Gunay, E.E.; Al-Araidah, O. A fuzzy-TOPSIS model for maintenance outsourcing considering the quality of submitted tender documents. Eksploat. Niezawodn.—Maint. Reliab. 2021, 23, 443–453. [Google Scholar] [CrossRef]
  33. Pongboonchai-Empl, T.; Antony, J.; Garza-Reyes, J.A.; Komkowski, T.; Tortorella, G.L. Integration of Industry 4.0 technologies into Lean Six Sigma DMAIC: A systematic review. Prod. Plan. Control. 2023, 1–26. [Google Scholar] [CrossRef]
  34. Sekarwardani, N.; Basri, M.H. Proposed New Product Feature Development of Video Communication Platform in PT. XYZ Using Six Sigma DMADV. Int. J. Curr. Sci. Res. Rev. 2022, 5, 3081–3084. [Google Scholar] [CrossRef]
  35. Rymarczyk, T.; Król, K.; Kozłowski, E.; Wołowiec, T.; Cholew-Wiktor, M.; Bednarczuk, P. Application of electrical tomography imaging using machine learning methods for the monitoring of flood embankment leak. Energies 2021, 14, 8081. [Google Scholar] [CrossRef]
  36. Niewczas, A.; Mórawski, Ł.; Rymarz, J.; Dębicka, E.; Hołyszko, P. Operational risk assessment model for city buses. Eksploat. Niezawodn.—Maint. Reliab. 2023, 25, 14. [Google Scholar] [CrossRef]
  37. Ge, Z.; Zhang, Y.; Wang, F.; Luo, X.; Yang, Y. Virtual-real fusion maintainability verification based on adaptive weighting and truncated spot method. Eksploat. I Niezawodn.—Maint. Reliab. 2022, 24, 738–746. [Google Scholar] [CrossRef]
  38. Antosz, K.; Stadnicka, D. Possibilities of maintenance service process analyses and improvement through six sigma, lean and industry 4.0 implementation. In Proceedings of the Product Lifecycle Management to Support Industry 4.0: 15th IFIP WG 5.1 International Conference, PLM 2018, Turin, Italy, 2–4 July 2018; Proceedings 15. Springer International Publishing: Cham, Switzerland, 2018; pp. 465–475. [Google Scholar]
  39. Antosz, K.; Jasiulewicz-Kaczmarek, M.; Waszkowski, R.; Machado, J. Application of Lean Six Sigma for sustainable maintenance: Case study. IFAC-PapersOnLine 2022, 55, 181–186. [Google Scholar] [CrossRef]
  40. Buthmann, A. Dealing with Non-Normal Data: Strategies and Tools. iSixSigma. 2018. Available online: https://www.isixsigma.com/tools-templates/normality/dealing-non-normal-datastrategies-and-tools/ (accessed on 28 May 2023).
  41. Gangidi, P.R. Application of six sigma in semiconductor manufacturing: A case study in yield improvement. In Applications of Design for Manufacturing and Assembly; IntechOpen: London, UK, 2019; pp. 27–43. [Google Scholar]
  42. Jaroń, A.; Borucka, A.; Parczewski, R. Analysis of the Impact of the COVID-19 Pandemic on the Value of CO2 Emissions from Electricity Generation. Energies 2022, 15, 4514. [Google Scholar] [CrossRef]
  43. Aldowaisan, T.; Nourelfath, M.; Hassan, J. Six Sigma performance for non-normal processes. Eur. J. Oper. Res. 2015, 247, 968–977. [Google Scholar] [CrossRef]
  44. Chou, C.Y.; Chen, C.H.; Liu, H.R. Acceptance control charts for non-normal data. J. Appl. Stat. 2005, 32, 25–36. [Google Scholar] [CrossRef]
  45. Yang, C.; Xia, Y. Interval Uncertainty-Oriented Optimal Control Method for Spacecraft Attitude Control. IEEE Trans. Aerosp. Electron. Syst. 2023, 1–13. [Google Scholar] [CrossRef]
  46. Yang, C.; Yu, Q. Placement and size-oriented heat dissipation optimization for antenna module in space solar power satellite based on interval dimension-wise method. Aerosp. Sci. Technol. 2023, 134, 108155. [Google Scholar] [CrossRef]
  47. Grzelak, M.; Borucka, A.; Guzanek, P. Application of Linear Regression for Evaluation of Production Processes Effectiveness. In Innovations in Industrial Engineering; Machado, J., Soares, F., Trojanowska, J., Ivanov, V., Eds.; ICIE 2021; Lecture Notes in Mechanical Engineering; Springer: Cham, Switzerland, 2022. [Google Scholar] [CrossRef]
  48. Karpenko, M. Landing gear failures connected with high-pressure hoses and analysis of trends in aircraft technical problems. Aviation 2022, 26, 145–152. [Google Scholar] [CrossRef]
  49. Borucka, A. Three-state Markov model of using transport means. Bus. Logist. Mod. Manag. 2018, 18, 3–19. [Google Scholar]
  50. Basak, I.; Roy, R.; Asad, M.W.A. Review of process capability indices. J. Qual. Maint. Eng. 2019, 25, 343–365. [Google Scholar]
  51. Özcan, E.; Yumuşak, R.; Eren, T. A novel approach to optimize the maintenance strategies: A case in the hydroelectric power plant. Eksploat. Niezawodn.—Maint. Reliab. 2021, 23, 324–337. [Google Scholar] [CrossRef]
  52. Kozłowski, E.; Antosz, K.; Mazurkiewicz, D.; Sęp, J.; Żabiński, T. Integrating advanced measurement and signal processing for reliability decision making. Eksploat. Niezawodn.—Maint. Reliab. 2021, 23, 777–787. [Google Scholar] [CrossRef]
  53. Lepore, A.; Palumbo, B.; Castagliola, P. A note on decision making method for product acceptance based on process capability indices Cpk and Cpmk. Eur. J. Oper. Res. 2018, 267, 393–398. [Google Scholar] [CrossRef]
  54. Arcidiacono, G.; Nuzzi, S. A review of the fundamentals on process capability, process performance, and process sigma, and an introduction to process sigma split. Int. J. Appl. Eng. 2017, 12, 4556–4570. [Google Scholar]
  55. Antosz, K.; Kluz, R. Analyze of process quality capability with one side specification limit. Technol. Autom. Montażu 2018, 2, 49–52. [Google Scholar]
  56. Montgomery, D.C. Introduction to Statistical Quality Control; John Wiley & Sons: Hoboken, NJ, USA, 2017. [Google Scholar]
  57. Yang, C.; Ouyang, H. A novel load-dependent sensor placement method for model updating based on time-dependent reliability optimization considering multi-source uncertainties. Mech. Syst. Signal Process. 2022, 165, 108386. [Google Scholar] [CrossRef]
  58. Box, G.E.; Cox, D.R. An analysis of transformations. J. R. Stat. Soc. Ser. B (Methodol.) 1964, 26, 211–243. [Google Scholar] [CrossRef]
  59. Guerrero, V.M. Time-series analysis supported by power transformations. J. Forecast. 1993, 12, 37–48. [Google Scholar] [CrossRef]
  60. Cromwell, B.; Terraza, M. Multivariate Tests for Time Series Models; Sage: Thousand Oaks, CA, USA, 1994. [Google Scholar]
  61. Jarque, C.M.; Bera, A.K. Efficient tests for normality, homoscedasticity and serial independence of regression residuals. Econ. Lett. 1980, 6, 255–259. [Google Scholar] [CrossRef]
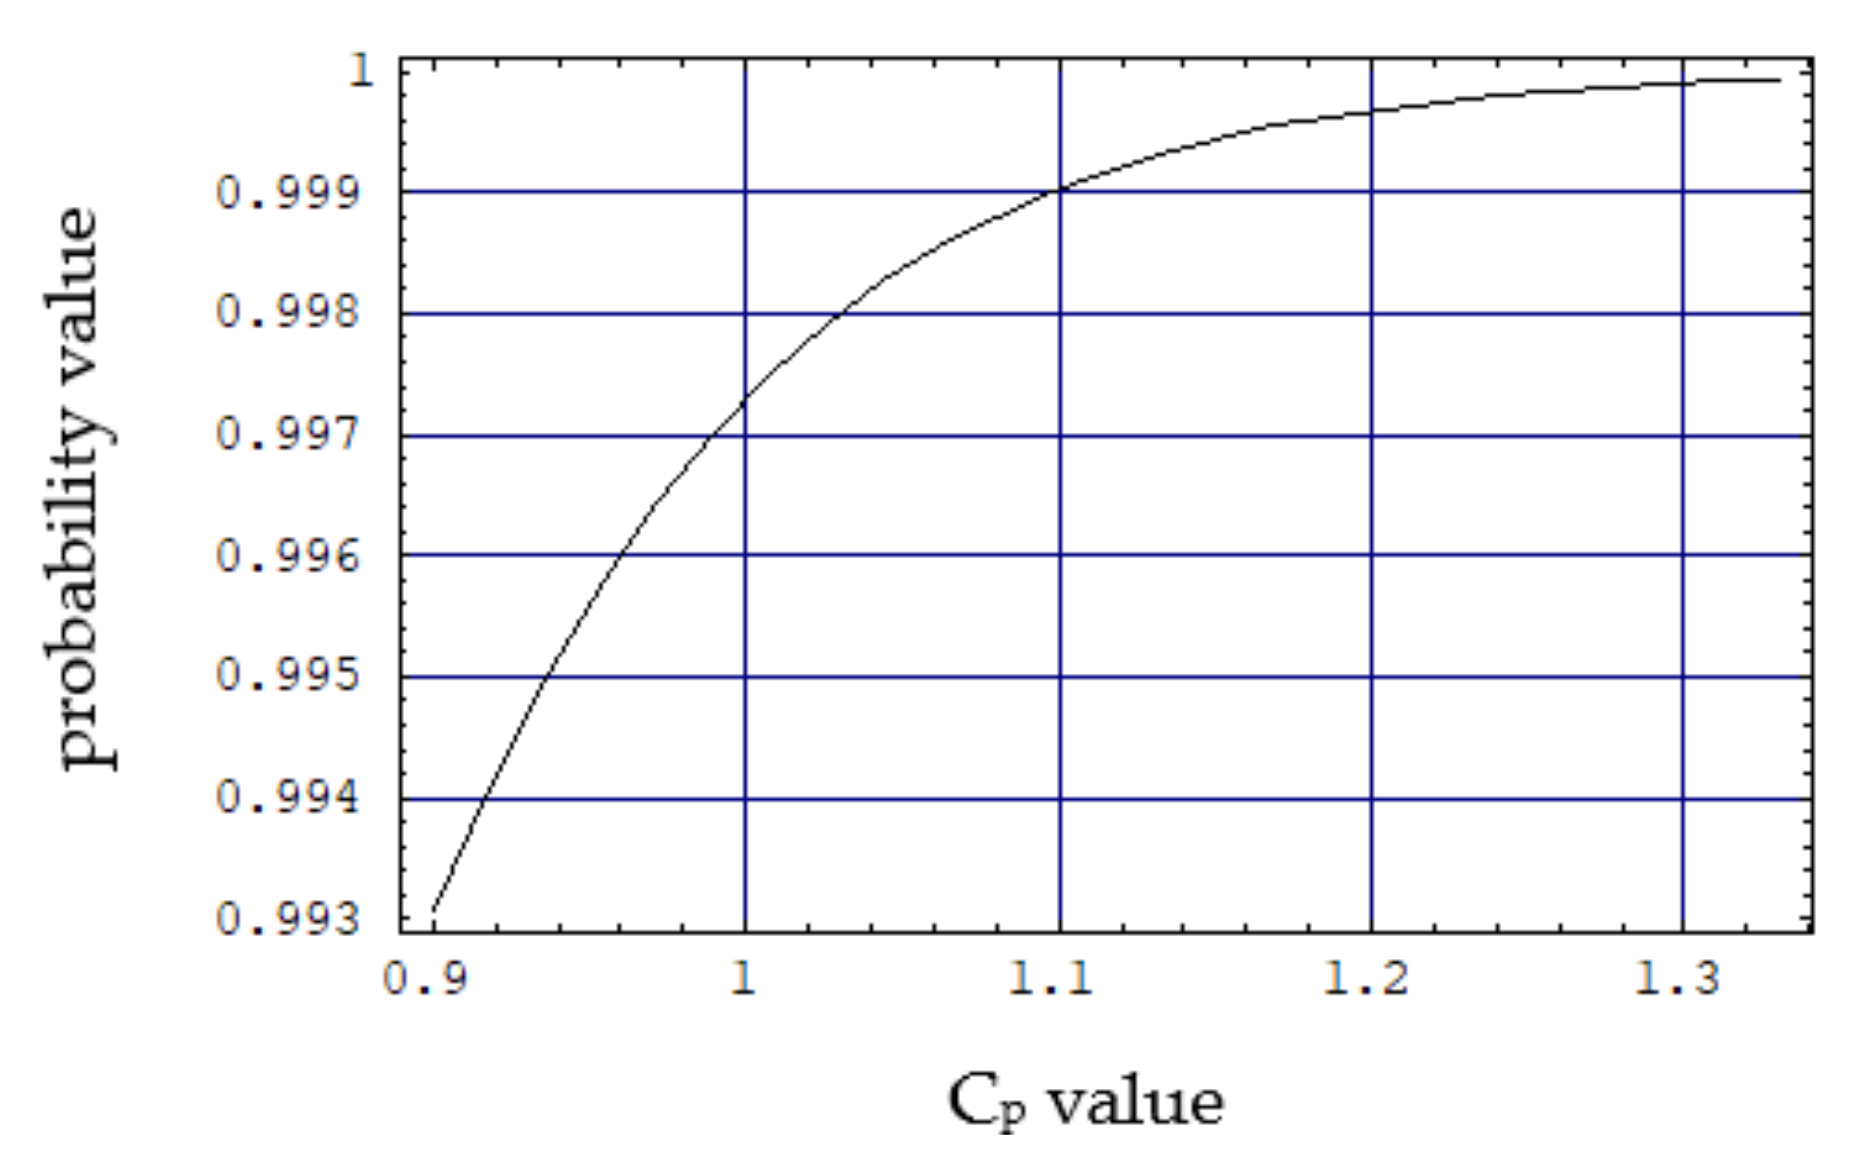
Figure 1. The Cp value for the value of the distribution function.
Applsci 13 06721 g001
Figure 2. Densities for real time and time after transformation for machine 1.
Applsci 13 06721 g002
Figure 3. Densities for real time and time after transformation for machine 2.
Applsci 13 06721 g003
Figure 4. Densities for real time and time after transformation for machine 3.
Applsci 13 06721 g004
Table 1. Quality conditions and Cp values.
Quality ConditionCp
Super ExcellentCp ≥ 2.00
Excellent1.67 ≤ Cp < 2.00
Satisfactory1.33 ≤ Cp < 1.67
Capable1.00 ≤ Cp < 1.33
Inadequate0.67 ≤ Cp < 1.00
PoorCp < 0.67
Table 2. Based statistics and result of Jarque–Bera test.
StatisticsTreatment TimeTreatment Time Transformation
mean0.01172.3306
st. deviation0.01120.2874
min0.00211.5609
1Q0.00552.1230
3Q0.01442.5154
max0.08142.9871
skewness3.4916−0.0165
kurtosis15.6714−0.1170
JB statistic2452.99730.1232
p-value<0.00010.9403
USL0.10001.5050
Table 3. Based statistics and result of Jarque–Bera test.
StatisticsTreatment TimeTreatment Time Transformation
mean0.036357.5813
st. deviation0.021324.1257
min0.018011.3862
1Q0.022941.3097
3Q0.039076.1573
max0.1199100.4055
skewness2.0826−0.0974
kurtosis4.3153−0.9380
JB statistic94.42312.4092
p-value<0.00010.2998
USL0.120011.3771
Table 4. Based statistics and result of Jarque–Bera test.
StatisticsTreatment TimeTreatment Time Transformation
mean0.01844.0170
st. deviation0.01230.7640
min0.00572.3738
1Q0.00903.4294
3Q0.02334.6852
max0.07165.4588
skewness1.6794−0.0189
kurtosis3.2309−0.9942
JB statistic178.28598.1258
p-value<0.00010.0172
USL0.10002.1279
Table 5. Statistical values and Cp, Cpk for the stations analyzed.
ProcessMachine 1Machine 2Machine 3
USL before transformation0.100.120.10
USL after transformation1.505011.37712.1279
λ −0.1775.−1.1468−0.3279
Absolute value2.871.912.47
Distribution function value0.9978820.9719300.993053
Cp1.00.80.9
Cpk1.00.70.8
Condition of the processCapableInadequateInadequate
Disclaimer/Publisher’s Note: The statements, opinions and data contained in all publications are solely those of the individual author(s) and contributor(s) and not of MDPI and/or the editor(s). MDPI and/or the editor(s) disclaim responsibility for any injury to people or property resulting from any ideas, methods, instructions or products referred to in the content.