
Experimental Study on Ice Melting of Bridge Tower Crossbeams under Different Conditions


Abstract
:1. Introduction
2. Model Test
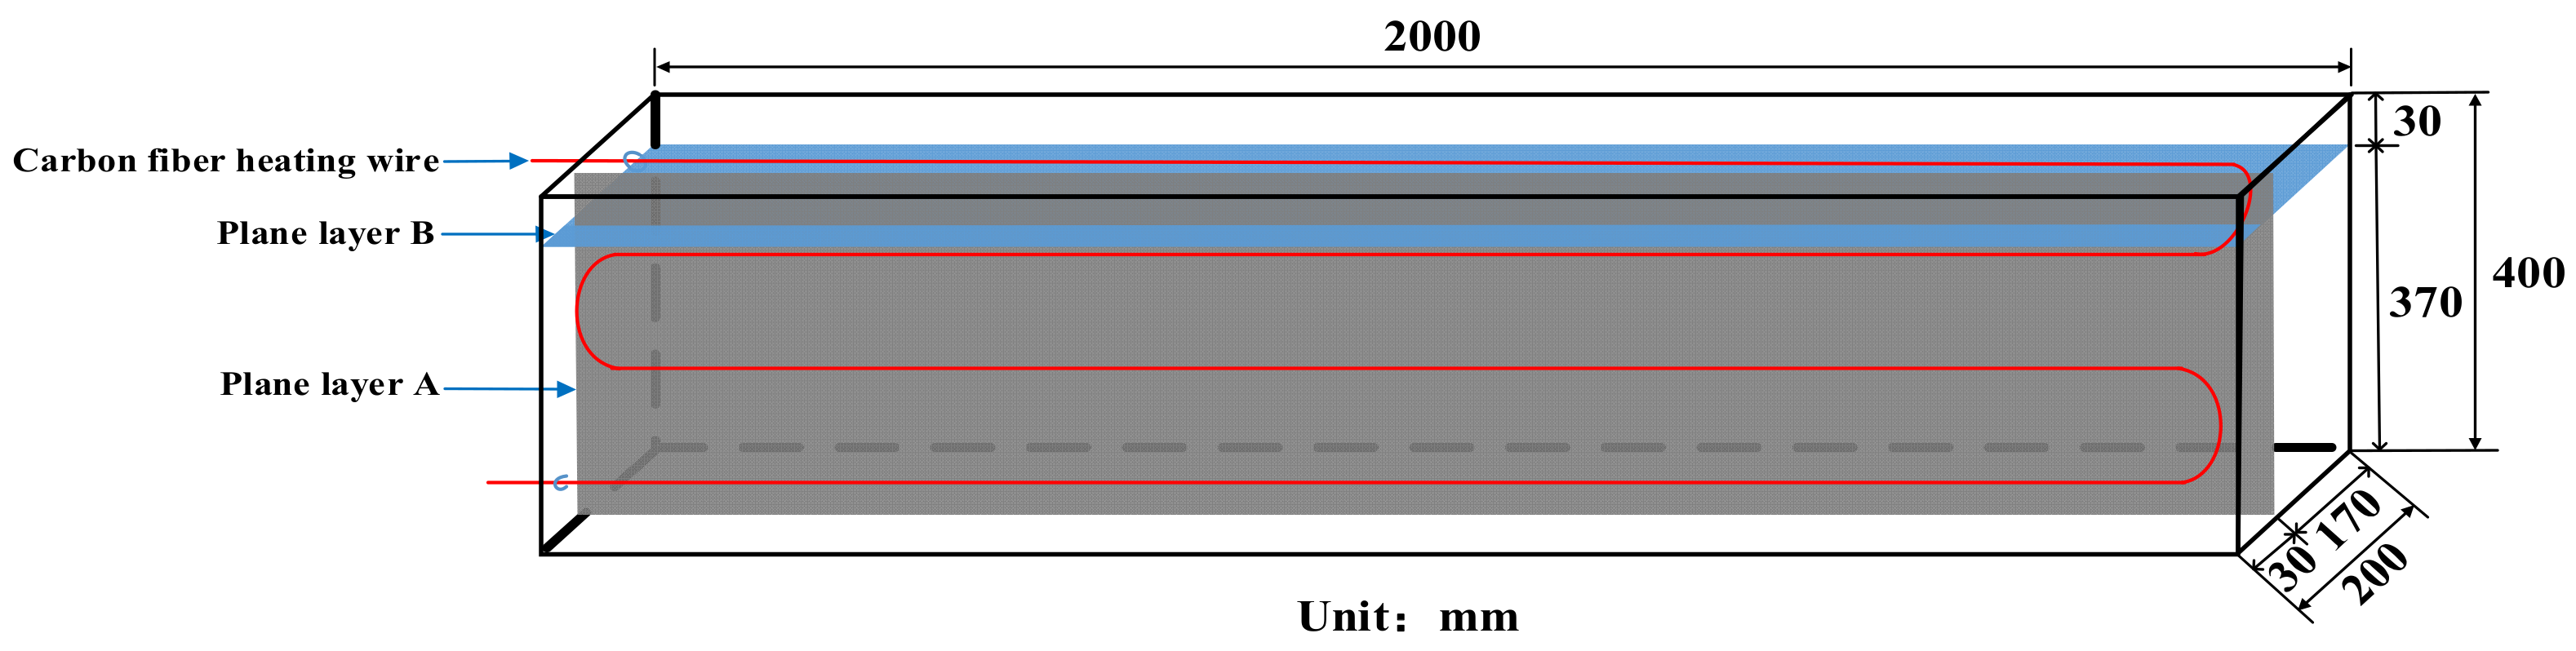
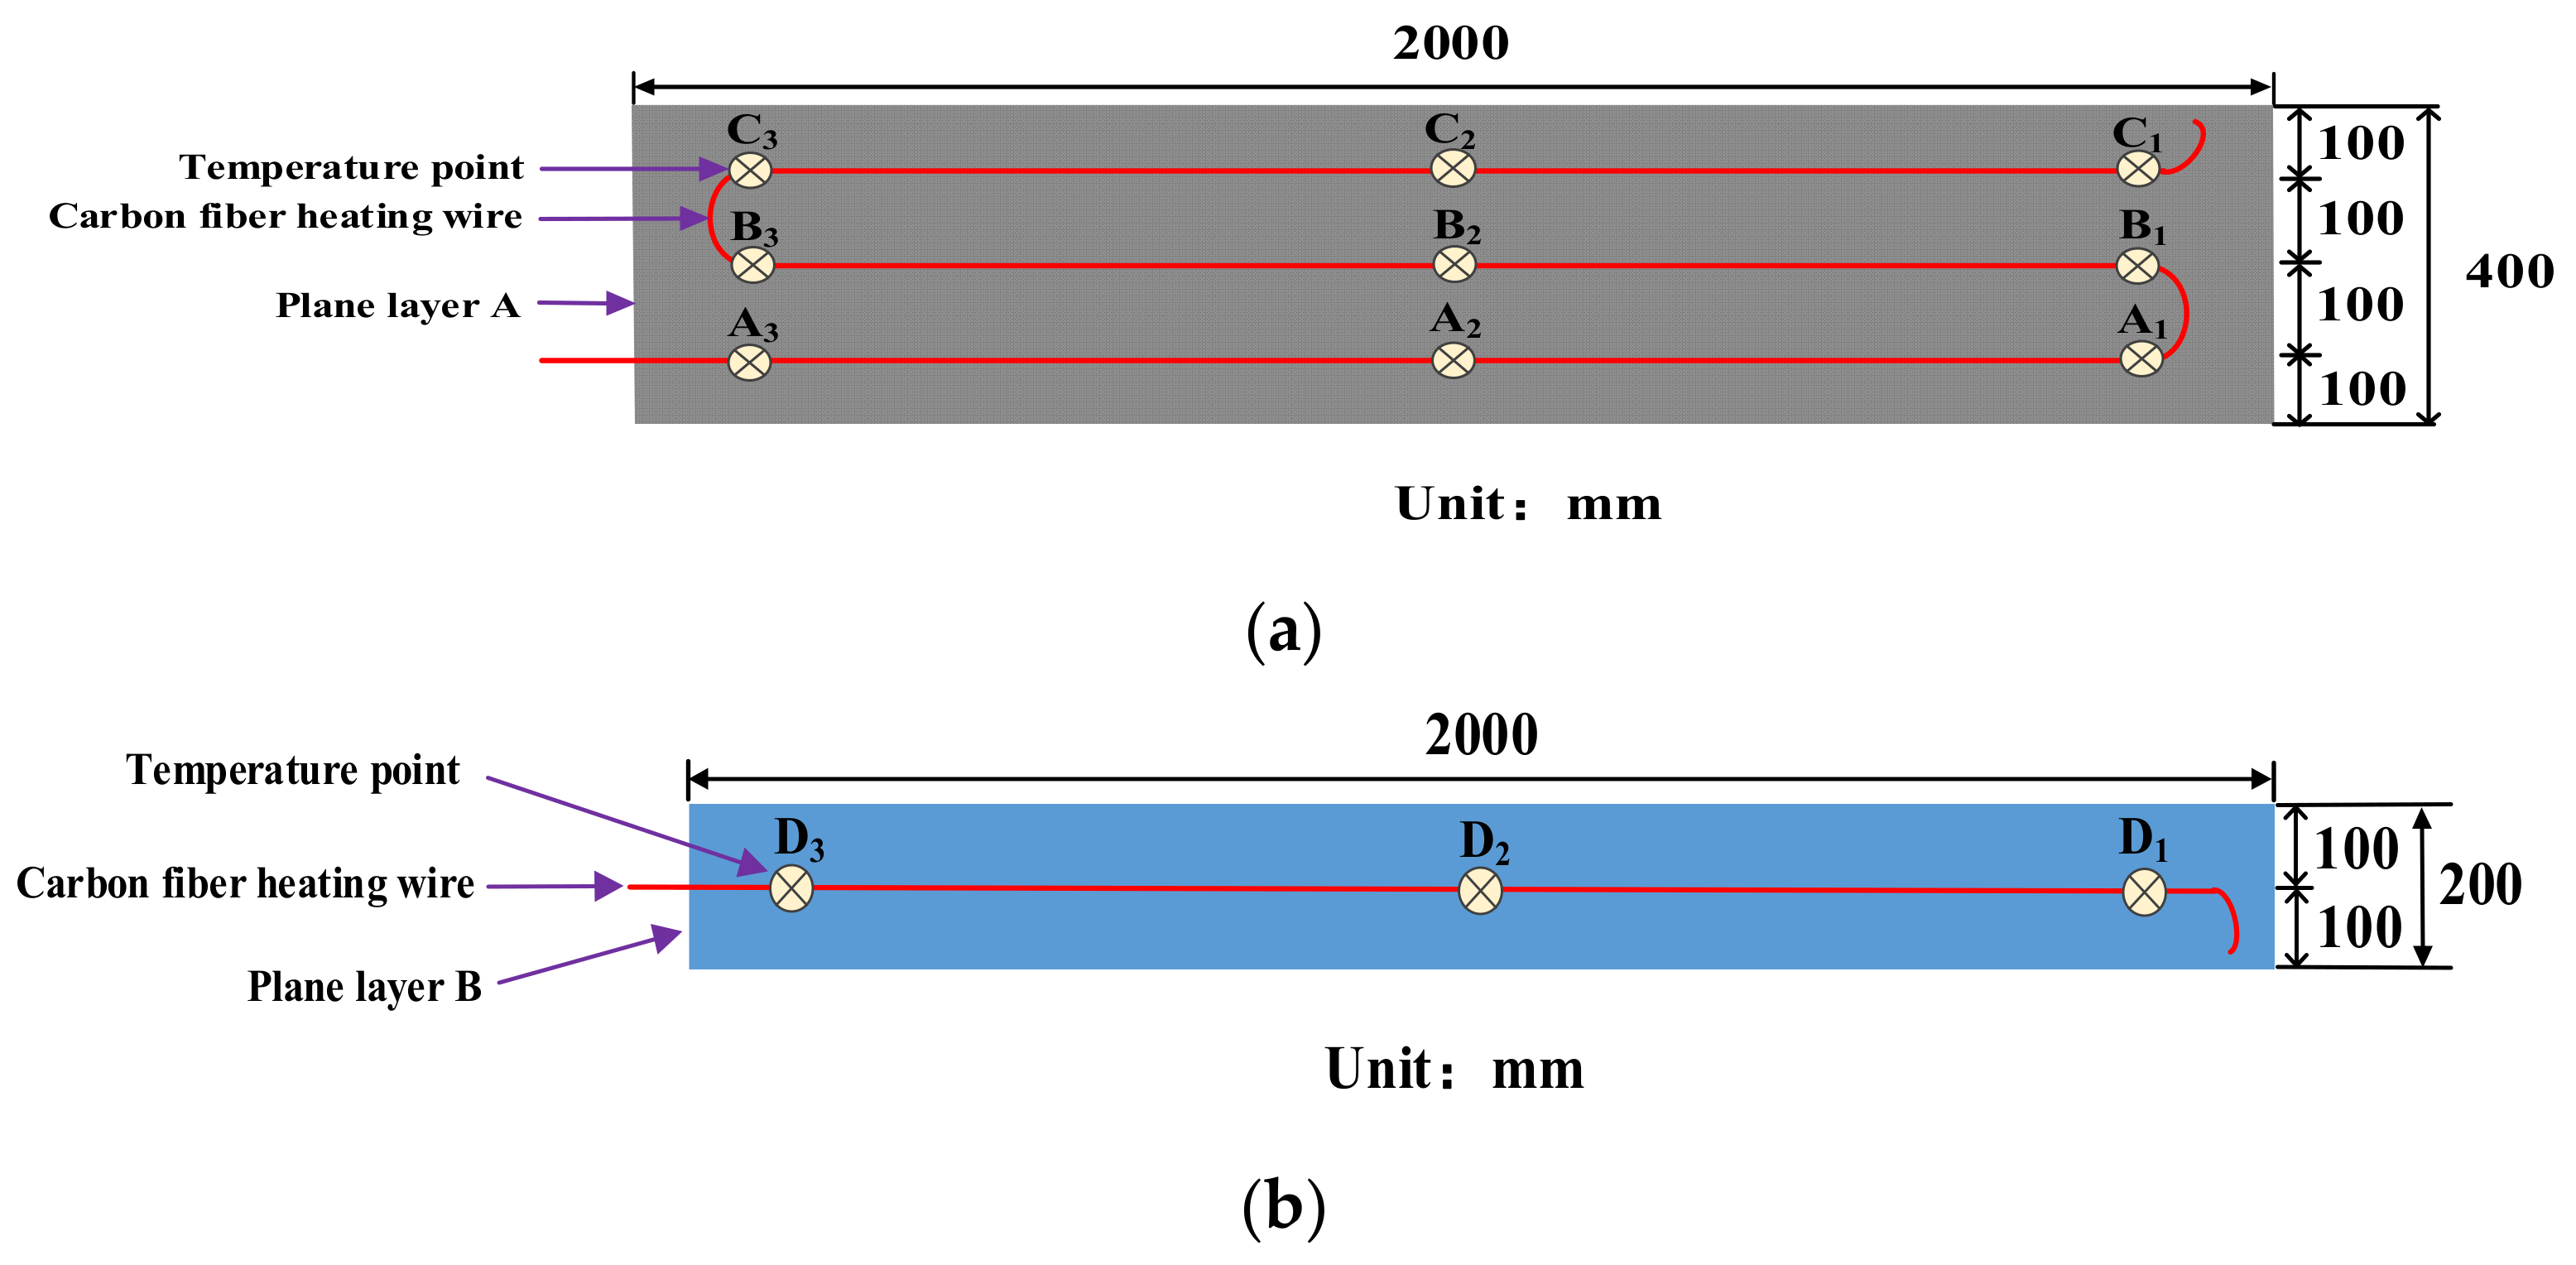
2.1. Experimental Design
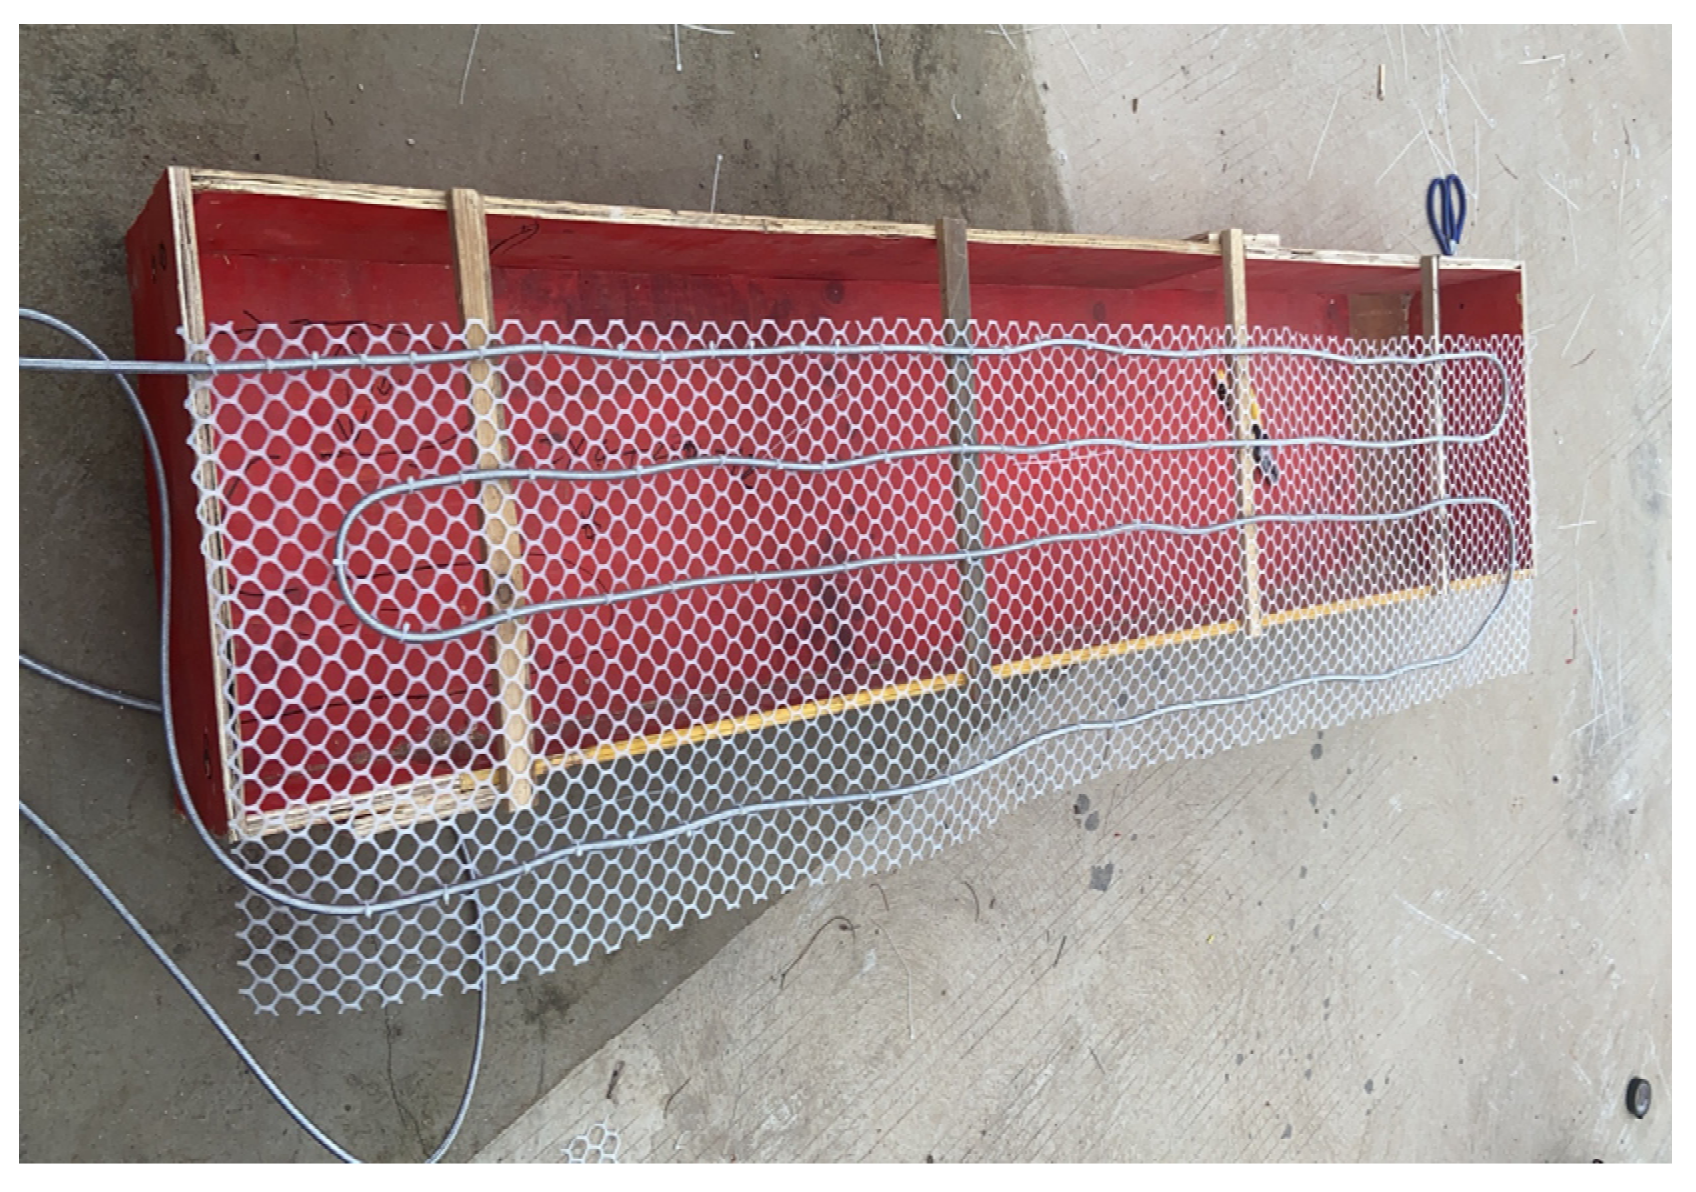
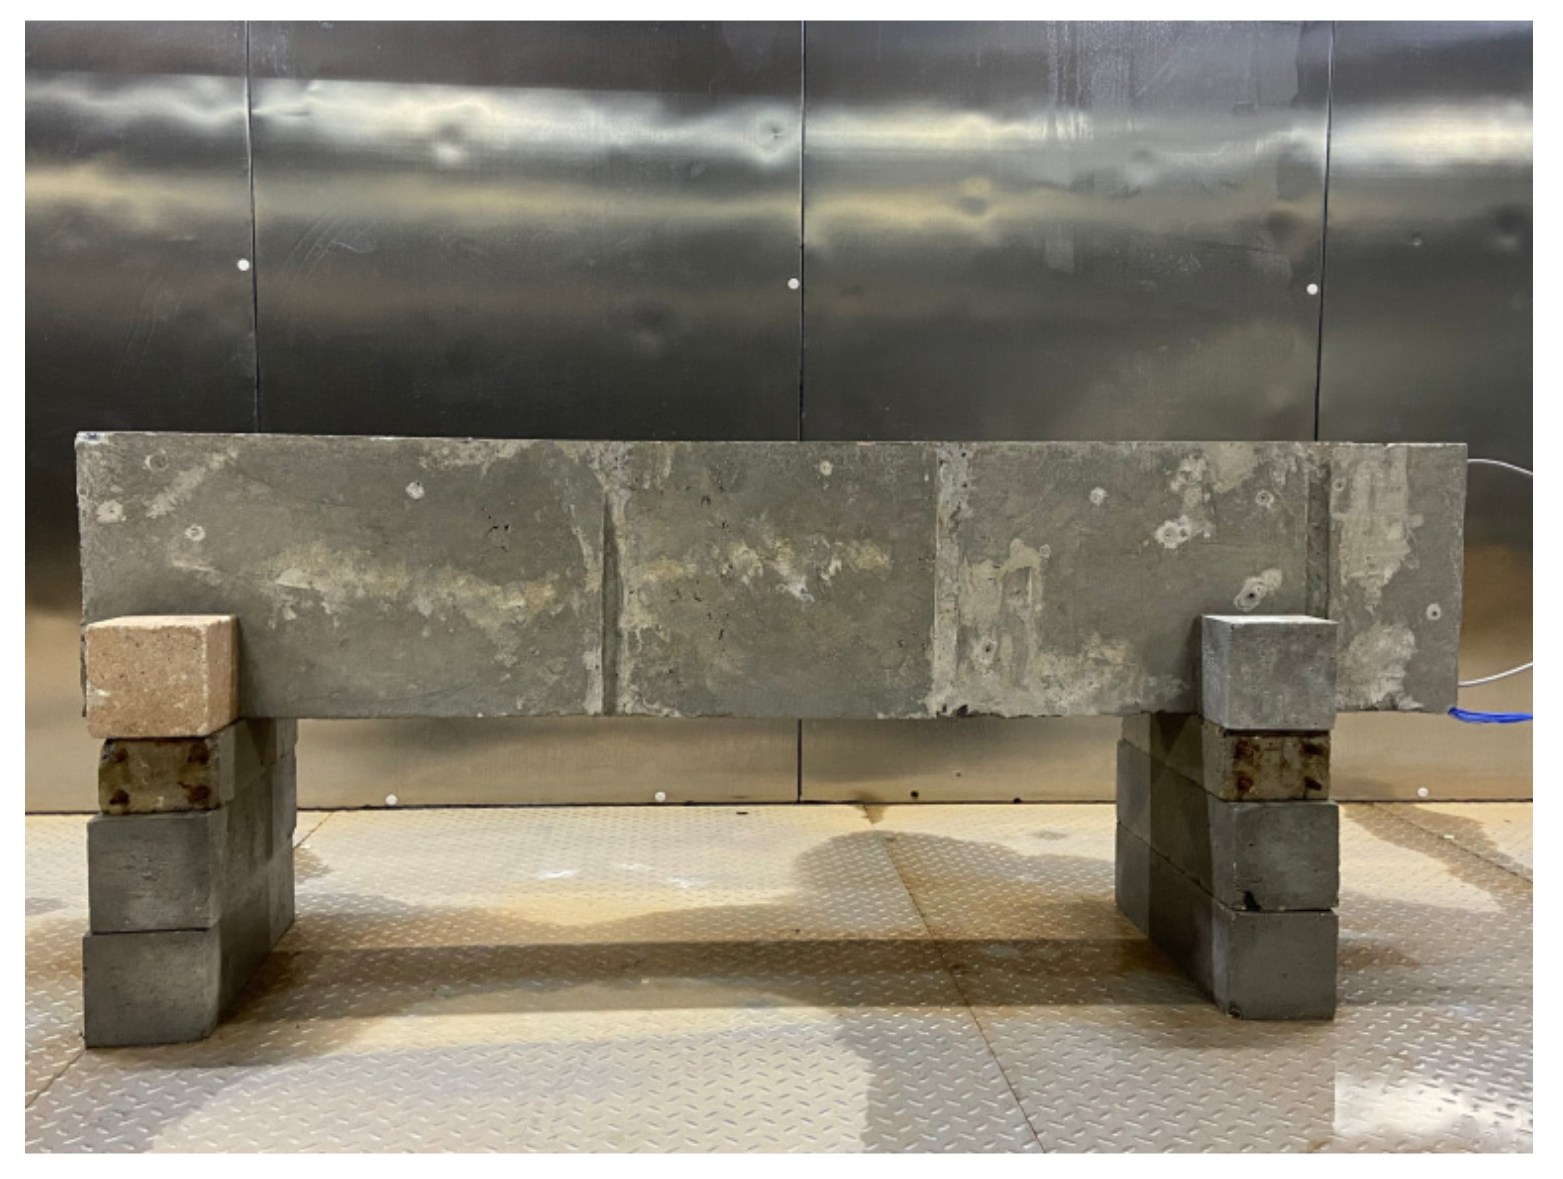
2.2. Model Making
2.3. Test Systems
- (1)
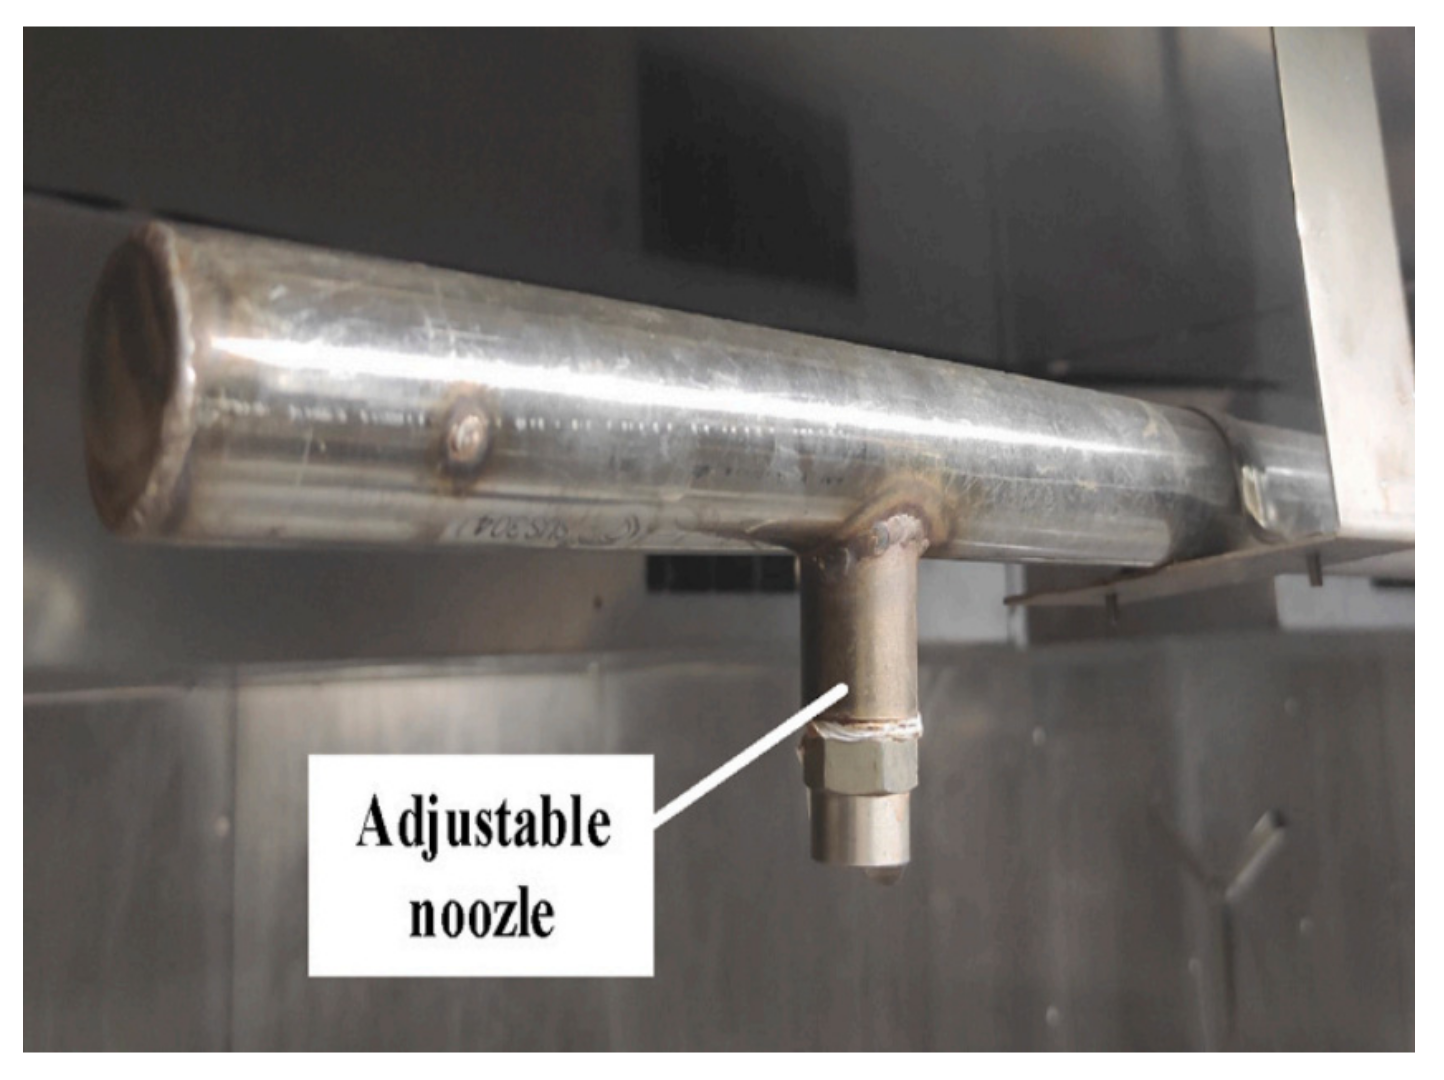
- Spraying system
- (2)
- Wind speed simulation system
- (3)
- Surveillance system
- (4)
- Data acquisition system
2.4. Test Materials and Equipment
2.4.1. Constant Temperature test Chamber with Carbon Fiber Heating Line
2.4.2. Temperature Measuring Instruments and Temperature Measuring Lines
2.5. Test Conditions
2.5.1. Crossbeam Icing Test Conditions
2.5.2. Crossbeam Ice Melt Test Conditions
3. Results and Discussion
3.1. Crossbeam Icing Test
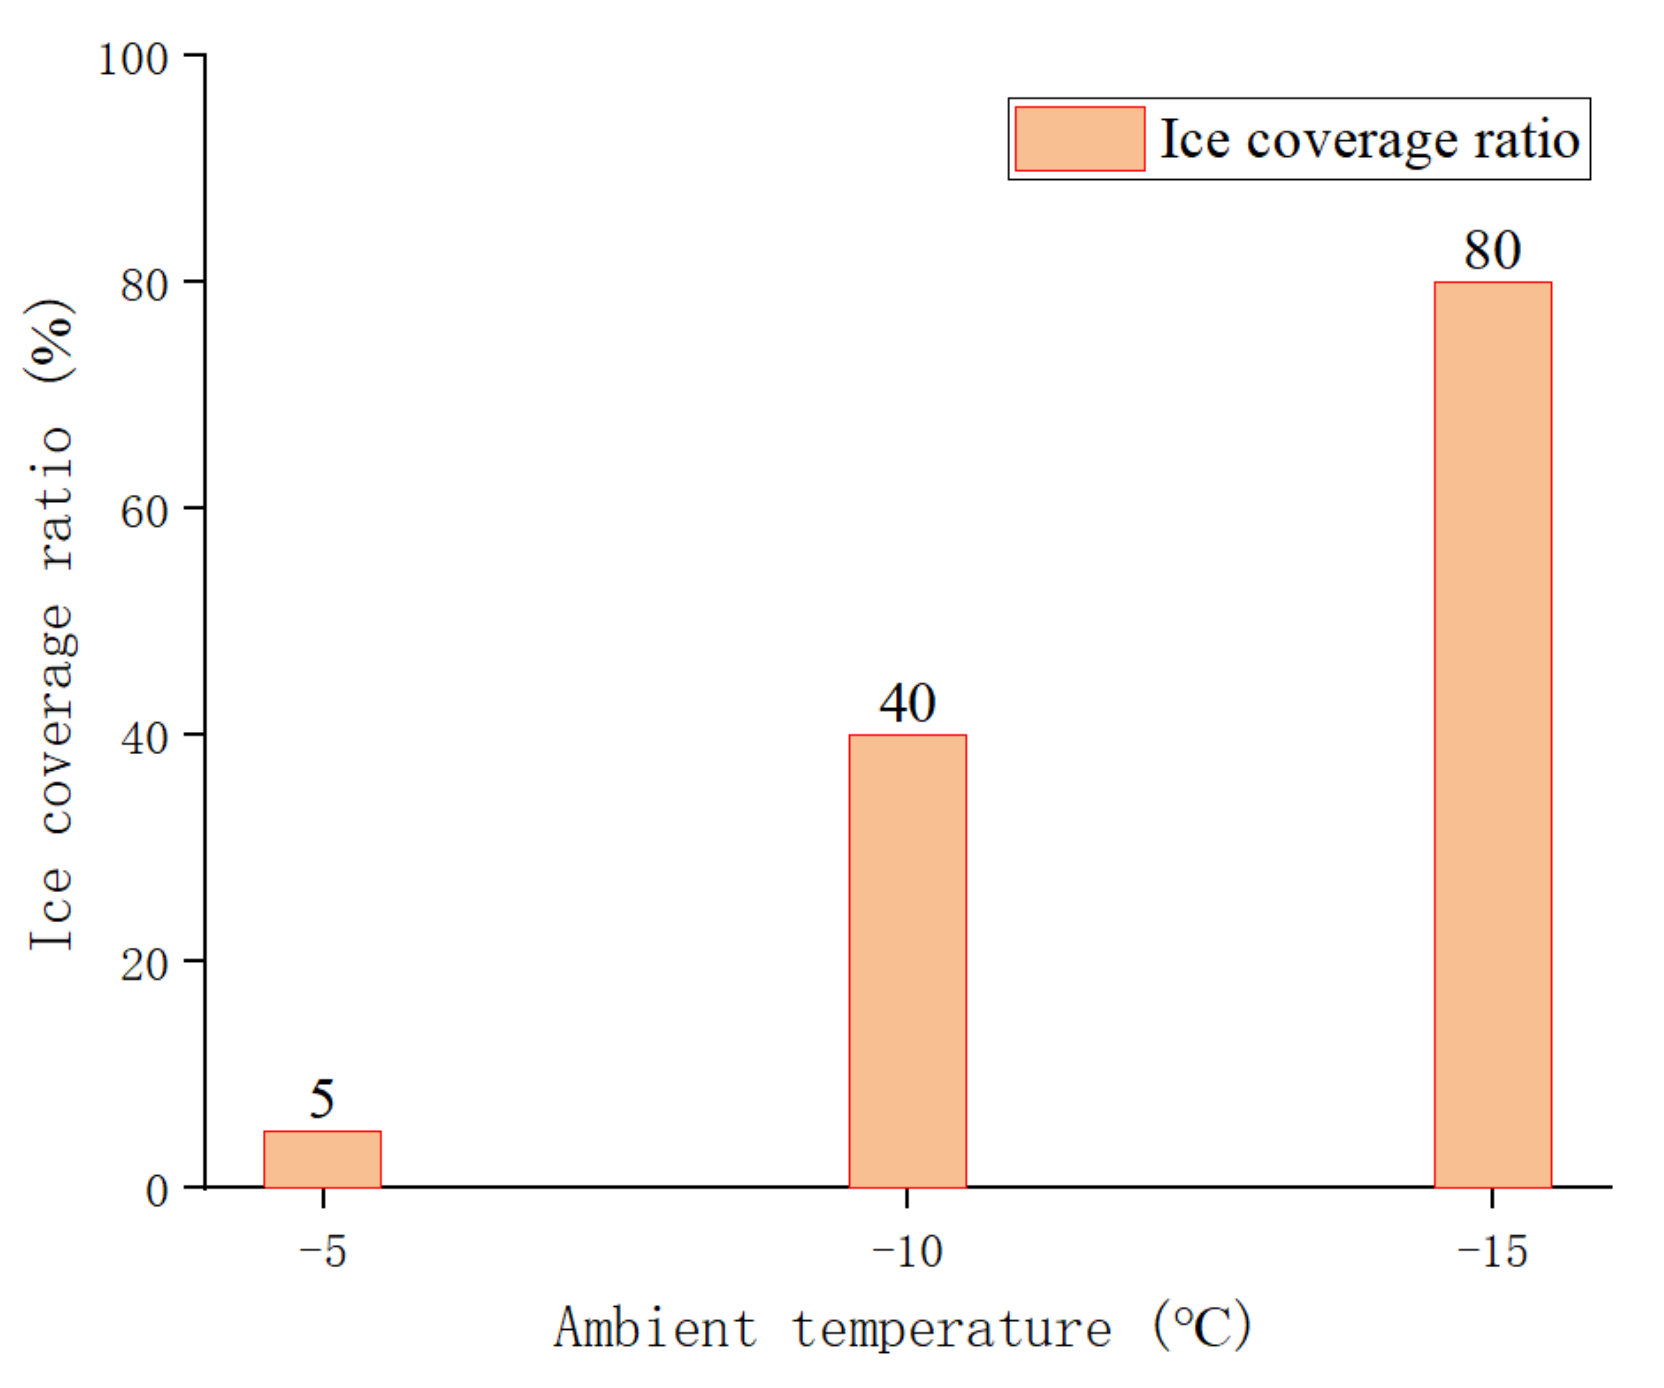
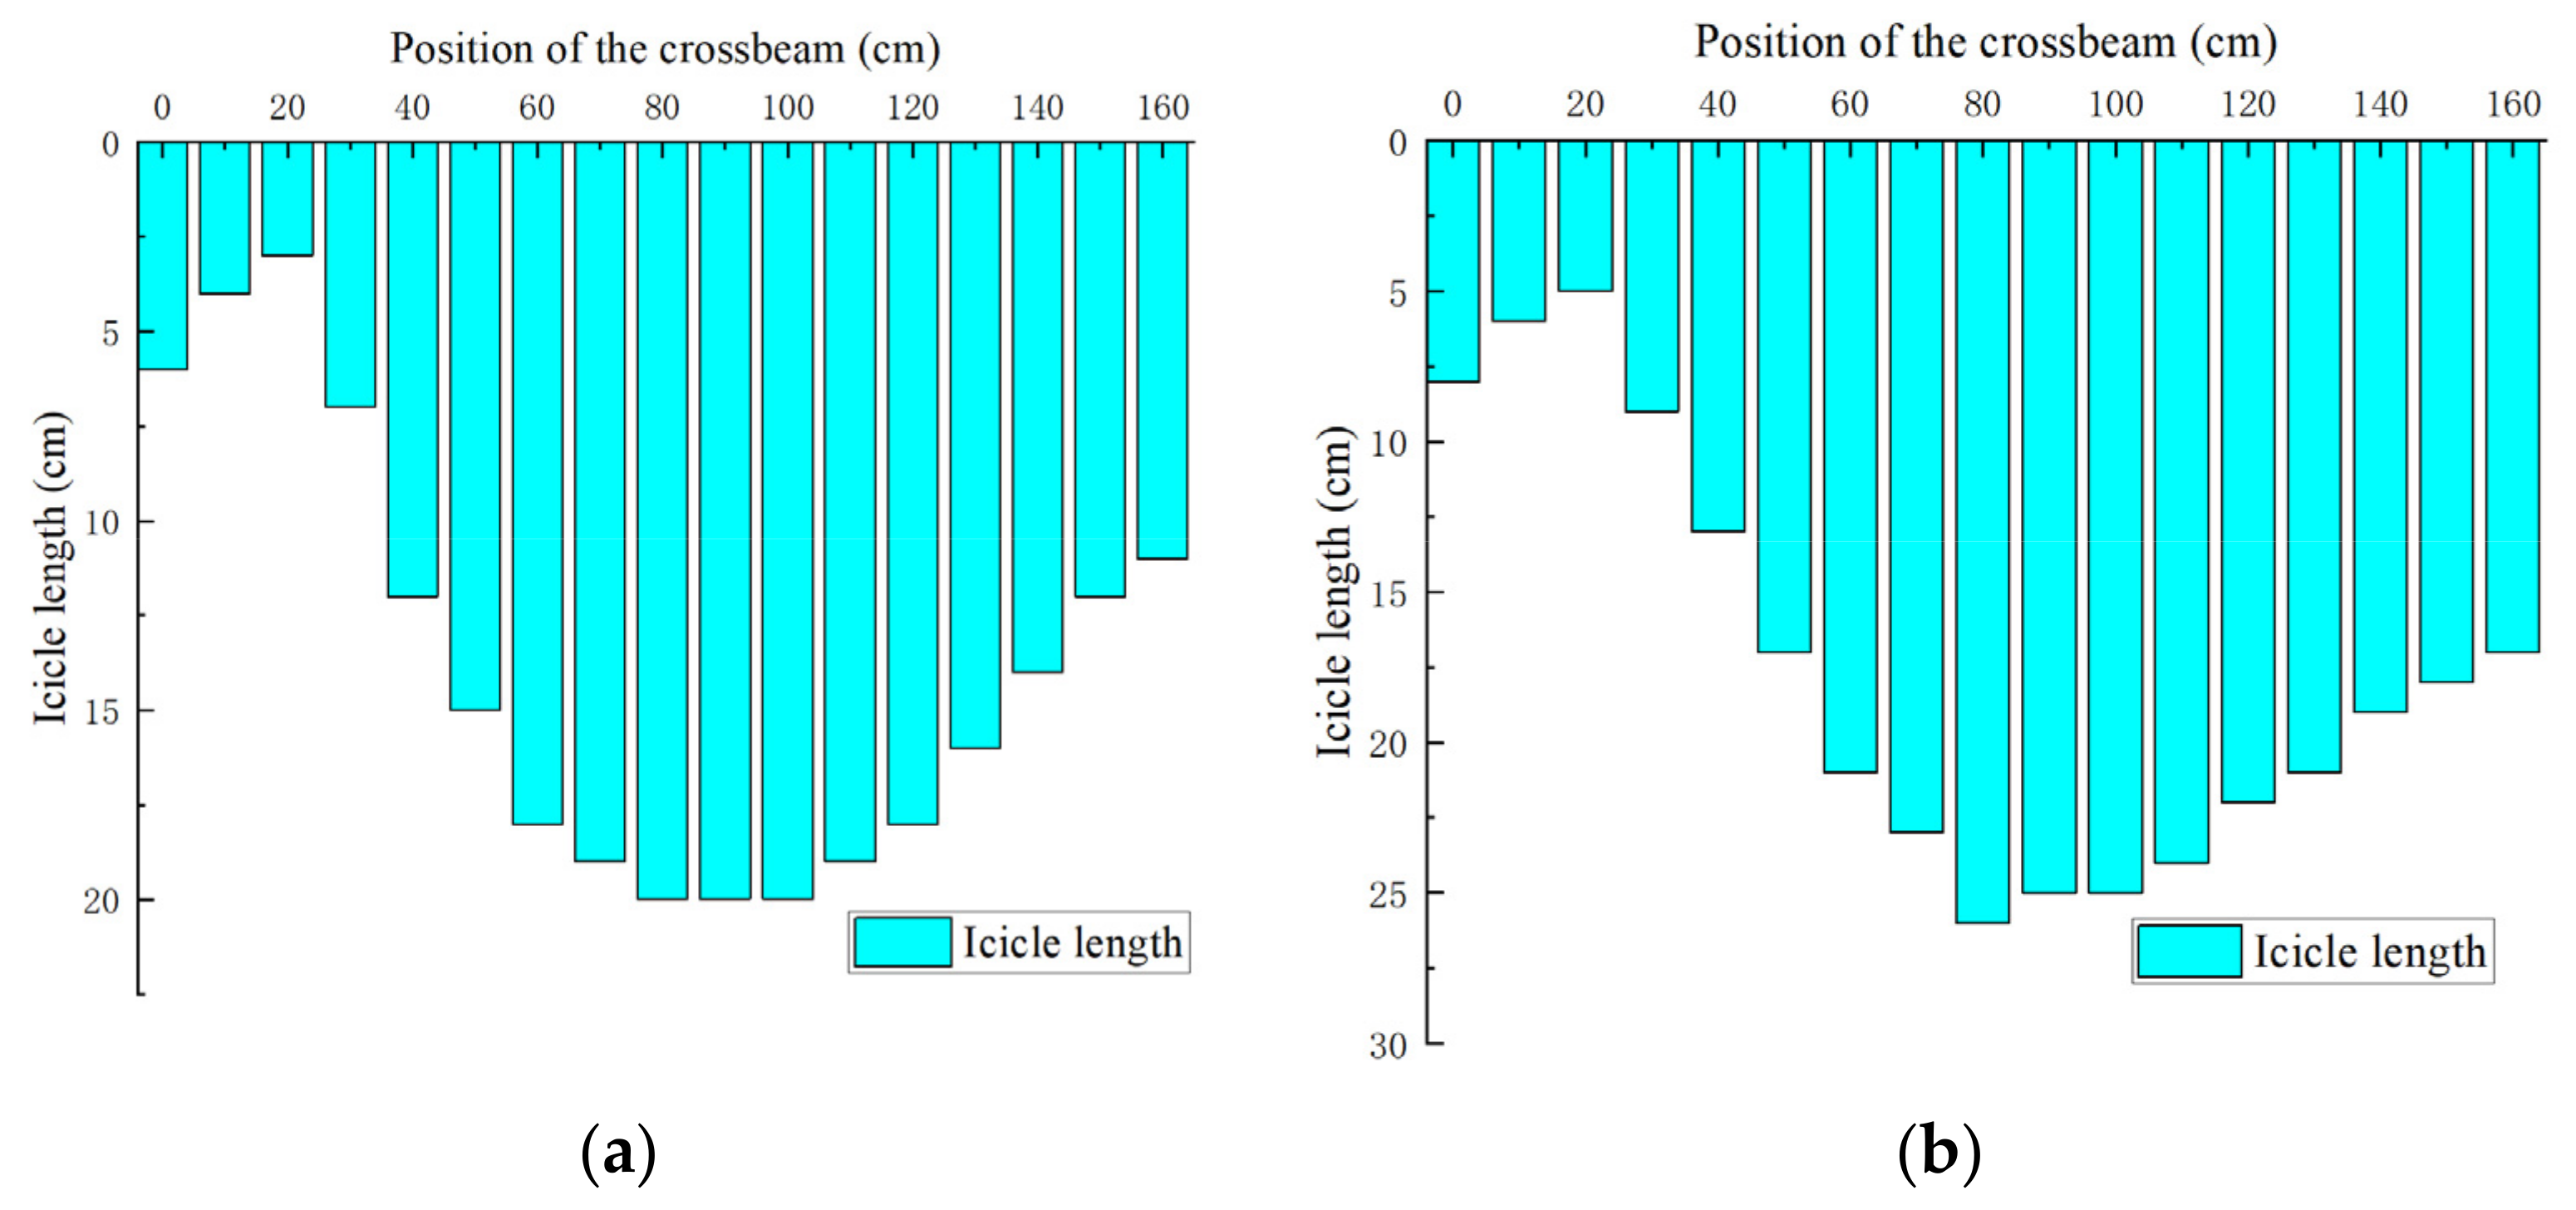
3.1.1. Influence of Ambient Temperature on Crossbeam Icing
3.1.2. Effect of Wind Speed on Crossbeam Icing
3.2. Crossbeam Ice Melt Test
3.2.1. Influence of Ambient Temperature on Crossbeam Ice Melt
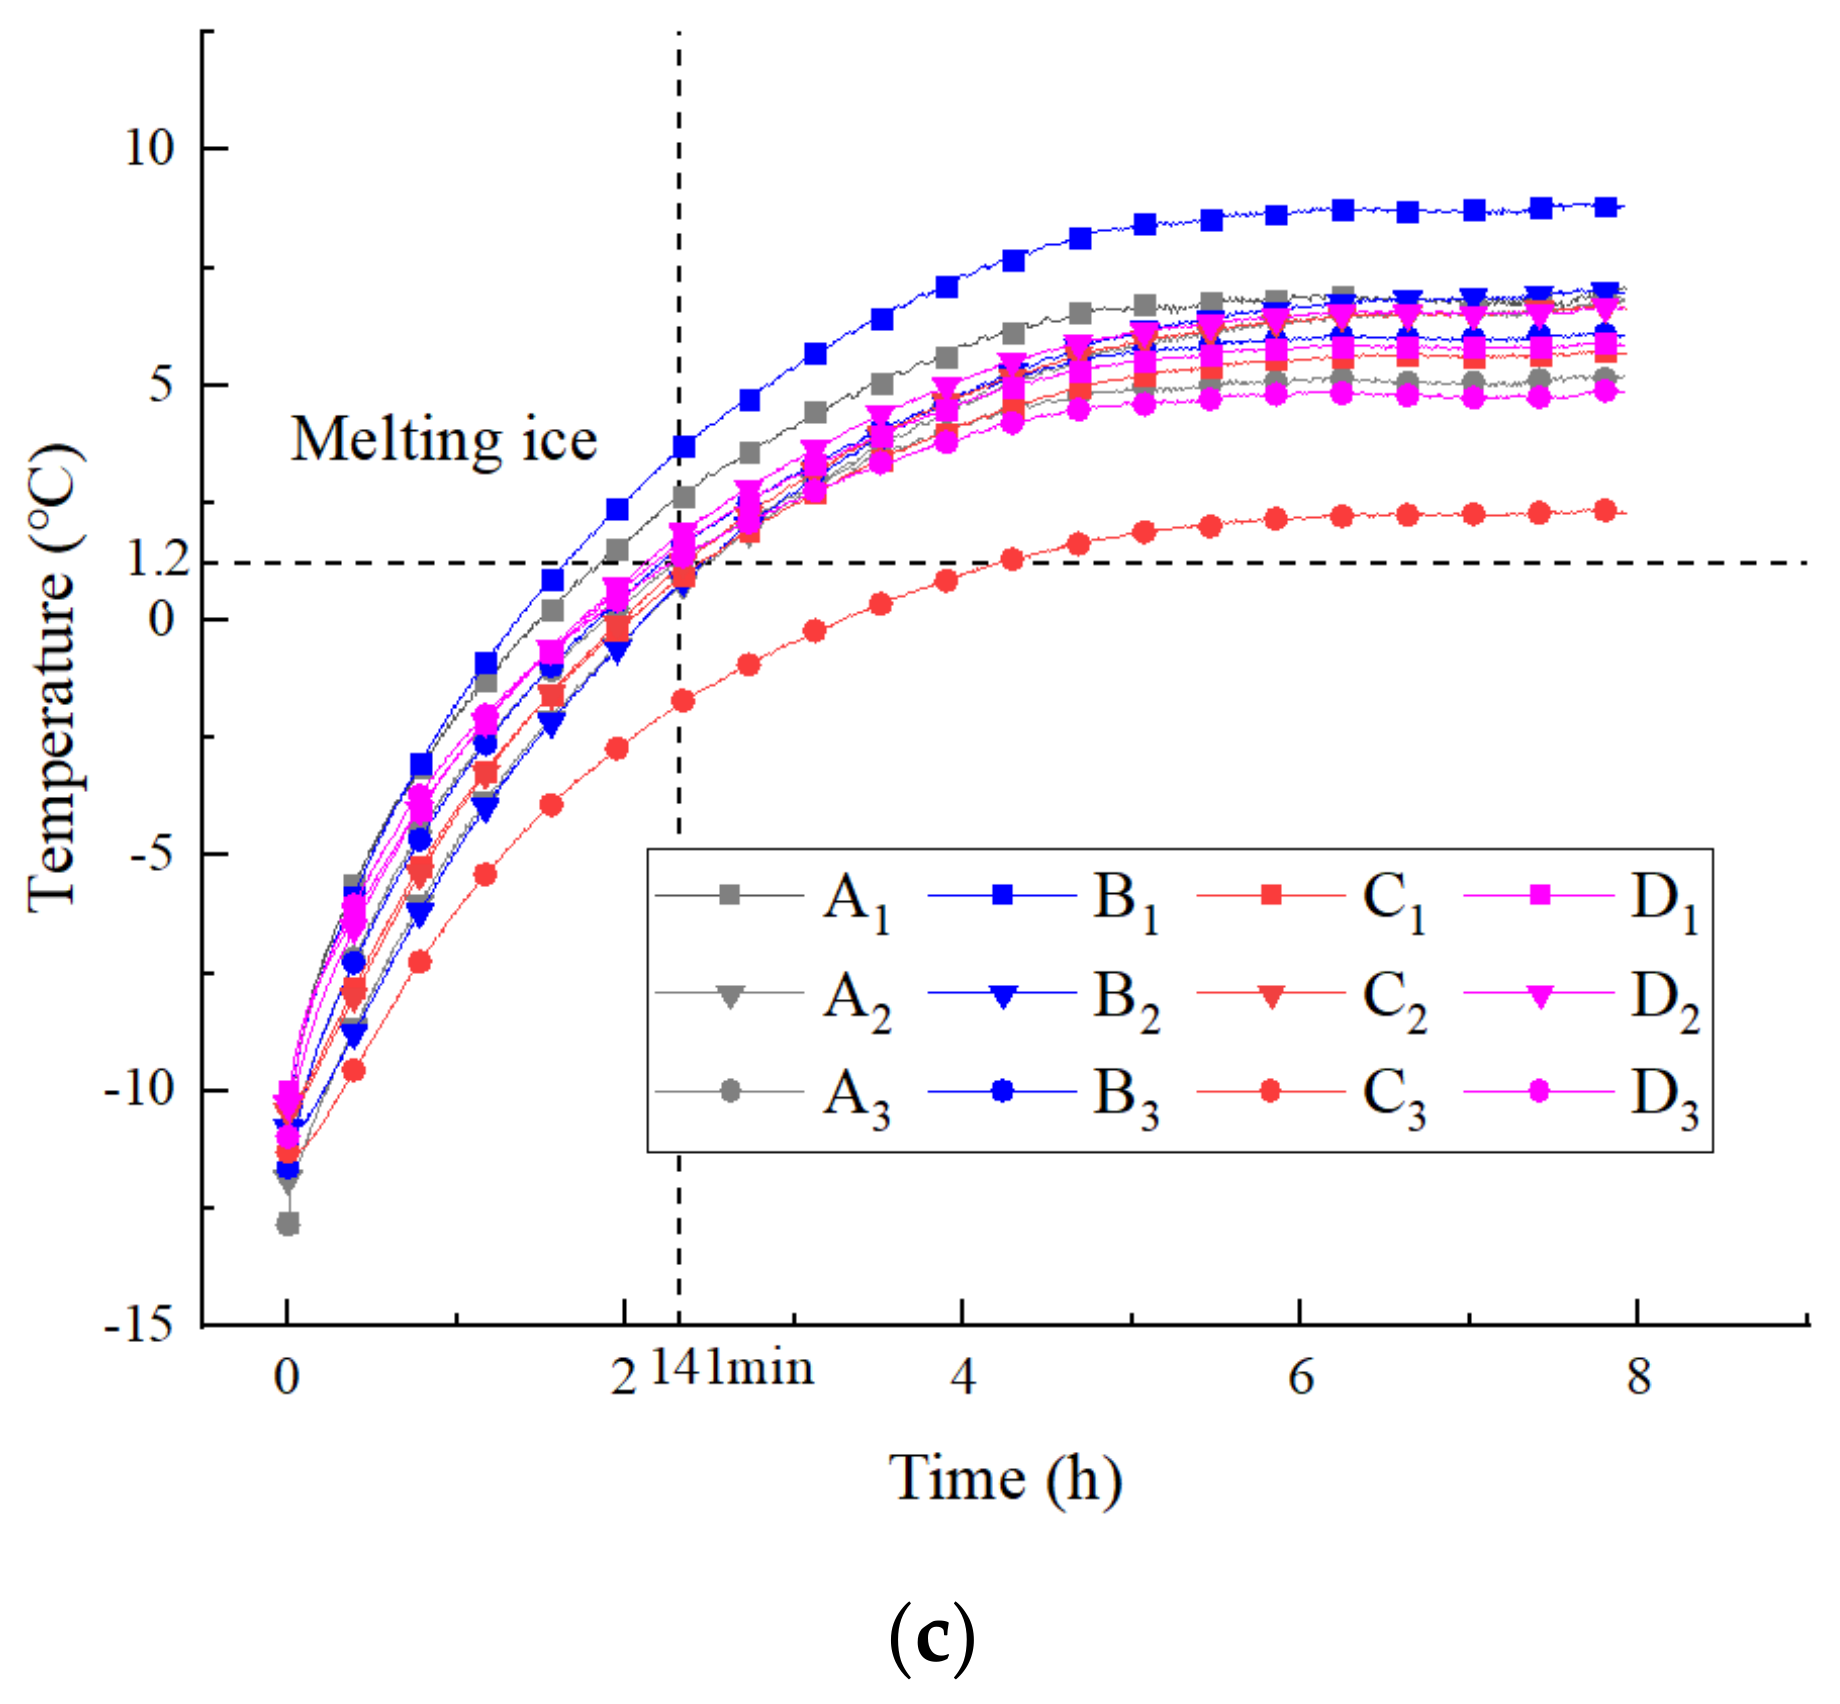
3.2.2. Effect of Wind Speed on Crossbeam Ice Melt
4. Conclusions
- (1)
- This paper proposes a method for melting snow and ice on bridge tower crossbeams with pre-buried carbon fiber hot wire, which is fast, accurate, stable, energy-saving, and efficient.
- (2)
- The ambient temperature and wind speed will affect beam icing. Decreasing the ambient temperature will increase the length of the icicles, whereas increasing the wind speed will increase the length and thickness of the icicles, thus exacerbating the potential threat.
- (3)
- The lower the ambient temperature, the higher the ice coverage on the side of the beam, and the higher the adhesion force, making it more difficult to melt the ice. The critical temperature of the bridge beam ice melt is influenced by the ambient temperature and wind speed; this is negatively correlated with the ambient temperature and positively correlated with the wind speed.
- (4)
- At an ambient temperature of −15 °C and a wind speed of 4.5 m/s, the average internal temperature of the beam after heating and stabilization is 1.37 °C, which is higher than the average critical temperature of 1.31 °C for the beam to melt ice under this condition. This temperature is sufficient to melt ice, verifying the feasibility of this solution and is a reliable reference for the practical application of ice melting in bridge tower beams.
Author Contributions
Funding
Institutional Review Board Statement
Informed Consent Statement
Data Availability Statement
Conflicts of Interest
References
- Mirzanamadi, R.; Hagentoft, C.E.; Johansson, P. Coupling a Hydronic Heating Pavement to a Horizontal Ground Heat Exchanger for harvesting solar energy and heating road surfaces. Renew. Energy 2020, 147, 447–463. [Google Scholar] [CrossRef]
- Andre, J.; Kiremidjian, A.; Georgakis, C.T. Statistical Modeling of Time Series for Ice Accretion Detection on Bridge Cables. J. Cold. Reg. Eng. 2018, 32, 04018004. [Google Scholar] [CrossRef]
- Yang, Z.Y.; Zhan, X.; Zhou, X.L.; Xiao, H.L.; Pei, Y.Y. The Icing Distribution Characteristics Research of Tower Cross Beam of Long-Span Bridge by Numerical Simulation. Energies 2021, 14, 5584. [Google Scholar] [CrossRef]
- Bao, M. Design Method of Built-in Carbon Fiber Ice-melting Pavement. J. Chang. Univ. 2017. [Google Scholar]
- Tuan, Y. Roca Spur Bridge: The Implementation of an Innovative Deicing Technology. J. Cold Reg. Eng. 2008, 22, 1–15. [Google Scholar] [CrossRef]
- Malakooti, A.; Theh, W.S.; Sadati, S.M.S.; Ceylan, H.; Kim, S.; Mina, M.; Cetin, K.; Taylor, P.C. Design and Full-scale Implementation of the Largest Operational Electrically Conductive Concrete Heated Pavement System. Constr. Build. Mater. 2020, 255, 119229. [Google Scholar] [CrossRef]
- Sassani, A.; Arabzadeh, A.; Ceylan, H.; Kim, S.; Sajed Sadati, S.M.; Gopalakrishnan, K.; Taylor, P.C.; Abdualla, H. Carbon Fiber-based Electrically Conductive Concrete for Salt-free Deicing of Pavements. J. Clean. Prod. 2018, 203, 799–809. [Google Scholar] [CrossRef]
- Xie, X.M.; Su, J.F.; Guo, Y.D.; Wang, L.Q. Evaluation of a cleaner de-icing production of bituminous material blending with graphene by electrothermal energy conversion. J. Clean. Prod. 2020, 274, 122947. [Google Scholar] [CrossRef]
- Dehghanpour, H.; Yilmaz, K. Heat Behavior of Electrically Conductive Concretes with and without Rebar Reinforcement. Mater. Sci. 2020, 26, 471–476. [Google Scholar] [CrossRef]
- Wang, X.; Zhu, Y.; Zhu, M.; Zhu, Y.; Fan, H.; Wang, Y. Thermal analysis and optimization of an ice and snow melting system using geothermy by super-long flexible heat pipes. Appl. Therm. Eng. 2017, 112, 1353–1363. [Google Scholar] [CrossRef]
- Ozsoy, A.; Yildirim, R. Prevention of icing with ground source heat pipe: A theoretical analysis for Turkey’s climatic conditions. Cold Reg. Sci. Technol. 2016, 125, 65–71. [Google Scholar] [CrossRef]
- Yiqiu, T.; Chi, Z.; Huijie, L.; Hao, S.; Huining, X. Experimental and numerical analysis of the critical heating strategy for hydronic heated snow melting airfield runway. Appl. Therm. Eng. 2020, 178, 115508. [Google Scholar] [CrossRef]
- Lei, G.; Yu, X.; Li, T.; Habibzadeh-Bigdarvish, O.; Wang, X.; Mrinal, M.; Luo, C. Feasibility study of a new attached multi-loop CO2 heat pipe for bridge deck de-icing using geothermal energy. J. Clean. Prod. 2020, 275, 123160. [Google Scholar] [CrossRef]
- Mirzanamadi, R.; Hagentoft, C.E.; Johansson, P. An analysis of hydronic heating pavement to optimize the required energy for anti-icing. Appl. Therm. Eng. 2018, 144, 278–290. [Google Scholar] [CrossRef]
- Yu, X.; Hurley, M.T.; Li, T.; Lei, G.; Pedarla, A.; Puppala, A.J. Experimental feasibility study of a new attached hydronic loop design for geothermal heating of bridge decks. Appl. Therm. Eng. 2020, 164, 114507. [Google Scholar] [CrossRef]
- Habibzadeh-Bigdarvish, O.; Yu, X.; Li, T.; Lei, G.; Banerjee, A.; Puppala, A.J. Novel full-scale external geothermal heating system for bridge deck de-icing. Appl. Therm. Eng. 2021, 185, 116365. [Google Scholar] [CrossRef]
- Zhao, H.; Wu, Z.; Wang, S.; Zheng, J.; Che, G. Concrete pavement deicing with carbon fiber heating wires. Cold Reg. Sci. Technol. 2011, 65, 413–420. [Google Scholar] [CrossRef]
- Liu, K.; Huang, S.; Xie, H.; Wang, F. Multi-objective optimization of the design and operation for snow-melting pavement with electric heating pipes. Appl. Therm. Eng. 2017, 122, 359–367. [Google Scholar] [CrossRef]
- Liu, X.; Rees, S.J.; Spitler, J.D. Modeling snow melting on heated pavement surfaces. Part II: Experimental validation. Appl. Therm. Eng. 2007, 27, 1125–1131. [Google Scholar] [CrossRef]
- Tan, Y.; Zhu, Y.; Xiao, H. Model experimental study of carbon fiber heating wire for deicing and snow melting on a bridge deck. Adv. Civ. Eng. 2020, 2020, 1–15. [Google Scholar] [CrossRef]
- Li, C.; Xu, W.; Li, Q.; Liu, X. Experimental study on temperature rise law of continuous carbon fiber self-heating airport pavement. Compos. Sci. Eng. (Chin.) 2015, 11, 64–70. [Google Scholar]
- Zhang, D.; Zhang, Z.; Yuan, J.; Yuan, T.; Li, K.; Chen, Y. Experimental study on de-icing system of highway bridge heating cable. Safety Product. Sci. Technol. Chin. 2015, 11, 90–95. [Google Scholar]
- Mohammed, A.G.; Ozgur, G.; Sevkat, E. Electrical resistance heating for deicing and snow melting applications: Experimental study. Cold Reg. Sci. Technol. 2019, 160, 128–138. [Google Scholar] [CrossRef]
- Zhao, H.; Wu, Z.; Wang, S.; Zheng, J.; Che, G. Concrete slab installed with carbon fiber heating wire for bridge deck deicing. J. Transport. Eng. 2010, 136, 500–509. [Google Scholar] [CrossRef]
- Guo, B. Research on snow and ice melting technology of pre-buried carbon fiber heating line asphalt concrete bridge deck. J. Henan Univ. 2018, 6, 34–43. [Google Scholar]
- Liu, X.; Rees, S.J.; Spitler, J.D. Modeling snow melting on heated pavement surfaces. Part I: Model development. Appl. Therm. Eng. 2007, 27, 1115–1124. [Google Scholar] [CrossRef]
- Liu, K.; Dai, D.; Fu, C.; Li, W.; Li, S. Structural investigation of the snow-melting heated bridge deck based on the thermal field distribution. Appl. Therm. Eng. 2019, 161, 114132. [Google Scholar] [CrossRef]


| Model Size (m) | Carbon Fiber Heating Line Pitch (cm) | Carbon Fiber Heating Line Depth (mm) | Temperature Measurement Line Depth (mm) |
|---|---|---|---|
| 2 × 0.4 × 0.2 | 10 | 30 | 30 |
| Diameter (mm) | Length (m) | Resistance Value (Ω/m) | Wire Power (W/m) | Thermal Efficiency (%) | Tensile Strength (MPa) | Compressive Strength (MPa) |
|---|---|---|---|---|---|---|
| 6.0 | 14 | 8 | 30.9 | 98.2 | 40.4 | 60.8 |
| Working Conditions | Ambient Temperature (°C) | Wind Speed (m/s) | Rainfall (mm/h) | Spraying Time (h) |
|---|---|---|---|---|
| 1 | −5 °C | 0 m/s | 30 | 1 |
| 2 | −10 °C | 0 m/s | 30 | 1 |
| 3 | −15 °C | 0 m/s | 30 | 1 |
| 4 | −15 °C | 4.5 m/s | 30 | 1 |
| Working Conditions | Ambient Temperature (°C) | Wind Speed (m/s) | Rainfall (mm/h) | Spraying Time (h) |
|---|---|---|---|---|
| 5 | −5 °C | 0 m/s | 30 | 1 |
| 6 | −10 °C | 0 m/s | 30 | 1 |
| 7 | −15 °C | 0 m/s | 30 | 1 |
| 8 | −5 °C | 4.5 m/s | 30 | 1 |
| 9 | −10 °C | 4.5 m/s | 30 | 1 |
| 10 | −15 °C | 4.5 m/s | 30 | 1 |
| Ambient Temperature (°C) | Maximum Length of Icicle (cm) | Minimum Length of Icicle (cm) | Average Length of Icicle (cm) | Ice Thickness on the Side of the Crossbeam (cm) |
|---|---|---|---|---|
| −5 | 13 | 5 | 8.63 | 0.3 |
| −10 | 20 | 8 | 13.58 | 0.6 |
| −15 | 25 | 12 | 18.56 | 1.0 |
| Ambient Temperature (°C) | Wind Speed (m/s) | Maximum Length of Icicle (cm) | Minimum Length of Icicle (cm) | Average Length of Icicle (cm) | Ice Thickness on the Side of the Crossbeam (cm) |
|---|---|---|---|---|---|
| −15 | 0 | 25 | 12 | 18.56 | 1 |
| −15 | 4.5 | 34 | 20 | 26.34 | 3 |
| Ambient Temperature (°C) | Initial Temperature (°C) | 4 h Temperature (°C) | 0–4 h Temperature Rise Rate (°C/h) | 6 h Temperature (°C) | 4–6 h Temperature Rise Rate (°C/h) | 8 h Temperature (°C) |
|---|---|---|---|---|---|---|
| −5 | −3.69 | 5.84 | 4.77 | 9.31 | 0.87 | 10.38 |
| −10 | −8.68 | 3.07 | 5.88 | 7.31 | 1.06 | 7.94 |
| −15 | −9.99 | −0.97 | 4.51 | 1.03 | 0.5 | 1.3 |
| Ambient Temperature (°C) | Initial Temperature (°C) | 2 h Temperature (°C) | 0–2 h Temperature Rise Rate (°C/h) | 6 h Temperature (°C) | 2–6 h Temperature Rise Rate (°C/h) | 8 h Temperature (°C) |
|---|---|---|---|---|---|---|
| −5 | −2.87 | 15.99 | 4.72 | 19.03 | 1.52 | 20.28 |
| −10 | −8.63 | 8.8 | 4.36 | 11.88 | 1.54 | 13.36 |
| −15 | 11.19 | 4.53 | 3.93 | 5.87 | 0.67 | 6.04 |
Disclaimer/Publisher’s Note: The statements, opinions and data contained in all publications are solely those of the individual author(s) and contributor(s) and not of MDPI and/or the editor(s). MDPI and/or the editor(s) disclaim responsibility for any injury to people or property resulting from any ideas, methods, instructions or products referred to in the content. |
© 2023 by the authors. Licensee MDPI, Basel, Switzerland. This article is an open access article distributed under the terms and conditions of the Creative Commons Attribution (CC BY) license (https://creativecommons.org/licenses/by/4.0/).
Share and Cite
Chen, Z.; Lu, J.; Mao, A.; Xi, L.; Li, W.; Ma, Q.; Xiao, H. Experimental Study on Ice Melting of Bridge Tower Crossbeams under Different Conditions. Appl. Sci. 2023, 13, 6630. https://doi.org/10.3390/app13116630
Chen Z, Lu J, Mao A, Xi L, Li W, Ma Q, Xiao H. Experimental Study on Ice Melting of Bridge Tower Crossbeams under Different Conditions. Applied Sciences. 2023; 13(11):6630. https://doi.org/10.3390/app13116630
Chicago/Turabian StyleChen, Zhi, Jian Lu, Anqi Mao, Lei Xi, Wentao Li, Qiang Ma, and Henglin Xiao. 2023. "Experimental Study on Ice Melting of Bridge Tower Crossbeams under Different Conditions" Applied Sciences 13, no. 11: 6630. https://doi.org/10.3390/app13116630
APA StyleChen, Z., Lu, J., Mao, A., Xi, L., Li, W., Ma, Q., & Xiao, H. (2023). Experimental Study on Ice Melting of Bridge Tower Crossbeams under Different Conditions. Applied Sciences, 13(11), 6630. https://doi.org/10.3390/app13116630