
Development Pattern of Toppling Deformation Slopes in Western China


Abstract
:1. Introduction
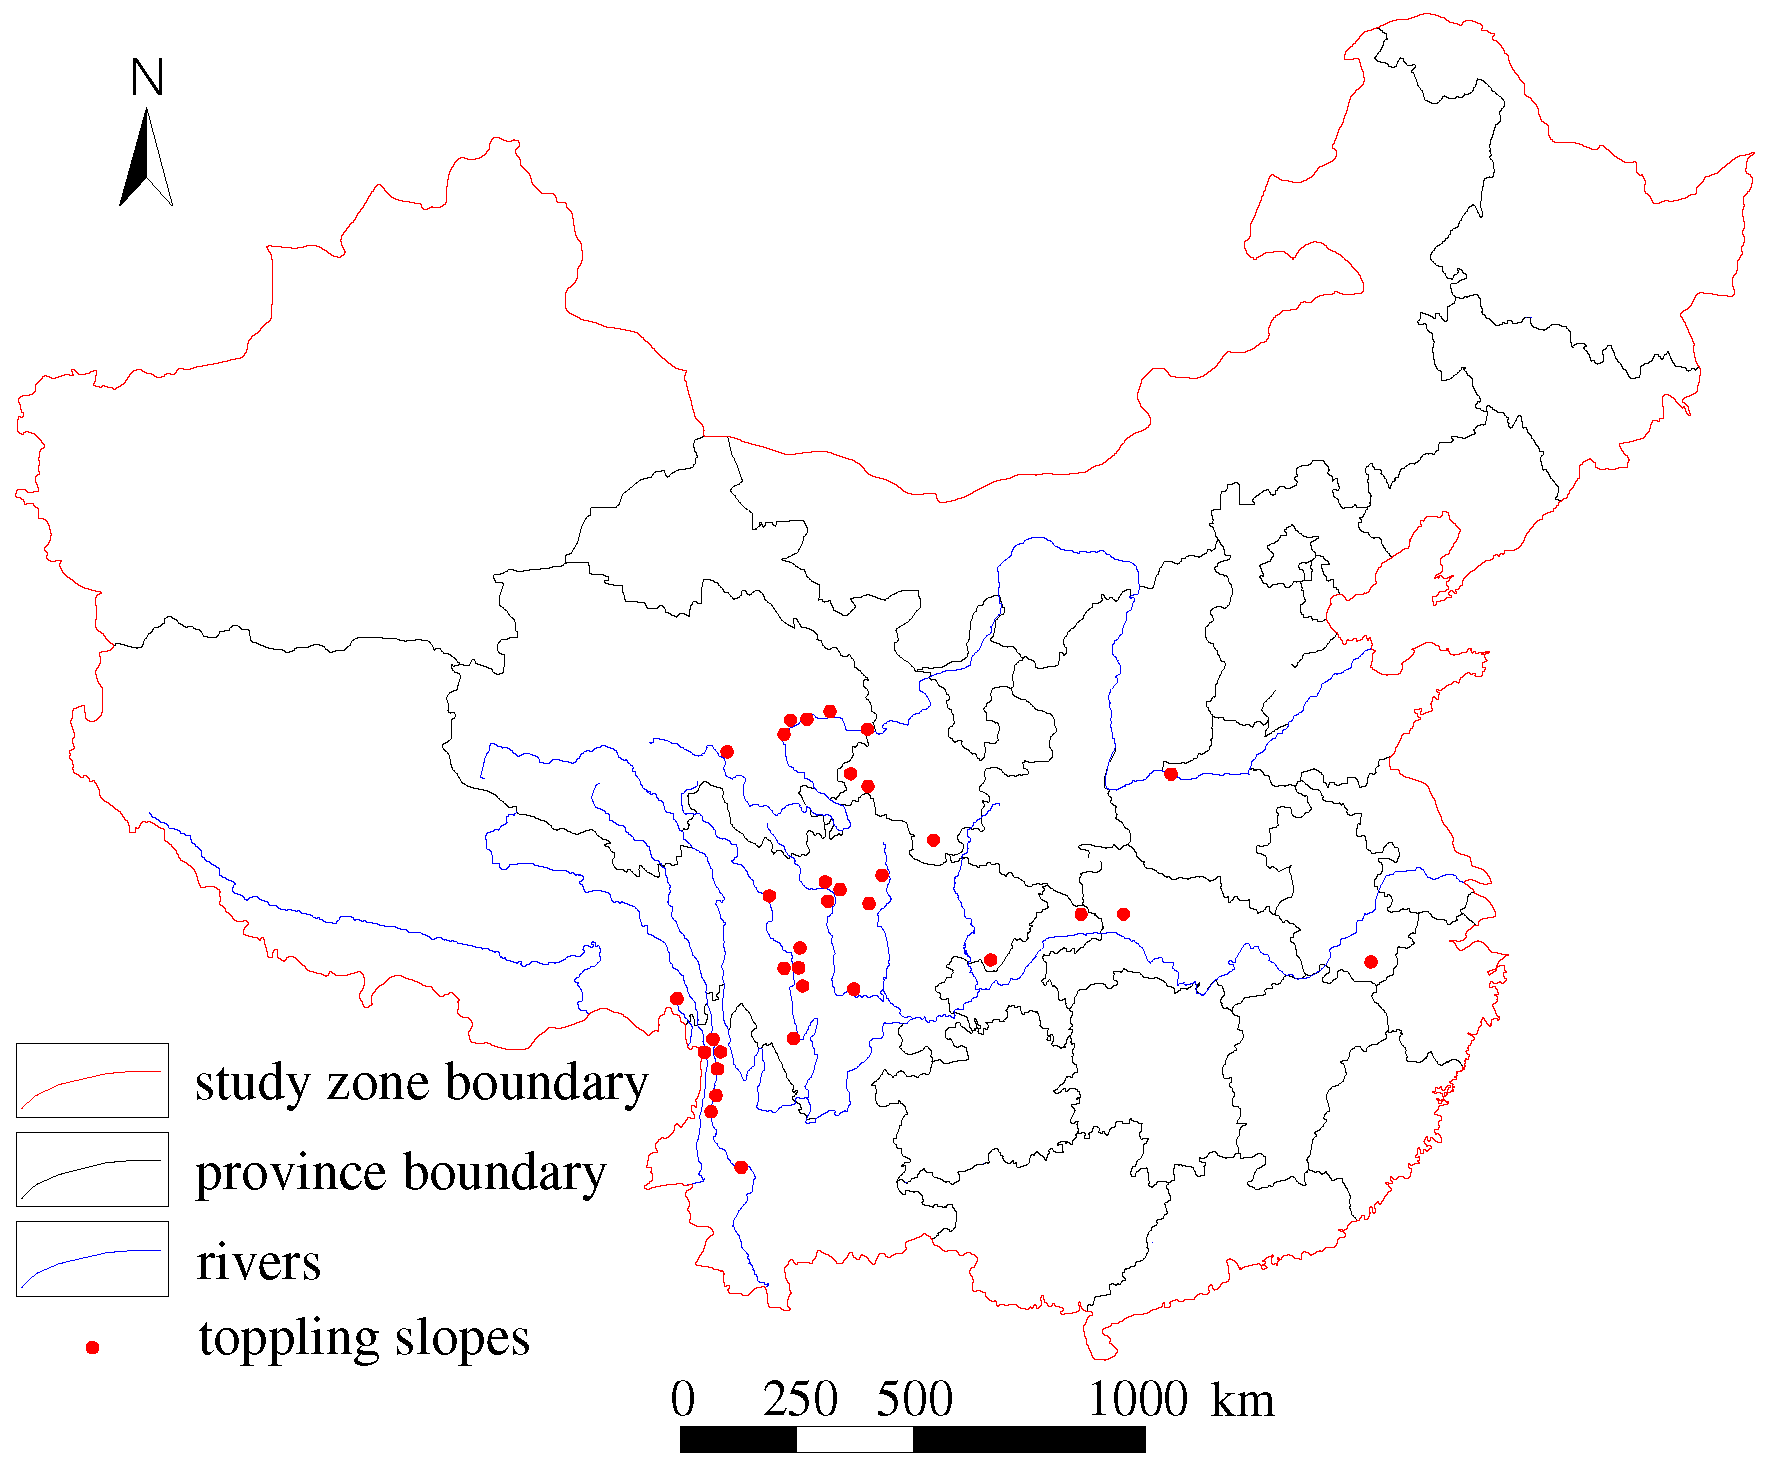
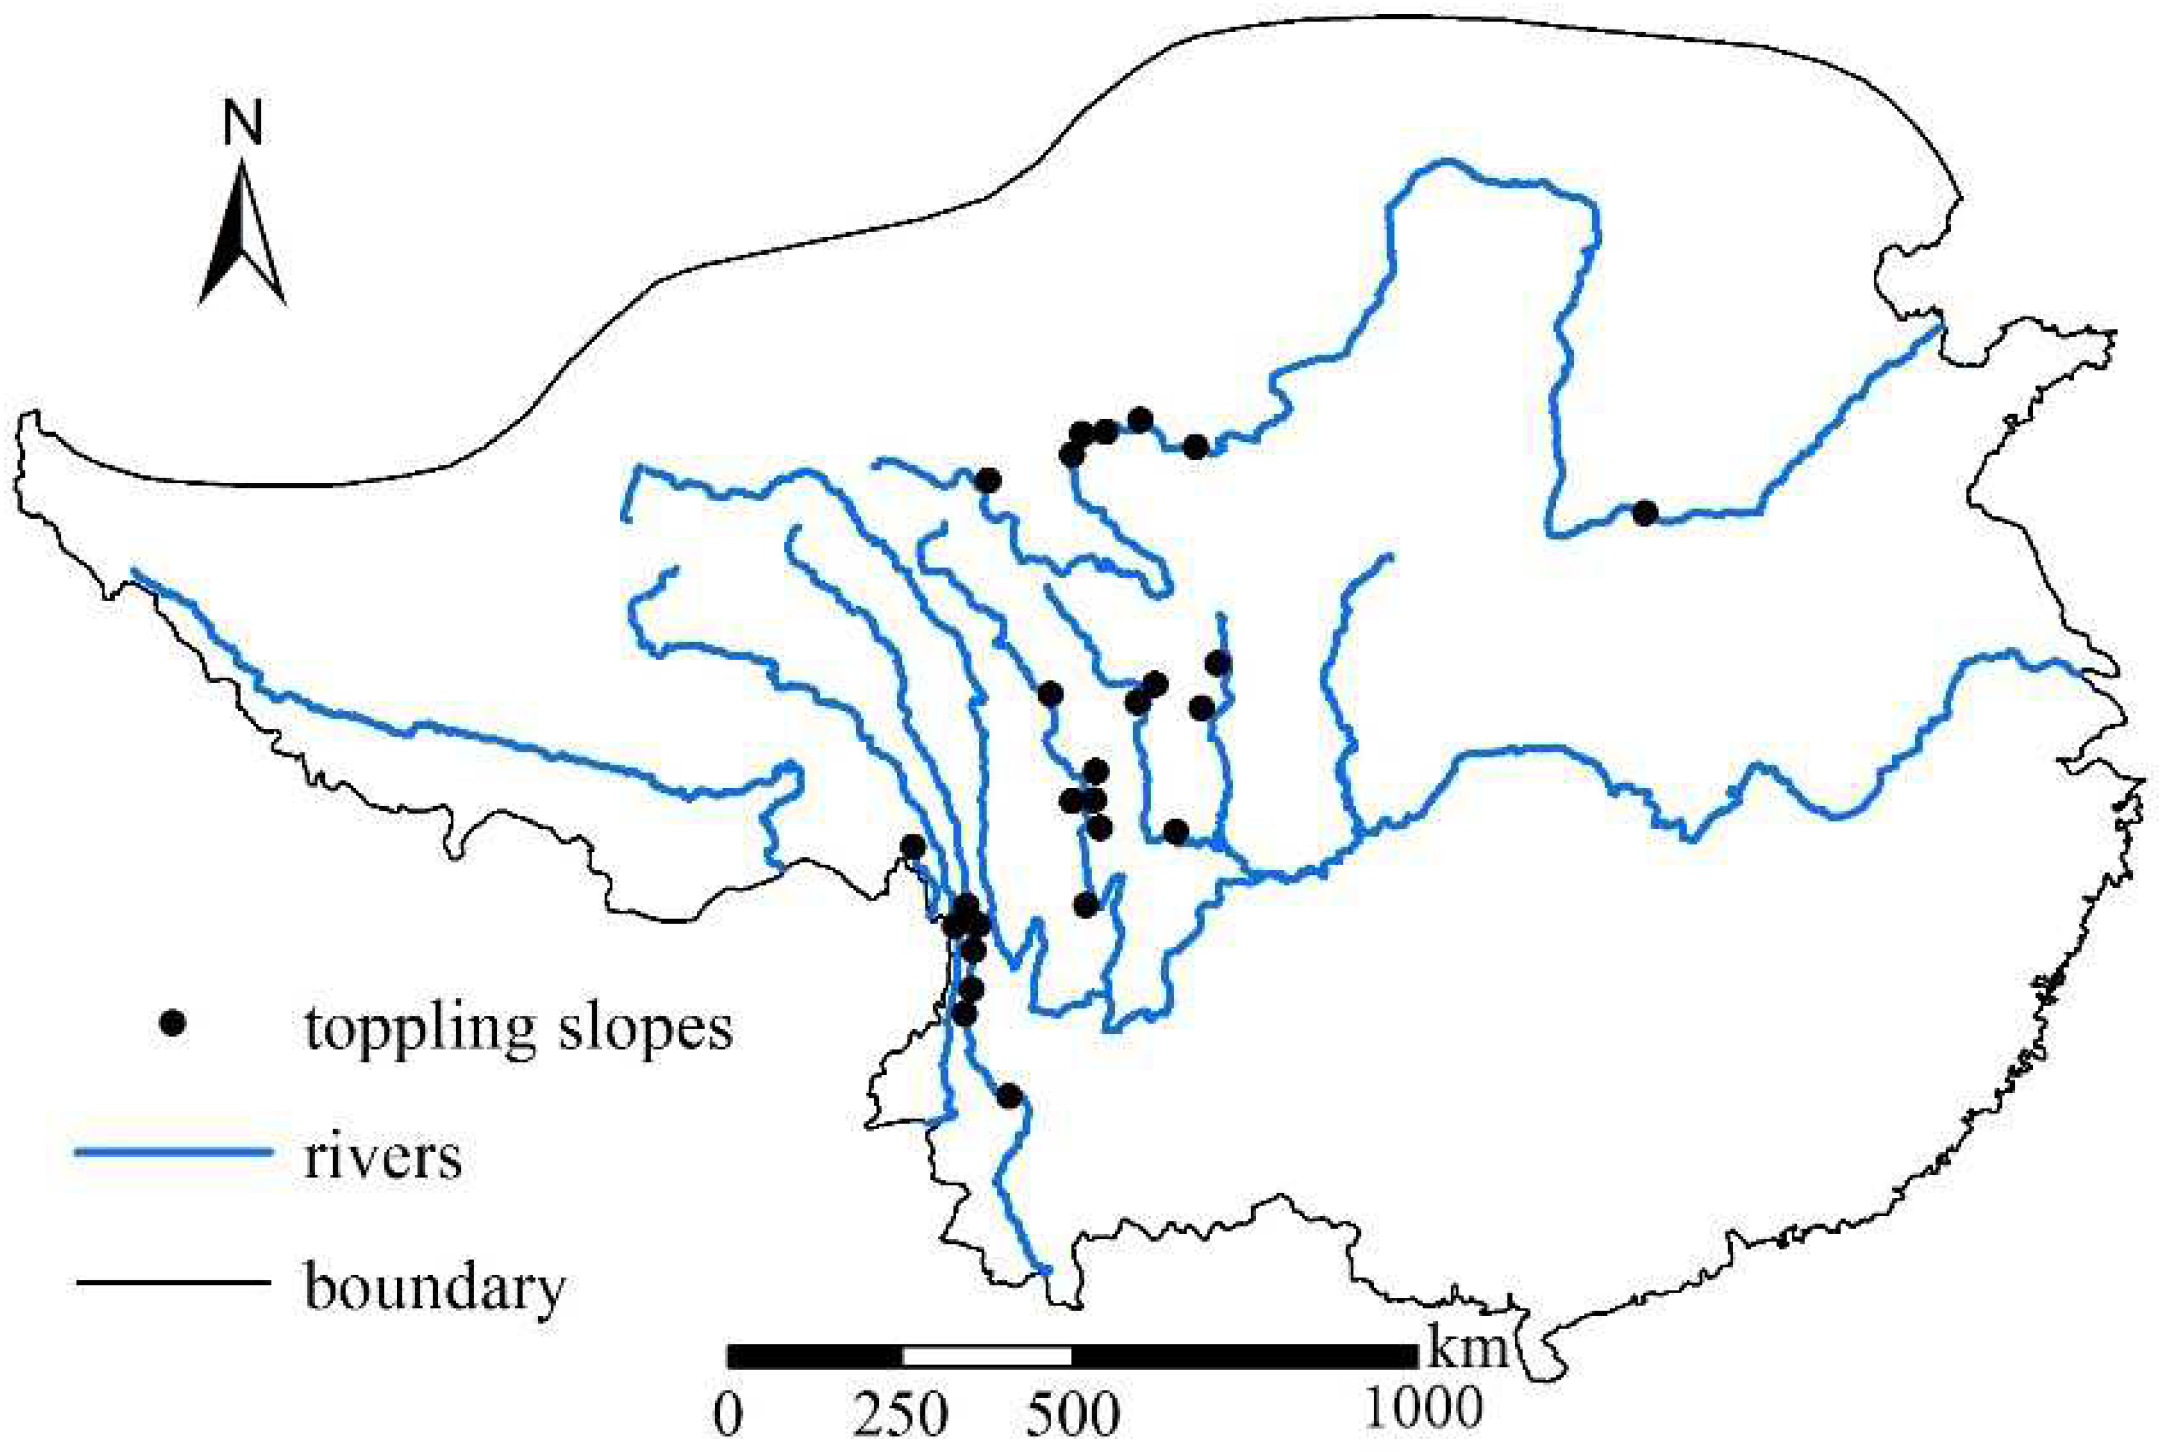
2. Toppling Deformation Statistics
3. Regional Geological Susceptibility
3.1. Selection of Factors
- (1)
- Landform type can provide information on the size and scale of landform features and how this size and scale might affect the amounts of energy available for geomorphic, pedogenic and hydrological processes. Landform types provide context that can be used to inform and improve the further sub-division of the landscape into landform elements [78], and thus can be used for further research on the development of toppling deformation.
- (2)
- Stratigraphic age can reflect the geological history and has important guiding significance for the study of slope stability and deformation mechanisms. The rock properties, structural characteristics and depositional environment of different stratigraphic ages may affect the stability and deformation characteristics of the slope. At the same time, the physical properties of rocks in different ages are different, including density, compressive strength, shear strength, etc. These factors will affect the stability of the slope. In the division of stratigraphic age, there are certain contact surfaces and contact zones between different rock layers. The geomechanical characteristics of these areas are among the main sources of slope instability and deformation.
- (3)
- Seismic intensity is considered a typical regional geological factor when analyzing the regional geological distribution law of toppling deformation development, because strong geological tectonic activity can cause significant ground shaking, which can trigger landslides and other types of ground instability. Seismic activity can also affect the strength and stability of rock formations, leading to toppling deformation. Therefore, understanding the seismic history and potential for future seismic activity is critical when assessing the risk of toppling deformation in a particular region. Seismic intensity is a quantitative measure of the level of ground shaking that occurred during past earthquakes and can be used to estimate the potential for future seismic events in the area. By analyzing seismic intensity data along with other geological factors, such as slope angle and dip angle, the regional geological distribution of the toppling deformation development can be better understood.
- (4)
- Tectonic stress distribution is a typical regional geological factor when analyzing the regional geological distribution law of toppling deformation development because tectonic forces play a significant role in shaping the Earth’s surface. Tectonic stresses can lead to the development of geological structures such as faults, folds and joints, which can affect the stability of rock formations and increase the risk of toppling deformation. In regions affected by high tectonic stress, such as those located near active fault zones, the likelihood of rock mass instability induced by tectonic stress increases, and the depth of slope toppling deformation significantly increases [55]. By studying the distribution of tectonic stress in a region, areas with higher risk of toppling deformation can be identified, which can further our understanding of the features of toppling deformation development.
3.2. Susceptibility Evaluation
3.2.1. Introduction of AHP
- (1)
- Construct the hierarchy structure, analyze the relationship among factors in the studied object, and divide factors in different properties into different hierarchies according to their subordination.
- (2)
- Judge the construction of the matrix (based on the measurement standards of Saaty, the matrix is developed by comparing the significance of every two factors in the same hierarchy to the main factor in upper hierarchy, finally forming the matrix in accordance with the quantification standard).
- (3)
- Check the consistency (the logical reasonability of the matrix needs to be assured).
3.2.2. Susceptibility Zoning
- (1)
- Scores of four single factors.
- (2)
- Applying AHP
3.3. Susceptibility Result Analysis
4. Geographic Position Susceptibility Zoning
4.1. Introduction of the Information Amount Method
4.2. Susceptibility Evaluation
4.2.1. Calculation of Information Amount
4.2.2. Information Amount Zoning
4.3. Susceptibility Result Analysis
5. Comprehensive Susceptibility Analysis
- (1)
- Regional geology: in the west of Sichuan basin, high mountains with ultra large or large fluctuations in height in the Hengduan Mountains are mainly in Mesozoic formation, tectonic stress is relatively concentrated, and seismic intensity grades of 8 and over are commonly occurring areas with very high susceptibility of toppling deformation slopes.
- (2)
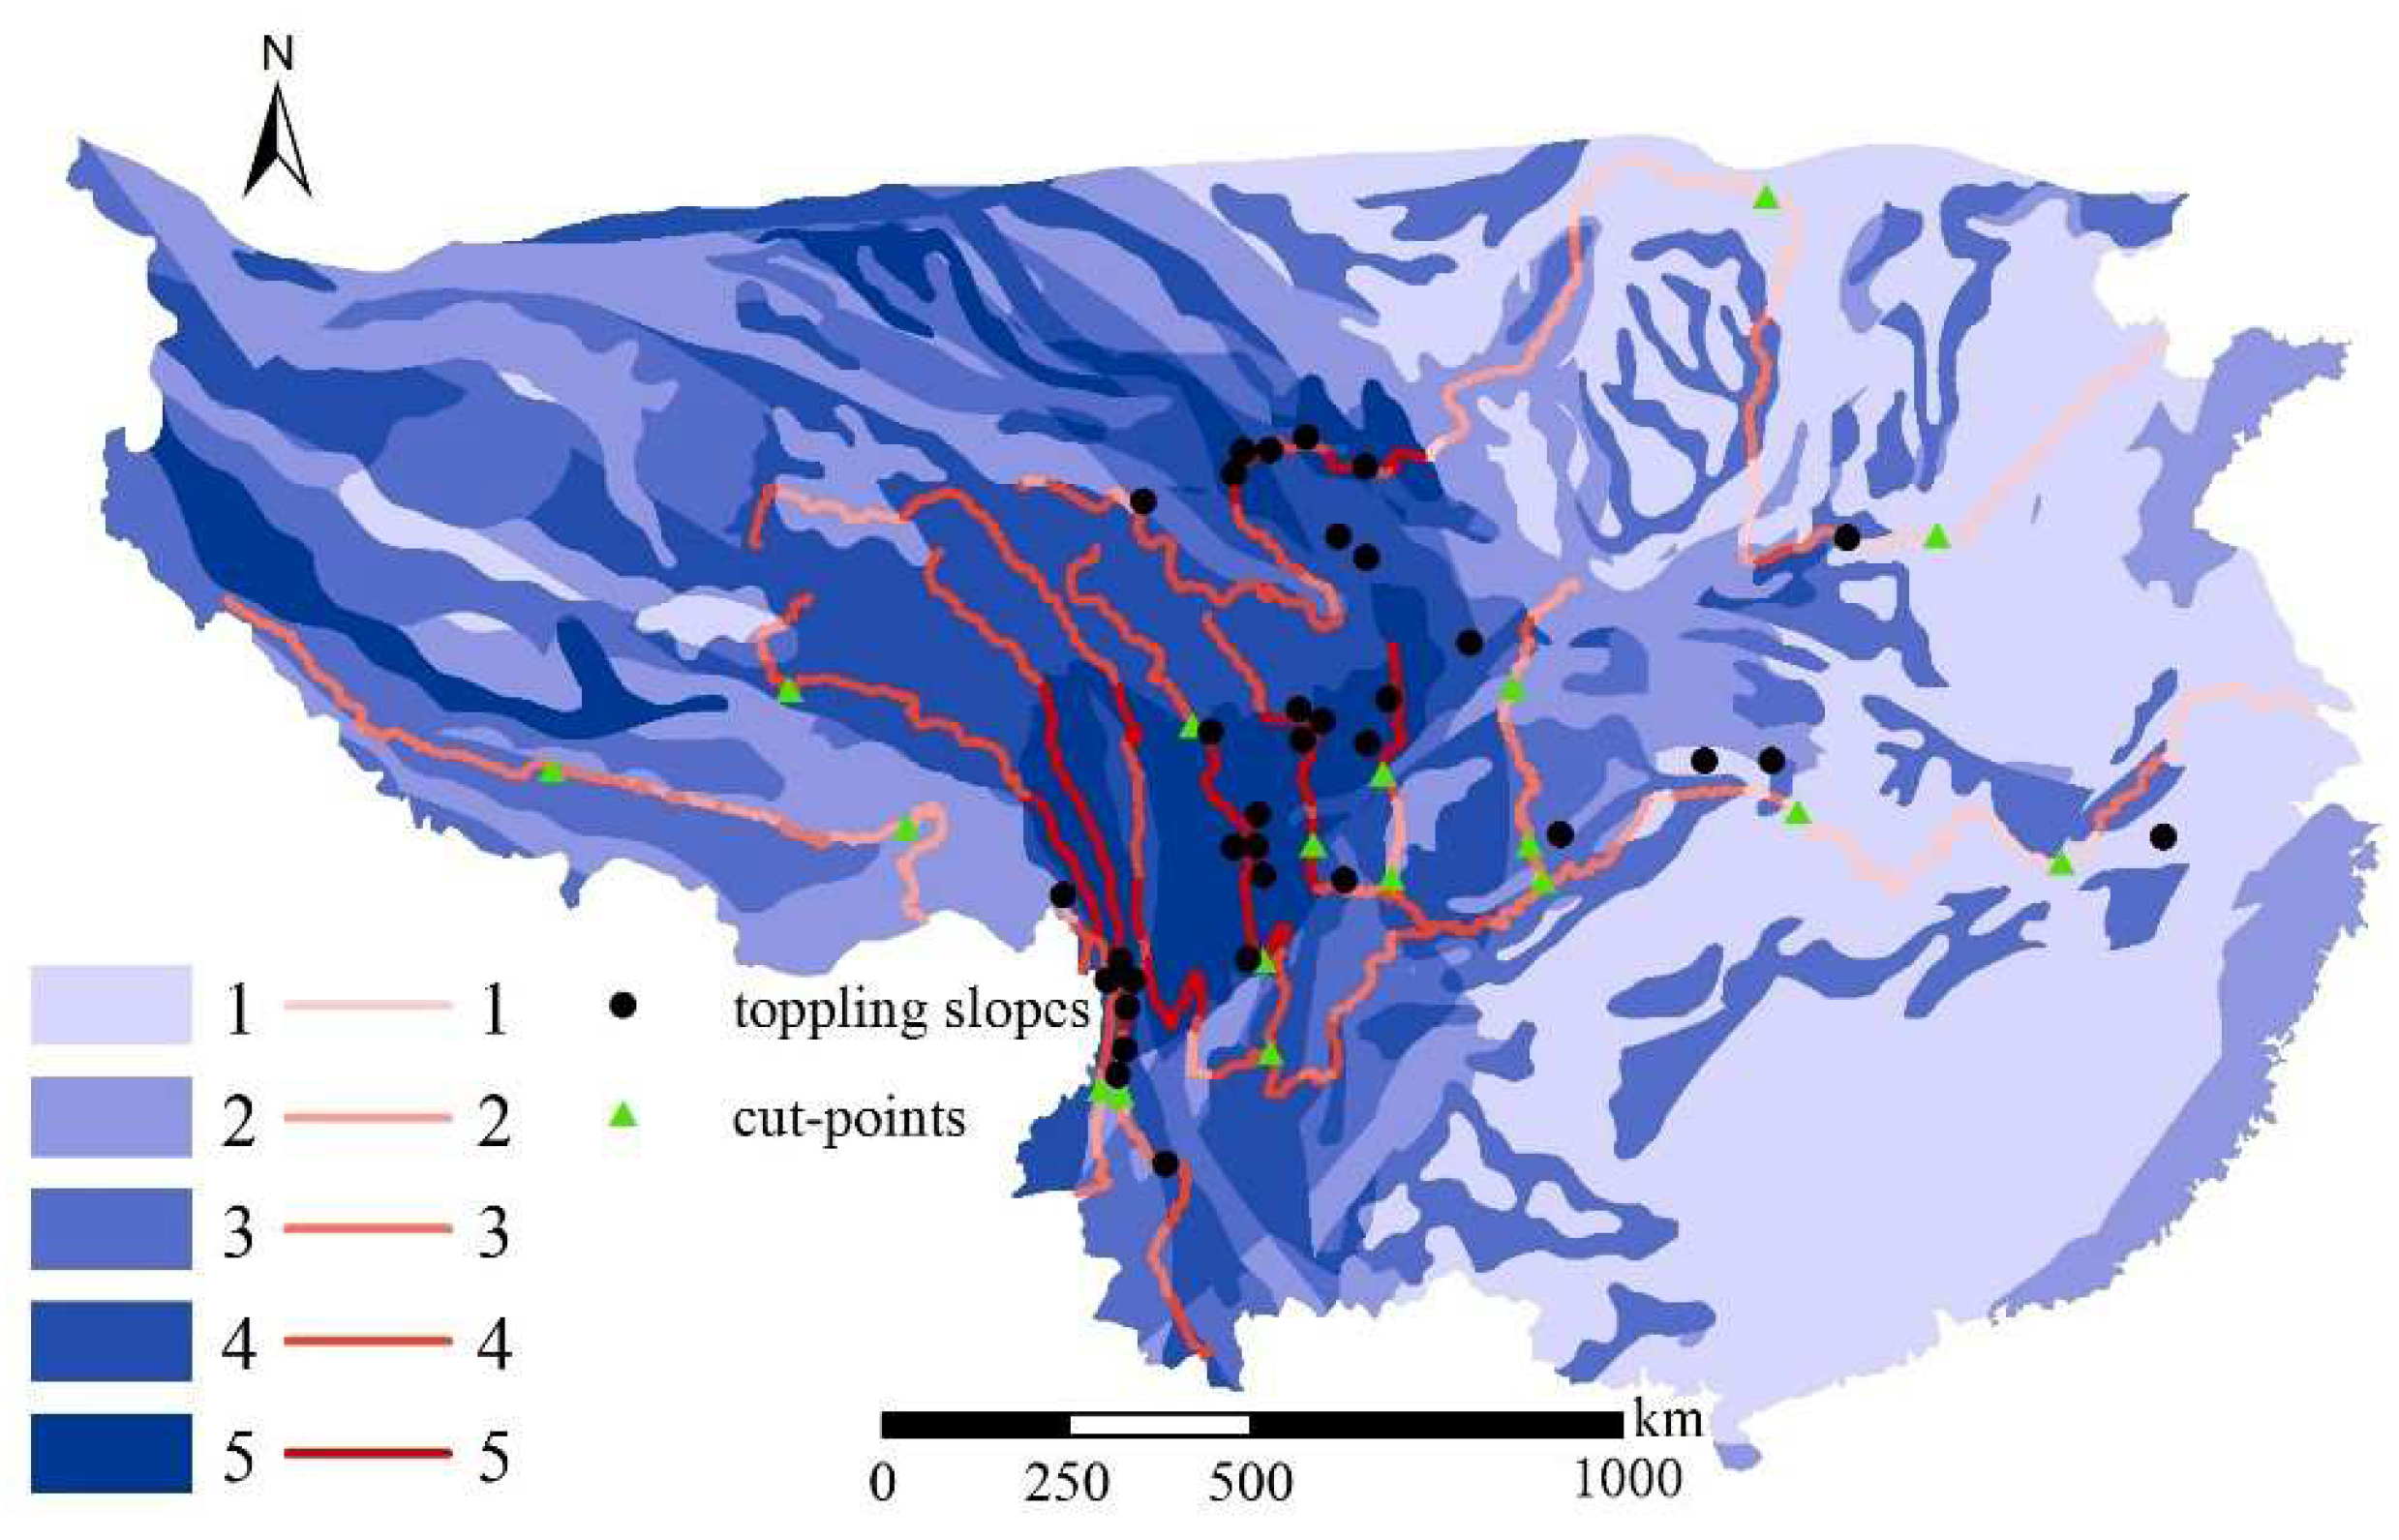
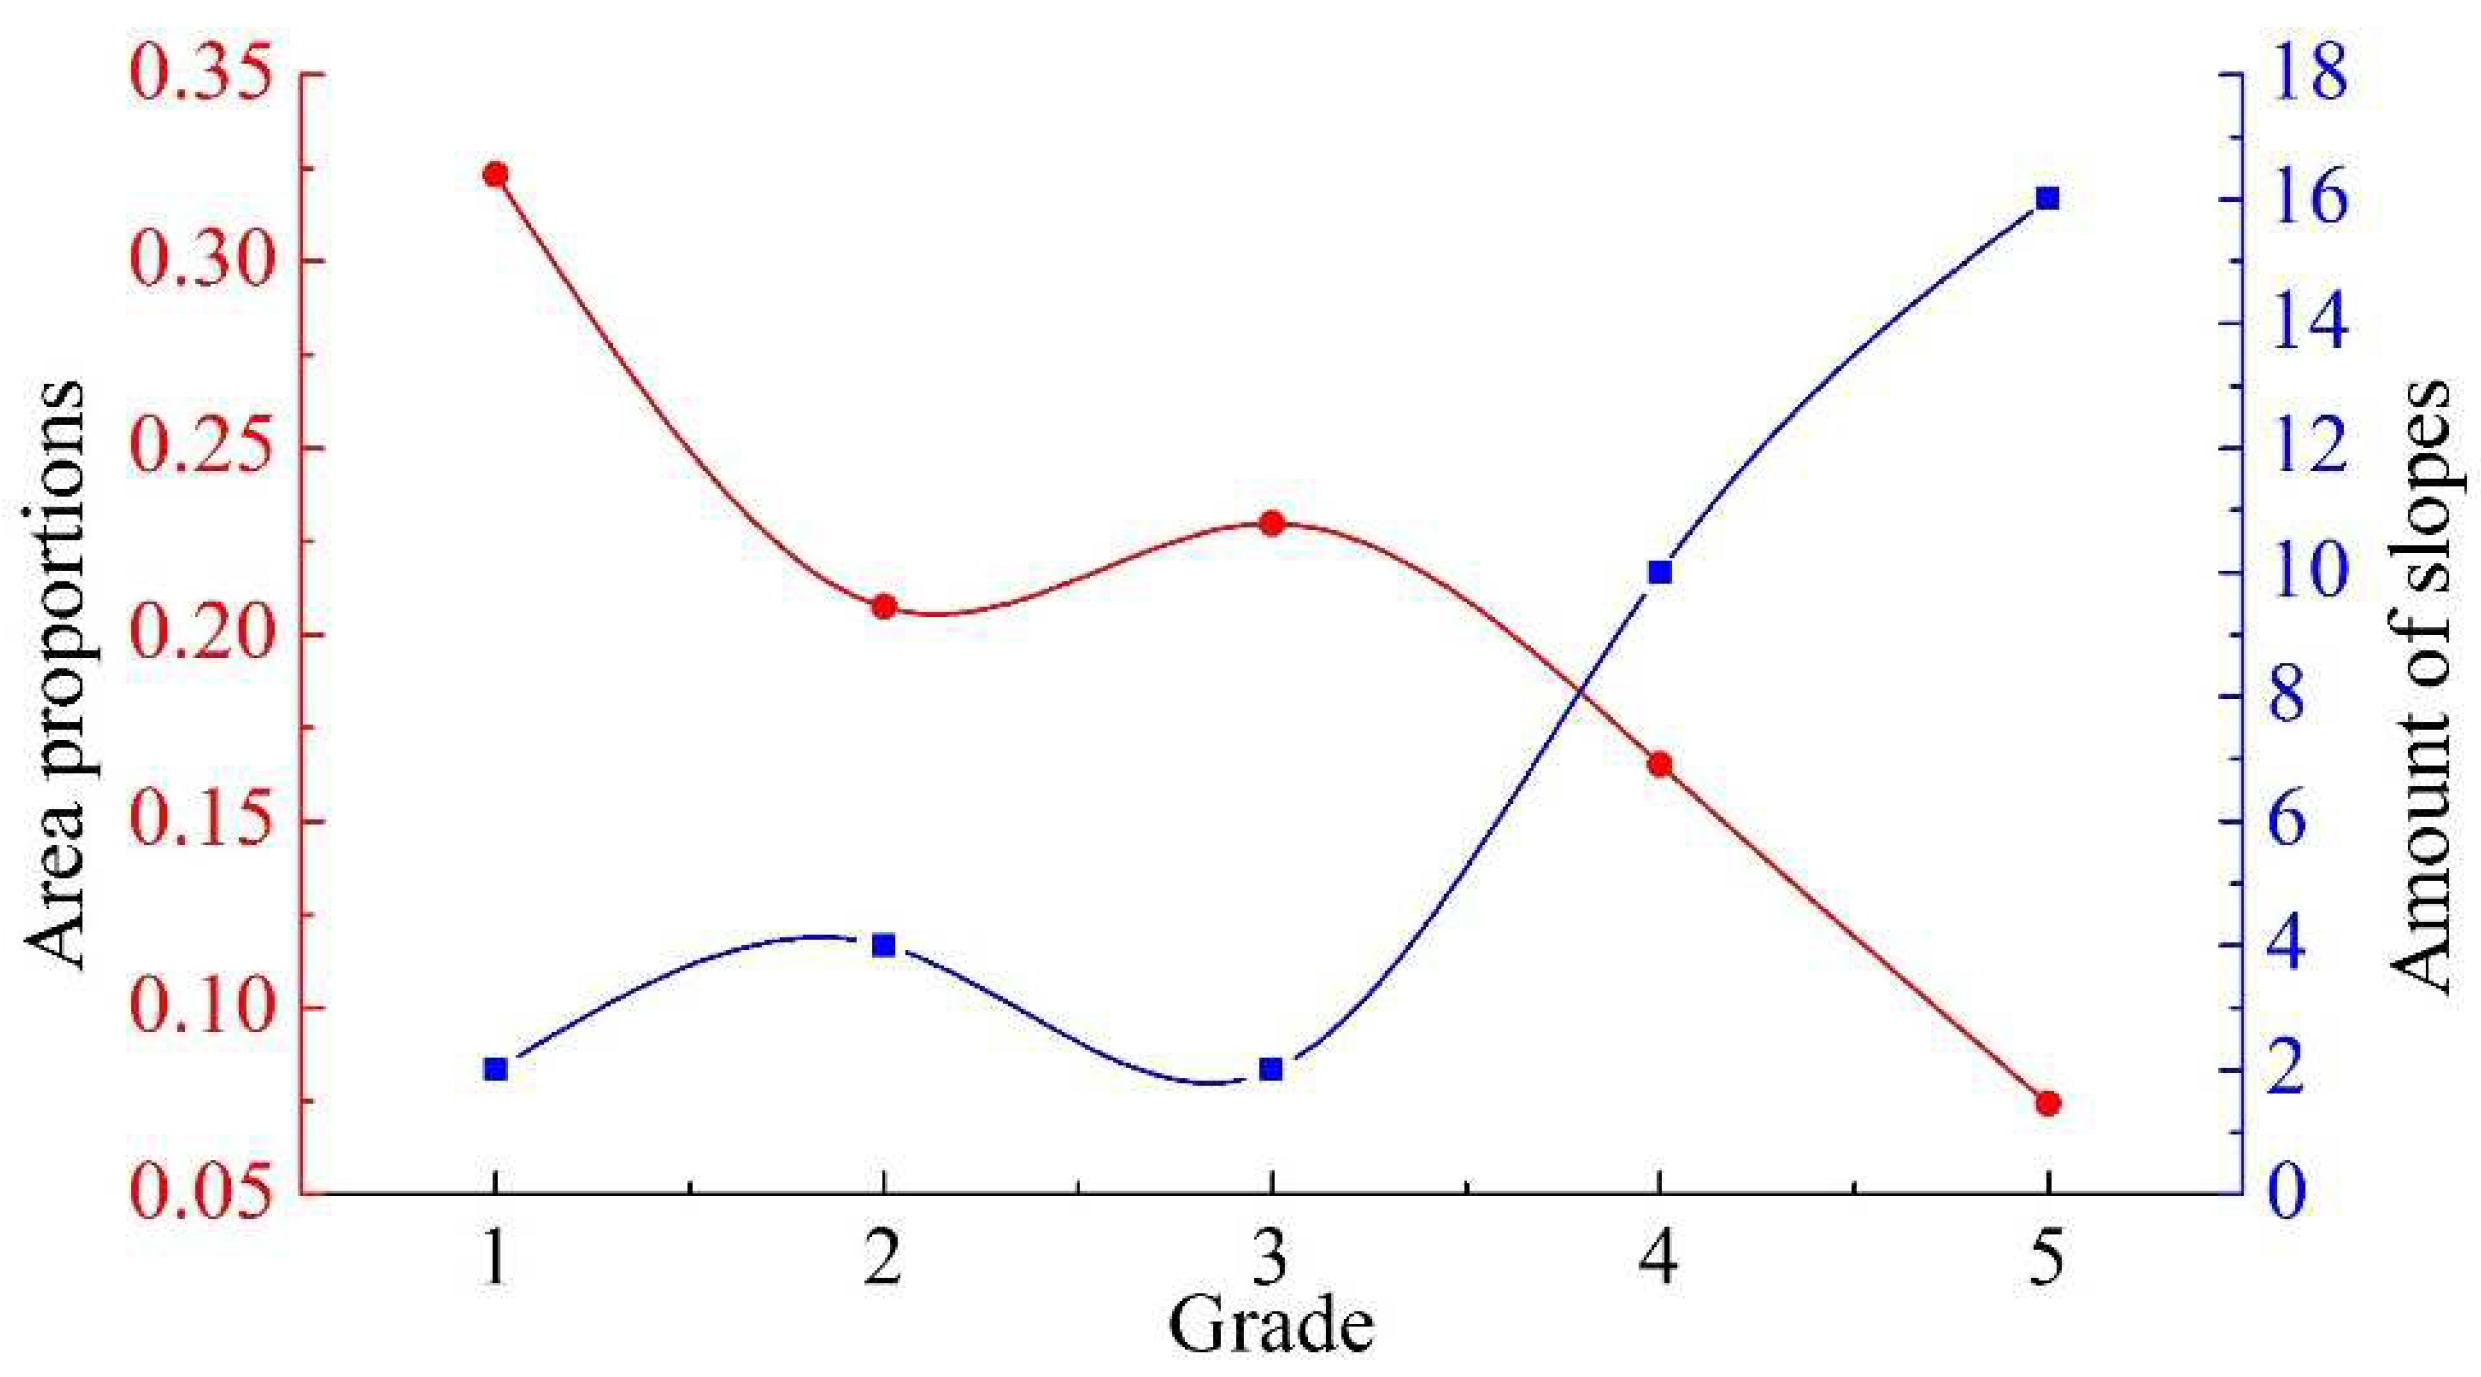
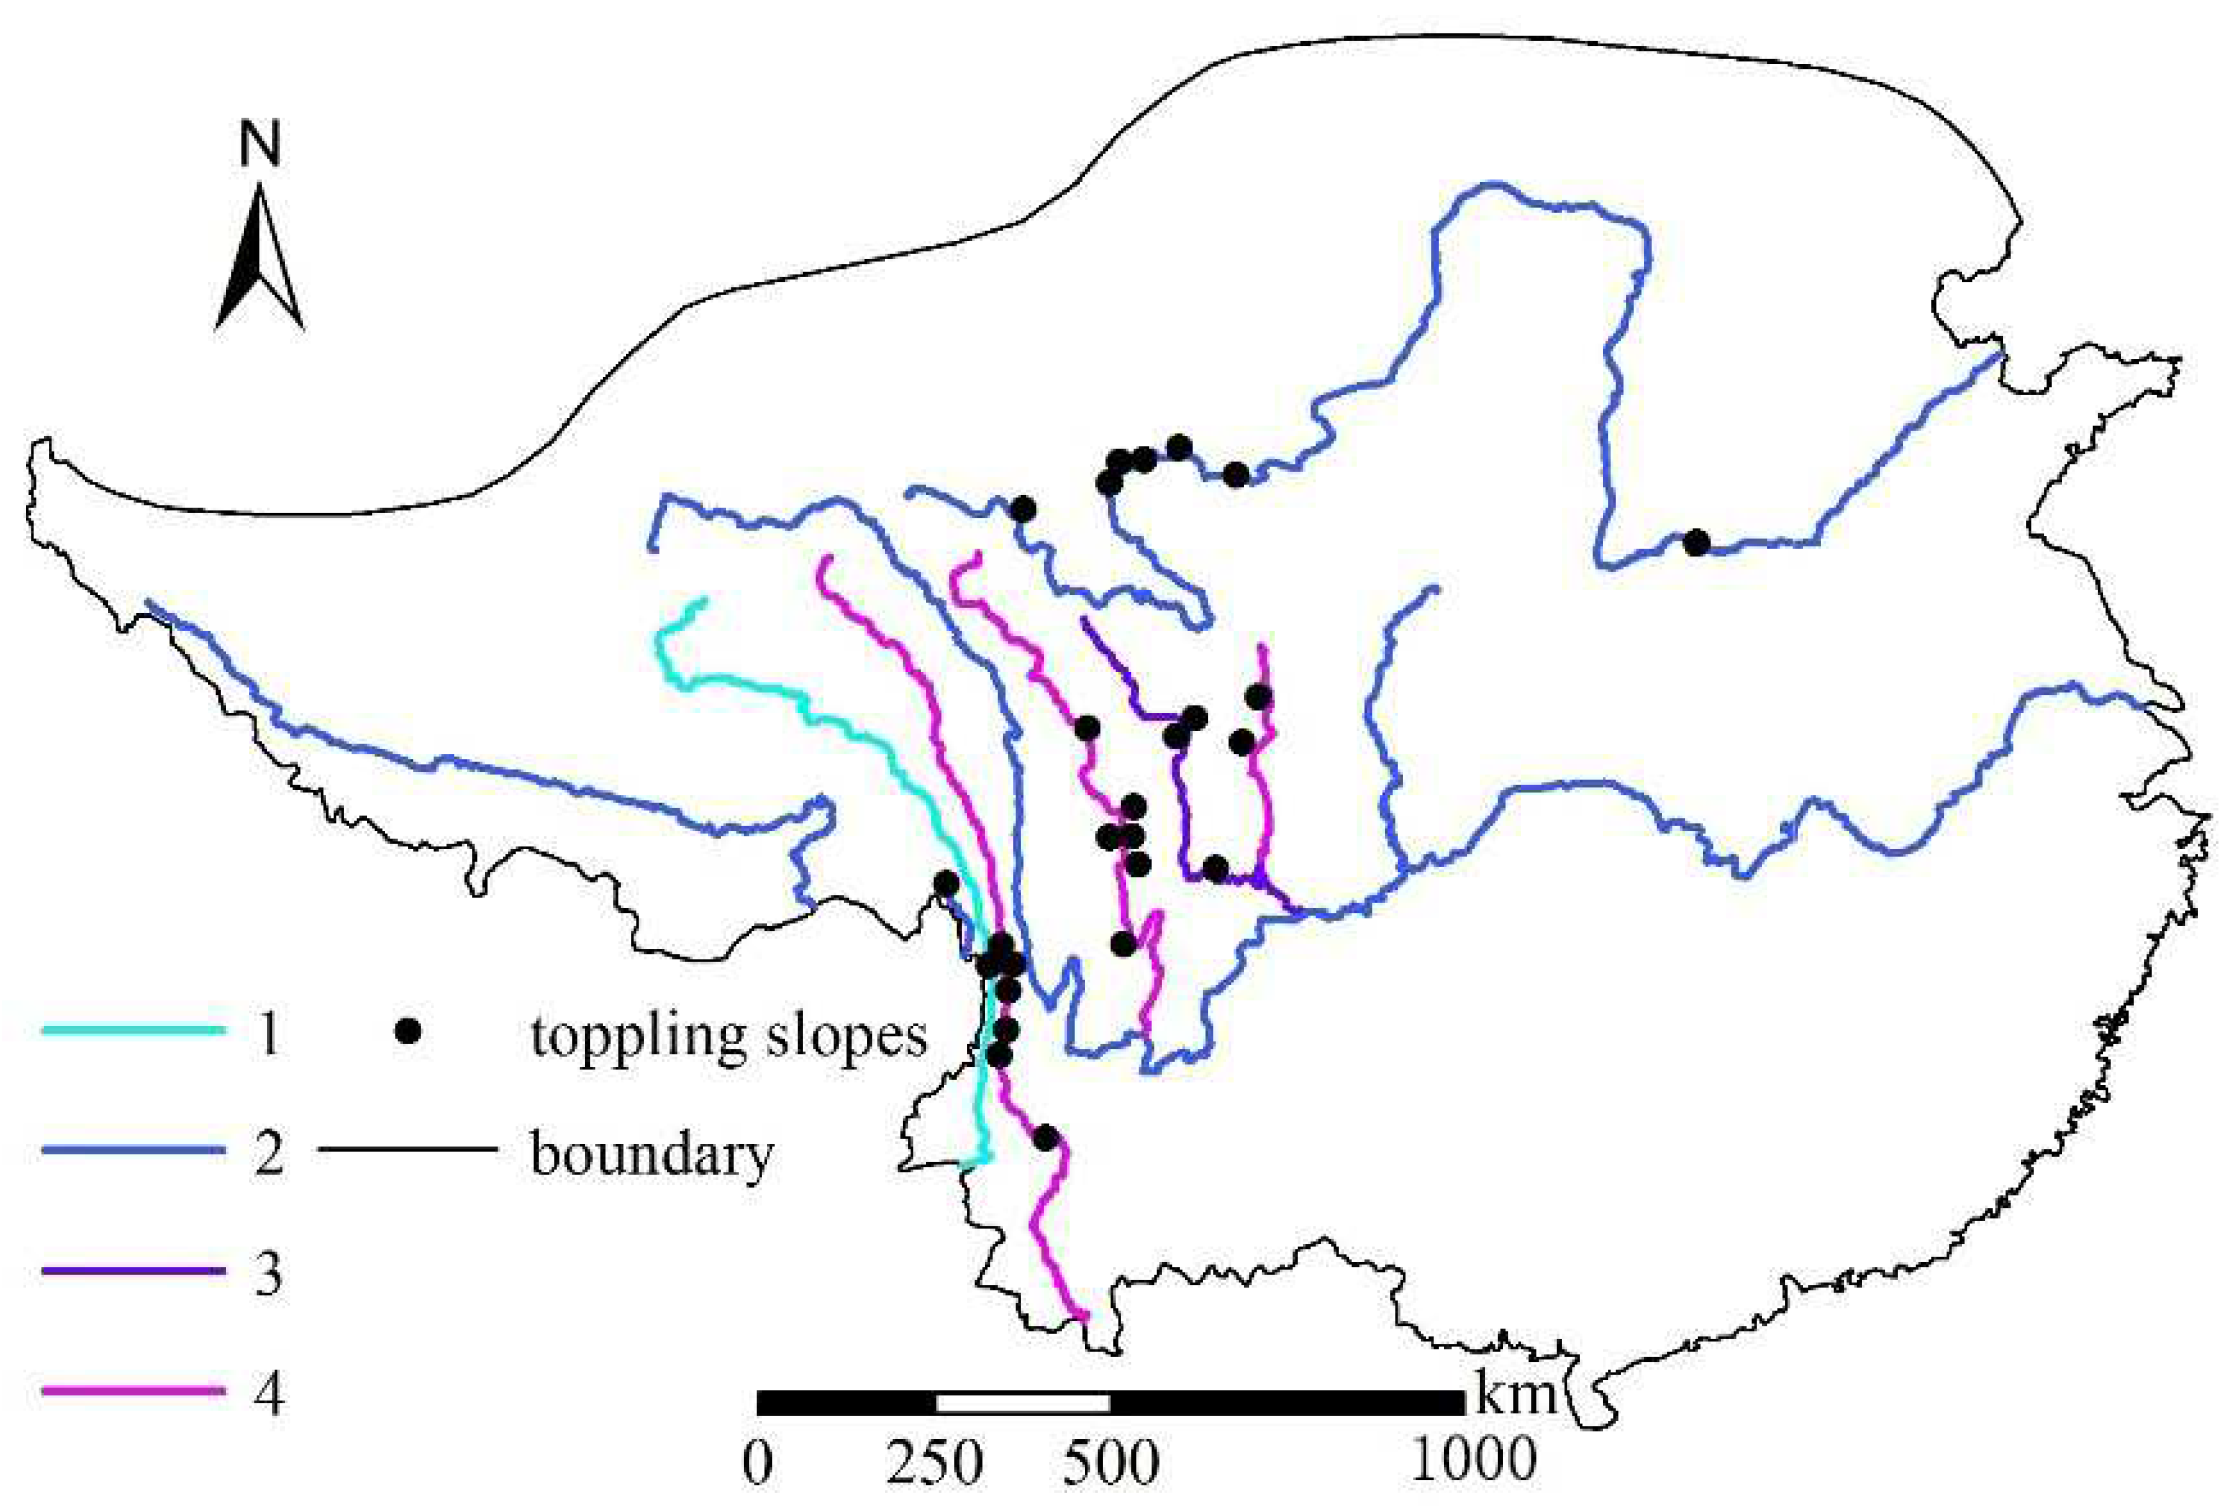
- Regional geography: the proportions of susceptibility grades of the three typical rivers are shown in Figure 10. The Lancang and Yalong Rivers flow through very high susceptibility areas. Due to the hydropower development in the upstream of the Yellow River, the susceptibility there tends to be higher. Most of the upper reaches of the Lancang River and the middle reaches of the Yalong River are in very high susceptibility areas. The susceptibility of the lower reaches of the Yalong River is higher than that of its upper reaches.
6. Conclusions
- (1)
- Most toppling deformation slopes in hydropower projects are located in Sichuan, Qinghai and Yunnan. Most toppling deformation slopes (in a small amount) in highway and mine projects mainly develop in Sichuan, Liaoning, Anhui, Jilin and elsewhere.
- (2)
- According to scores of regional geological evaluations, the study zone is divided into very low, low, medium, high and very high susceptibility areas. According to the information amount in the geographic position evaluation, the upstream, midstream and downstream of the 11 rivers are respectively classified into very low, low, high and very high susceptibility areas.
- (3)
- In the west of the Sichuan basin, high mountains with ultra large or large fluctuations in height in the Hengduan Mountains in Mesozoic formation, concentrated tectonic stress, and seismic intensity grades of 8 and over characterize areas of extremely high susceptibility. In those areas, the undulating landform with high seismic intensity grades and thin rock layer in Mesozoic formation are conditions for the occurrence of toppling deformation slopes.
- (4)
- The midstream of the Yalong River, the upper-midstream of the Lancang River, the upstream of the Yellow River, the upstream of the Dadu River and the upstream of the Min River are geographically in very high susceptibility areas. Relatively more toppling deformation develops in the midstream of the Yalong River, the upper-midstream of the Lancang River and the upstream of the Yellow River.
Author Contributions
Funding
Institutional Review Board Statement
Informed Consent Statement
Data Availability Statement
Acknowledgments
Conflicts of Interest
Appendix A

| Number | Position | Name |
|---|---|---|
| 1 | Muli County in Sichuan | The deformation slope in Jinping-I hydropower station |
| 2 | Jinchuan County in Sichuan | The deformation slope in Jinchuan hydropower station |
| 3 | Guide County in Qinghai | A slope in the upstream of Yellow River |
| 4 | Xinghai County in Qinghai | 1–6# toppling slopes in Cihaxia hydropower station |
| 5 | Jinchuan County in Sichuan | The slope at the entrance of Jinchuan highway tunnel |
| 6 | Guide County in Qinghai | The deformation slope in Laxiwa hydropower station |
| 7 | Southern part of Qinghai | A large toppling deformation slope in the upstream of the Yellow River |
| 8 | Diqing County in Yunnan | 1–4# toppling slopes in a hydropower station in the Lancang River |
| 9 | Diqing County in Yunnan | The deformation slope in Lidi hydropower station |
| 10 | Wen County in Gansu | A deformation slope in a step power station in the Bailong River |
| 11 | Jinchuan County in Sichuan | A deformation slope in a hydropower station in the Dadu River |
| 12 | Xinlong County in Sichuan | A deformation slope in a hydropower station in the Yalong River |
| 13 | Li County in Sichuan | The Erguxi highway tunnel slope in a tributary of the Min River |
| 14 | Xingshan County in Hubei | The deformation slope at the Xingshan County archive |
| 15 | Xunhua County in Qinghai | The Gushiqun toppling slope in Gongboxia hydropower station |
| 16 | Wen County in Gansu | The toppling slope in Qilinsi hydropower station |
| 17 | Hanyuan County in Sichuan | 1–2# toppling slopes in Pubugou hydropower station |
| 18 | Luoyang City in Henan | 1–2# toppling slopes in Xiaolangdi hydropower station |
| 19 | Ganzi County in Sichuan | 1–2# toppling slopes in Xinlong hydropower station |
| 20 | Luqu County in Gansu | The powerhouse slope in Duosongduo hydropower station |
| 21 | Heishui County in Sichuan | The toppling slope in Maoergai hydropower station in the Heishui River |
| 22 | Xinghai County in Qinghai | The toppling slope in Yangqu hydropower station |
| 23 | Diqing County in Yunnan | A toppling slope in a hydropower station in the Lancang River |
| 24 | Yunlong County in Yunnan | 1–2# toppling slopes in a hydropower station in the Lancang River |
| 25 | Huaying City in Sichuan | The deformation slope in the Zhaozixiu Mountain |
| 26 | Fengqing County in Yunnan | The toppling slope in the left bank of Xiaowan hydropower station |
| 27 | Diqing County in Yunnan | 1–2# toppling slopes in Wulonglong hydropower station in the Lancang River |
| 28 | Ganzi County in Sichuan | The landslide in the Ma River |
| 29 | Wannan Mountain in Anhui | 1–4# toppling deformation slopes |
| 30 | Wuxi County in Chongqing | A bank slope in Zhongliang reservoir |
| 31 | Chayu County in Tibet | 1# toppling deformation slope in Emi hydropower station |
| 32 | Lanping County in Yunnan | 1–2# deformation slopes at the left abutment of Huangdeng hydropower station |
| 33 | Ganzi County in Sichuan | The water-intake slope in a hydropower station in the Yalong River |
| 34 | Ganzi County in Sichuan | 1–3# deformation slopes in Geni hydropower station |
References
- Lin, P.; Liu, X.; Zhou, W.; Wang, R.; Wang, S. Cracking, stability and slope reinforcement analysis relating to the Jinping dam based on a geomechanical model test. Arab. J. Geosci. 2015, 8, 4393–4410. [Google Scholar] [CrossRef]
- Zhu, C.; Huang, Y.; Sun, J.J.C. Solid-like and liquid-like granular flows on inclined surfaces under vibration—Implications for earthquake-induced landslides. Comput. Geotech. 2020, 123, 103598. [Google Scholar] [CrossRef]
- Zou, C.G. Toppling failure analysis and engineering control of the south slope of the powerhouse of Tianshengqiao hydropower station. Chin. J. Rock Mech. Eng. 1991, 10, 23–32. [Google Scholar]
- Jiang, Y.; Yin, J.P. Xikou county landslide (debris flow) in Huaxi mountain. J. Geol. Hazards Environ. Preserv. 1992, 3, 51–58. [Google Scholar]
- Wang, S.J. On the mechanism and process of slope deformation in an open pit mine. Chin. J. Geotech. Eng. 1982, 14, 76–83. [Google Scholar] [CrossRef]
- Wu, S.; Shi, L.; Wang, R.; Tan, C.; Hu, D.; Mei, Y.; Xu, R. Zonation of the landslide hazards in the forereservoir region of the Three Gorges Project on the Yangtze River. Eng. Geol. 2001, 59, 51–58. [Google Scholar] [CrossRef]
- Song, S.W.; Xiang, B.Y.; Yang, J.X.; Feng, X.M. Stability analysis and reinforcement design of high and steep slopes with complex geology in abutment of Jingping I hydropower station. Chin. J. Rock Mech. Eng. 2010, 29, 442–458. [Google Scholar]
- Wang, J.; Li, Y.S.; Bao, J.; Cao, G.P.; Du, J.T.; Hong, D.M. A study on control factors of toppling rock mass deformation in abutment of a hydropower station on the Lancang river. J. Geol. Hazards Environ. Preserv. 2010, 21, 45–48, (In Chinese with English Abstract). [Google Scholar]
- Song, Y.H.; Huang, M.Q.; Sun, M. Application of finite elements with joint net to stability analysis of toppling slope. Rock Soil Mech. 2011, 4, 1205–1210. [Google Scholar]
- Pirulli, M.; Mangeney, A. Results of back-analysis of the propagation of rock avalanches as a function of the assumed rheology. Rock Mech. Rock Eng. 2008, 1, 59–84. [Google Scholar] [CrossRef]
- Muler, L. New consideration of the Vajont slide. Felsmechnik Ing. 1968, 6, 29–91. [Google Scholar]
- Tan, R.J.; Yang, X.Z.; Hu, R.L. Review of deformation mechanism and stability analysis of anti-dipped rock slopes. Rock Soil Mech. 2009, S2, 479–484+523. [Google Scholar]
- Ye, S.; Li, Y.S.; Guo, Q. Mechanics Research on Rock Stress and Deformation of Lancang River Canyon’s large-scale dumping Deformation. In Applied Mechanics and Materials; Trans Tech Publications Ltd.: Zurich, Switzerland, 2013; Volume 353, pp. 318–323. [Google Scholar]
- Ning, Y.; Zhang, G.; Tang, H.; Shen, W.; Shen, P. Process analysis of toppling failure on anti-dip rock slopes under seismic load in southwest China. Rock Mech. Rock Eng. 2019, 52, 4439–4455. [Google Scholar] [CrossRef]
- Zhou, H.; Huang, P.; Di, S.; Wang, M. Research of Toppling Criterion and Analysis of Instability Evolution of Toppling Deformation Slope. In IOP Conference Series: Materials Science and Engineering; IOP Publishing: Bristol, UK, 2020; Volume 780, p. 22021. [Google Scholar]
- Cui, Z.; Chen, P.-Z.; Chu, W.-J.; Zhou, Y.; Liu, N.; Sheng, Q. Deformation mechanism and reinforcement design for the flexural toppled slope of Miaowei HPP. Bull. Eng. Geol. Environ. 2023, 82, 39. [Google Scholar] [CrossRef]
- Goodman, R.E.; Bray, J.W. Toppling of rock slopes. In Proceedings of the ASCE Specialty Conference on Rock Engineering for Foundations and Slopes, Boulder, CO, USA, 15–18 August 1976; pp. 201–234. [Google Scholar]
- Hoek, E.; Bray, J.D. Rock Slope Engineering; CRC Press: Boca Raton, FL, USA, 1981. [Google Scholar]
- Zhang, Z.; Liu, G.; Wu, S.; Tang, H.; Wang, T.; Li, G.; Liang, C. Rock slope deformation mechanism in the Cihaxia hydropower station, Northwest China. Bull. Eng. Geol. Environ. 2015, 74, 943–958. [Google Scholar] [CrossRef]
- Zhao, J.S.; Feng, X.T.; Jiang, Q.; Zhou, Y.Y. Microseismicity monitoring and failure mechanism analysis of rock masses with weak interlayer zone in underground intersecting chambers: A case study from the Baihetan Hydropower Station, China. Eng. Geol. 2018, 245, 44–60. [Google Scholar] [CrossRef]
- Cai, J.-C.; Ju, N.-P.; Huang, R.-Q.; Zheng, D.; Zhao, W.-H.; Li, L.-Q.; Huang, J. Mechanism of toppling and deformation in hard rock slope: A case of bank slope of Hydropower Station, Qinghai Province, China. J. Mt. Sci. 2019, 16, 924–934. [Google Scholar] [CrossRef]
- Li, M.; Zhang, L.; Shi, X.; Liao, M.; Yang, M. Monitoring active motion of the Guobu landslide near the Laxiwa Hydropower Station in China by time-series point-like targets offset tracking. Remote Sens. Environ. 2019, 221, 80–93. [Google Scholar] [CrossRef]
- Ning, Y.; Tang, H.; Wang, F.; Zhang, G. Sensitivity analysis of toppling deformation for interbedded anti-inclined rock slopes based on the Grey relation method. Bull. Eng. Geol. Environ. 2019, 78, 6017–6032. [Google Scholar] [CrossRef]
- Geng, J.; Chen, W. Analysis on deformation mechanism of high rock slope of hydropower station under complex hydrogeology. Microprocess. Microsyst. 2021, 81, 103733. [Google Scholar] [CrossRef]
- Tao, Z.; Zhu, C.; He, M.; Karakus, M. A physical modeling-based study on the control mechanisms of Negative Poisson’s ratio anchor cable on the stratified toppling deformation of anti-inclined slopes. Int. J. Rock Mech. Min. Sci. 2021, 138, 104632. [Google Scholar] [CrossRef]
- Shan, Z.; Lv, J.; Zhang, F.; Chen, L.; Yin, F.; Dong, M. Different Toppling Bank Slope Failures under Hydrodynamic Action during Impoundment of the Miaowei Hydropower Station Reservoir. Water 2022, 14, 2126. [Google Scholar] [CrossRef]
- Zhu, Y.; Yao, X.; Yao, L.; Zhou, Z.; Ren, K.; Li, L.; Yao, C.; Gu, Z. Identifying the mechanism of toppling deformation by InSAR: A case study in Xiluodu reservoir, Jinsha river. Landslides 2022, 19, 2311–2327. [Google Scholar] [CrossRef]
- Yi, X.; Feng, W.; Li, B.; Yin, B.; Dong, X.; Xin, C.; Wu, M. Deformation characteristics, mechanisms, and potential impulse wave assessment of the Wulipo landslide in the Baihetan reservoir region, China. Landslides 2023, 20, 615–628. [Google Scholar] [CrossRef]
- Zhong, W.; Chen, X.Q.; He, N.; Yang, T. Ecological taxonomy of hydropower rock high slope and its environmental application in Southwest China. Ekoloji 2018, 27, 1417–1426. [Google Scholar]
- Xie, L.; Zhu, Q.; Qin, Y.; Wang, J.; Qian, J. Study on evolutionary characteristics of toppling deformation of anti-dip bank slope based on energy field. Sustainability 2020, 12, 7544. [Google Scholar] [CrossRef]
- Liu, S.; Wang, H.; Meng, Q.; Yan, L. Simulating crack development and failure characteristic of toppling rock slope under seismic loading on Lancang River in China. Lithosphere 2021, 2021, 5424127. [Google Scholar] [CrossRef]
- Cai, J.; Zheng, D.; Ju, N.; Wang, J.; Zhou, X.; Li, D. Time-Varying Effect of Ductile Flexural Toppling Failure on Antidip Layered Rock Slope. Front. Interact. Hum. Act. Geo-Environ. Sustain. Dev. 2023, 271, 16648714. [Google Scholar] [CrossRef]
- Lu, S.Z.; Da, Y.; Jin, Y. Genetic mechanism analysis on a toppling slope in a strip mine in northeastern China. In Engineering Geology Professional Committee of the Geological Society of China. Selected Papers of the Third National Engineering Geology Conference; Chengdu University of Science and Technology Press: Chengdu, China, 1988; Volume 1, pp. 455–462. [Google Scholar]
- Bharati, A.K.; Ray, A.; Rai, R.; Shrivastva, B.K. A stability classification system for the dragline dump slope. Min. Metall. Explor. 2021, 38, 1095–1109. [Google Scholar] [CrossRef]
- Dong, M.; Zhang, F.; Hu, M.; Liu, C. Study on the influence of anchorage angle on the anchorage effect of soft-hard interbedded toppling deformed rock mass. KSCE J. Civ. Eng. 2020, 24, 2382–2392. [Google Scholar] [CrossRef]
- Du, Y.; Hu, X.; He, K. Zonation and Stability Analysis of Toppling-Deformed Slope Based on Discrete Element Method. In IOP Conference Series: Earth and Environmental Science; IOP Publishing: Bristol, UK, 2021; Volume 861, p. 062017. [Google Scholar]
- Sun, H.; Li, T.; Pei, X.; Guo, J.; Tian, J.; Wang, S.; Pu, M. Gravitational Deformation and Reactivation Mechanism of a Fault-Bounded Slope, Eastern Yanshan Mountains, China. Forests 2023, 14, 495. [Google Scholar] [CrossRef]
- Deng, Q.L.; Zhu, Z.Y.; Cui, Z.Q.; Wang, X.P. Mass rock creep and landsliding on the Huangtupo slope in the reservoir area of the Three Gorges Project, Yangtze River, China. Eng. Geol. 2000, 58, 67–83. [Google Scholar] [CrossRef]
- Xia, H.Y. Study on the Stability of the Spandrel Groove High Slope of Jingping Hydroelectric Power Station; Chengdu University of Technology: Chengdu, China, 2004. [Google Scholar]
- Huang, R. Mechanisms of large-scale landslides in China. Bull. Eng. Geol. Environ. 2012, 71, 161–170. [Google Scholar] [CrossRef]
- Sun, C.; Lv, Y.Y.; Wu, J.M. Instance analysis on zone properties of valley landslide mass. J. Water Resour. Water Eng. 2013, 24, 171–176. [Google Scholar]
- Yang, J.M.; Ma, X.B.; Liu, J.; Feng, Y. Application of refraction tomography and geological analysis in the detection of dump deformation rock mass. Geotech. Investig. Surv. 2014, 4, 95–98. [Google Scholar]
- Zhu, Y. Stability evaluation and collapse prediction on the bank of a hydropower station. Environ. Sci. 2014, 43, 28–29. [Google Scholar]
- Zuo, Z.C. Study on the Stability of Reservoir Bank of Yalong River for Gnni Hydropower Station; Chengdu University of Technology: Chengdu, China, 2014. [Google Scholar]
- Jin, G.; Wang, Y.; Wu, W.; Guo, T.; Xu, J. Distribution features of landslides in the Yalong River Basin, Southwest China. Environ. Earth Sci. 2021, 80, 285. [Google Scholar] [CrossRef]
- Yang, Y.L.; Huang, R.Q.; Yan, M.; Liu, M. Engineering geological study on a large-scale toppling deformation at Xiaowan hydropower station. J. Eng. Geol. 2006, 14, 165–171. [Google Scholar]
- Zhao, X.; Li, Y.; Chen, X.; Lin, F. Numerical simulation for the problem of project slope toppling deformation on the right of a hydropower station dam abutment in Lancang river. J. Eng. Geol. 2008, 16, 298–303. [Google Scholar]
- Xie, L.; Li, Y.S.; Cao, J.J.; Liu, G.L. Numerical simulation of toppling rock mass deformation in the right dam abutment of a hydropower station on the Lancang river. Geol. China 2009, 36, 907–914. [Google Scholar]
- Xie, L. Studies on Causes and Control Conditions and Stability on the Right Abutment of the 2# Deformation Body of Huangdeng Hydropower Station on the Lancang River; Chengdu University of Technology: Chengdu, China, 2010. [Google Scholar]
- Zhang, J.X.; Wei, W.; Liu, B. Analysis on Badong coat of Lancang river toppling rock’s characters and genetic mechanism. Shanxi Archit. 2010, 36, 88–90. [Google Scholar]
- Bao, J.; Li, Y.S.; Cao, G.P.; Wang, J. Genetic mechanism of the toppling deformation near the dam of a hydropower station on Lancang river. J. Geol. Hazards Environ. Preserv. 2011, 22, 47–51. [Google Scholar]
- Zhou, H.F.; Nie, D.X.; Li, S.W. Integrated analysis of formation mechanism for large-scale toppling rock mass of a hydropower station on Lancangjiang river. Adv. Sci. Technol. Water Resour. 2012, 32, 48–52. [Google Scholar]
- Li, Y.; Hou, X.; Dong, M. Study on Deformation and Failure of Toppling Deformation Slope of Miaowei Hydropower Station under Storage Condition. In IOP Conference Series: Earth and Environmental Science; IOP Publishing: Bristol, UK, 2018; Volume 170, p. 022003. [Google Scholar]
- Gu, Z.-K.; Yao, X.; Yao, C.-C.; Li, C.-G. Mapping of geomorphic dynamic parameters for analysis of landslide hazards: A case of Yangbi river basin on the upper Lancang-Mekong of China. J. Mt. Sci. 2021, 18, 2402–2411. [Google Scholar] [CrossRef]
- Ning, Y.; Tang, H.; Zhang, G.; Smith, J.V.; Zhang, B.; Shen, P.; Chen, H. A complex rockslide developed from a deep-seated toppling failure in the upper Lancang River, Southwest China. Eng. Geol. 2021, 293, 106329. [Google Scholar] [CrossRef]
- Guo, C.; Ma, G.; Xiao, H.; Zhou, W.; Chen, H.; Zhou, Z.; Cheng, X. Displacement Back Analysis of Reservoir Landslide Based on Multi-Source Monitoring Data: A Case Study of the Cheyiping Landslide in the Lancang River Basin, China. Remote Sens. 2022, 14, 2683. [Google Scholar] [CrossRef]
- Tu, G.; Deng, H.; Li, M. Development and evolution of deep-seated toppling landslide by rapid river downcutting. Bull. Eng. Geol. Environ. 2023, 82, 185. [Google Scholar] [CrossRef]
- Zhang, Z.L. The Investigation on Stability of the Bank Slope of the Dam near Cihaxia Hydropower Station; Lanzhou University: Lanzhou, China, 2010. [Google Scholar]
- Zhang, Z.L. Genetic mechanism and stability evaluation about unloading toppling deformation slopes. West-China Explor. Eng. 2014, 2, 1–5. [Google Scholar]
- Zhang, Y.; Huang, C.C.; Shulmeister, J.; Guo, Y.; Liu, T.; Kemp, J.; Patton, N.; Liu, L.; Chen, Y.; Zhou, Q.; et al. Formation and evolution of the Holocene massive landslide-dammed lakes in the Jishixia Gorges along the upper Yellow River: No relation to China’s Great Flood and the Xia Dynasty. Quat. Sci. Rev. 2019, 218, 267–280. [Google Scholar] [CrossRef]
- Jiarui, M.A.O.; Tiefeng, L.I. GIS-based Analysis of Distribution and Development Characteristics of Landslide Hazards in the Bailong River Basin. In IOP Conference Series: Earth and Environmental Science; IOP Publishing: Bristol, UK, 2020; Volume 570, p. 062016. [Google Scholar]
- Tian, C.; Tian, H.; Li, C.; Chen, F. Stability Evaluation of Massive Landslides Using Ensembled Analysis of Time-Series InSAR and Numerical Simulation along the Yellow River, Northwestern of China. Geofluids 2022, 2022, 6546372. [Google Scholar] [CrossRef]
- Hu, S.; Qiu, H.; Wang, N.; Wang, X.; Ma, S.; Yang, D.; Wei, N.; Liu, Z.; Shen, Y.; Cao, M.; et al. Movement process, geomorphological changes, and influencing factors of a reactivated loess landslide on the right bank of the middle of the Yellow River, China. Landslides 2022, 19, 1265–1295. [Google Scholar] [CrossRef]
- Guo, Z.; Tian, B.; Li, G.; Huang, D.; Zeng, T.; He, J.; Song, D. Landslide susceptibility mapping in the Loess Plateau of northwest China using three data-driven techniques-a case study from middle Yellow River catchment. Front. Earth Sci. 2023, 10, 1033085. [Google Scholar] [CrossRef]
- Wu, L.; Deng, H.; Huang, R.; Zhang, L.; Guo, X.; Zhou, Y. Evolution of lakes created by landslide dams and the role of dam erosion: A case study of the Jiajun landslide on the Dadu River, China. Quat. Int. 2019, 503, 41–50. [Google Scholar] [CrossRef]
- Deng, H.; Zhong, C.Y.; Wu, L.; Tu, G.X. Process analysis of causes of Luanshigang landslide in the Dadu River, China. Environ. Earth Sci. 2021, 80, 737. [Google Scholar] [CrossRef]
- Ning, L.; Hu, K.; Wang, Z.; Luo, H.; Qin, H.; Zhang, X.; Liu, S. Multi-hazard chain reaction initiated by the 2020 Meilong debris flow in the Dadu River, Southwest China. Front. Integr. Disaster Risk Manag. Earth Sci. Policy Mak. 2022, 10, 142. [Google Scholar] [CrossRef]
- Huang, H.; Ju, S.; Duan, W.; Jiang, D.; Gao, Z.; Liu, H. Landslide Monitoring along the Dadu River in Sichuan Based on Sentinel-1 Multi-Temporal InSAR. Sensors 2023, 23, 3383. [Google Scholar] [CrossRef]
- Song, L. Studies on Stability on the Condition of Water-Level Fluctuation in Front of Dam of the I# Toppling Deformation Body of Emi Hydropower Station on the Nu River; Chengdu University of Technology: Chengdu, China, 2013. [Google Scholar]
- Ding, M.; Cheng, Z.; Wang, Q. Coupling mechanism of rural settlements and mountain disasters in the upper reaches of Min River. J. Mt. Sci. 2014, 11, 66–72. [Google Scholar] [CrossRef]
- Lin, L.; Chen, G.; Shi, W.; Jin, J.; Wu, J.; Huang, F.; Chong, Y.; Meng, Y.; Li, Y.; Zhang, Y. Spatiotemporal Evolution Pattern and Driving Mechanisms of Landslides in the Wenchuan Earthquake-Affected Region: A Case Study in the Bailong River Basin, China. Remote Sens. 2022, 14, 2339. [Google Scholar] [CrossRef]
- Yang, X.; Diao, X.; Zhou, T.; Hu, F.; Wang, S. Study on the stability of accumulated layer landslide under the coupling action of earthquake and rainfall. KSCE J. Civ. Eng. 2023, 27, 98–108. [Google Scholar] [CrossRef]
- Kang, F.S. Discussion on deformation mechanism of high steep dipslope behind Duosong hydroelectric station. Gansu Geol. 2007, 16, 76–79. [Google Scholar]
- Zhao, M.Y.; Zhang, H. Stability analysis of the rock slope behind Duosong hydroelectric station in Tao river. Pop. Sci. Technol. 2007, 5, 120–122. [Google Scholar]
- Zhou, K.F.; Wang, Z.S.; Zhang, S.C.; Zhang, H.K.; Chen, C. Safety evaluation of structural stability for the dumping slope at the right abutment of Kizil reservoir main dam. Gansu Geol. 2007, 21, 21–24. [Google Scholar]
- Song, R.H.; Qu, L. Cause analysis and treatment measures of the crack on the cutoff wall on the right bank of Kezier reservoir. Water Resour. Hydraul. Eng. Des. 2009, 28, 3–5. [Google Scholar]
- Zhang, Z.L.; Wu, S.; Tang, H.; Liu, G.; Li, G. Time dependent deformation of antithetic dip rock slope. Geol. Sci. Technol. Inf. 2014, 33, 181–187. [Google Scholar]
- MacMillan, R.A.; Shary, P.A. Landforms and landform elements in geomorphometry. Dev. Soil Sci. 2009, 33, 227–254. [Google Scholar]
- Wang, N.; Cheng, W.; Wang, B.; Liu, Q.; Zhou, C. Geomorphological regionalization theory system and division methodology of China. J. Geogr. Sci. 2020, 30, 212–232. [Google Scholar] [CrossRef]
- Dong, Y.; Liao, F.; Wang, D.; Du, C.; He, K. Present-day Tectonic Stress Field and GPS Observations in Hubei Province, Central China. Pure Appl. Geophys. 2020, 177, 3265–3281. [Google Scholar] [CrossRef]
- Kasanen, E.; Lukka, K.; Siitonen, A. The constructive approach in management accounting research. J. Manag. Account. Res. 1993, 5, 243–264. [Google Scholar]
- Singh, K.; Kumar, V. Hazard assessment of landslide disaster using information value method and analytical hierarchy process in highly tectonic Chamba region in bosom of Himalaya. J. Mt. Sci. 2018, 15, 808–824. [Google Scholar] [CrossRef]


| Grade | Description |
|---|---|
| 1 | Very low susceptibility area |
| 2 | Low susceptibility area |
| 3 | Medium susceptibility area |
| 4 | High susceptibility area |
| 5 | Very high susceptibility area |
| Grade | Description |
|---|---|
| 1 | Very low susceptibility area |
| 2 | Low susceptibility area |
| 3 | high susceptibility area |
| 4 | Very high susceptibility area |
| River | Information Amount | ||
|---|---|---|---|
| Upper Reaches | Middle Reaches | Lower Reaches | |
| Yalong | −∞ | 1.7918 | −∞ |
| Lancang | 0.2824 | — | −0.9067 |
| Yellow | 0.3464 | −0.5910 | −∞ |
Disclaimer/Publisher’s Note: The statements, opinions and data contained in all publications are solely those of the individual author(s) and contributor(s) and not of MDPI and/or the editor(s). MDPI and/or the editor(s) disclaim responsibility for any injury to people or property resulting from any ideas, methods, instructions or products referred to in the content. |
© 2023 by the authors. Licensee MDPI, Basel, Switzerland. This article is an open access article distributed under the terms and conditions of the Creative Commons Attribution (CC BY) license (https://creativecommons.org/licenses/by/4.0/).
Share and Cite
Li, X.; Cao, K.; Huang, S.; Xing, R.; Yang, Y. Development Pattern of Toppling Deformation Slopes in Western China. Appl. Sci. 2023, 13, 6596. https://doi.org/10.3390/app13116596
Li X, Cao K, Huang S, Xing R, Yang Y. Development Pattern of Toppling Deformation Slopes in Western China. Applied Sciences. 2023; 13(11):6596. https://doi.org/10.3390/app13116596
Chicago/Turabian StyleLi, Xingming, Kaiming Cao, Shaoping Huang, Ruiming Xing, and Yuanhai Yang. 2023. "Development Pattern of Toppling Deformation Slopes in Western China" Applied Sciences 13, no. 11: 6596. https://doi.org/10.3390/app13116596
APA StyleLi, X., Cao, K., Huang, S., Xing, R., & Yang, Y. (2023). Development Pattern of Toppling Deformation Slopes in Western China. Applied Sciences, 13(11), 6596. https://doi.org/10.3390/app13116596