Abstract
Mixed oxides of uranium and plutonium (MOX) are currently considered as a reference fuel for the new generation of fast breeder reactors such as ASTRID. The key factor determining the performance and safety of a fuel such as MOX is its operational limits in the application environment which are closely related to the material’s structure and thermodynamic stability. They are in turn closely related to the ambient (zero pressure) melting point ; thus, is an important engineering parameter. Furthermore, PuO and UO are two endpoints of the phase diagram of MOX; therefore, their ambient s are fundamental reference points. However, the current knowledge of the of MOX is limited and controversial as several studies available in the literature do not converge on the unique behavior of as a function of Specifically, some studies produced as a monotonically decreasing function of x such that, with of UO of 3150 K, of PuO is ∼2650 K, while other studies resulted in having a local minimum at such that of PuO is ∼3000 K, so that the difference between the two values of is as high as 350 K. In this study, using the ab initio Z method implemented with the Vienna Ab Initio Simulation Package (VASP), we carry out a suite of quantum molecular dynamics simulations to obtain the ambient of MOX at several values of including the two end points Our results agree with the behavior of of MOX as a function of x having a local minimum at and of PuO of 3050 K. Our study suggests potential ambient density–melting point systematics of MOX which may be useful in subsequent research on MOX such as its thermoelasticity modeling.
1. Introduction
1.1. Mixed Oxide Fuel (MOX)
Of all its alternatives, nuclear power seems to be one of the most reliable energy sources to achieve our goal of a world free of human-made CO emissions [1]. However, nuclear power has always been under scrutiny due to its potential impact on the environment, and the safety issues related to its use (this concern comes from accidents such as Chernobyl or Fukushima). The choice between the two possible nuclear fuels, uranium and mixed oxide (MOX), as the most adequate for the future of worldwide power has been under debate. MOX has the advantage of being less disposable as it produces less intermediate- and high-level waste. Furthermore, MOX is planned to be the fuel for the new generation of fast breeder reactors such as the Advanced Sodium Technological Reactor for Industrial Demonstration (ASTRID).
Uranium–plutonium MOX is the system UPuO, where x is the plutonium fraction; and correspond to stoichiometric and substoichiometric MOX, respectively. With low plutonium content (), it is used as a nuclear fuel in several thermal neutron reactors around the world. MOX with a higher plutonium content is expected to be a favorable fuel for fast neutron reactors (FNRs). The constraint of an oxygen-to-metal (O/M, M = U + Pu) ratio less than or equal to 2 is chosen as a safety precaution to protect the steel cladding from corrosion during irradiation in FNRs, even though this substoichiometry also has negative consequences such as a reduced thermal conductivity or the two-phase composition of the MOX. In this work, we will consider stoichiometric MOX only.
1.2. Ambient Melting Behavior
Of all the physical properties of a material, melting behavior is a fundamental property closely related to its structure and thermodynamic stability, and therefore has always been a crucial research subject. The ambient (zero pressure) melting point () is also an important engineering parameter as it defines the operational limits of a material in its application environment. It becomes critical in nuclear engineering where the thermo-mechanical stability of a nuclear fuel element is a key factor determining fuel performance and safety. Furthermore, PuO and UO are two endpoints of the phase diagram of MOX; therefore, their ambient s are fundamental reference points.
The current knowledge of of MOX is limited and controversial as the literature studies do not converge on the unique behavior of as a function of Specifically, studies [2,3] produced as a monotonically decreasing function of x such that, with of UO of 3150 K, of PuO is ∼2650–2700 K, while studies [4,5,6,7] resulted in having a local minimum at such that of PuO is ∼3000–3050 K, so that the difference between the two values of is as high as 350 K.
This controversy in the melting behavior of MOX is directy related to the ambiguity in the value of the ambient melting point of PuO as well as the melting behavior of MOX with high Pu content.
Since the 1960s, several groups have reported measurements of of PuO using various experimental techniques. Most of them are summarized in a review by Carbajo et al. [2] who recommended a value of K based on measurements circa 1960s using the thermal arrest technique on tungsten-encapsulated samples. More recently, Guéneau et al. [3] recommended a value of 2660 K based on published data and the thermodynamic modeling of the Pu-O system. However, in the same year, Kato et al. presented their experimental study [4,5] in which the then-commonly-accepted value of for PuO was called into question, and a considerably higher value of ∼3000 K was proposed. While using essentially the same thermal arrest technique as in the 1960s, Kato et al. paid particular attention not only to maintaining the exact O/M ratio, as the previous investigators did, but also to the effect of sample–containment interactions. In this way, they could attribute lower values of in the previous studies to extensive interactions between PuO samples and tungsten, typical crucible material in this range of The most recent experimental values of for PuO are K [6] and K [7].
The difficulties with the experimental determinations of the melting behavior of the stoichiometric MOX as well as the shortcomings of the experimental techniques used for these determinations are summarized in the recent review by Fouquet-Métivier et al. [8]. Specifically, (i) the interaction of the UPuO samples of high Pu content with tugsten crucibles, and in some cases with rhenium crucibles, drive the corresponding systematically lower; (ii) Pu content affects the measurements such that laser heating which is currently the most widely used technique causes a non-ideal behavior of the UO and PuO partitions of MOX which results in a distinct minimum of as a function of x at (iii) the measured values of are affected by the O/M ratio which varies in the atmosphere during the experiments, so that it is not clear whether the measured corresponds to an O/M of close to 2 in the stoichiometric case or if it is much less than 2.
Hence, the clarification of the behavior of as a function of x requires further study. Such study, based on first principles, is the subject of our work.
The reliability of the first-principle-based methods is widely accepted, specifically regarding the calculation of the melting curves and even complete phase diagrams including both melting curves (solid–liquid transition lines) and solid–solid phase transition boundaries. For example, comparison of the calculated melting curves of zinc [9], platinum [10] and osmium [11] to the corresponding experimental data of Refs. [9,10,12] reveals excellent agreement in each of the three cases. Similarly, complete first-principle-based phase diagrams of copper [13] and silver [14] are in good agreement with the experimental data of Refs. [15] and [16], respectively.
As regards the actinides and their compounds, a first-principle-based study of their melting curves or phase diagrams has not been undertaken yet. This is mainly related with the computational intensity of such studies and the availability of the adequate resource. Specifically, a 768-atom PuO system studied in our work, with the corresponding core–valence electron structure of both Pu and O (16 valence electrons of Pu and 6 of O), has a total of 7168 valence electrons (rather close to the current “unofficial” limit of 10,000 beyond which it is virtually impossible to run computer simulations to completion) which makes the simulations of such a system extremely time consuming. Thanks to the adequate computational resource at Los Alamos, we could complete these simulations within a reasonable amount of time of several months.
We now switch to the detailed discussion of the results of our first-principle-based study and the methods that we used.
2. Methods
In this paper, we calculate the ambient melting points of MOX at several values of including the two end points, using the ab initio Z method based on quantum molecular dynamics (QMD) simulations implemented with the Vienna Ab Initio Simulation Package (VASP). The Z method is described in detail in [11]. Our approach is based on density functional theory (DFT) with local density approximation (LDA). We note that the standard implementation of DFT with LDA in the case of PuO predicts the ground state with either ferromagnetic (FM) or antiferromagnetic (AFM) order which is inconsistent with the nonmagnetic (NM) ground state observed in experiment. Although the disagreement may be due to strong correlations of f-electrons of Pu, more advanced computational schemes such as standard LDA + U or hybrid DFT which take into account the strong correlation effects of f-electrons are known to fail to generate nonmagnetic ground states [17]. Only the schemes modified by the inclusion of spin–orbit coupling in addition to the correlation effects have been shown to generate the correct ground state [17]. Hence, here we use such an LDA + U computational scheme with spin–orbit coupling.
2.1. LDA + U Methodology
The use of the LDA + U methodology is not specific to UO, but is a standard approach to dealing with oxides in general. In particular, for UO it is used to achieve f-electron localization which prevents the appearance of delocalized f-electrons which would have resulted in non-integer uranium oxidation states, a nonphysical result considering recent experimental observations [18].
For our theoretical study the electronic structure of U was represented by [Xe 4f 5d] 5f 6s 6p 6d 7s (14 valence electrons), that of Pu by [Xe 4f 5d] 5f 6s 6p 7s (16 valence electrons), and that of O by [He] 2s 2p (6 valence electrons). The LDA + U approach was implemented with the Dudarev scheme [19] for which only the difference in the values of Hubbard coefficients U and J matters rather than each of them individually. We used (in eV) and for both U and Pu which seems to be the widely adopted choice. See, e.g., [17] or [20], in which the following sets of are chosen for U and Pu, respectively: and so that in either case eV.
The proper choice of U is also important for the system under consideration to have the correct physical properties: the FM, AFM, or NM ground state, the values of the magnetic moment per atom and the band gap in agreement with experiment, the correct lattice constant (or density), etc. We used the occupation matrix control (OCM) method which allows one to study the physical properties of systems of either of the three magnetic states as a function of OCM for VASP was suggested by Allen and Watson [21] and has become available in VASP starting with the version vasp5.3.5. Its use for both UO and PuO was very recently demonstrated by Chen and Kaltsoyannis [22]. Using their approach, we studied the properties of both UO and PuO as a function of In the case of UO imposing [22] (i) the AF ground state, (ii) magnetic moment of 1.8 (iii) the ground state lattice constant of 5.470 Å, and (iv) the band gap of eV leads to (in eV) (i) (ii) ( gives ), (iii) and (iv) so that, optimizing between the four criteria gives 3.5 and 4 as equally best overall choice of U for UO Similarly, in the case of PuO imposing [22] (i) the NM ground state, (ii) the ground state lattice constant of 5.395 Å, and (iii) the band gap of 1.8 eV leads to (in eV) (i) (ii) and (iii) so that, optimizing between the three criteria gives 4 and 4.5 as equally best overall choice of U for PuO In our study, we take eV for both UO and PuO; besides being one of the best overall choices, in view of the above considerations, it will ensure both the transferability of the “effective” inter-atomic interaction potentials within the UO and PuO components of MOX of a given composition and the ease of the reproducibility of our results by other researchers.
2.2. Melting Simulations
Both UO and PuO maintain their ambient cubic fluorite structure (Fmm) in the entire range of T up to the corresponding melting points. Specifically, for UO it is g/cm Å [23] while for PuO g/cm Å [24]. It is described in terms of a 12-atom unit cell containing four uranium atoms in face-centered cubic positions and eight oxygen atoms filling the tetrahedral sites; see Figure 1.
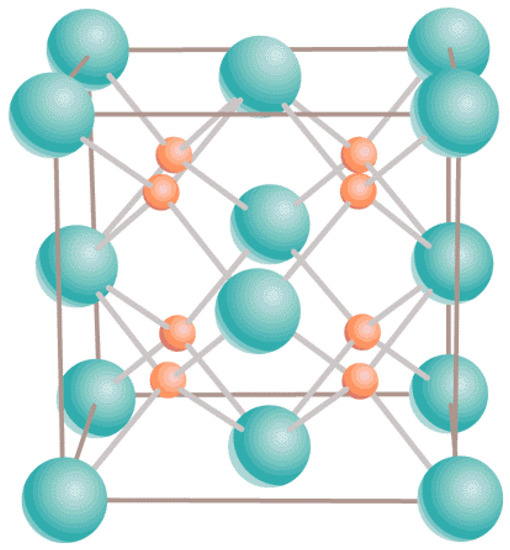
Figure 1.
The ambient fluorite structure of both UO and PuO. Uranium/plutonium atoms are shown in green, and oxygen atoms in orange.
For our melting simulations of MOX, we used a supercell of 324 atoms This supercell size ensures the convergence of total energy of each QMD simulation to eV/atom and that of Hellmann–Feynman forces on each atom to 0.01 eV/Å. The mixed UO-PuO system is modeled as a substitution alloy in which some U atoms (at randomly chosen lattice sites) are replaced by Pu ones according to the corresponding PuO content. For instance, in the case of UPuO 81 uranium atoms chosen at random are replaced with 81 plutonium atoms, etc.
In the melting simulations, the corresponding supercell is subject to a set of initial temperatures separated by an increment of 250 K and run with QMD in the ensemble, for a total of up to 25,000 time steps of 1 fs each for and (both pure UO and PuO) and up to 15,000 time steps of 1.5 fs each for , i.e., up to 25 ps in either case, to determine at the corresponding melting pressure As the system equilibrates upon the completion of the melting process, the values of and are determined from the corresponding running averages which are shown as solid lines in Figure 2, Figure 3, Figure 4, Figure 5, Figure 6, Figure 7 and Figure 8. Note that in any molecular dynamics simulations, either classical or ab initio quantum ones, similar to those discussed here, both T and P oscillate during a run. Figure 2, Figure 3, Figure 4, Figure 5, Figure 6, Figure 7, Figure 8 and Figure 9 detail such oscillations. Their magnitude depends on both the complexity of the substance under investigation and the system size: the more complex the substance and the smaller the system size the larger the amplitude of the oscillations, and vice versa. In our case the energy transfer between the lighter oxygen and heavier actinide subsystems during the QMD run results in larger-than-usual amplitude of the oscillations, up to ∼500 K for T and ∼5 GPa for However, we emphasize that it is the running averages only that matter not the oscillations around them which are just a molecular dynamics artifact. Over the running time as long as 20,000 time steps, uncertainty related to these oscillations is only a fraction of a percent, so that the corresponding running averages exhibit virtually the exact values of T and Hence, the running averages during the latest portion of the run yield the values of and Uncertainty of the value of intrinsic to the Z method is 125 K, half of the increment of [11], which turns out to constitute ∼2% of Uncertainty of the value of in our simulations is ∼0.5 GPa. Assuming that the initial slope of the melting curve at P = 0) is K/GPa (see below), a uncertainty of 0.5 GPa translates into a uncertainty of K. Therefore, the combined uncertainty of in our QMD simulations is K, which is within 5% of in each case. Thus, our results on the ambient are expected to be quite accurate overall.
3. Results
Our results of the QMD simulations of the ambient points of MOX are summarized in Table 1.

Table 1.
The ab initio melting points of UPuO, obtained from the Z method implemented with VASP, along with the values of lattice constants and densities at the corresponding .
Figure 2 and Figure 3 show the (ambient) melting run [11] of Fmm-UO at a density of 9.685 g/cc (lattice constant 5.700 Å) which corresponds to the first line in Table 1. As seen in Figure 2 and Figure 3, at the beginning of the run, the system equilibrates as a UO solid (i.e., a quasi-static cation/anyon system). After ∼6000 time steps (6 ps) T goes down and P goes up (since in the ensemble the total energy, is conserved). This is a signature of a superionic transition. Due to a 15-fold difference in the atomic masses of U and O, the oxygen sublattice becomes less stable than the plutonium one, and at sufficiently high T it disorders first, such that the anions (O) start flowing through the ordered structure of the cations (U). Such a (superionic) phase transition accompanied by a rapid increases in ionic conductivity has been observed in many diatomic systems. We note that for UO, this transition was discovered by Dworkin and Bredig [25] from a curvature change of the T dependence of the enthalpy.
Thus, the first drop in T (increase in P) corresponds to the activation of the oxygen flow. This process takes ∼3000 time steps (∼3 ps). Then the system of quasi-static cations and mobile anyons equilibrates, and the second drop in T (increase in P) occurs after a total of ∼13,000 time steps (∼13 ps). This second drop in T is associated with the disordering of the uranium sublattice, i.e., a true melting transition. The melting process takes ∼5000 time steps (5 ps). The emerging liquid equilibrates at .

Figure 2.
Time evolution of temperature in the Fmm-UO melting run at g/cc. The initial temperature is 8500 K.
Figure 2.
Time evolution of temperature in the Fmm-UO melting run at g/cc. The initial temperature is 8500 K.


Figure 3.
The same as in Figure 4 for the time evolution of pressure (in kbar; 10 kbar = 1 GPa).
Figure 3.
The same as in Figure 4 for the time evolution of pressure (in kbar; 10 kbar = 1 GPa).

Figure 4 and its P counterpart shown in Figure 9 demonstrate the (ambient) melting run of Fmm-PuO at a density of 10.50 g/cc (lattice constant 5.590 Å). We have obtained its three melting points close to based on which its ambient melting point was calculated (which corresponds to the last line in Table 1); see the next section. Just as for UO the occurrence of the superionic phase transition is very clearly seen. For PuO it was discovered by Chroneous et al. [26] from the analysis of oxygen self-diffusion coefficients. Superionic behavior of PuO was modeled in [27] using classical molecular dynamics.

Figure 4.
Time evolution of temperature in the Fmm-PuO melting run at g/cc. The initial temperature is 8000 K.
Figure 4.
Time evolution of temperature in the Fmm-PuO melting run at g/cc. The initial temperature is 8000 K.

Figure 5, Figure 6, Figure 7, Figure 8 and Figure 9 show the (ambient) melting runs of Fmm-UPuO 0.5, 0.7 and 0.9. The superionic phase transition occurs in each case, although it is not seen as clearly as for both pure UO and PuO.

Figure 5.
The same as in Figure 4 for UPuO.
Figure 5.
The same as in Figure 4 for UPuO.


Figure 6.
The same as in Figure 4 for UPuO.
Figure 6.
The same as in Figure 4 for UPuO.


Figure 7.
The same as in Figure 4 for UPuO.
Figure 7.
The same as in Figure 4 for UPuO.


Figure 8.
The same as in Figure 4 for UPuO.
Figure 8.
The same as in Figure 4 for UPuO.


Figure 9.
The same as in Figure 3 for UPuO Only the running averages are shown in either case.
Figure 9.
The same as in Figure 3 for UPuO Only the running averages are shown in either case.

To conclude this section, we note that, since in the ensemble the total energy, is conserved, one should expect the plots of the time evolution of T and P during a QMD run to be exact mirror images of each other (i.e., when T drops, P increases, and vice versa). This is indeed the case for each of the elemental solids studied using the Z method, e.g., Refs. [11,13,14], which all offer the corresponding plots. In our case of stoichiometric MOX, for smaller 324-atom systems such P-T, mirror reflection is not clearly observable, although their time evolution during the QMD run follows the right tendency—when T drops, P increases. This mirror-reflection behavior becomes almost exact in the case of a larger 768-atom system, as Figure 10, Figure 11, Figure 12 and Figure 13 clearly demonstrate. The observed violations of the P-T “mirror reflectivity” for a smaller system may be related to the 15-fold difference in the atomic masses of M (=U + Pu) and O and the way VASP calculates T and however, the detailed analysis of the reasons for these violations goes far beyond the scope of this work. We note that, in any event, the results on the 324-atom systems are reliable since these systems are fully converged in regard to the system size, as discussed in more detail below.
The following section offers the detailed discussion of our results.
4. Discussion
We have obtained six ab initio melting points of MOX, including the two endpoints, which are listed in Table 1. The best polynomial fit to these six s, Equation (2) below, results in the melting line of MOX which is one of the fundamental features of its phase diagram. Our results appear to agree with Refs. [4,5,6,7] on the behavior of of MOX as a function of x having a local minimum at and of PuO of 3050 K. In what follows, we dwell upon several key issues related to our study: (i) the validity of our results in regard to the convergence with respect to the system size; (ii) the initial slope of the melting curve of PuO one of the end members of MOX, in comparison to that of UO the other end member for which it is known experimentally; (iii) the ambient phase diagram of stoichiometric MOX which is determined by its melting line based on the size s determined in this work; and (iv) potential ambient density–melting point systematics of MOX which may be useful for its thermoelasticity modeling.
4.1. Energy Convergence of Our Results with Respect to the System Size
Although full energy convergence is achieved in each QMD simulation, the accuracy of our results in regard to the system size must also be ensured. We checked that the full energy convergence of our results with respect to the system size is achieved for both UO and PuO Since all the MOX systems were studied using supercells of exactly the same size as that of both UO and PuO namely UO + x PuO full energy convergence must have been achieved in each case. Specifically, in the case of UO a supercell of 324 atoms is enough to achieve the energy convergence of up to 1 meV/atom, or uncertainty of ∼10 K as regards the value of which is an order of magnitude less than the uncertainty of the Z method itself. Indeed, direct comparison of total energies as the outcomes of the 324- and 768-atom runs, for both UO and PuO clearly shows that the 1 meV/atom energy convergence was already achieved. Figure 10 and Figure 11 demonstrate the (ambient) melting run of the 768-atom UO system. In this case K, which is consistent with its 324-atom counterpart of ≈3150 K within the uncertainty of the method itself. Similarly, Figure 12 and Figure 13 demonstrate the (ambient) melting run of the 768-atom PuO system. In this case K, which is also consistent with its 324-atom counterpart of ≈3050 K within the uncertainty of the method itself. It is clearly seen in these figures that has also converged, just as .

Figure 10.
The same as in Figure 2 for the 768-atom UO system.
Figure 10.
The same as in Figure 2 for the 768-atom UO system.


Figure 11.
The same as in Figure 3 for the 768-atom UO system.
Figure 11.
The same as in Figure 3 for the 768-atom UO system.


Figure 12.
The same as in Figure 4 for the 768-atom PuO system.
Figure 12.
The same as in Figure 4 for the 768-atom PuO system.


Figure 13.
The same as in Figure 3 for the 768-atom PuO system. Only the running average is shown.
Figure 13.
The same as in Figure 3 for the 768-atom PuO system. Only the running average is shown.

4.2. Initial Slope of the Melting Curve of PuO2
The initial melting slope is an important thermodynamic characteristic of a substance because (i) it relates the melting point with the latent heat of fusion, and volume change at melt, via the Clausius–Clapeyron formula hence it is important for the validation of the thermodynamic modeling using, e.g., Calphad’s approach, and (ii) it is related to the parameters a and b of the Simon–Glatzel (SG) melting equation via hence it is important for the validation of the melting curve as a whole and of the corresponding SG equation.
Theoretical calculations and thermal expansion estimates reveal that at T∼3000 K, the lattice constant of the fluorite structure of PuO is ∼5.6 Å [24]. We therefore ran melting simulations for a set of three supercells having a lattice constant of ∼5.6 Å to determine the low-P segment of the melting point of PuO in order to obtain its initial slope to estimate the uncertainty in T associated with a potential uncertainty in Our results are summarized in Table 2.
Table 2.
The three ab initio melting points of PuO, obtained from the Z method implemented with VASP.
The three melting points of PuO are shown in Figure 14. Taking into account the corresponding uncertainties, the resulting analytic form that describes them best is
where P stands for pressure, which can be considered as the low-P () melting curve of PuO Thus, the ab initio ambient melting point of plutonim oxide that results from our QMD simulations is K, which is in excellent agreement with the most recent experimental studies: K [6] and K [7]. The initial slope of the PuO melting curve given by Equation (1), 92.5 K/GPa, is consistent with the known value of this slope for UO the other endpoint of MOX: K/GPa [28]. We note that the ambient melting points of PuO and UO appear to be close to each other as well: ∼3050 K and ∼3150 K (e.g., 3147 K [28]), respectively.
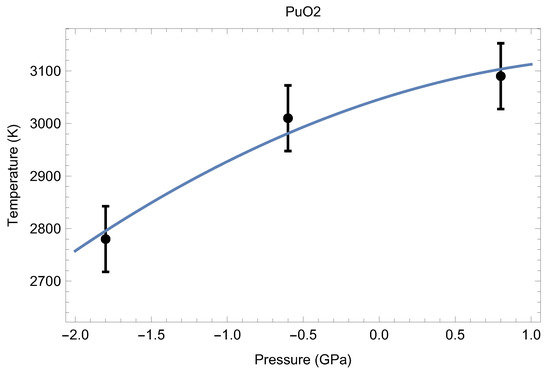
Figure 14.
The low-pressure melting curve () of PuO as the best fit to the three ab initio melting points obtained in this study.
4.3. The Ambient Phase Diagram of Stoichiometric MOX
Figure 15 compares our theoretical results on the ambient melting points of UPuO at 0.25, 0.5, 0.7, 0.9 and 1, summarized in Table 1, to the experimental data from the literature. In this respect, Figure 15 represents the current knowledge of the ambient phase diagram of stoichiometric MOX.
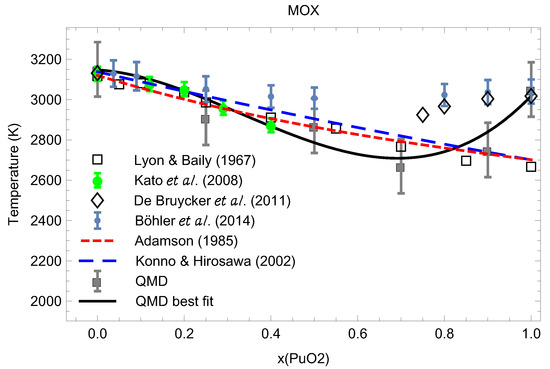
Figure 15.
The ambient phase diagram of stoichiometric MOX: comparison of the theoretical ab initio melting points obtained in this work to the experimental data from the literature [4,7,29,30,31,32].
We note excellent agreement betwen our melting line, as the best fit to our melting data from Table 1,
(shown as black line in Figure 15) and the experimental data of Kato et al. [4] (shown as green bullets), as well as good agreement with the results of Lyon and Baily [29] (shown as empty squares) up to x∼0.8. Other experimental data shown in Figure 15 come from [7,30,31,32]. We also note that for MOX with high PuO content , disagreement between our QMD results and those of Refs. [7,30] is beyond three standard deviations; hence, additional research is needed towards the resolution of this discrepancy.
4.4. Potential Ambient Density–Melting Point Systematics of MOX
Our QMD results suggest potential ambient density–melting point systematics of MOX which may be useful in subsequent research on MOX such as its thermoelasticity modeling. Figure 16 shows both the density of MOX at its ambient and its ambient as a function of the PuO content.
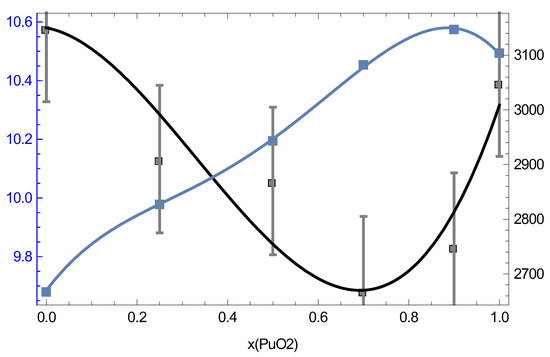
Figure 16.
The ambient density (left y-axis, g/cm) and melting point (right y-axis, K) of MOX as a function of the PuO content.
It is clearly seen that and are sort of “mirror images” of each other, in the sense that when one increases, the other decreases, and vice versa. Taking into account uncertainties in the following relation is found:
Thus, is a constant to within ∼93% accuracy. This relation can be used for, e.g., thermoelasticity modeling. The dislocation mediated melting model [33] suggests that along the melting curve [34], where is the shear modulus at Hence, in view of (3), one should expect that for MOX which can be used as a constraint for modeling as well as in the Preston–Wallace thermoelasticity model [35] =
5. Conclusions
In this study, we obtained the ambient melting points of MOX at several values of including the two end points using the ab initio Z method based on QMD implemented with VASP, and compared them to experimental and independent theoretical results available in the literature. This comparison is shown in Figure 15 which demonstrates very good agreement with the literature results and ours. Specifically, our results appear to agree with Refs. [4,5,6,7] on the behavior of of MOX as a function of x having a local minimum at and of PuO of 3050 K. Figure 15 represents the current knowledge of the ambient phase diagram of stoichiometric MOX; this knowledge will be advanced in subsequent studies on the subject.
As Figure 16 clearly shows, the distinct maximum of corresponds to while the distinct minimum of to We note that a very recent study of the MOX phase diagram using Calphad’s methodology [8] suggests the phase diagram of MOX (Figure 5 of [8]) which is very similar to ours, Figure 15, for which the melting line also has a distinct minimum at but which is in better agreement with the experimental results by Böhler et al. [7] rather than those of both Kato et al. [4] and Lyon and Baily [29] that our MOX phase diagram is. This is why their value of at is ≈2975 K, about 300 K above ours. One additional source of uncertainty of experimental measurements may be the variation of the O/M ratio during the melting of MOX in the atmosphere which may contribute as much as K to the error in the exeprimental [36]. In any event, the above two values of for MOX with cannot be reconciled with each other within the uncertainties of our method itself; thus, additional studies are necessary to elucidate the nature of this discrepancy and to shed more light on the phase diagram of MOX.
Our study suggests potential ambient density–melting point systematics of MOX which may be useful in subsequent research on MOX such as its thermoelasticity modeling.
Author Contributions
Methodology, L.B., S.D.R. and R.S.B.; investigation, L.B., S.D.R. and R.S.B.; writing—original draft preparation, L.B.; writing—review and editing, S.D.R. and R.S.B.; project administration, S.D.R. and R.S.B.; funding acquisition, S.D.R. and R.S.B. All authors have read and agreed to the published version of the manuscript.
Funding
This research was carried out under the auspices of the US DOE/NNSA.
Data Availability Statement
All the data discussed in this work are available from the corresponding author upon request.
Acknowledgments
The QMD simulations were performed on the LANL cluster Badger as part of the Institutional Computing projects w20phadiagurox and w22phadiagractox.
Conflicts of Interest
The authors declare no conflict of interest.
References
- Shellenberger, M. Had They Bet on Nuclear, Not Renewables, Germany & California Would Already Have 100% Clean Power. Available online: https://www.forbes.com/sites/michaelshellenberger/2018/09/11/had-they-bet-on-nuclear-not-renewables-germany-california-would-already-have-100-clean-power/#e9a4e94e0d44 (accessed on 2 May 2023).
- Carbajo, J.J.; Yoder, G.L.; Popov, S.G.; Ivanov, V.K. A review of the thermophysical properties of MOX and UO2 fuels. J. Nucl. Mater. 2001, 299, 181–198. [Google Scholar] [CrossRef]
- Guéneau, C.; Chatillon, C.; Sundman, B. Thermodynamic modelling of the plutonium–oxygen system. J. Nucl. Mater. 2008, 378, 257–272. [Google Scholar] [CrossRef]
- Kato, M.; Morimoto, K.; Sugata, H.; Konashi, K.; Kashimura, M.; Abe, T. Solidus and liquidus of plutonium and uranium mixed oxide. J. Alloys Compd. 2008, 452, 48–53. [Google Scholar] [CrossRef]
- Kato, M.; Morimoto, K.; Sugata, H.; Konashi, K.; Kashimura, M.; Abe, T. Solidus and liquidus temperatures in the UO2–PuO2 system. J. Nucl. Mater. 2008, 373, 237–245. [Google Scholar] [CrossRef]
- De Bruycker, F.; Boboridis, K.; Manara, D.; Pöml, P.; Rini, M.; Konings, R.J. Reassessing the melting temperature of PuO2. Mater. Today 2010, 13, 52–55. [Google Scholar] [CrossRef]
- Böhler, R.; Well, M.J.; Prieur, D.; Cakir, P.; Vitova, T.; Pruessmann, T.; Pidchenko, I.; Hennig, C.; Guéneau, C.; Konings, R.J.; et al. Recent advances in the study of the UO2-PuO2 phase diagram at high temperatures. J. Nucl. Mater. 2014, 448, 330. [Google Scholar] [CrossRef]
- Fouquet-Métivier, P.; Martin, P.M.; Manara, D.; Dardenne, K.; Rothe, J.; Fossati, P.C.; Guéneau, C. Investigation of the solid/liquid phase transitions in the U–Pu–O system. Calphad 2023, 80, 102523-1–102523-18. [Google Scholar] [CrossRef]
- Errandonea, D.; MacLeod, S.G.; Ruiz-Fuertes, J.; Burakovsky, L.; McMahon, M.I.; Wilson, C.W.; Ibañez, J.; Daisenberger, D.; Popescu, C. High-pressure/high-temperature phase diagram of zinc. J. Phys. Condens. Matter. 2018, 30, 295402-1–295402-8. [Google Scholar] [CrossRef]
- Anzellini, S.; Monteseguro, V.; Bandiello, E.; Dewaele, A.; Burakovsky, L.; Errandonea, D. In situ characterization of the high pressure–high temperature melting curve of platinum. Sci. Rep. 2019, 9, 13034. [Google Scholar] [CrossRef]
- Burakovsky, L.; Burakovsky, N.; Preston, D.L. Ab initio melting curve of osmium. Phys. Rev. B 2015, 92, 174105. [Google Scholar] [CrossRef]
- Patel, N.N.; Sunder, M. High pressure melting curve of osmium up to 35 GPa. J. Appl. Phys. 2018, 125, 055902-1–055902-5. [Google Scholar] [CrossRef]
- Baty, S.R.; Burakovsky, L.; Errandonea, D. Ab initio phase diagram of copper. Crystals 2021, 11, 537. [Google Scholar] [CrossRef]
- Baty, S.R.; Burakovsky, L.; Errandonea, D. Ab initio phase diagram of silver. J. Phys. Condens. Matter. 2021, 33, 485901-1–485901-10. [Google Scholar] [CrossRef]
- Sims, M.; Briggs, R.; Volz, T.J.; Singh, S.; Hamel, S.; Coleman, A.L.; Coppari, F.; Erskine, D.J.; Gorman, M.G.; Sadigh, B.; et al. Experimental and theoretical examination of shock-compressed copper through the fcc to bcc to melt phase transitions. J. Appl. Phys. 2022, 132, 075902-1–075902-11. [Google Scholar] [CrossRef]
- Coleman, A.L.; Singh, S.; Vennari, C.E.; Smith, R.F.; Volz, T.J.; Gorman, M.G.; Clarke, S.M.; Eggert, J.H.; Coppari, F.; Fratanduono, D.E.; et al. Quantitative measurements of density in shock-compressed silver up to 330 GPa using x-ray diffraction. J. Appl. Phys. 2022, 131, 015901-1–015901-10. [Google Scholar] [CrossRef]
- Nakamura, H.; Machida, M.; Kato, M. LDA+U study on plutonium dioxide with spin–orbit couplings. Prog. Nucl. Sci. Technol. 2011, 2, 16. [Google Scholar] [CrossRef]
- Kvashnina, K.O.; Butorin, S.M.; Martin, P.; Glatzel, P. Chemical state of complex uranium oxides. Phys. Rev. Lett. 2013, 111, 235002–235005. [Google Scholar] [CrossRef]
- Dudarev, S.L.; Botton, G.A.; Savrasov, S.Y.; Humphreys, C.J.; Sutton, A.P. Electron-energy-loss spectra and the structural stability of nickel oxide: An LSDA+ U study. Phys. Rev. B 1998, 57, 1505. [Google Scholar] [CrossRef]
- Yang, Y.; Wang, B.; Zhang, P. Electronic and mechanical properties of ordered (Pu, U) O2 compounds: A density functional theory +U study. J. Nucl. Mater. 2013, 433, 345. [Google Scholar] [CrossRef]
- Allen, J.P.; Watson, G.W. Occupation matrix control of d- and f-electron localisations using DFT + U. Phys. Chem. Chem. Phys. 2014, 16, 21016–21031. [Google Scholar] [CrossRef]
- Chen, J.-L.; Kaltsoyannis, N. DFT + U Study of uranium dioxide and plutonium dioxide with occupation matrix control. J. Phys. Chem. C 2022, 126, 11426–11435. [Google Scholar] [CrossRef] [PubMed]
- Allen, G.C.; Holmes, N.R. A mechanism for the UO2 to α-U3O8 phase transformation. J. Nucl. Mater. 1995, 223, 231. [Google Scholar] [CrossRef]
- Wan, M.; Zhang, L.; Du, J.; Huang, D.; Wang, L.; Jiang, G. The MD simulation of thermal properties of plutonium dioxide. Phys. B 2012, 407, 4595. [Google Scholar]
- Dworkin, A.S.; Bredig, M.A. Diffuse transition and melting in fluorite and antifluorite type of compounds. Heat content of potassium sulfide from 298 to 1260. degree. K. J. Phys. Chem. 1968, 72, 1277. [Google Scholar] [CrossRef]
- Chroneos, A.; Fitzpatrick, M.E.; Tsoukalas, L.H. Describing oxygen self-diffusion in PuO2 by connecting point defect parameters with bulk properties. J. Mater. Sci. Mater. Electron. 2015, 26, 3287. [Google Scholar] [CrossRef]
- Günay, S.D.; Akgenç, B.; Taşseven, Ç. Modeling Superionic Behavior of Plutonium Dioxide. High Temp. Mater. Proc. 2016, 35, 999. [Google Scholar] [CrossRef]
- Manara, D.; Ronchi, C.; Sheindlin, M.; Lewis, M.; Brykin, M. Manara D, Ronchi C, Sheindlin M, Lewis M, Brykin M. Melting of stoichiometric and hyperstoichiometric uranium dioxide. J. Nucl. Mater. 2005, 342, 148. [Google Scholar] [CrossRef]
- Lyon, W.L.; Baily, W.E. The solid–liquid phase diagram for the UO2-PuO2 system. J. Nucl. Mater. 1967, 22, 332–339. [Google Scholar] [CrossRef]
- De Bruycker, F.; Boboridis, K.; Konings, R.J.; Rini, M.; Eloirdi, R.; Guéneau, C.; Dupin, N.; Manara, D. On the melting behaviour of uranium/plutonium mixed dioxides with high-Pu content: A laser heating study. J. Nucl. Mater. 2011, 419, 186–193. [Google Scholar] [CrossRef]
- Adamson, A.M.G.; Aitken, E.A.; Caputi, R.W. Experimental and thermodynamic evaluation of the melting behavior of irradiated oxide fuels. J. Nucl. Mater. 1985, 130, 349–365. [Google Scholar] [CrossRef]
- Konno, K.; Hirosawa, T. Melting temperature of mixed oxide fuels for fast reactors. J. Nucl. Sci. Technol. 2002, 39, 771–777. [Google Scholar] [CrossRef]
- Burakovsky, L.; Preston, D.L.; Silbar, R.R. Melting as a dislocation-mediated phase transition. Phys. Rev. B 2000, 61, 15011. [Google Scholar] [CrossRef]
- Burakovsky, L.; Preston, D.L.; Silbar, R.R. Analysis of dislocation mechanism for melting of elements: Pressure dependence. J. Appl. Phys. 2000, 88, 6294–6301. [Google Scholar] [CrossRef]
- Preston, D.L.; Wallace, D.C. A model of the shear modulus. Solid state communications. Solid State Commun. 1992, 81, 277–281. [Google Scholar] [CrossRef]
- Strach, M.; Manara, D.; Belin, R.C.; Rogez, J. Melting behavior of mixed U–Pu oxides under oxidizing conditions. Nucl. Instrum. Methods Phys. Res. B 2016, 374, 125–128. [Google Scholar] [CrossRef]


Disclaimer/Publisher’s Note: The statements, opinions and data contained in all publications are solely those of the individual author(s) and contributor(s) and not of MDPI and/or the editor(s). MDPI and/or the editor(s) disclaim responsibility for any injury to people or property resulting from any ideas, methods, instructions or products referred to in the content. |
© 2023 by the authors. Licensee MDPI, Basel, Switzerland. This article is an open access article distributed under the terms and conditions of the Creative Commons Attribution (CC BY) license (https://creativecommons.org/licenses/by/4.0/).