Article

Computational Analysis of Nanocarriers in the Tumor Microenvironment for the Treatment of Colorectal Cancer

by
Esteban Vallejo Morales
1,*,
Gustavo Suárez Guerrero
2,*,
Lina M. Hoyos Palacio
3 and
Yvon Maday
4
1
Grupo de Investigación Sobre Nuevos Materiales, Universidad Pontificia Bolivariana, Cir. 1 # 70-01, Medellín 050031, Colombia
2
Grupo de Investigación e Innovación en Energía, Institución Universitaria Pascual Bravo, Cl. 73 # 73a-226, Medellín 050036, Colombia
3
Grupo de Investigación en Biología de Sistemas, Universidad Pontificia Bolivariana, Cir. 1 # 70-01, Medellín 050031, Colombia
4
Laboratoire Jacques-Louis Lions (LJLL), Sorbonne Université, Université Paris-Diderot SPC, CNRS, F-75005 Paris, France
*
Authors to whom correspondence should be addressed.
Appl. Sci. 2023, 13(10), 6248; https://doi.org/10.3390/app13106248
Submission received: 5 April 2023 / Revised: 25 April 2023 / Accepted: 5 May 2023 / Published: 19 May 2023
(This article belongs to the Special Issue Application of Targeted Therapy in Cancer Treatment)

Abstract

:
Colorectal cancer is currently treated by surgical procedures, chemotherapy and radiotherapy; however, these latest treatments are highly aggressive, with side effects that affect the patient’s quality of life. The scientific union has been investigating other more favorable alternatives, such as targeted therapy, which seeks greater selectivity in the type of target cells. This type of treatment can significantly reduce side effects in the patient. The goal of this research is to computationally visualize the behavior of nanocarriers in the colon tumor microenvironment, as well as their capacity for deepening, selective coupling and differentiating between healthy and cancerous tissue. A group of histological samples of cancerous tissue was selected, based on morphological criteria and the stage of the disease. This was used to elaborate 2D and 3D models to study different cases using artificial vision and computer simulation techniques. The results indicated velocities of the nanocarriers that reached values between 1.40 and 8.69 × 10 7 m s for a time of 3.88 h, with a vectorized deposition efficiency of 1.0 to 4.46%. In addition, selective mating events were achieved at a maximum depth of 4.68 × 10⁻⁴ m. This scientific knowledge can contribute to the estimation of the efficacy of the treatment, as well as the assessment for different dosage levels and frequency of drug administration from the studies carried out on the lesion.

1. Introduction

Colorectal cancer has generally been treated by surgical and therapeutic procedures performed by removing the tumor lesion or administering drugs to attack cancer cells. Therapeutic procedures such as chemotherapy and radiotherapy techniques (e.g., the combination of oligodeoxynucleotides (ODNs) that target the Oct4-Sox2 complex with radiotherapy) have been investigated as a potential therapeutic strategy for cancer treatment [1,2], but could be significantly aggressive, causing side effects that affect the patient’s quality of life.
According to Basave et al. [3], for 60 to 70% of colon cancer patients presenting with a localized disease, surgery can be curative; however, 40 or 50% of them can relapse and die from metastatic disease. For this reason, there exists treatment with adjuvant chemotherapy, which aims to destroy micrometastatic disease to improve local control and progression-free survival. This is especially critical for the patient, since for every four weeks that this treatment is delayed, survival decreases by 14% [3,4].
The main drugs prescribed in this type of treatment are 5-fluorouracil (5-FU), whose target molecule is the protein thymidylate synthase (TS), which is necessary for DNA synthesis in the S phase of the cell cycle, and is inhibited by binding to this drug. However, combinations with leucovorin, irinotecan, or oxaliplatin with 5-FU and folinic acid have shown an increase in both response rates and progression-free period in stage IIIA and IIIB patients [4,5], and as a result, 5-fluorouracil is rarely used as a single agent [6]. Irinotecan (IRT), on the other hand, is a cytotoxic drug with antiproliferative properties on several types of malignant tumors. Its target molecule is topoisomerase I (Topo1), since it triggers cell death by trapping the enzyme in DNA, generating DNA breaks linked to cytotoxic proteins [7]. Quoting [8]: “In patients with advanced colorectal cancer, irinotecan is used as first-line therapy in combination with fluoropyrimidines or as a single agent or in combination with cetuximab after failure of a 5FU/oxaliplatin regimen”. Finally, Capecitabine, which is an orally administered prodrug of 5-FU, is approved for the treatment of patients with metastatic breast cancer and metastatic colorectal cancer. The recommended dose is given in two divided doses with food for 2 weeks, followed by a 1-week rest period [6].
Some chemotherapy drugs can damage cells in the heart, kidneys, bladder, and lungs, while others cause long-term side effects such as heart disease, nerve damage, and fertility problems [9]. To reduce the adverse effects of conventional treatments, the scientific community has focused on targeted therapy, seeking to provide the drug with greater specificity by directing the particles (liposomes) towards cancer cells, a procedure known as vectorization.
Targeted therapy is characterized by providing the drug with greater specificity through a possible targeting of the particles towards cancer cells through the vectorization of liposomes with different coatings [10,11,12,13]. Some of the most promising targeted therapy drugs include: antibodies against epidermal growth receptor (EGFR); vascular endothelial growth factor (VEGF) and its receptor (VEGFR), such as Bevacizumab [5], Cetuximab [14] and Panitumumab, approved by FDA (Food and Drug Administration) for the management of metastatic colorectal carcinoma in EGFR-expressing patients who progress after fluoropyrimidine, irinotecan, and oxaliplatin chemotherapy regimens [3].
The use of nanomedicine in targeted therapy contributes to the selectivity of treatments through the development of nanoparticle encapsulation and functionalization mechanisms [13,15,16]; these particles may be nanocarriers such as dendrimers, which are artificial macromolecules configured similar to a tree, to efficiently capture and transport bioactive compounds [17,18]; micelles, which stand out for their ability to improve lipophilic drug solubility and early degradation due to their core-shell structure (hydrophilic head and lipophilic tail) [17,18]; and finally, liposomes [13,19], which are vesicles with a diameter of 25 to 500 nm and a thickness of about 5 nm that form in water. In said nanocarrier, the hydrophobic drug is enclosed in the aqueous process of the liposomes, while the hydrophilic drug is found in the bilayer of lipid functionality [17].
Liposomes have been used in different investigations for the treatment of colorectal cancer with results indicating that coating their surface with polymers and ligands increases their mucopenetration capacity, especially when liposomes modified with polyethylene glycol (PEG) are used [20,21,22]. These same polymeric coatings also allow oral liposomal formulations to resist degradation in the harsh environment of the GI tract, including bile salts and enzymes that would normally dissolve the lipid bilayer [23]; likewise, this modification of the surface of the nanoparticles not only increases their stability, adhesion and permeability, but also improves the sustained and controllable release properties of the drug [18,20,23,24].
Some authors have considered computationally modeling the coupling between the ligand and receptor with molecular dynamics techniques such as docking; however, they have excluded the transport of nanoparticles through the tumor microenvironment [25,26]. Other computational studies have preferred to study the progression of the disease [27,28], metastatic and intravasation processes [29,30], and the stability in water-soluble compounds and encapsulation of anticancer drugs [31]; however, these studies have not focused on the transit of drug particles within the tumor.
This research aims to graphically visualize the behavior of nanocarriers in the tumor microenvironment and their deepening capacity, in addition to verifying whether conditions can be effectively provided for the selective internalization of particles in cancer cells.

2. Results

The results of the computational simulations and algorithms implemented on the coupling behavior between nano-carriers (liposomes) and three different samples of malignant cell regions are presented below.

2.1. Results on Selected Samples

Results were obtained for 3 representative samples in 2D and a validation of the behavior found in the particles through a fourth 3D simulation. The results for each representative sample are presented below.

2.1.1. First Sample

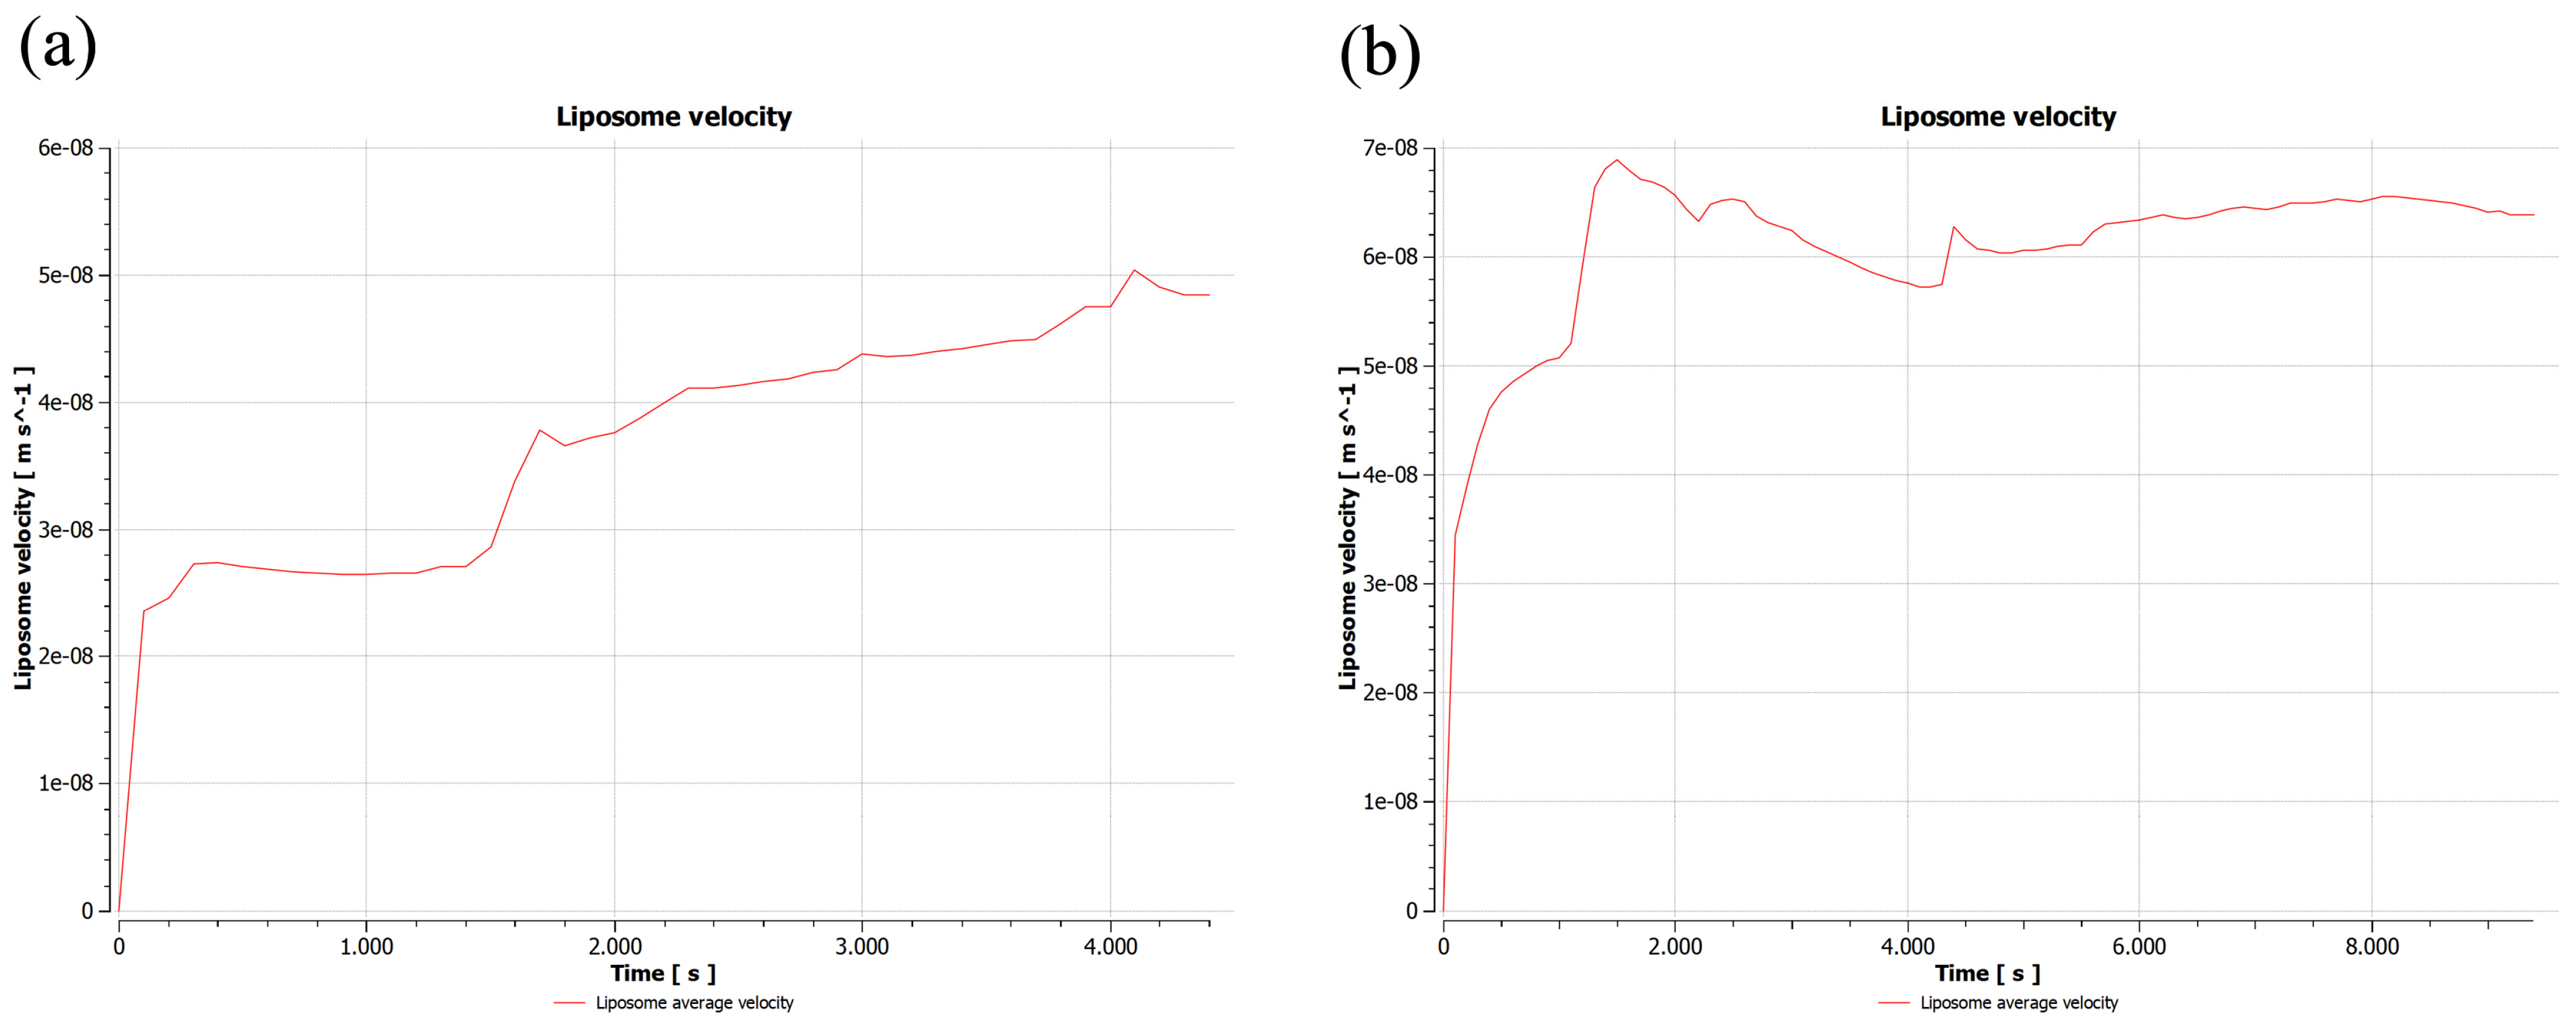
For histological sample 1, the results indicated the mobility of the liposomes in a range of velocities between 2.46 and 6.27 × 10 7 m s . The velocity of the interstitial fluid varied between 0 and 4.79 × 10 7 m s , see Figure 1.
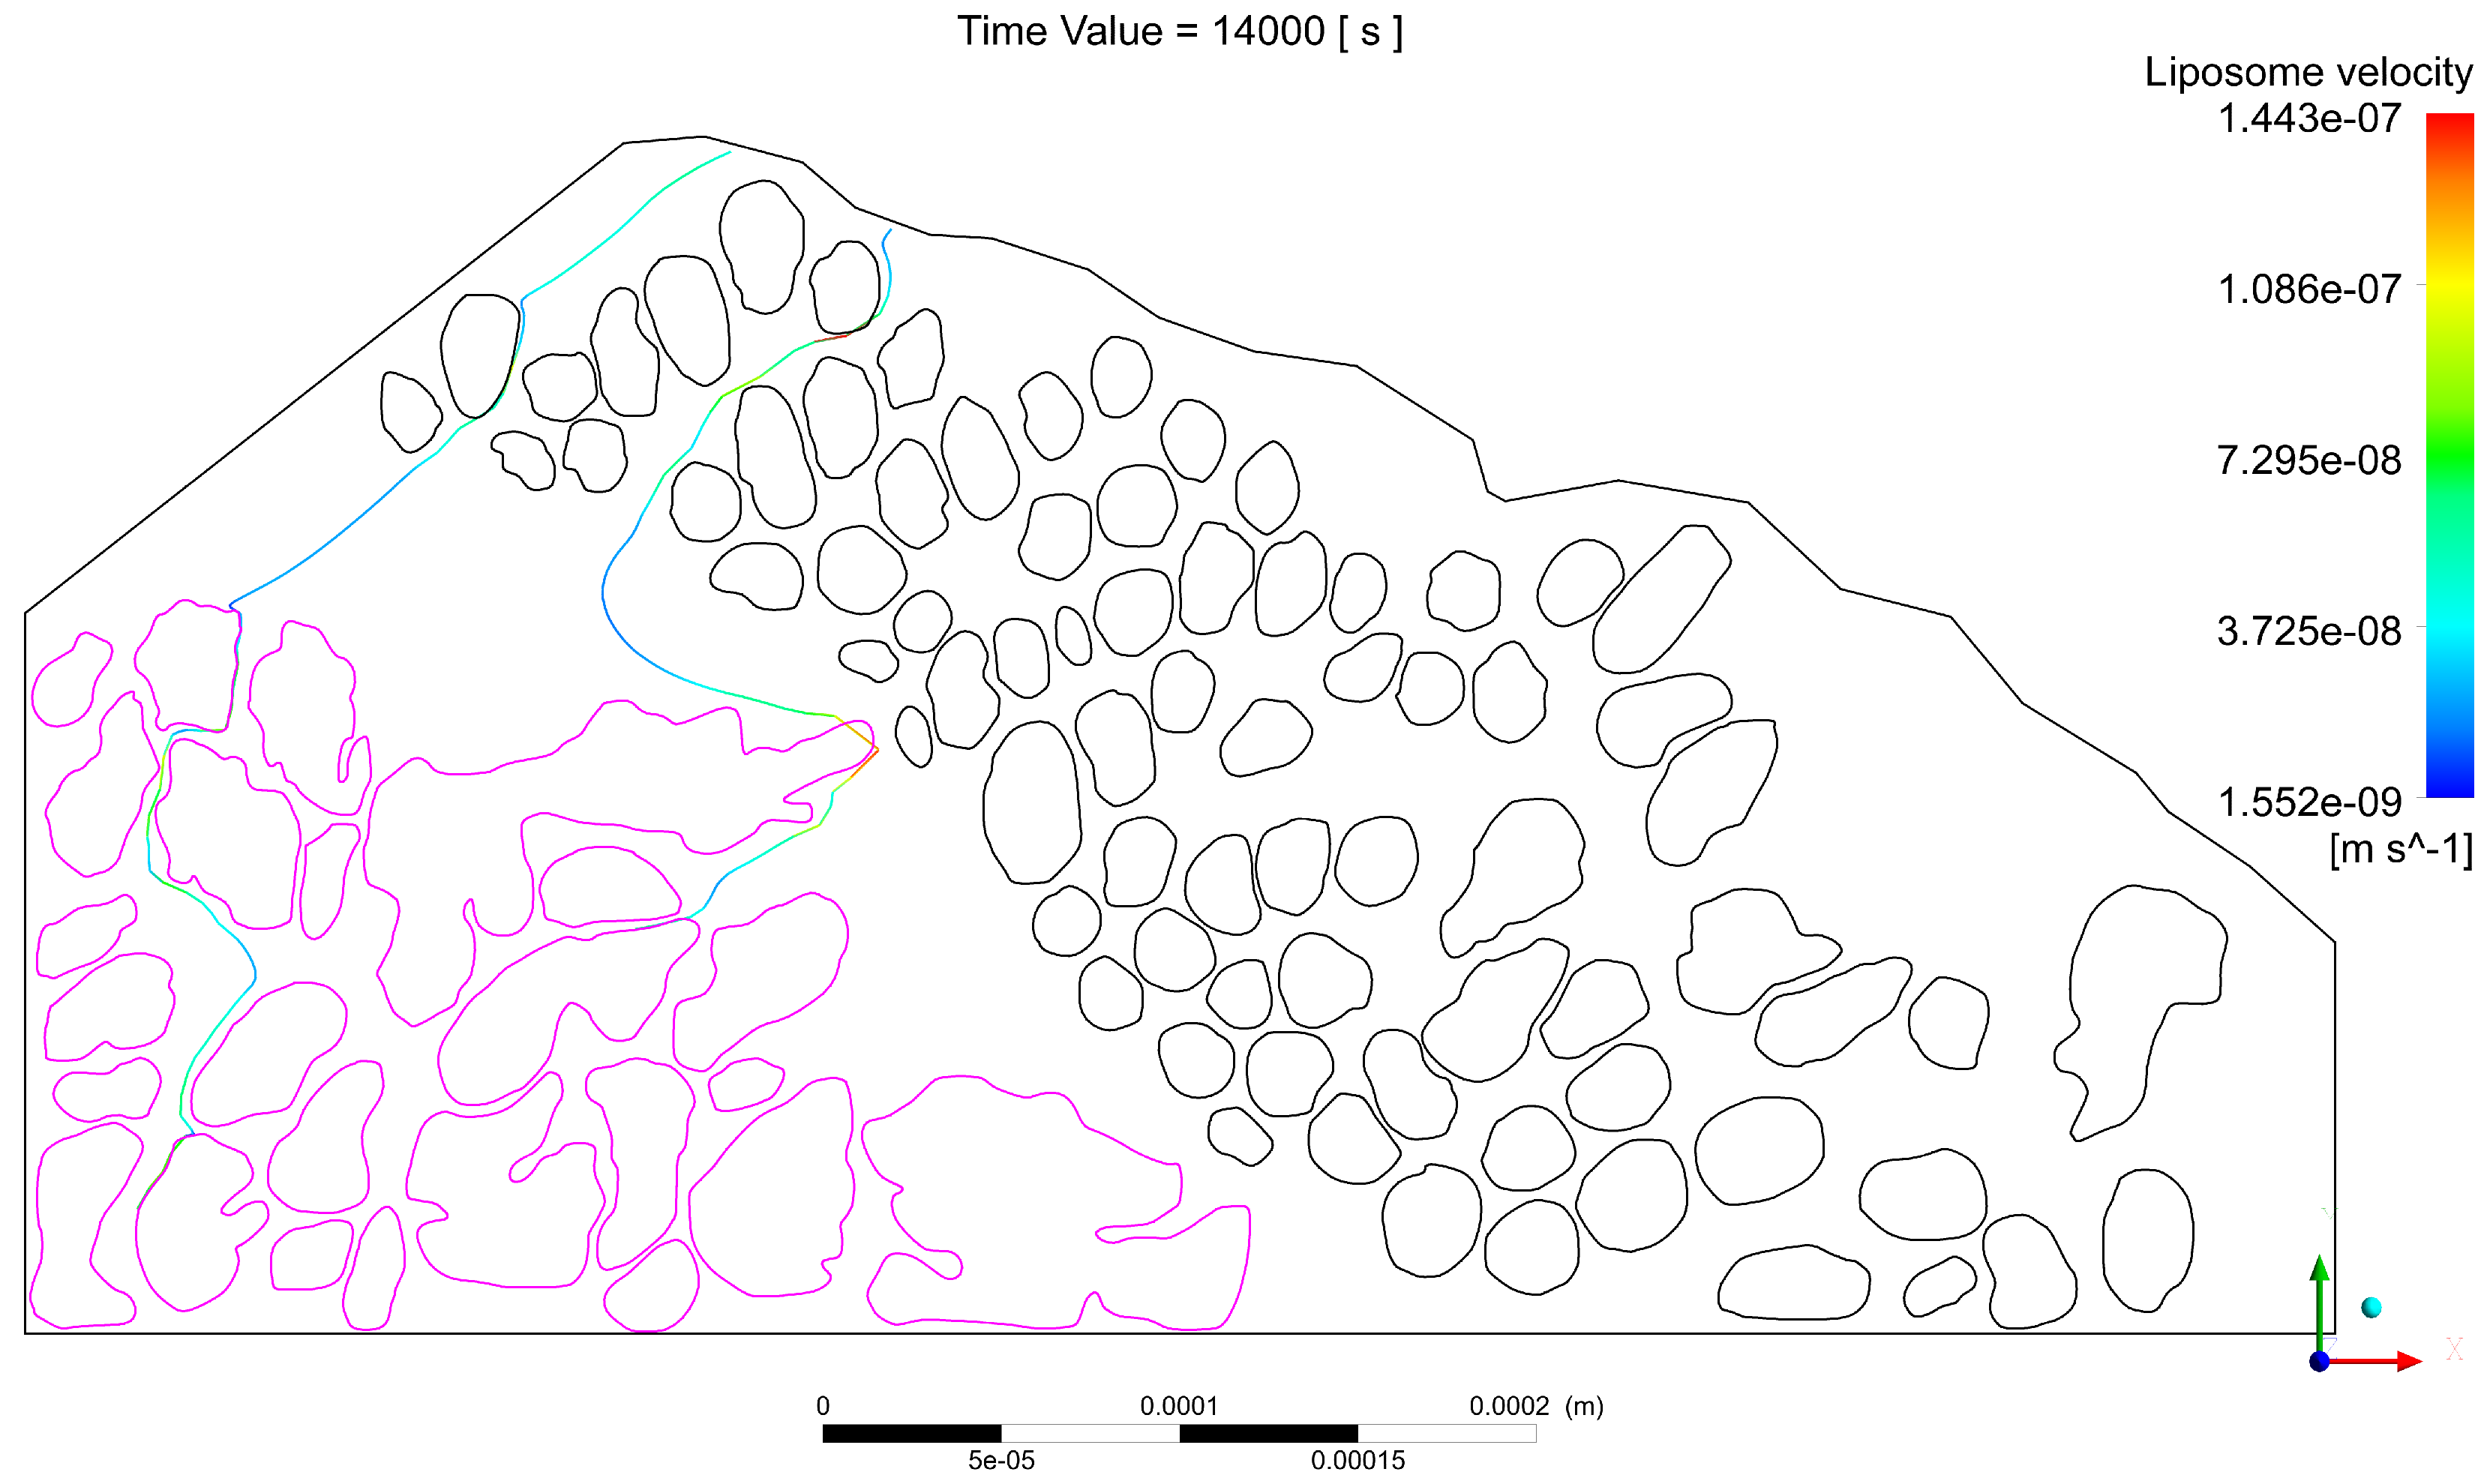
The trajectory of the first particle that achieves the first deposition with a malignant gland and the last particle that reaches the greatest depth and deposition with the malignant gland was determined, see Figure 2.
As a result of the particle–gland coupling, a vectorized deposition efficiency of 2.19 % was obtained. It is important to highlight that this value corresponds to a fraction of the tumor environment represented in sample 1.
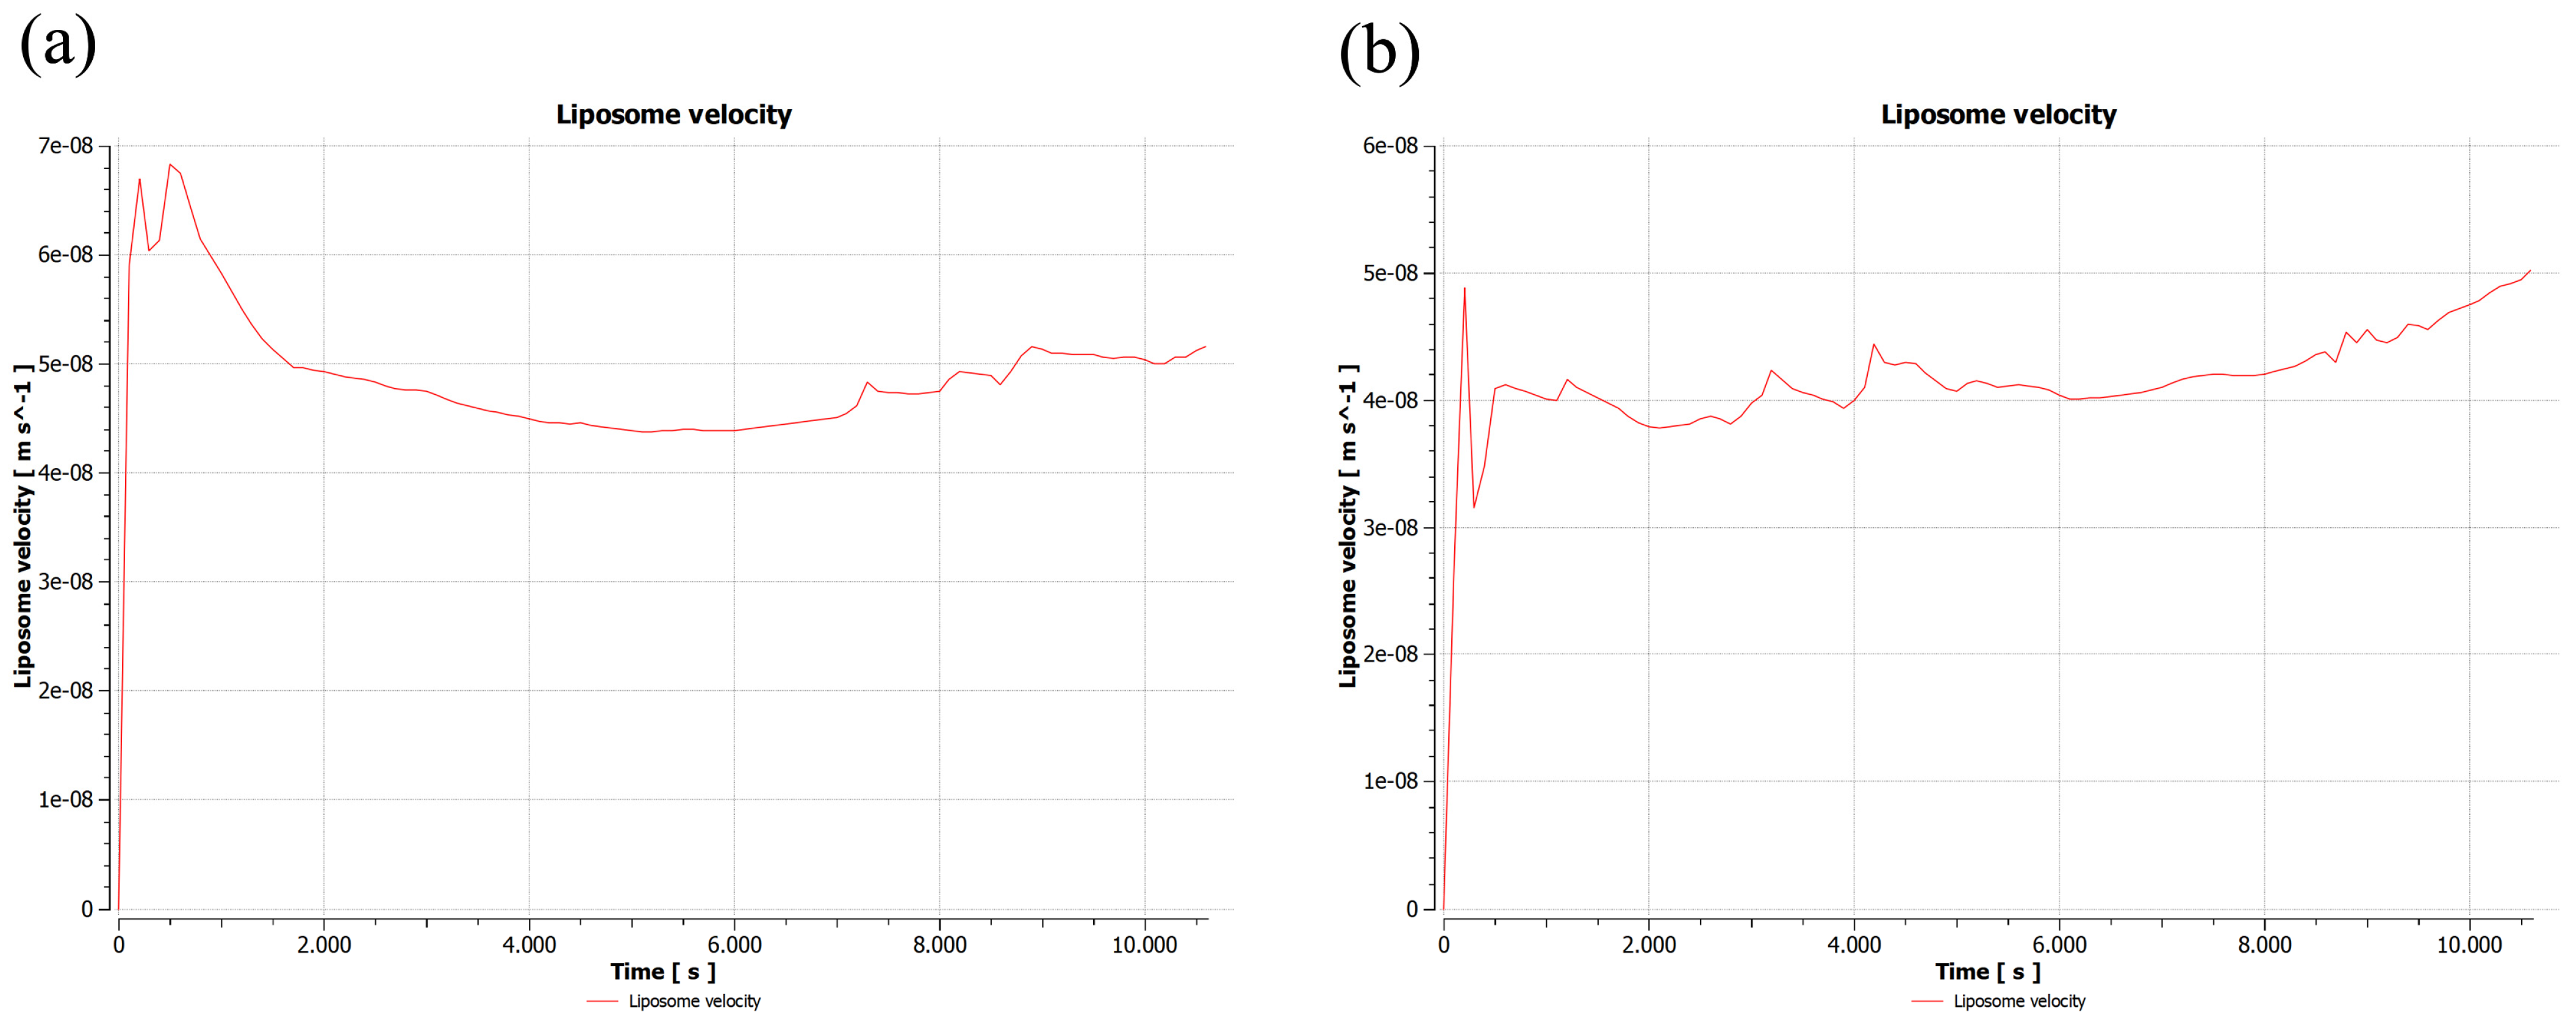
The first particle reached a maximum velocity of 5.0 × 10 8 m s and a depth of 1.78 × 10⁻⁴ m (Figure 3a), while the last particle to engage with the malignant cell region reached a maximum velocity of 6.9 × 10 8 m s and a depth of 4.23 × 10⁻⁴ m (Figure 3b).

2.1.2. Second Sample

For histological sample 2, the results indicated the mobility of the liposomes in a range of speeds between 1.40 and 3.37 × 10 7 m s . The velocity of the interstitial fluid varied between 0 and 3.21 × 10 7 m s .
The trajectory of the first particle that achieves the first deposition with a malignant gland and the last particle that reaches the greatest depth and deposition with the malignant gland was determined, see Figure 4.
As a result of the particle–gland coupling, a vectorized deposition efficiency with a value of 4.46% was obtained. It is important to highlight that this value corresponds to a fraction of the tumor environment represented in sample 2.
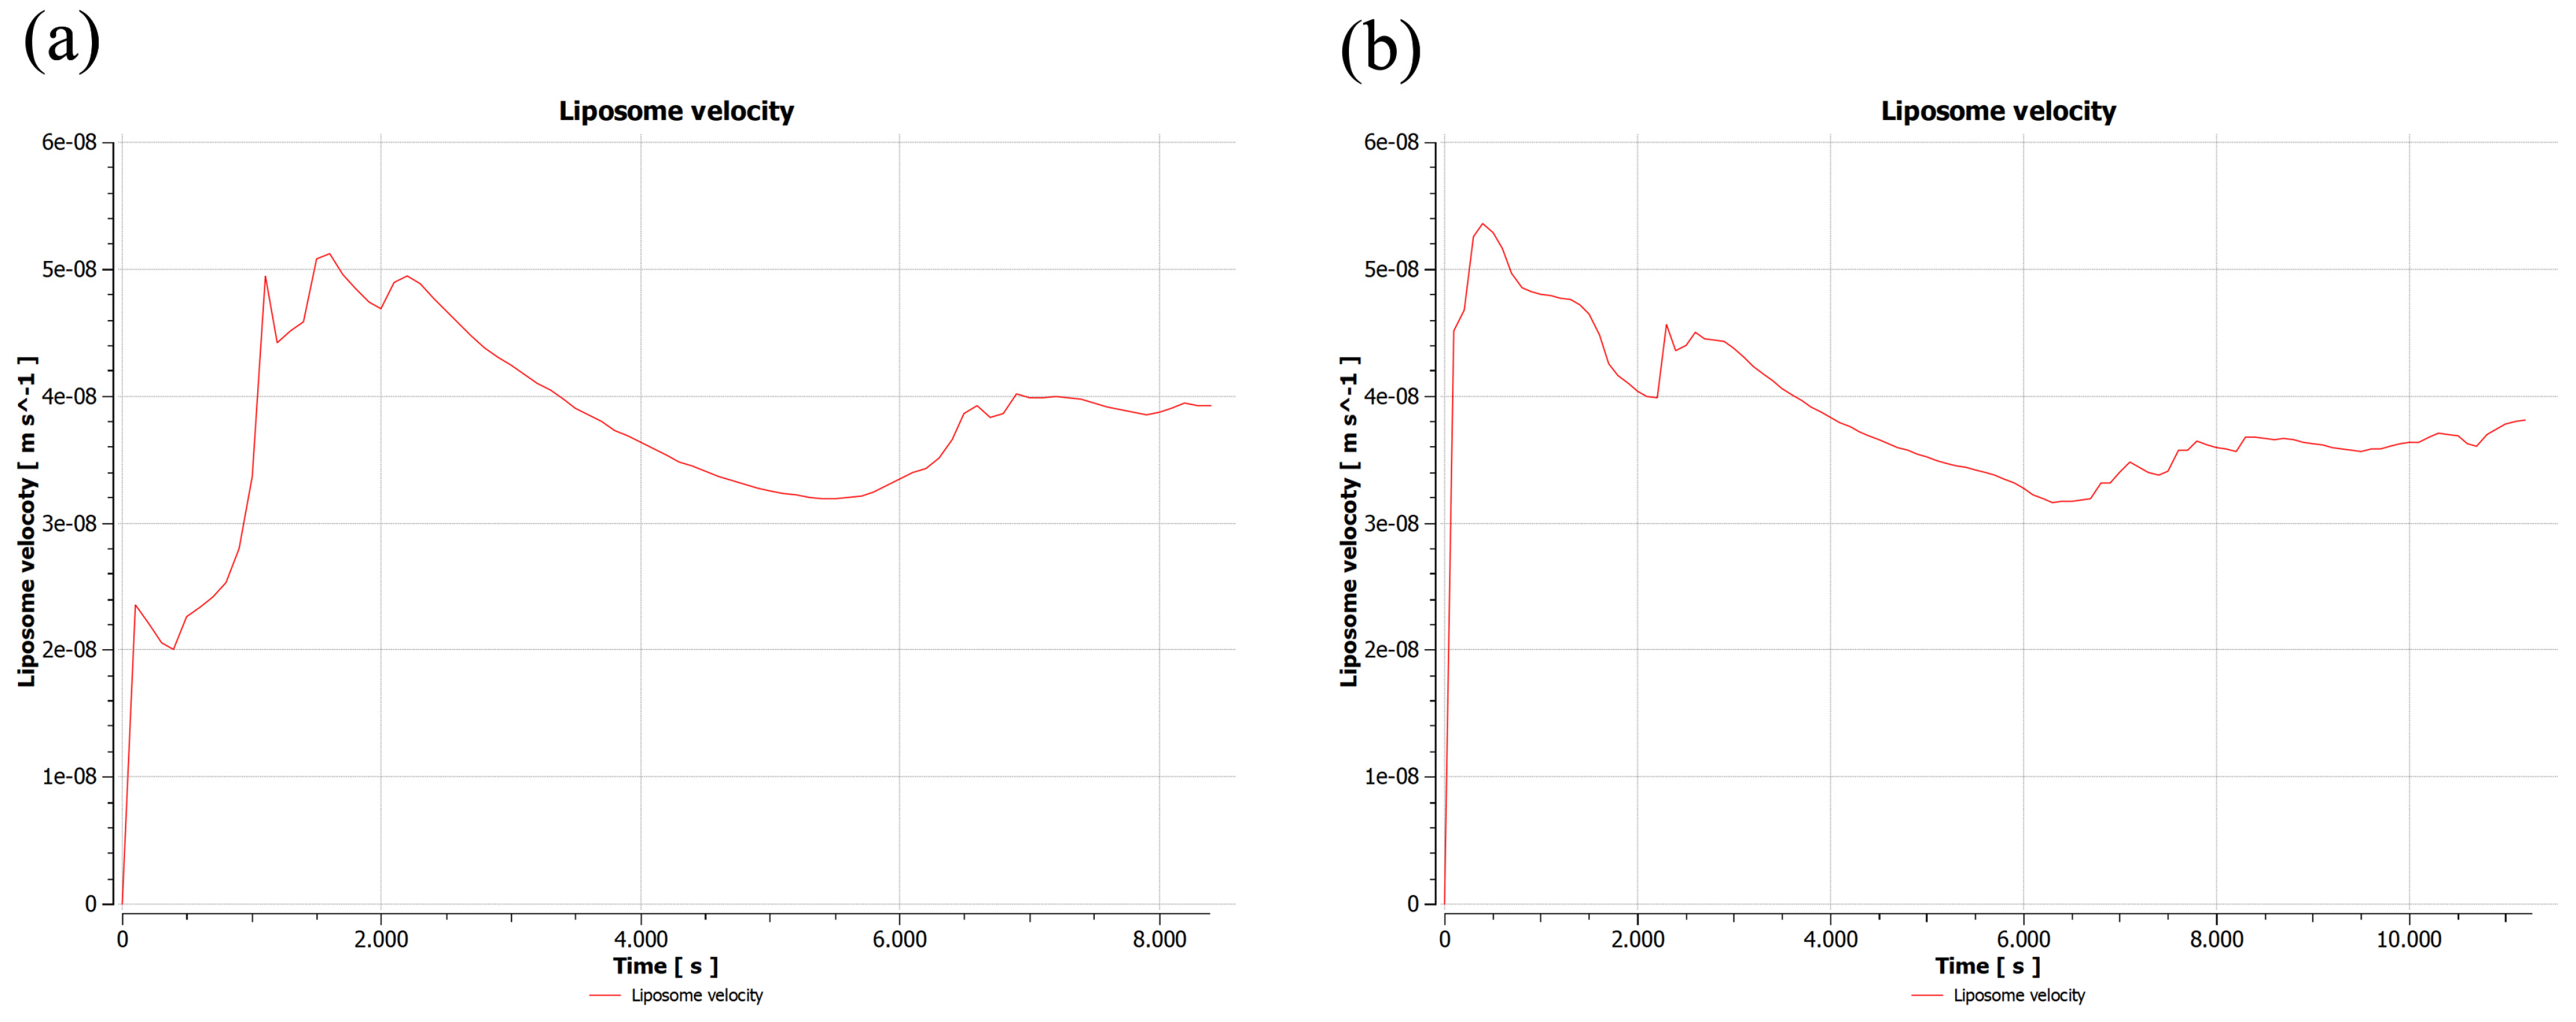
The first particle reached a maximum velocity of 5.11 × 10 8 m s and a depth of 1.78 × 10⁻⁴ m (Figure 5a), while the last particle to engage with the malignant cell region reached a maximum velocity of 5.35 × 10 8 m s and a depth of 3.44 × 10⁻⁴ m (Figure 5b).

2.1.3. Third Sample

For histological sample 3, the results indicated the mobility of the liposomes in a range of speeds between 3.50 and 8.69 × 10 7 m s . The velocity of the interstitial fluid varied between 0 and 4.82 × 10 7 m s , see Figure 1c.
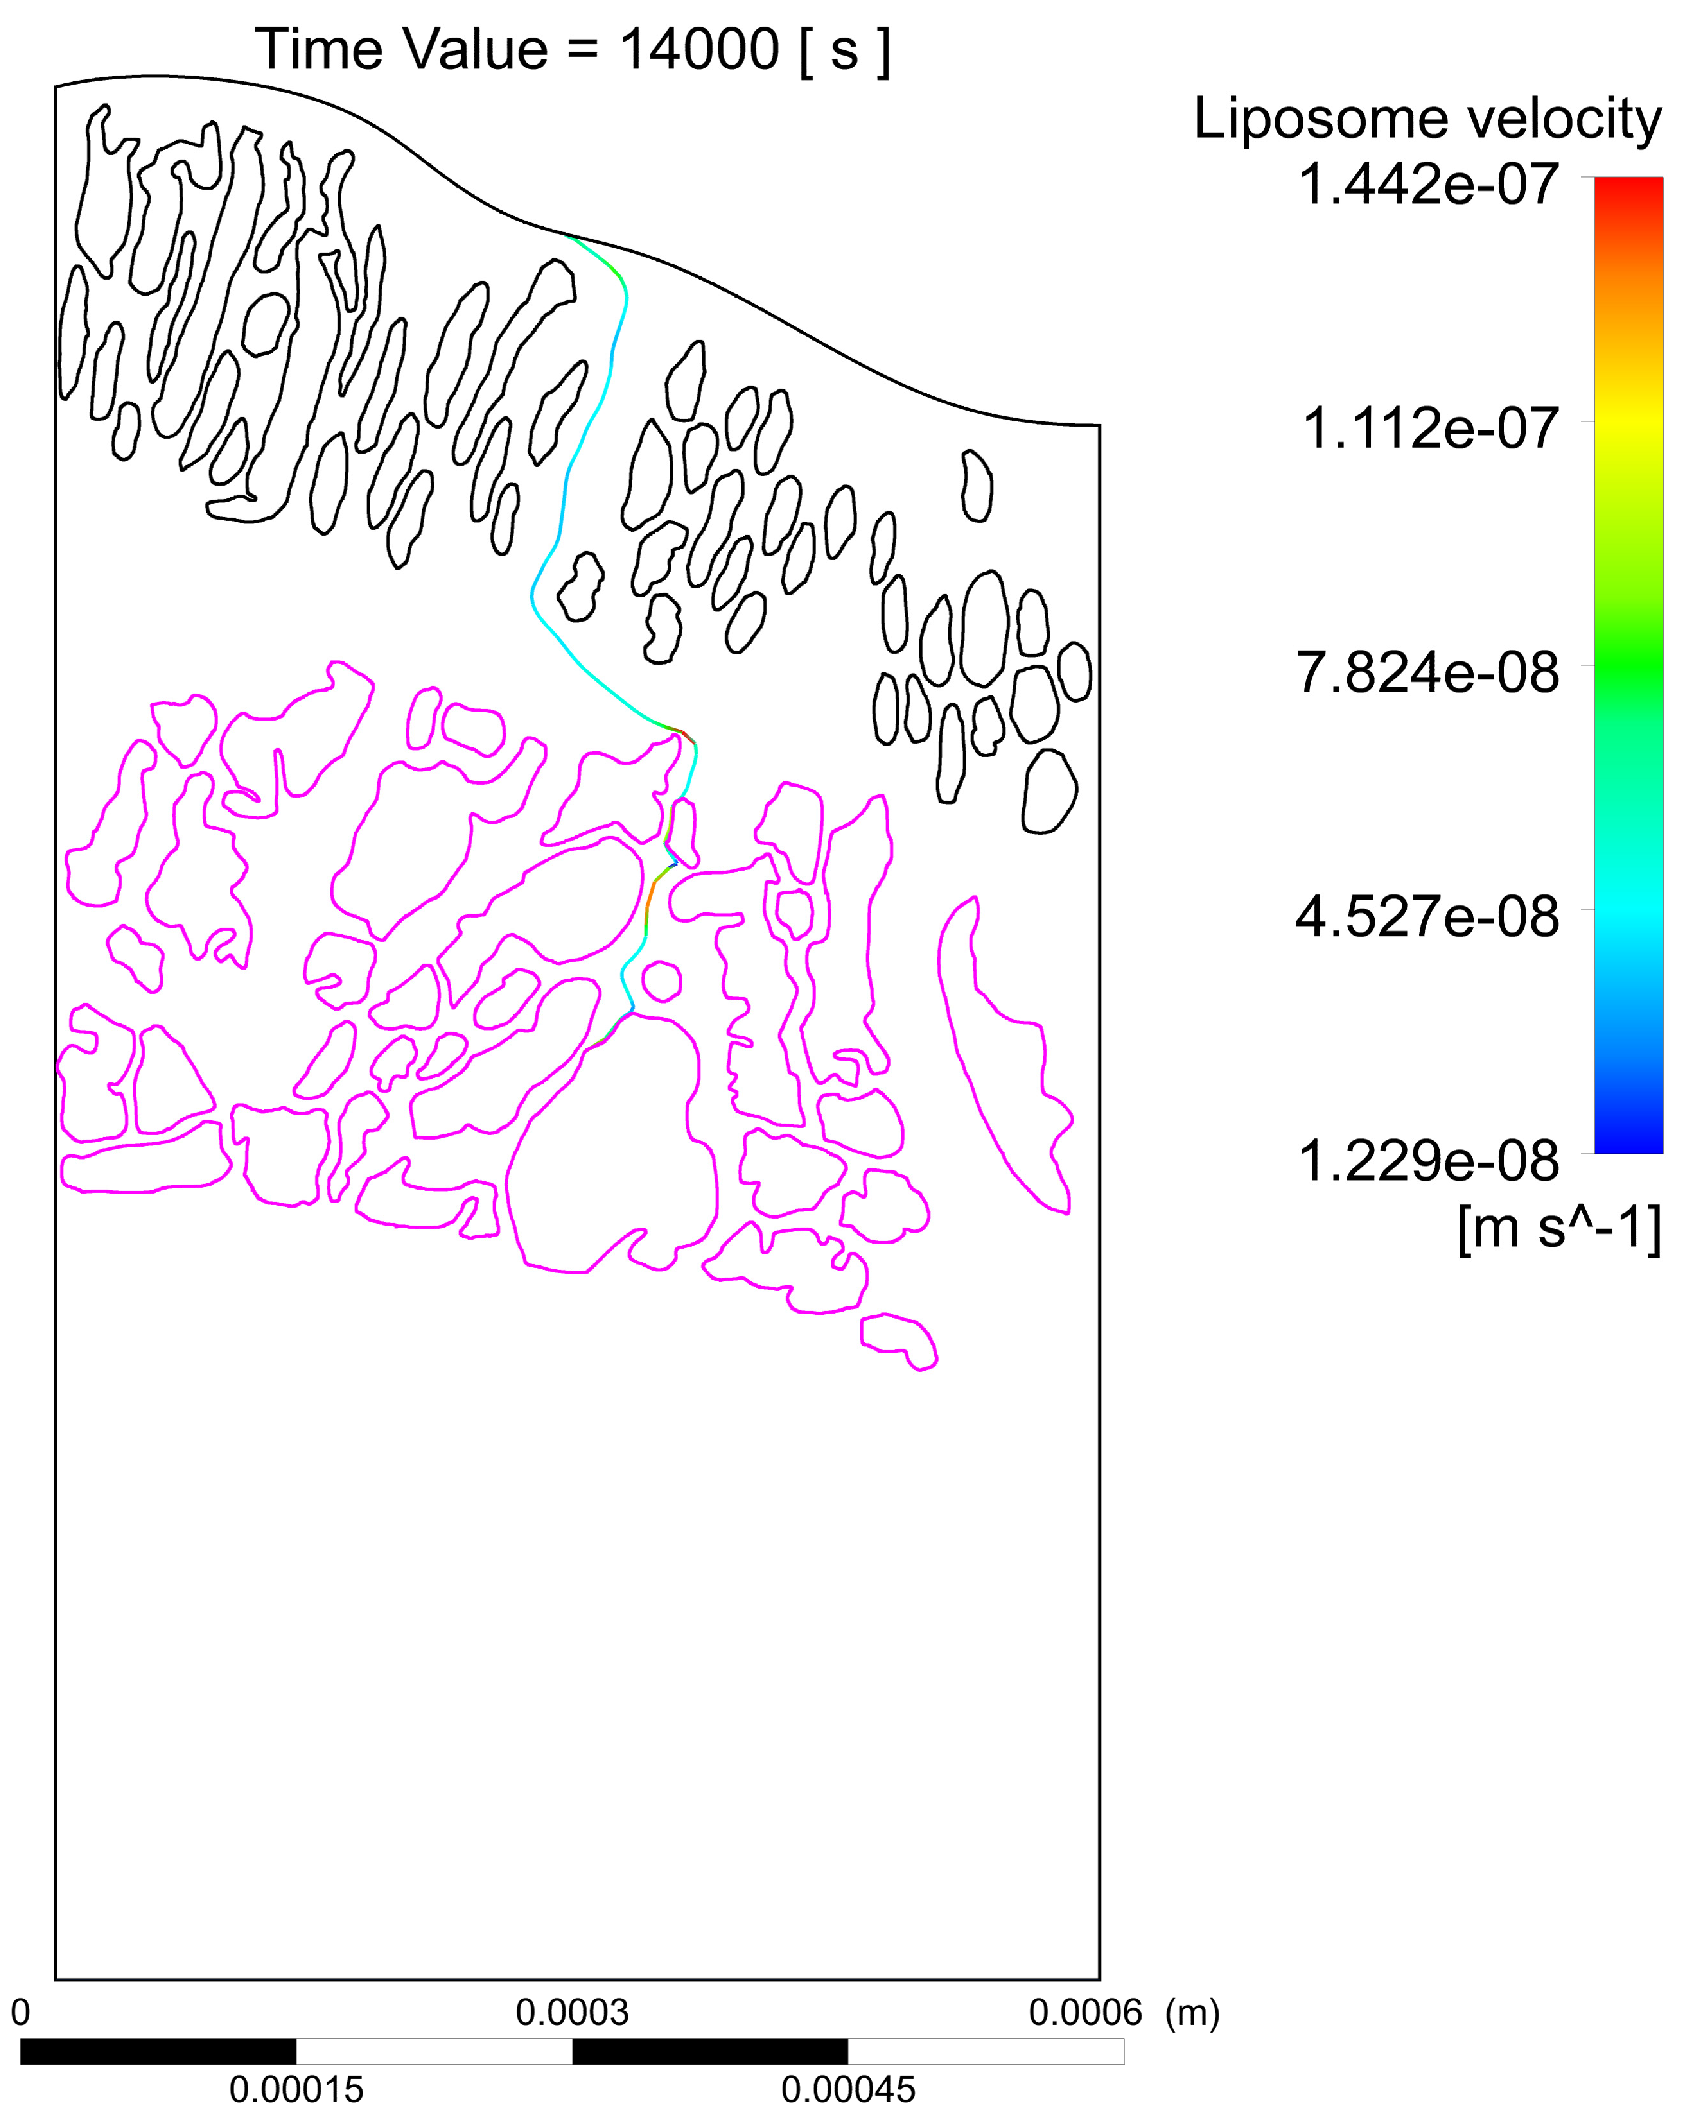
The trajectory of the first particle that achieves the first deposition with a malignant gland and the last particle that reached the greatest depth and deposition with the malignant gland was determined, see Figure 6.
The first particle reached a maximum velocity of 6.83 × 10 8 m s and a depth of 1.78 × 10⁻⁴ m (Figure 7a), while the last particle to engage with the malignant cell region reached a maximum velocity of 5.02 × 10 8 m s and a depth of 4.68 × 10⁻⁴ m (Figure 7b).

2.2. Validation of 2D Sample Results

To verify an appropriate algorithmic and computational implementation of the 2D sample models, a 3D cellular environment for a specific region was built from sample #1, see Figure 8.
The trajectory of the first particle that achieves the first deposition with a malignant gland and the last particle that reaches the greatest depth and deposition with the malignant gland was determined, see Figure 9.
As a result of the particle–gland coupling, a vectorized deposition efficiency with a value close to 1% was obtained. It is important to highlight that this value corresponds to a fraction of the tumor environment in 3D.
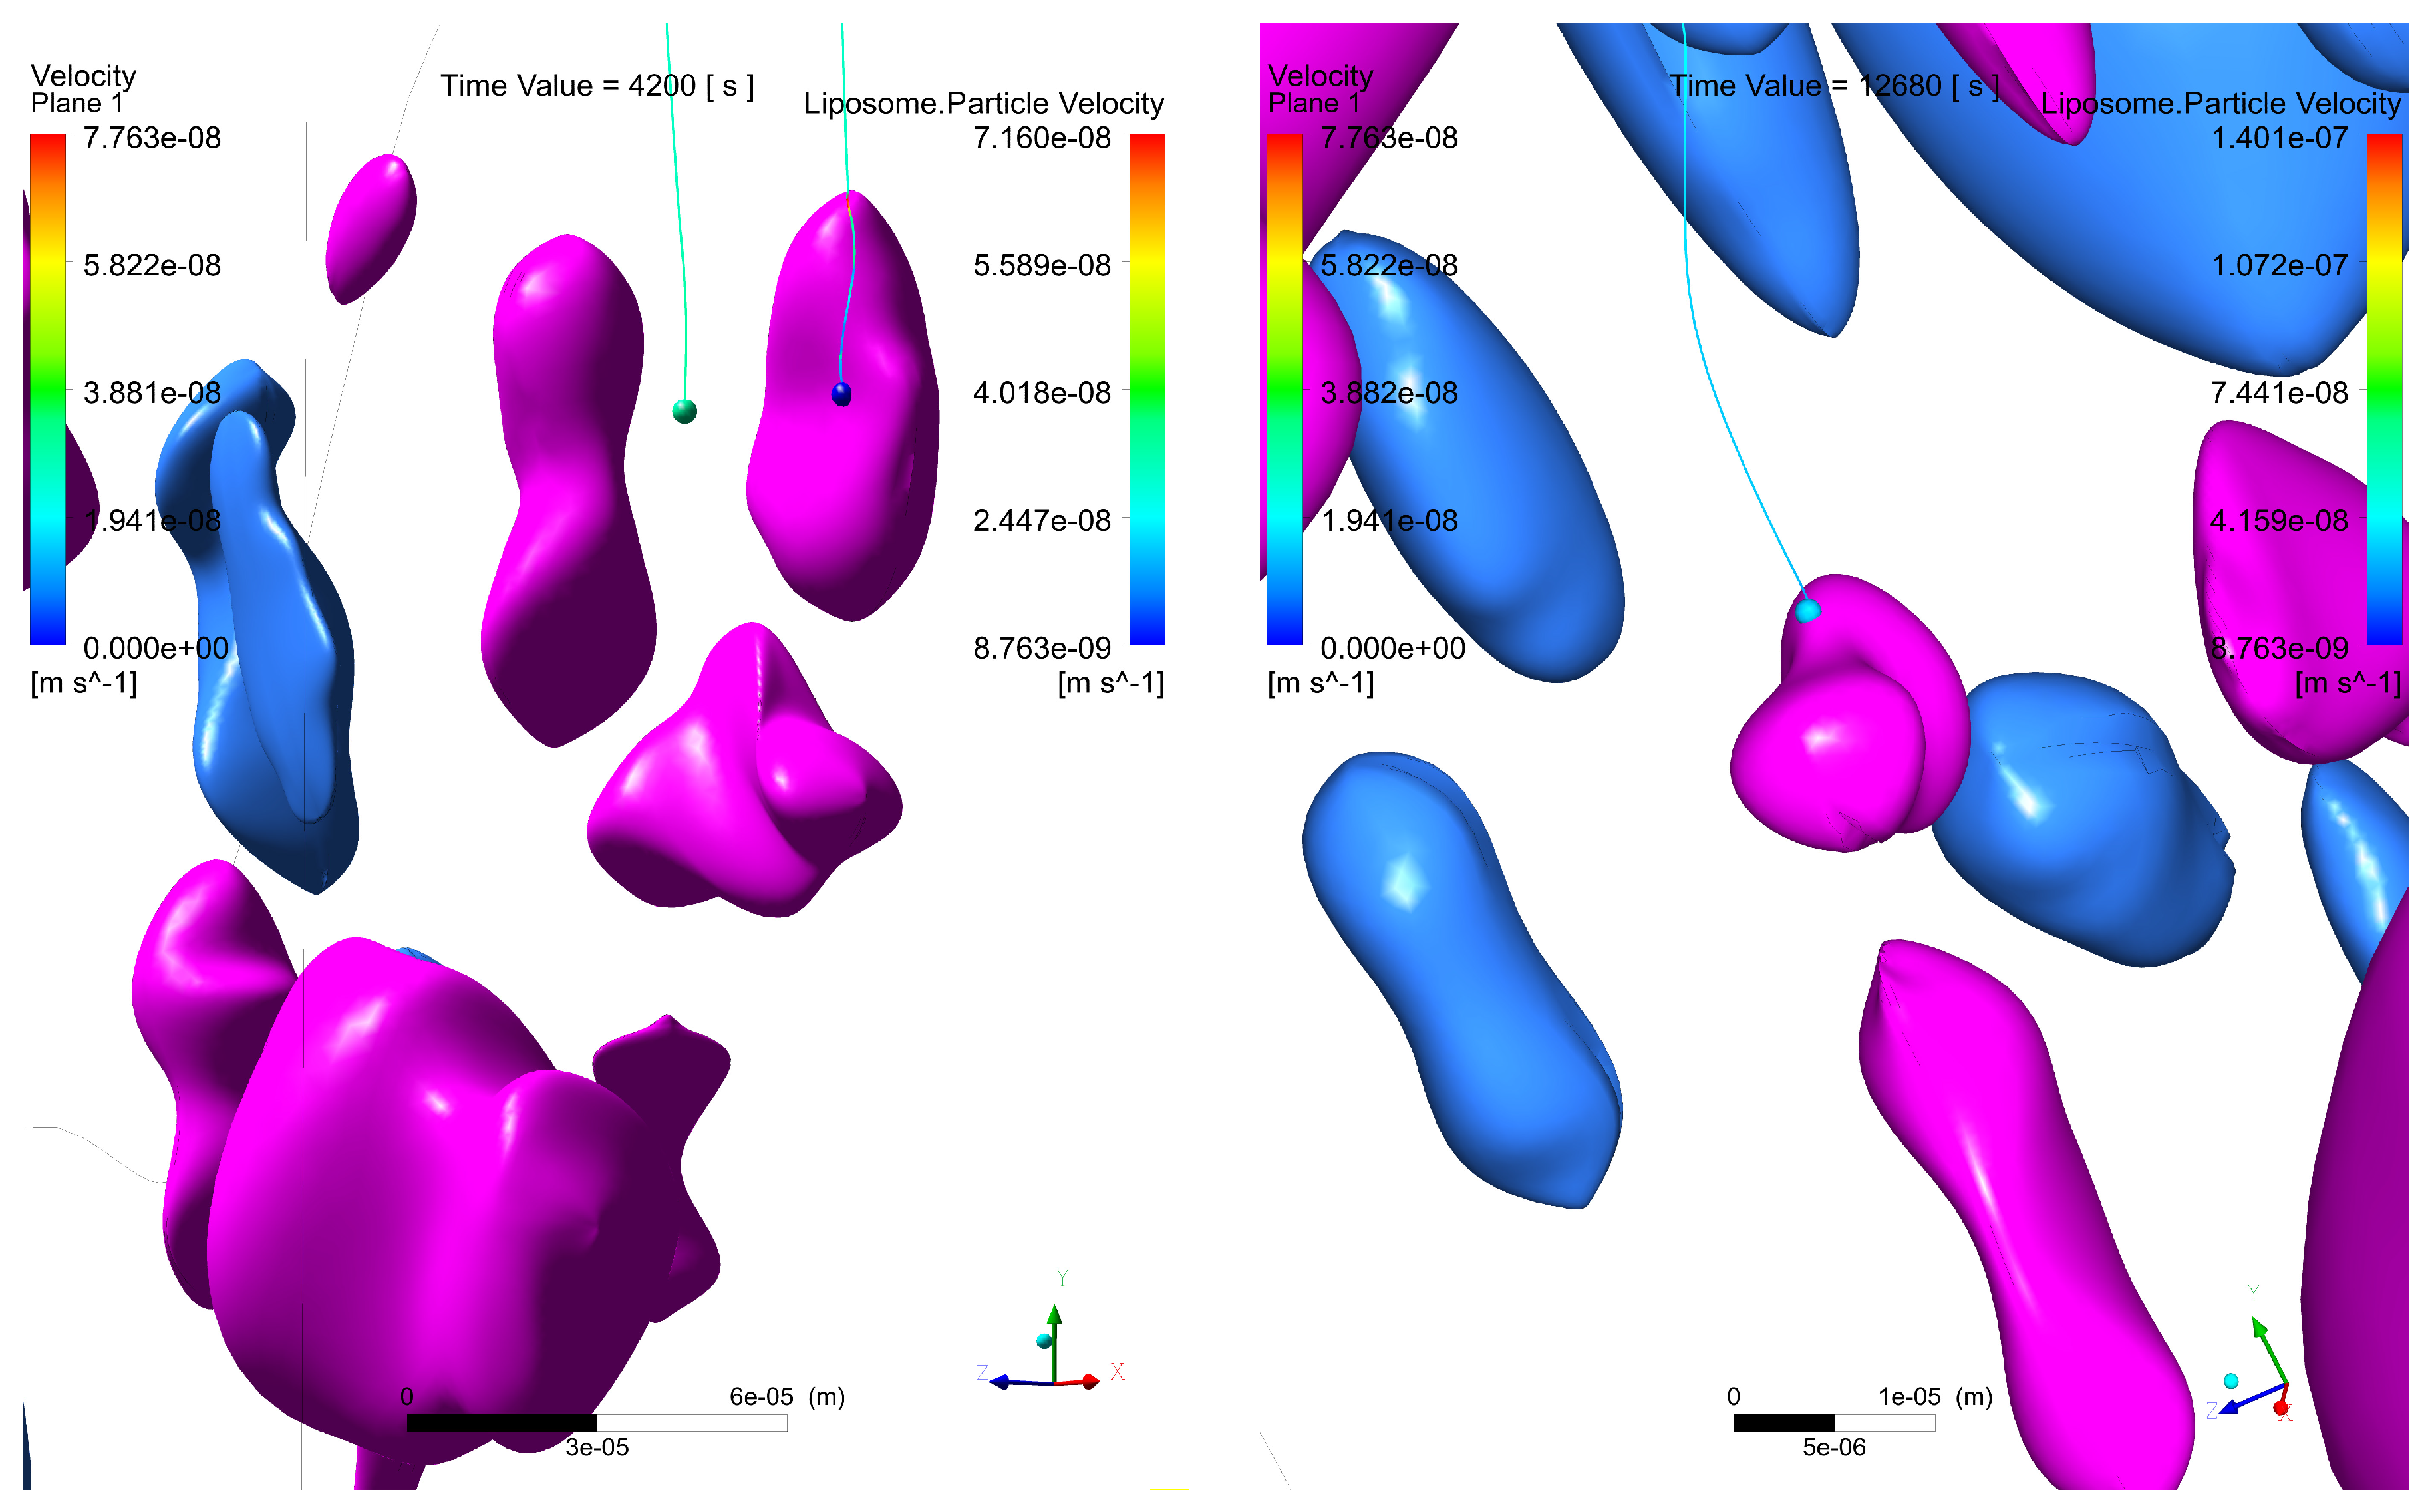
The first particle reached a maximum velocity of 3.20 × 10 8 m s and a depth of 1.78 × 10 4   m (Figure 10a), while the last particle to engage with the malignant cell region reached a maximum velocity of 3.50 × 10 8 m s and a depth of 4.23 × 10⁻⁴ m (Figure 10b).

3. Discussion

Simulations were performed to confirm the dynamics of the particles through the tumor microenvironment and the behavior of vectorized coupling. The intraluminal pressure of the colon and prescribed pressure inside the tumor were considered, with the purpose of guaranteeing natural pressure conditions that affected the mobility of the particles (nanocarriers).
The convergence of the computational solutions was achieved; however, the numerical stabilization was complex due to the non-linearity condition of the behavior of the phenomenon formed by the Navier–Stokes model and the Brownian behavior model of the nanocarriers.
From the literature, it is known that once the drug is ingested, the vectorized nanocarriers travel through the gastrointestinal system reaching the region of the colon where the lesion is located. The maximum mean inhibitory concentration of C p = 13.5 μ g mL used [32,33] allowed for the adequate parameterization of the initial absorption conditions of the drug through the mucosal layer, which contributed to obtaining more precise results in terms of the mass flow of the nanoparticles.
In all histological evaluations it was evidenced that the velocity of absorption of nutrients and liquids through the walls from the lumen of the colon towards the interior of the tumor was 2.48 × 10 8 m s , which is consistent with the values estimated by [34] (on the order of 10 8 m s ). The results of the samples confirmed that the velocities obtained from the interstitial fluid were above the range of biological operability.
In the tumor microenvironment there are different types of cells, such as goblet cells and enterocytes, which are responsible for mucin production and water absorption [35], as well as B and T lymphocytes, which are part of the immune system and which are usually found in greater numbers in the interstitial space of malignant regions. In this research, groups of goblet cells and enterocytes are taken into account, which form regions called glands; while the treatment given to lymphocytes consists of incorporating them as part of the interstitial fluid, assigning porosity properties to the medium.
In the regions of cancerous tissue, there are many glands distributed with little interstitial space between them, due to the morphological irregularity of the malignant cells that compose them. In selected samples, larger interstitial space regions can also be seen between the healthy glands and the cluster of cancerous glands. This morphological arrangement of the tumor microenvironment can influence the behavior of nanocarriers, giving rise to four different situations:
  • The interstitial space between at least one pair of glands is narrow, which increases the velocity of the interstitial fluid, driving the liposomes through the streamlines at speeds sufficient to escape the electrostatic surface attraction forces of the cancerous glands;
  • The interstitial space between at least one pair of glands is narrow enough so that the liposomes transiting in between, despite increasing their speed, have a trajectory close enough to the boundary layer of the gland surface, which slows down their speed and allows attractive forces to act on the liposome, increasing the probability of engagement with the cancerous region;
  • A pair of glands is sufficiently separated so that the interstitial fluid does not show significant increases in velocity, which can cause liposomes to transit in regions distant from the cancerous glands, making it difficult for the two bodies to attract, and as a result, decreasing the effectiveness of the coupling;
  • Even though a pair of glands is sufficiently separated, changes in velocities and trajectories produced by morphological conditions in more superficial layers can give rise to the transit of liposomes in regions with low velocities that are close to the surface of the gland. Malignant glands benefit from the attraction and subsequent coupling between positively charged liposomes and negatively charged cancerous regions, especially when the glands are found in deeper regions of the tumor and with a more acidic pH, thus increasing the negative charge.
Based on the behavior of the particles observed and the four cases previously analyzed, it can be stated that there is intratumoral heterogeneity in the speed of liposomes that are transported in the interstitial fluid, since the transport of liposomes in the interstitial fluid may be influenced by several factors, such as hydrostatic pressure, oncotic pressure, interstitial fluid viscosity and cell density, which together with the presence of stroma can limit the diffusion and movement of liposomes in certain areas of the tumor. This heterogeneity could be exploited by future studies to improve the efficacy of drug delivery in the tumor microenvironment.
It is important to mention that the acidic conditions of the microenvironment around tumor cells can affect the behavior and capacity of nanocarriers. The Warburg effect occurs in the tumor environment; it consists of acidification due to the anaerobic metabolism of the tumor cells, which leads to the accumulation of lactate and a decrease in pH, and with it, a change in the surface charge of the cell, making it negative. This may affect the stability of the nanocarriers, their ability to deliver their therapeutic payload at the target site, and their ability to be internalized by tumor cells. If the liposomes have a positive charge, as assumed in the simulations carried out, they will be benefited by the negative charges on the cell surface, increasing the coupling.
Some nanocarriers are currently being developed to be activated by changes in pH to release their therapeutic payload in acidic environments, which may improve their ability to reach and treat tumor cells.
From the value obtained on the couplings with a depth of 4.23 × 10⁻⁴ m and a time of 9339 s for histological sample #1, it can be deduced that for a tumor lesion of approximately 4 cm in height, the nanocarriers could achieve the total intratumoral irrigation process in approximately 245.31 h. On the other hand, for sample #2, which presents a depth of 3.44 × 10⁻⁴ m in a time of 12,280 s, it can be deduced that for the same lesion size, the nanocarriers could achieve the total intratumoral irrigation process in approximately 396.64 h. Finally, the total intratumoral irrigation process for sample #3 is estimated to take approximately 290.95 h.
Another essential element of the results obtained on the effectiveness of vectorized deposition is having guaranteed the selectivity of the particles that will continue their mobility into the interior of the tumor where they will find themselves in a cellular microenvironment with a greater proliferation of cancerous glands.
Once the coupling in the results of the computational simulations has been verified, it can be predicted that in the evolution of the tumor there will be a microenvironment transformation, generating a new morphology (a product of the effectiveness of the drug).
In all the samples there were increases in the velocities of the nanoparticles. This is due to the spatial narrowing caused by the different morphological distributions that were represented; this may contribute to larger displacements in shorter times, resulting in the favoring of shorter times to achieve higher vectorized deposition efficiencies.
Once the nanocarrier has been internalized within the malignant gland and has undergone the drug release process, what should occur is an induction of apoptosis [13,18,36]. From the computational point of view, the vectorized efficiency deposition results obtained are relevant because the coupling is guaranteed, which is the initial stage of gland–nanocarrier contact before internalization, which has been studied experimentally by other authors.
In general, the value for the effectiveness of the vectorized deposition from the analysis of the samples ranged from 1.0 to 4.46% in only 3.88 h. This result is relevant since it allows for the establishment of some predictions about the effectiveness of the nanocarriers and the possible transformation of the morphology since the cellular malignancy is reduced.
We hope that in future work, a comparison of results can be established with a statistically more significant number of samples, allowing for a deeper understanding of the influence of morphological changes on treatment efficacy. Another subsequent study can focus on increasing or decreasing the density of malignant and benign glands to study in greater depth the variation of variation particle velocities, and the influence of the gland density on the effectiveness percentage of the vectorized deposition.

4. Materials and Methods

The goal of the computational simulation of the behavior of liposomes in the interstitial space of colorectal cancer histological is to obtain results for a set of variables of interest, described in Table 1.
  • Mobility of the fluid: allows for the identification of the behavior of the fluid through the sample and its corresponding velocities;
  • Vectorized deposition efficiency: described as the number of discrete particles that are deposited or attached to the surface of the glands formed by cancer cells, divided by the total number of particles that enter the sample [37,38,39];
  • Maximum depth reached by the particles: used to predict the time required to achieve a complete diffusion of liposomes in a determined tumor;
  • Time: The time variable is essential to estimate how long it takes for the dose that achieves contact with the surface of the cancerous tissue to break through to the maximum depth of the sample. It is also especially important to determine the time required to register the first and last coupling between a liposome and a cancerous region.
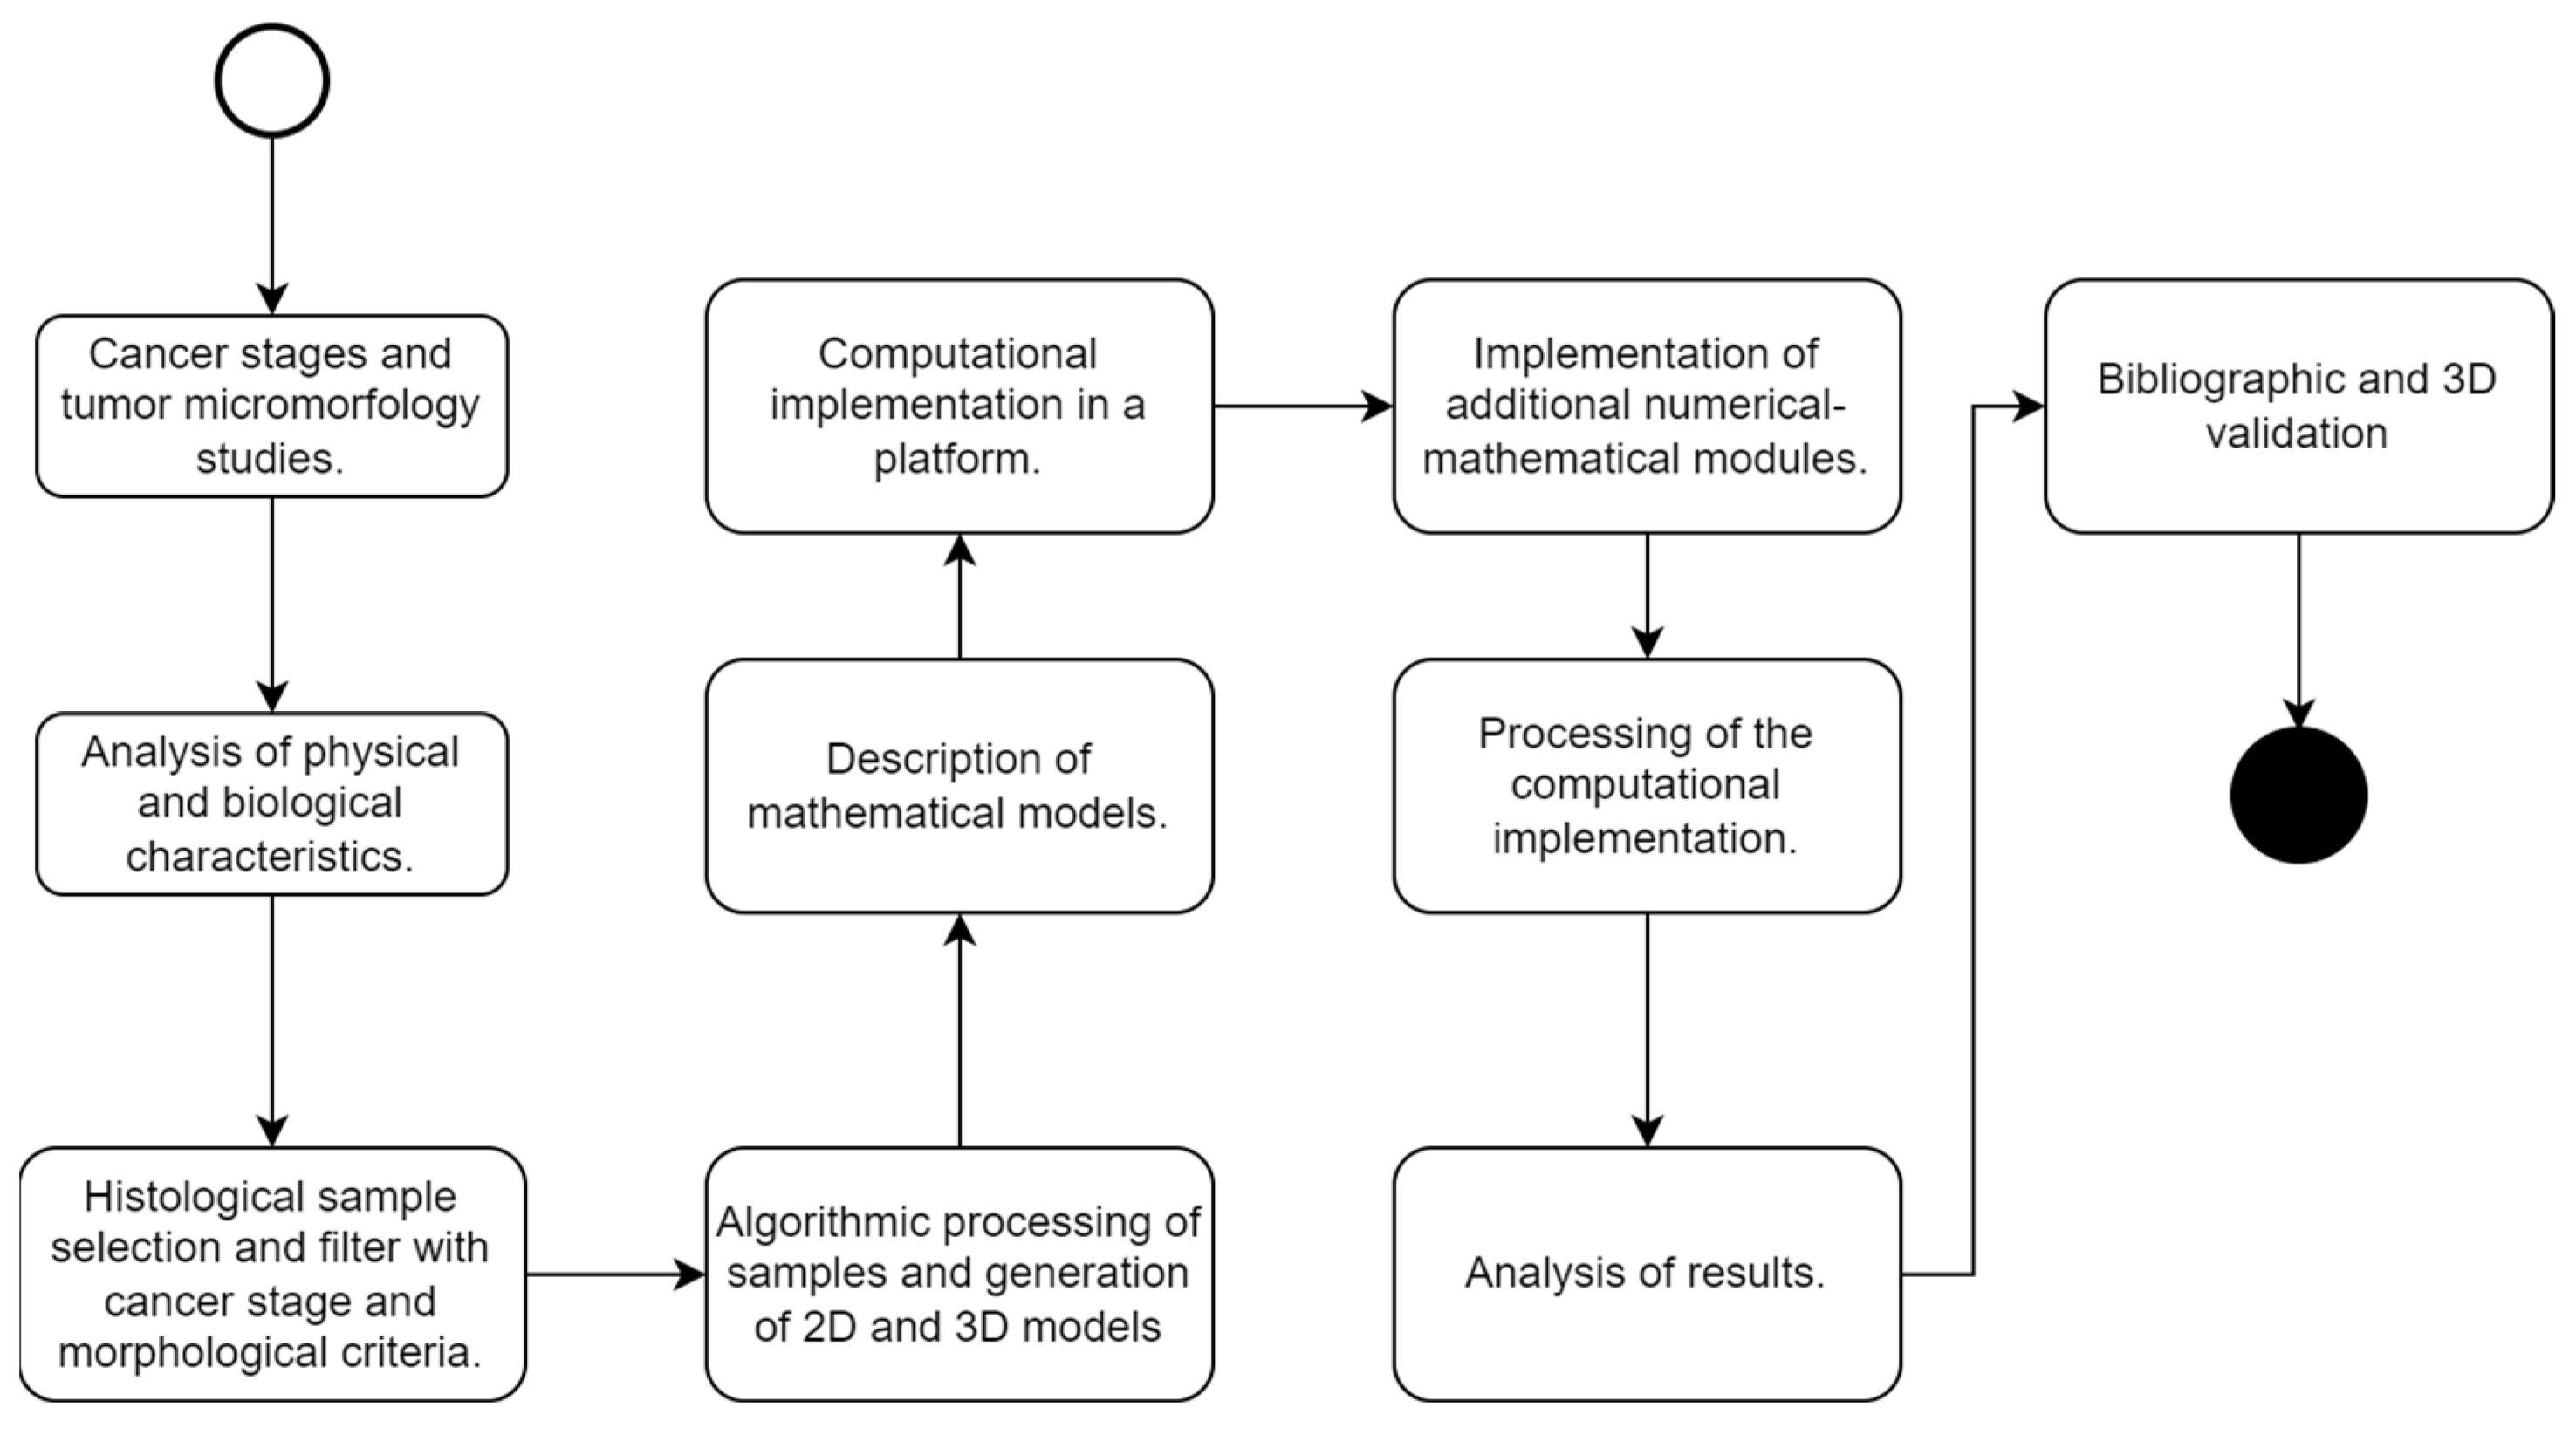
To obtain the expected results, a methodology represented by Figure 11 was carried out.

4.1. Selection and Processing of the Samples to Be Studied

An extensive collection of histological samples of colon cancer was obtained, including approximately 5000 samples from different public domain datasets for research [39,40,41,42,43], which declare to have been collected with the due informed consent of the patient, complying with the ethical regulations for the handling of these samples and using a Creative Commons license for their use.
Four classification criteria for the microscopic samples were determined for the elaboration of the computational models:
  • Level of glandular deformation: the identification of the regions of malignancy using the geometric shape of the cellular glands, through the characteristics of glandular aberration; glands with more asymmetric characteristics and a higher Best Alignment Metric (BAM) value tended to be classified as malignant [44];
  • Stage of the disease in TNM: T (local extension of the primary tumor at the time of diagnosis); N (regional lymph node status); and M (distant metastatic disease, including non-regional lymph nodes). The selected samples must belong to a stage of the disease between stages II and III;
  • Tumor differentiation grade: Low grade (if 50% or more of the tumor is glandular), or High grade (if the glandular percentage is under 50%) [44,45];
  • Presence of benign and malignant glands in the same sample: to demonstrate the selective behavior of the nanoparticles, the histological sample must have both benign and natural cell groups, as well as malignant cell regions.
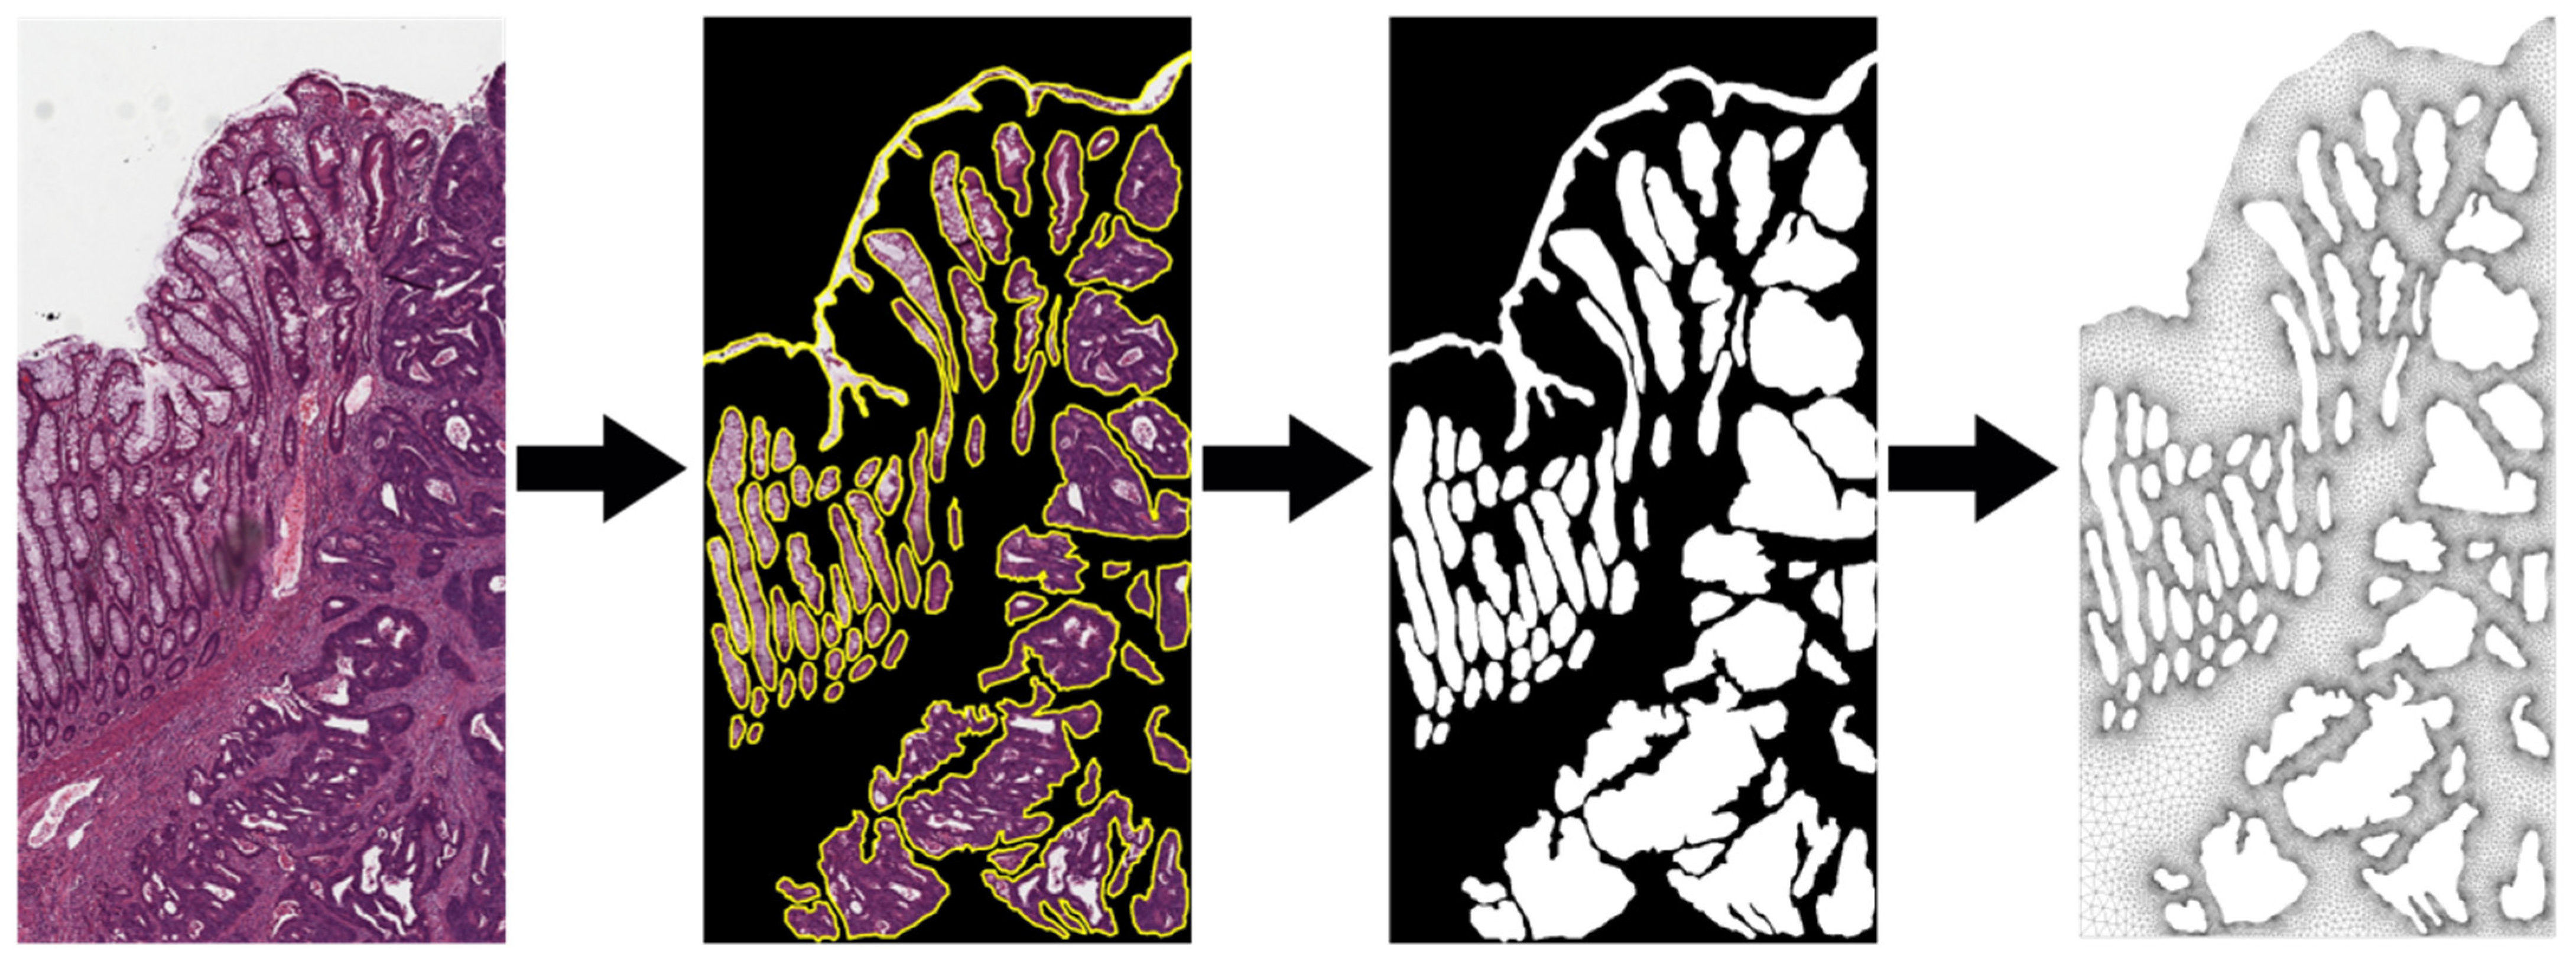
Image processing and artificial vision algorithms were developed that allowed for the identification of the most suitable samples according to the previously mentioned criteria. Favoring the brevity of this article, the processing details can be dealt with in subsequent publications (see Figure 12).

4.2. Calculation of Interstitial Fluid Mass Flow

In accordance with [46], the area of the large intestine is 1.90 m2. Considering that the human colon is capable of absorbing 3 to 5 L per 24 h [47], based on this absorption, the mass flow rate of the fluid F can be calculated through Equation (1):
= ρ F V F A TF .
where ρ F is the fluid density, V F is the magnitude of the velocity of the fluid and A TF is the cross-sectional area of the mucosal layer of the colon tissue sample that the fluid passes through.
From the average absorption rate of the large intestine, given by 4 L 24 h , it is possible to use the density of the interstitial fluid, ρ = 1000   kg m 3 , to calculate the mass flow equivalent: F = 4.72 × 10 5   kg s .
Solving for the magnitude of the velocity in Equation (1), we obtain Equation (2):
V F = F ρ F A TF
Knowing the velocity of the interstitial fluid (Equation (2)), the total area of the colon can be modified to be adjusted to the cross-sectional area corresponding to the upper border of the sample under study. For each sample, the surface area that meets the solution containing the nanocarriers is calculated with A T = 1.04 × 10 7   m 2 ; in this way, a new mass flow is obtained for the interstitial fluid F = 2.58 × 10 12 kg s .

4.3. Calculation of the Mass Flow of Liposomes

Since the total mass absorbed by the colon is not composed solely of water, it is necessary to find the absorption of the solute, which is mainly composed of the administered liposomes.
If the fluid absorption rate in the colon is 2.83 mL min [47], and a concentration of liposomes C p = 13.5 μ g mL is used [33,38], the mass flow of liposomes obtained for the entire area of the colon would be P = 6.38 × 10 10 kg s . From this value, the speed of the particles is obtained using Equation (2), which corresponds to V p = 3.36 × 10 13 m s .
With the velocity calculated, Equation (1) is used by changing the total cross-sectional area of the sample by A T , finally obtaining the mass flow of liposomes towards the interstitial space: P = 3.49 × 10 17 kg s . For the 2D case, a cross-sectional area value is calculated from the width of the sample and a depth equivalent to the diameter of a single particle; d p = 2.00 × 10 7 m is used, resulting in m P ˙ = 3.66 × 10 20 kg s .

4.4. Models for Interstitial Fluid

Assuming that the interstitial fluid is incompressible, and defining the dimensionless parameters u = u   U   ,   p = p ρ U 2 ,   x = x   D   the continuity Equation (3) is:
u = 0
where U is the characteristic velocity and is the gradient operator.
p + u u * = 1 Re Δ u
Generally, the constant viscous flow dynamics equation is the Navier–Stokes Equation (4), because the Reinolds number is very small (on the order of 10 6 according to [48]) and the term of inertia u u is negligible compared to the viscous term. Therefore, the Navier–Stokes equation is simplified, leaving as a result the Stokes Equation (5):
p = 1 Re Δ u *
On the other hand, the porosity of the medium was modeled by a simplification of the Brinkman equation that gives rise to Darcy’s law (Equation (6)) when the permeability K p   is small (varying between 4.0 × 10 11   m 2 and 1.0 × 10 13   m 2 in tissues, according to [49]).
p = 1 Re k u *

4.5. Model for the Movement of Particles

The most commonly available forms of nanocarriers for clinical use are liposomal formulations [13]; in fact, today, the main types of transporter-mediated anticancer agents are liposomes [19].
Liposomes are vesicles that form in water, with a diameter of 25 to 500 nm and a thickness of about 5 nm. In the said nanocarrier, the hydrophobic drug is enclosed in the aqueous process of the liposomes, while the hydrophilic drug is found in the bilayer of lipid functionality [17].
Liposomes have been used in different investigations for the treatment of colorectal cancer with results indicating that coating their surface with polymers and ligands increases their mucopenetration capacity, especially when liposomes modified with polyethylene glycol (PEG) are used [20,21,22]. These polymeric coatings also allow oral liposomal formulations to resist degradation in the harsh environment of the GI tract, including bile salts and enzymes that would normally dissolve the lipid bilayer [23].
For this investigation, liposomes were modeled as spherical particles with a diameter of 200 nm and a density of 1000 kg m 3 [50]. Likewise, a mean maximum inhibitory concentration of liposomes was used, which was C p = 13.5 μ g mL [32,33]. A Brownian force model represented by Equation (7) was considered as the initial behavior of the particles:
F b i = ζ i π S 0 Δ t
where ζ i is a Gaussian random number with a mean zero (independent of unit variance); Δ t is the timestep of the particle; and S 0 is a function of the Stokes–Cunnigham slip correction coefficient, temperature, kinematic viscosity of the pore fluid, particle diameter and density.
The forces that act on the particle affect its acceleration; this acceleration is due to differences in the velocities between the particle and the fluid, and are represented in Equation (8):
m p d v p dt = F D + F B + F R + F P + F E
where:
  • F D : drag forces acting on the particle;
  • F B : buoyancy forces;
  • F R : forces due to rotation;
  • F P : Force associated with the pressure gradient. This is the force applied to the particle due to the pressure gradient in the fluid surrounding the particle caused by the acceleration of the fluid. This is only significant when the density of the fluid is comparable to or greater than the density of the particle;
  • F E : force associated with the electrostatic interaction of the particle immersed in the electric field produced by the negative charge on the surface of the malignant cell.
The transfer of momentum from the continuous phase to the discrete phase is calculated by examining the change in the particle’s momentum as it passes through the control volume in the model. This change in momentum is calculated as follows:
F = Σ 18 μ C D Re ρ p d p 2 24 u p u f + F additional Δ t
where:
  • μ = fluid viscosity;
  • ρ p = particle density;
  • d p = particle diameter;
  • Re = Reynolds number;
  • u p = particle velocity;
  • u f = fluid velocity;
  • C D = drag coefficient;
  • = particle mass flow;
  • Δ t = timestep or step of time.
  • F adicional = additional forces of interaction, such as the electrostatic force that induces selective coupling [51].
Regarding electrostatic forces, any nanocarrier charged particle (Qp) that moves in the interstitial space of a tumor region is immersed in an electric field caused by the charge on the surface of cancer cells (Qc). This implies that its trajectory is affected as its distance r from the negatively charged cell surface decreases, to the point of perceiving an electrostatic attraction force, given by (10):
F = k e Q c Q p r 2 r ^
Parameters such as the conductivity of the extracellular environment: 5.0 × 10 4 S m 2.0 S m [52]; electrical conductivity of a liposome: 1.07 × 10 4 S m [53]; and the surface charge of liposomes: 5.92 × 10 21 C nm 2 ; as well as the zeta potential of cancer cells (−35 mV) [54] were taken into account in the estimation of the electrostatic forces, because as a general rule, cationic liposomes bind more easily to anionic cells, due to their opposite charge [54,55]. The average tumor pH of 7.06 was considered, and the most internal and hypoxic region of the tumor was parametrized with a pH of 6.2, while the tumor periphery was parametrized with the highest pH (7.2) [34].

5. Conclusions

The elaboration of a computational model was achieved, which resembled the natural behavior of attraction and contact (coupling) of the vectorized nanocarriers with the cancerous glands within the microenvironment. The computational results showed vectorized deposition efficiency values between 1 and 4.46%. These responses confirmed that the nanocarriers were able to selectively identify malignant glands in the tumor microenvironment, as uncoupled nanocarriers continued their movement to more internal regions without coupling to healthy cell regions.
The times taken for the vectorized nanocarriers to enter the microenvironment were found. This result is essential as it provides an insight into the ability of nanocarriers to irrigate the entire tumor region.
The studies developed will contribute to other experimental investigations that are being carried out on the behavior of pharmacological nanocarriers, since the procedures to evaluate the efficiency of nanocarrier vectorization are complex.
Artificial intelligence facilitated the selection process of histological samples between stages II and III, which were necessary for the elaboration of computational developments.
The developments and results carried out for the 2D histological samples were corroborated by means of 3D computer simulations and comparison with other previous studies, verifying the coincidence in the ranges of velocities reached by the interstitial fluid and the nanoparticles, which allows us to conclude that there was an appropriate representation of the biological behavior of the transport of vectorized nanocarriers.
The computationally obtained findings contribute to the knowledge about the potential of nanoencapsulated pharmacological treatments to combat colorectal cancer, especially when studies are carried out with different morphological characteristics, which can contribute to precision medicine.

Author Contributions

Conceptualization, E.V.M. and G.S.G.; formal analysis, E.V.M. and G.S.G.; funding acquisition, L.M.H.P.; investigation, E.V.M., G.S.G., L.M.H.P. and Y.M.; methodology, E.V.M., G.S.G. and Y.M.; resources, L.M.H.P.; software, E.V.M.; supervision, G.S.G., L.M.H.P. and Y.M.; visualization, E.V.M.; writing—original draft, E.V.M.; writing—review and editing, E.V.M., Y.M. and G.S.G. All authors have read and agreed to the published version of the manuscript.

Funding

This research and APC was funded by MINCIENCIAS, MINEDUCACIÓN, MINCIT and ICETEX, through the Program Ecosistema Científico, grant number FP44842-211-2018 Project number 58962.

Institutional Review Board Statement

Not applicable.

Informed Consent Statement

Patient consent was waived due to the corresponding consents from previous investigations inherited [39,40,41,42,43], which declare to have been collected with the due informed consent of the patient.

Data Availability Statement

Not applicable.

Acknowledgments

The authors would like to thank the Centro de Investigación para el Desarrollo y la Innovación (CIDI) of Universidad Pontificia Bolivariana and the program Colombia Científica in the project Nanobiocáncer for the valuable funding and technical and administrative support.

Conflicts of Interest

The authors declare no conflict of interest.

References

  1. Johari, B.; Rezaeejam, H.; Moradi, M.; Taghipour, Z.; Saltanatpour, Z.; Mortazavi, Y.; Nasehi, L. Increasing the colon cancer cells sensitivity toward radiation therapy via application of Oct4–Sox2 complex decoy oligodeoxynucleotides. Mol. Biol. Rep. 2020, 47, 6793–6805. [Google Scholar] [CrossRef] [PubMed]
  2. Asadi, Z.; Fathi, M.; Rismani, E.; Bigdelou, Z.; Johari, B. Application of decoy oligodeoxynucleotides strategy for inhibition of cell growth and reduction of metastatic properties in nonresistant and erlotinib-resistant SW480 cell line. Cell Biol. Int. 2021, 45, 1001–1014. [Google Scholar] [CrossRef] [PubMed]
  3. Basave, H.N.L.; Sarmiento, I.V.; Takahashi, A.M.L.; Rosciano, A.E.P.; Molina, J.M.R.; Ruiz, G.C.; Romero, C.D.; Ruan, J.M.; Crocifoglio, V.A. Cáncer de colon y recto. In Manual de Oncología, 6th ed.; Herrera-Gómez, Á., Ñamendys-Silva, S.A., Meneses-García, A., Eds.; McGraw-Hill Education: New York, NY, USA, 2018. [Google Scholar]
  4. Kwaan, M.R.; Stewart Sr, D.B.; Dunn, K.B. Colon, recto y ano. In Schwartz. Principios de Cirugía, 11th ed.; Brunicardi, F.C., Andersen, D.K., Billiar, T.R., Dunn, D.L., Kao, L.S., Hunter, J.G., Matthews, J.B., Pollock, R.E., Eds.; McGraw-Hill Education: New York, NY, USA, 2020. [Google Scholar]
  5. Hernández, H.R.; Jacobo, S.R.; Reyes Romero, M.A. Cáncer colorrectal: Factores epidemiológicos, epigenéticos, métodos de diagnóstico y tratamiento. In Gastroenterología, 3rd ed.; Méndez-Sánchez, N., Ed.; McGraw-Hill Education: New York, NY, USA, 2018. [Google Scholar]
  6. Wellstein, A.; Giaccone, G.; Atkins, M.B.; Sausville, E.A. Capítulo 66: Fármacos Citotóxicos; McGraw Hill: New York, NY, USA, 2022. [Google Scholar]
  7. Bailly, C. Irinotecan: 25 years of cancer treatment. Pharmacol. Res. 2019, 148, 104398. [Google Scholar] [CrossRef] [PubMed]
  8. Wellstein, A.; Giaccone, G.; Atkins, M.B.; Sausville, E.A. Fármacos citotóxicos. In Goodman & Gilman: Las Bases Farmacológicas De La Terapéutic, 13th ed.; Brunton, L.L., Chabner, B.A., Knollmann, B.C., Eds.; McGraw-Hill Education: New York, NY, USA, 2019. [Google Scholar]
  9. American Cancer Society. Colorrectal Cancer. Available online: https://www.cancer.org/cancer/colon-rectal-cancer.html (accessed on 15 January 2023).
  10. Laroui, H.; Wilson, D.S.; Dalmasso, G.; Salaita, K.; Murthy, N.; Sitaraman, S.V.; Merlin, D. Nanomedicine in GI. Am. J. Physiol. Gastrointest. Liver Physiol. 2011, 300, 371–383. [Google Scholar] [CrossRef]
  11. Chakravarty, K.; Dalal, D.C. Mathematical modelling of liposomal drug release to tumour. Math. Biosci. 2018, 306, 82–96. [Google Scholar] [CrossRef]
  12. Sahai, N.; Gogoi, M.; Ahmad, N. Mathematical Modeling and Simulations for Developing Nanoparticle-Based Cancer Drug Delivery Systems: A Review. Curr. Pathobiol. Rep. 2021, 9, 1–8. [Google Scholar] [CrossRef]
  13. Ebrahimnejad, P.; Sodagar Taleghani, A.; Asare-Addo, K.; Nokhodchi, A. An updated review of folate-functionalized nanocarriers: A promising ligand in cancer. Drug Discov. Today 2021, 27, 471–489. [Google Scholar] [CrossRef]
  14. Moosmann, N.; Von Weikersthal, L.F.; Vehling-Kaiser, U.; Stauch, M.; Hass, H.G.; Dietzfelbinger, H.; Oruzio, D.; Klein, S.; Zellmann, K.; Decker, T.; et al. Cetuximab plus capecitabine and irinotecan compared with cetuximab plus capecitabine and oxaliplatin as first-line treatment for patients with metastatic colorectal cancer: AIO KRK-0104—A randomized trial of the German AIO CRC study group. J. Clin. Oncol. 2011, 29, 1050–1058. [Google Scholar] [CrossRef]
  15. Shah, S. Numerical Simulation of Particle Adhesion Dynamics for Applications in Nanomedicine and Biosensing; The University of Texas at Arlington: Arlington, TX, USA, 2009. [Google Scholar]
  16. Chandran, S.P.; Natarajan, S.B.; Chandraseharan, S.; Mohd Shahimi, M.S.B. Nano drug delivery strategy of 5-fluorouracil for the treatment of colorectal cancer. J. Cancer Res. Pract. 2017, 4, 45–48. [Google Scholar] [CrossRef]
  17. Hani, U.; Honnavalli, Y.K.; Begum, M.Y.; Yasmin, S.; Osmani, R.A.M.; Ansari, M.Y. Colorectal cancer: A comprehensive review based on the novel drug delivery systems approach and its management. J. Drug Deliv. Sci. Technol. 2021, 63, 102532. [Google Scholar] [CrossRef]
  18. Pérez-Herrero, E.; Fernández-Medarde, A. Advanced targeted therapies in cancer: Drug nanocarriers, the future of chemotherapy. Eur. J. Pharm. Biopharm. 2015, 93, 52–79. [Google Scholar] [CrossRef] [PubMed]
  19. Bitounis, D.; Fanciullino, R.; Iliadis, A.; Ciccolini, J. Optimizing Druggability through Liposomal Formulations: New Approaches to an Old Concept. ISRN Pharm. 2012, 2012, 738432. [Google Scholar] [CrossRef] [PubMed]
  20. Wang, Y.; Pi, C.; Feng, X.; Hou, Y.; Zhao, L.; Wei, Y. The influence of nanoparticle properties on oral bioavailability of drugs. Int. J. Nanomed. 2020, 15, 6295–6310. [Google Scholar] [CrossRef] [PubMed]
  21. Yamazoe, E.; Fang, J.Y.; Tahara, K. Oral mucus-penetrating PEGylated liposomes to improve drug absorption: Differences in the interaction mechanisms of a mucoadhesive liposome. Int. J. Pharm. 2021, 593, 120148. [Google Scholar] [CrossRef] [PubMed]
  22. Lee, M.K. Liposomes for enhanced bioavailability of water-insoluble drugs: In vivo evidence and recent approaches. Pharmaceutics 2020, 12, 264. [Google Scholar] [CrossRef]
  23. Hua, S. Orally administered liposomal formulations for colon targeted drug delivery. Front. Pharmacol. 2014, 5, 138. [Google Scholar] [CrossRef]
  24. Ying, K.; Bai, B.; Gao, X.; Xu, Y.; Wang, H.; Xie, B. Orally Administrable Therapeutic Nanoparticles for the Treatment of Colorectal Cancer. Front. Bioeng. Biotechnol. 2021, 9, 670124. [Google Scholar] [CrossRef]
  25. Matsuzawa, F.; Ohki, S.Y.; Aikawa, S.I.; Eto, M. Computational simulation for interactions of nano-molecules: The phospho-pivot modeling algorithm for prediction of interactions between a phospho-protein and its receptor. Sci. Technol. Adv. Mater. 2005, 6, 463–467. [Google Scholar] [CrossRef]
  26. Yang, W.; Lai, L. Computational design of ligand-binding proteins. Curr. Opin. Struct. Biol. 2017, 45, 67–68. [Google Scholar] [CrossRef]
  27. Kang, G.; Márquez, C.; Barat, A.; Byrne, A.T.; Prehn, J.H.M.; Sorribes, J.; César, E. Colorectal tumour simulation using agent based modelling and high performance computing. Futur. Gener. Comput. Syst. 2017, 67, 397–408. [Google Scholar] [CrossRef]
  28. Mustapha, K.; Gilli, Q.; Frayret, J.M.; Lahrichi, N.; Karimi, E. Agent-based Simulation Patient Model for Colon and Colorectal Cancer Care Trajectory. Procedia Comput. Sci. 2016, 100, 188–197. [Google Scholar] [CrossRef]
  29. Bethge, A.; Schumacher, U.; Wedemann, G. Simulation of metastatic progression using a computer model including chemotherapy and radiation therapy. J. Biomed. Inform. 2015, 57, 74–87. [Google Scholar] [CrossRef] [PubMed]
  30. Wedemann, G.; Bethge, A.; Haustein, V.; Schumacher, U. Computer simulation of the metastatic progression. In Methods in Molecular Biology; Dwek, M., Schumacher, U., Brooks, S.A., Eds.; Springer: New York, NY, USA, 2014; Volume 1070, pp. 107–116. [Google Scholar]
  31. Mollazadeh, S.; Sahebkar, A.; Shahlaei, M.; Moradi, S. Nano drug delivery systems: Molecular dynamic simulation. J. Mol. Liq. 2021, 332, 115823. [Google Scholar] [CrossRef]
  32. Dhanavel, S.; Praveena, P.; Narayanan, V.; Stephen, A. Chitosan/reduced graphene oxide/Pd nanocomposites for co-delivery of 5-fluorouracil and curcumin towards HT-29 colon cancer cells. Polym. Bull. 2020, 77, 5681–5696. [Google Scholar] [CrossRef]
  33. Osorio, M.; Martinez, E.; Naranjo, T.; Castro, C. Recent advances in polymer nanomaterials for drug delivery of adjuvants in colorectal cancer treatment: A scientific-technological analysis and review. Molecules 2020, 25, 2270. [Google Scholar] [CrossRef]
  34. Soltani, M.; Souri, M.; Moradi Kashkooli, F. Effects of hypoxia and nanocarrier size on pH-responsive nano-delivery system to solid tumors. Sci. Rep. 2021, 11, 19350. [Google Scholar] [CrossRef]
  35. Wang, J.; Shi, X. Molecular dynamics simulation of diffusion of nanoparticles in mucus. Acta Mech. Solida Sin. 2017, 30, 241–247. [Google Scholar] [CrossRef]
  36. Rendón, J.P.; Cañas, A.I.; Correa, E.; Bedoya-Betancur, V.; Osorio, M.; Castro, C.; Naranjo, T.W. Evaluation of the Effects of Genistein In Vitro as a Chemopreventive Agent for Colorectal Cancer—Strategy to Improve Its Efficiency When Administered Orally. Molecules 2022, 27, 7042. [Google Scholar] [CrossRef]
  37. Sohrabi, S.; Zheng, J.; Finol, E.A.; Liu, Y. Numerical Simulation of Particle Transport and Deposition in the Pulmonary Vasculature. J. Biomech. Eng. 2014, 136, 121010. [Google Scholar] [CrossRef]
  38. Longest, P.W.; Xi, J. Effectiveness of direct Lagrangian tracking models for simulating nanoparticle deposition in the upper airways. Aerosol Sci. Technol. 2007, 41, 380–397. [Google Scholar] [CrossRef]
  39. Rahman, M.M.; Zhao, M.; Islam, M.S.; Dong, K.; Saha, S.C. Numerical study of nanoscale and microscale particle transport in realistic lung models with and without stenosis. Int. J. Multiph. Flow 2021, 145, 103842. [Google Scholar] [CrossRef]
  40. Graham, S.; Chen, H.; Gamper, J.; Dou, Q.; Heng, P.A.; Snead, D.; Tsang, Y.W.; Rajpoot, N. MILD-Net: Minimal information loss dilated network for gland instance segmentation in colon histology images. Med. Image Anal. 2019, 52, 199–211. [Google Scholar] [CrossRef]
  41. Kather, J.N.; Weis, C.A.; Bianconi, F.; Melchers, S.M.; Schad, L.R.; Gaiser, T.; Marx, A.; Zöllner, F.G. Multi-class texture analysis in colorectal cancer histology. Sci. Rep. 2016, 6, 27988. [Google Scholar] [CrossRef] [PubMed]
  42. Kather, J.N.; Zöllner, F.G.; Bianconi, F.; Melchers, S.M.; Schad, L.R.; Gaiser, T.; Marx, A.; Weis, C.-A. Collection of textures in colorectal cancer histology. Zenodo 2016. [Google Scholar] [CrossRef]
  43. Kather, J.N.; Halama, N.; Marx, A. 100,000 histological images of human colorectal cancer and healthy tissue. Zenodo 2018. [Google Scholar] [CrossRef]
  44. Awan, R.; Sirinukunwattana, K.; Epstein, D.; Jefferyes, S.; Qidwai, U.; Aftab, Z.; Mujeeb, I.; Snead, D.; Rajpoot, N. Glandular Morphometrics for Objective Grading of Colorectal Adenocarcinoma Histology Images. Sci. Rep. 2017, 7, 2220–2243. [Google Scholar] [CrossRef]
  45. Derwinger, K.; Kodeda, K.; Bexe-Lindskog, E.; Taflin, H. Tumour differentiation grade is associated with TNM staging and the risk of node metastasis in colorectal cancer. Acta Oncol. 2010, 49, 57–62. [Google Scholar] [CrossRef]
  46. Helander, H.F.; Fändriks, L. Surface area of the digestive tract-revisited. Scand. J. Gastroenterol. 2014, 49, 681–689. [Google Scholar] [CrossRef]
  47. Devadason, D.; Goldman, D.A. 90—Management of Diarrhea. In Pediatric Gastrointestinal and Liver Disease, 6th ed.; Wyllie, R., Hyams, J.S., Kay, M., Eds.; Elsevier: Philadelphia, PA, USA, 2021; pp. 1012–1022.e3. [Google Scholar]
  48. Yao, W.; Shen, Z.; Ding, G. Simulation of interstitial fluid flow in ligaments: Comparison among Stokes, Brinkman and Darcy models. Int. J. Biol. Sci. 2013, 9, 1050–1056. [Google Scholar] [CrossRef]
  49. Pedersen, J.A.; Boschetti, F.; Swartz, M.A. Effects of extracellular fiber architecture on cell membrane shear stress in a 3D fibrous matrix. J. Biomech. 2007, 40, 1484–1492. [Google Scholar] [CrossRef]
  50. Deshpande, S.; Birnie, A.; Dekker, C. On-chip density-based purification of liposomes. Biomicrofluidics 2017, 11, 034106. [Google Scholar] [CrossRef] [PubMed]
  51. ANSYS Inc. ANSYS CFX-Solver Theory Guide; ANSYS Inc.: Canonsburg, PA, USA, 2019. [Google Scholar]
  52. Peters, M.J.; Stinstra, J.G.; Leveles, I. The Electrical Conductivity of Living Tissue: A Parameter in the Bioelectrical Inverse Problem. In Modeling and Imaging of Bioelectrical Activity: Principles and Applications; Springer: New York, NY, USA, 2004; pp. 281–319. [Google Scholar] [CrossRef]
  53. Chan, K.L.; Gascoyne, P.R.; Becker, F.F.; Pethig, R. Electrorotation of liposomes: Verification of dielectric multi-shell model for cells. Bone 1997, 1349, 182–196. [Google Scholar] [CrossRef] [PubMed]
  54. Riedl, S.; Leber, R.; Rinner, B.; Schaider, H.; Lohner, K.; Zweytick, D. Human lactoferricin derived di-peptides deploying loop structures induce apoptosis specifically in cancer cells through targeting membranous phosphatidylserine. Biochim. Biophys. Acta Biomembr. 2015, 1848, 2918–2931. [Google Scholar] [CrossRef] [PubMed]
  55. Dan, N. Effect of liposome charge and PEG polymer layer thickness on cell-liposome electrostatic interactions. Biochim. Biophys. Acta Biomembr. 2002, 1564, 343–348. [Google Scholar] [CrossRef]
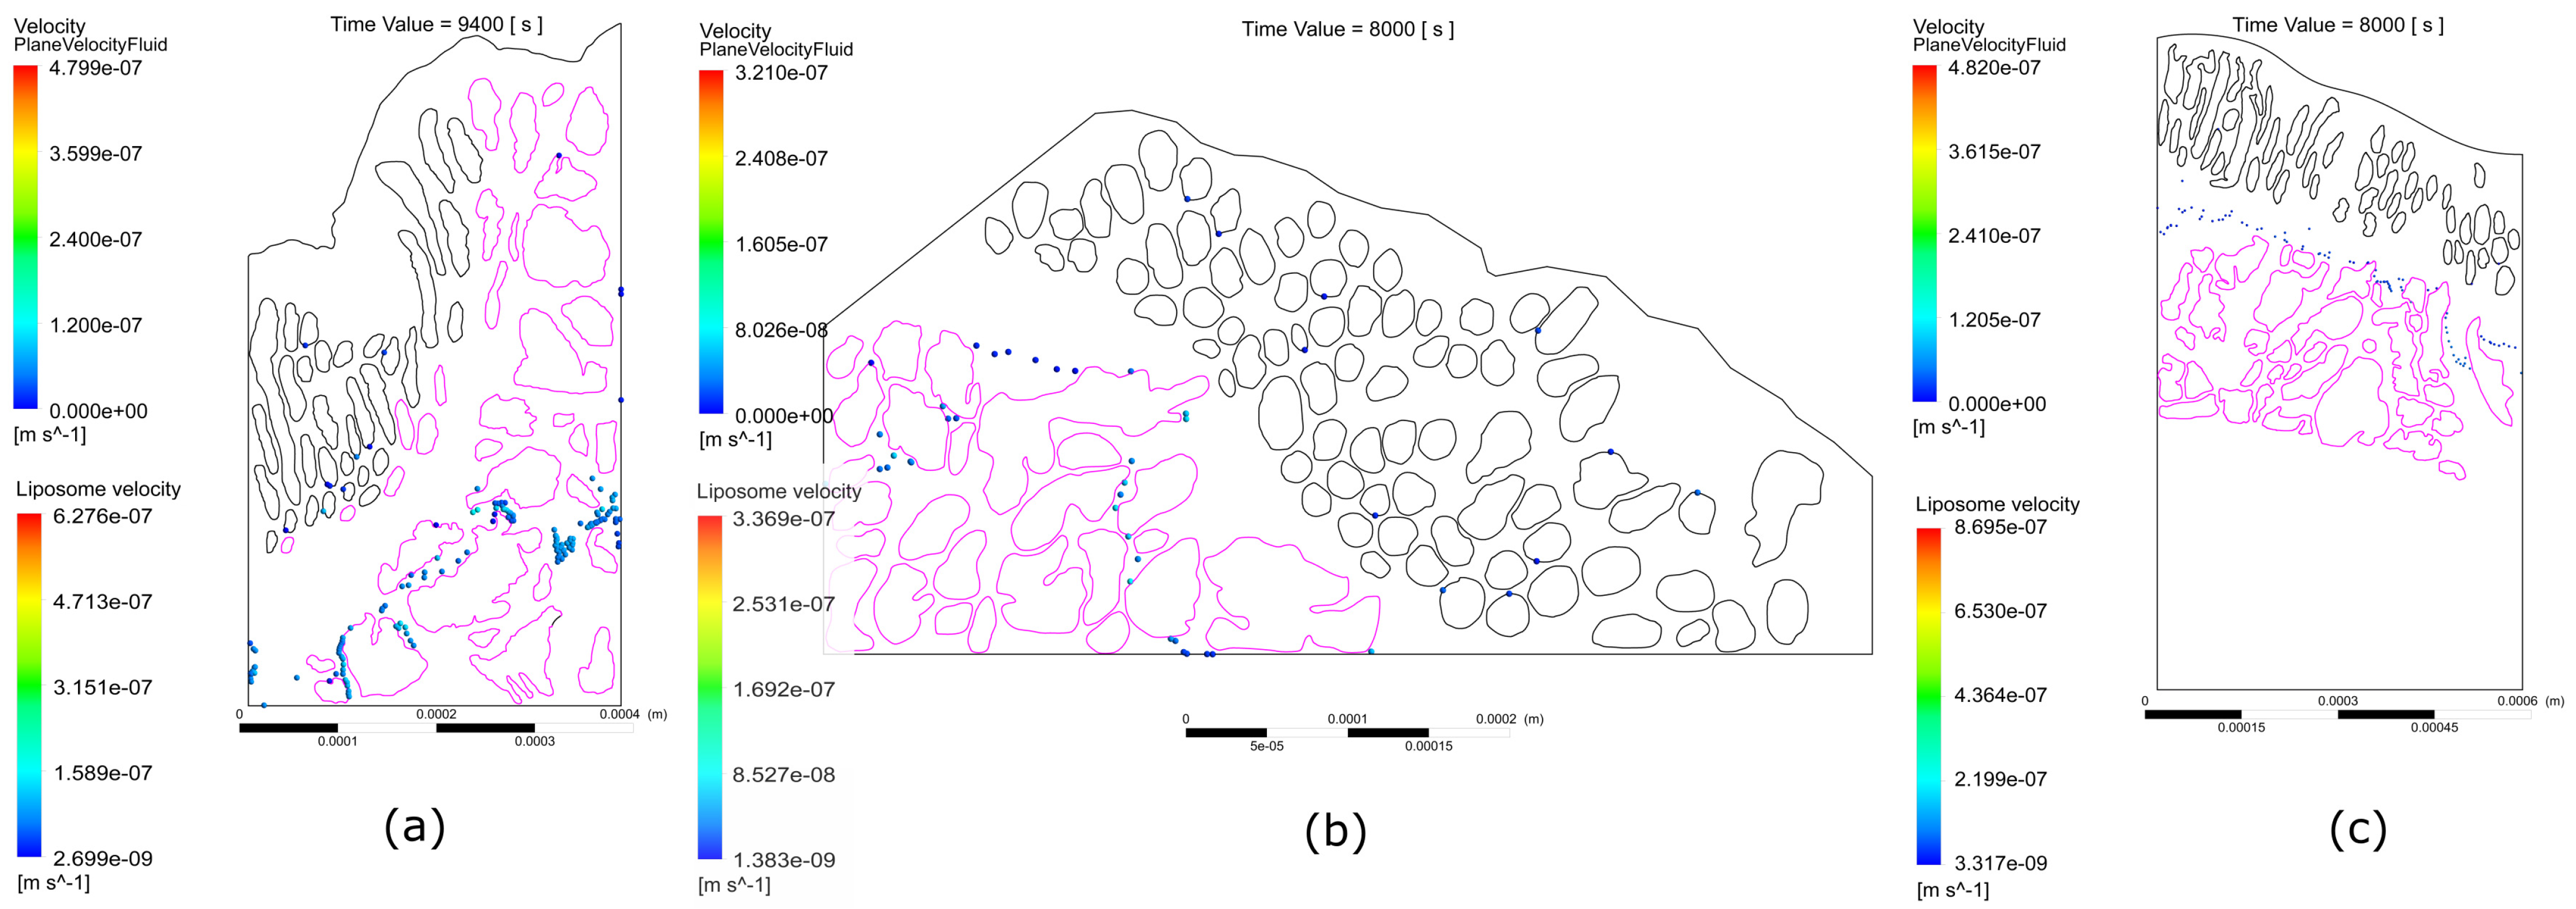
Figure 1. Behavior of liposomes in the interstitial space of the histological samples of colorectal cancer. Healthy regions are shown with a black border and cancerous regions with a fuchsia border. (a) First sample. (b) Second sample. (c) Third sample.
Applsci 13 06248 g001
Figure 2. Trajectory of the deposition of liposomes with malignant cellular regions in the histological sample. The trajectory on the right side corresponds to the first particle to be coupled, and the trajectory on the left side represents the last particle to be coupled. Healthy regions are shown with a black border and cancerous regions with a fuchsia border.
Applsci 13 06248 g002
Figure 3. Velocity reached by the liposomes to attach to the surface of malignant cell regions in the histological sample of colorectal cancer #1. (a) Liposome attached 4340 s after the administration of the first treatment dose, which presents smaller increases in velocity due to its passage through less narrow regions, compared to (b) Liposome coupled 9339 s after the administration of the first dose of treatment, which shows several increases in its velocity due to its passage through a greater number of narrow regions.
Applsci 13 06248 g003
Figure 4. Trajectory of the deposition of liposomes with malignant cellular regions in colorectal cancer histology sample #2. The trajectory on the right side corresponds to the first particle to be coupled and the trajectory on the left side represents the last particle to be coupled. Healthy regions are shown with a black border and cancerous regions with a fuchsia border.
Applsci 13 06248 g004
Figure 5. Velocity reached by the liposomes to attach to the surface of malignant cell regions in the histological sample of colorectal cancer #2. (a) Liposome coupled 8364 s after administration of the first dose of treatment. (b) Liposome coupled 12,280 s after administration of the first dose of treatment. Both particles present a similar behavior, with a tendency to decrease their speed long before the coupling, with some small increases in speed, possibly due to their passage through narrower regions.
Applsci 13 06248 g005
Figure 6. Trajectory of the deposition of liposomes with malignant cellular regions in the histological sample. Healthy regions are shown with a black border and cancerous regions with a fuchsia border.
Applsci 13 06248 g006
Figure 7. Velocity achieved by the liposomes to attach to the surface of malignant cell regions in the histological sample. (a) Liposome coupled 10,638 s after administration of the first dose of treatment. (b) Liposome coupled 12,255 s after administration of the first dose of treatment. Both particles tend to maintain speeds close to 5.00 × 10 8 m s , but particle (a) reaches a coupling at an earlier time, because in the first 2000 s it advances faster towards the cancerous region than particle (b).
Applsci 13 06248 g007
Figure 8. Behavior of liposomes in the interstitial space of the histological sample by means of a 3D simulation. Healthy regions are shown in blue and cancerous regions in fuchsia.
Applsci 13 06248 g008
Figure 9. Trajectory of liposome deposition with malignant cell regions in colorectal cancer histology sample #1 using 3D simulation. Healthy regions are shown in blue and cancerous regions in fuchsia.
Applsci 13 06248 g009
Figure 10. Velocity achieved by the liposomes to attach to the surface of malignant cell regions in the histological sample by means of 3D simulation. (a) Liposome coupled 4200 s after administration of the first dose of treatment. (b) Liposome coupled 12,680 s after administration of the first dose of treatment. The main difference between these two particles (besides the time in which they couple) is that particle (b) continues to increase its speed as it travels to deeper regions, while particle (a) maintained a relatively stable velocity.
Applsci 13 06248 g010
Figure 11. Research methodology carried out to study the behavior and coupling of the vectorized nanocarriers with malignant cellular regions of colorectal cancer in the tumor microenvironment.
Applsci 13 06248 g011
Figure 12. Preparation of a sample using image processing algorithms and artificial vision. The original sample is processed, identifying the shape of the glands to finally obtain a discretization of the study domain through a computational mesh.
Applsci 13 06248 g012
Table 1. Variables of interest.
DescriptionUnitsSymbol
Fluid mobilitym/s V f
Vectorized deposition efficiency% DE
Maximum depth reached by the particlesmd
Timest
Disclaimer/Publisher’s Note: The statements, opinions and data contained in all publications are solely those of the individual author(s) and contributor(s) and not of MDPI and/or the editor(s). MDPI and/or the editor(s) disclaim responsibility for any injury to people or property resulting from any ideas, methods, instructions or products referred to in the content.