Abstract
Review-based control charts that integrate sentiment analysis with traditional control charts are emerging as effective tools for analyzing customer complaints. However, existing approaches face significant challenges due to their lack of alignment with the natural characteristics of online reviews, such as limited review volumes or imbalanced mentions of attributes. To address these challenges, which are commonly encountered in real-world applications, this study proposes a novel framework for review-based complaint analysis that combines a bi-level control chart with dynamic importance–performance analysis. The proposed method converts unstructured reviews into a set of statistical control charts, analyzes how the average of and variation in attribute importance and performance change over time, and identifies whether the changes are a natural event, a temporal aberration, or a gradual trend. This allows for conducting apples-to-apples quality comparison among multiple attributes and establishing appropriate improvement strategies in real-time and proactive manners. To demonstrate the applicability and effectiveness of the method, an empirical case study using online hotel reviews is presented.
1. Introduction
In the current dynamic and highly competitive business environment, companies are compelled to monitor the voice of customers (VOC) and consistently improve their products, encompassing both tangible goods and intangible services. Online customer reviews are a valuable source for the VOC, as they reveal whether customers are satisfied with a product and the reasons for their satisfaction or dissatisfaction [1,2]. Negative feedback or complaints in reviews are particularly important as they highlight existing or potential quality issues, which can tarnish a product’s reputation and adversely influence potential customers’ purchasing decisions [3,4,5]. Therefore, to achieve customer satisfaction and facilitate future sales, it is crucial for companies to closely monitor the prevalence of negative reviews, identify the root causes of complaints, and develop appropriate strategies to enhance product quality and customer satisfaction [1,6,7].
Performing attribute-level sentiment analysis of online customer reviews can offer a productive and practical approach to monitor customer complaints. Sentiment analysis extracts customer opinions for an attribute from written text and identifies whether their sentiments for the attribute are positive, negative, or mixed [8]. By using sentiment analysis, companies can count the number of negative reviews for each attribute, which serves as a measure of the quality of specific attributes. This approach helps identify quality concerns and prioritize attributes that require improvement [6,9].
In this context, the integration of sentiment analysis and conventional control charts into a review-based control chart has emerged as a novel approach for analyzing customer complaints [3,10]. A review-based control chart first utilizes sentiment analysis to measure customers’ opinions on specific attributes and then plots the results, typically the count or proportion of negative reviews over a given period, in chronological order using a control chart. Review-based control charts enable time-series analysis of complaints and facilitate monitoring of the average level of complaints and their fluctuations over time, which can signal any need for quality improvement. Given their efficiency and effectiveness in utilizing automated analytics, review-based control charts are increasingly attracting attention as alternatives or complements to conventional survey-based monitoring tools, such as customer satisfaction surveys and SERVQUAL.
Starting with the study by Lo [11], previous studies have demonstrated the potential and value of review-based control charts. However, as pointed out in Kim et al. [12], existing approaches have fundamental issues that may prevent them from fitting the natural characteristics of online customer reviews, namely, the inconsistency and uncontrollability of the number and content of reviews. In real-world cases, there is a chance that an extremely small number of reviews are posted. Moreover, customers usually mention only the attributes that they consider important or those they consider an interesting point differentiating the reviewed product from competitors. Accordingly, the number of reviews with respect to an attribute is likely to be smaller than the total number of reviews, indicating an increased probability of failure to meet the minimum sample size requirement for a valid control chart.
The interpretation of control charts also raises concerns. As customers tend to mention only the attributes that they think are important, the complaint rate (charting value) of an attribute tends to increase with the attribute’s importance, regardless of its actual performance. A smaller value does not necessarily indicate fewer complaints or better performance; it can also indicate a lower attribute importance. This implies that the current charting value does not support an apples-to-apples comparison of attribute performance. Thus, the applicability and usefulness of the existing review-based control charts are likely to be limited in real-world cases, especially when conducting attribute-level complaint monitoring. A new review-based control chart is required to assist in the accurate judgement of attribute quality.
The present study aims to develop a novel approach for analyzing customer complaints using review-based control charts. The study proposes a bi-level control chart (BLCC) in combination with dynamic importance–performance analysis (DIPA) as a new tool for monitoring complaints and prioritizing attributes for quality improvement. The proposed method is distinguished from the existing studies on review-based control charts in three ways. First, the proposed BLCC is the first review-based control chart that segregates the monitoring of attribute importance and performance, which facilitates a fair comparison of multiple attributes and an accurate diagnosis of quality issues. Second, this approach is the first study to apply the g-chart to customer review analytics. It can address the challenges of the small number and inconsistent content of reviews in real-world applications. Third, to the best of our knowledge, this approach is the first attempt to integrate review-based control charts with importance-performance analysis (IPA), a widely used technique for establishing product improvement and investment strategies [13].
The proposed method is well-suited to the natural characteristics of online customer reviews and can be applied to a variety of products, including both tangible goods and intangible services. It is expected to support quality monitoring and complaint management in various industries, even in cases where it may be challenging to collect a sufficient number of customer reviews. To illustrate the proposed method and to demonstrate its application and effectiveness, this article presents an empirical case study conducted on online hotel reviews.
The remainder of this article is organized as follows: Section 2 presents a survey of related studies; Section 3 describes the BLCC and DIPA methods; an illustrative case study is presented in Section 4 and Section 5, which discuss the implications of the proposed method; and Section 6 concludes the paper with future research directions.
2. Related Work
This section discusses two streams of related research: the time-series visualization of online customer reviews and review-based IPAs. It is important to note that the current article does not review research on the development of review analytics techniques, such as attribute extraction and sentiment analysis. This is because the primary focus and contribution of this article is on the integration of attribute-level sentiment analysis results with control charts and IPA matrices, rather than on the enhancement of sentiment analysis techniques. Additional information on sentiment analysis techniques can be found elsewhere [3,14,15].
2.1. Time-Series Visualization of Online Customer Reviews
A few studies have conducted time-series visualizations of online customer reviews to understand how customer needs change over time and derive business insights from the trend. Two types of charts are used most often: time-series plots (TSP) and control charts. Table 1 summarizes the relevant studies on the time-series visualization of online customer reviews.

Table 1.
Summary of studies on the time-series visualization of online reviews.
A TSP shows the data points in the order in which they occur. Several studies have used TSPs to visualize the results of sentiment analysis to understand the dynamic changes in customer needs or the performance of products. Tucker and Kim [16] used TSPs to discover customer preference trends at the attribute level. The proportion of reviews that referred to the attribute in a month (or the rate of attribute reference) was plotted in a TSP. Jin et al. [2] identified trends in customer requirements by plotting the attribute reference rates and average sentiment polarity in the TSPs. Min et al. [17] applied TSPs to plot the number of positive and negative reviews for various smartphone applications. Chang et al. [18] proposed a review analytics framework for hotel reviews that includes timeline analysis using TSPs. Joung et al. [19] presented a topic modeling–based approach to monitor service failure trends using TSPs.
Although TSPs are easy to construct and interpret, statistical control charts may be a better option for diagnosing the average of and variation in the quality level [23]. Control charts are similar to TSPs in that they display data in chronological order; however, they provide more information by means of the center line (CL), which represents the average quality, and the upper and lower control limits (UCL and LCL, respectively), which represent the range of expected quality variation [23,24]. With these additional lines, control charts classify quality variation into two types: common-cause variation (the “in control” state, in which only random shifts exist because of factors that are always present) and special-cause variation (the “out-of-control” state, due to specific, assignable root causes that are not always present).
In recent years, there has been a growing trend of utilizing control charts to examine online customer reviews. The p-chart and EWMA chart have been the most commonly employed methods in previous research, with the p-chart being suitable for binary data and the EWMA chart for continuous data. Lo [11] first attempted a review-based control chart using a support vector machine (SVM) technique and p-charts. An SVM was used to classify customer messages into complaints and non-complaints, and a p-chart was used to monitor the rate of complaints per week. Ashton et al. [20,21] presented review-based control charts using EWMA and p-charts. They identified several complaint topics using the latent semantic analysis (LSA) technique and displayed each topic’s eigenvector component value and appearance rate using an EWMA and a p-chart, respectively. Liang and Wang [22] proposed a sequential reverse joint sentiment-topic (SRJST) chart that can detect shifts in topic-sentiment combinations in reviews. Kim and Lim [10] used a review-based p-chart to monitor the proportion of negative reviews.
Previous studies have demonstrated that review-based control charts can be an effective method for visualizing and monitoring online customer reviews. However, existing approaches face potential issues and challenges in real-world applications because they pay less attention to data requirements for control charts and the natural characteristics of customer-generated reviews, according to Kim et al. [12]. Specifically, in real-world applications, it is almost impossible to control the number of reviews collected during a given time period. The number of reviews varies between time periods and occasionally fails to meet the minimum data requirement for creating a valid control chart at the attribute level. One may consider extending the time interval (e.g., from every month to every quarter) to obtain sufficient reviews, but that raises another issue in that a shift in quality cannot be detected on time.
Inconsistent review content brings about additional challenges. A lower rate of negative reviews does not necessarily mean fewer complaints or better quality, but may be due to a lower attribute importance. If the rate of negative reviews is directly plotted in a control chart, as in existing approaches, there is a risk of misjudging an attribute’s relative quality, which may complicate attribute prioritization for improvement. It is needed to establish a novel method for review-based complaint monitoring that can address the challenges of a small number of reviews and unequal references to attributes in real-world applications.
2.2. Review-Based IPA
IPA categorizes and prioritizes product attributes based on their relative importance and performance [13,15]. As shown in Figure 1, it is performed based on a four-quadrant graph with importance and performance scores on the y- and x-axes, respectively. Each product attribute belongs to one of the four quadrants, and different improvement strategies are suggested according to the quadrant as follows:
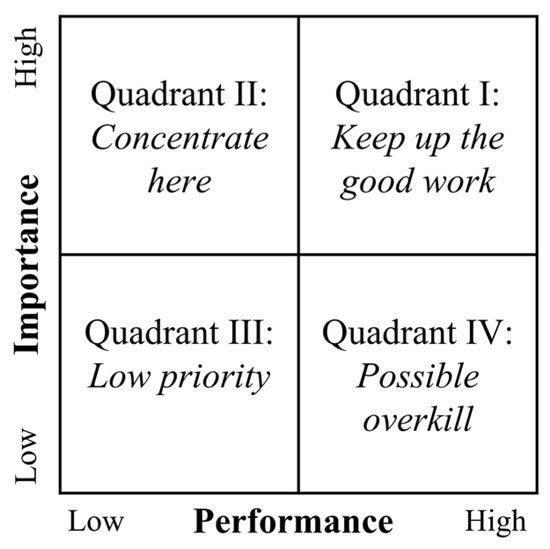
Figure 1.
Importance–performance analysis (adapted and redrawn from [13]).
- Quadrant I: Keep up the good work. Customers consider the attributes in this quadrant important, and they are satisfied with the current performance of the attributes.
- Quadrant II: Concentrate on improving the attributes in this quadrant. Customers consider these attributes very important but feel low satisfaction with them.
- Quadrant III: Give low priority to the attributes in this quadrant. There is no need to improve the performance levels of these attributes as they are relatively less important to customers.
- Quadrant IV: Be cautious about possible overkill because the attributes in this quadrant are less important to customers. Overinvestment should be avoided.
The conventional approach for conducting IPAs is through customer surveys, which can be time-consuming and resource-intensive [25,26]. Recently, review analytics has recently emerged as an alternative for more efficient IPAs. Table 2 summarizes the studies on review-based IPA, where sentiment analysis is typically employed to assess the importance and performance levels of product attributes, which are then presented in an IPA chart.
Table 2.
Summary of studies on review-based IPA.
Attribute importance measures can be classified into two types: appearance and significance. Appearance indicates the term frequency of each product attribute, which is the proportion of reviews that mention the attribute. Significance, on the other hand, represents the relative impact of an attribute on overall customer satisfaction. Because it is implicit, an additional approach such as regression analysis, decision tree classification, or artificial neural network analysis is required for estimation. For attribute performance, most studies used sentiment analysis results directly. The percentage of positive reviews and sentiment scores have been the most common measures.
Wang et al. [27] used online customer reviews to conduct an IPA comparing two types of smartphone applications for hotel reservations: one offered by online travel agencies and the other by hotel brands. To assess attribute importance and performance, the authors used the proportion of references and the proportion of positive reviews, respectively. Nam and Lee [28] combined a topic modeling technique called latent Dirichlet allocation (LDA) with an IPA approach. The authors defined product attributes and attribute-related words based on the topics obtained from the LDA, and the frequency and sentiment intensity of these words were used to determine attribute importance. To estimate attribute performance, the average star ratings of reviews that included attribute-related words were analyzed. Jeong et al. [29] conducted an IPA based on LDA and deep learning-based sentiment analysis. They first extracted important topics using LDA and then performed sentiment analysis to obtain the performance scores. Chen et al. [33] conducted a review-based IPA using online hotel reviews to explore the strengths and weaknesses of hotels. They extracted the importance of attributes using term frequency–inverse document frequency (TF-IDF) and calculated performance based on sentiment scores. The results were compared across two- to five-star hotels. Wang et al. [34] presented a review-based IPA using visitors’ online reviews for urban parks in Beijing, evaluating the most important attributes and identifying parks in need of immediate renewal. Additionally, their findings revealed multiple temporal changes by season. Liu and Zhang [31] utilized sentiment analysis and review-based IPA to analyze online hotel reviews. They determined the importance of each attribute by performing a partial correlation analysis between the star rating of the review and the sentiment scores of the attributes. Wang et al. [32] proposed a three-dimensional IPA that divides the importance dimension into two perspectives: positive importance (i.e., weight of positive sentiment on the overall product rating) and negative importance. Joung and Kim [25] employed a deep neural network to determine the importance of smartphone attributes. To obtain importance estimates with lower variance, they combined estimates from multiple optimal neural networks.
Similar to conventional survey-based IPAs, most review-based IPAs have been conducted in a static manner, analyzing data all at once without considering the time factor. However, such static IPAs are insufficient for understanding how customer needs change over time. Thus, several recent studies [26,35] have suggested DIPA, which analyzes changes in the attribute importance and performance levels over time by applying IPA repeatedly to multiple time-series datasets. DIPA can help establish product improvement strategies that consider trends in the market.
Focusing on the value of DIPA, the present study proposes a combination of a review-based control chart and a DIPA. Here, DIPA is introduced as a new tool for conducting IPA with review-based control charts. It enables a comparative analysis of multiple attributes from the perspective of complaint analysis and assists in prioritizing attributes for quality improvement.
3. Methodology
This section introduces a new method for review-based complaint analysis. As shown in Figure 2, the proposed method consists of three steps: (1) sentiment analysis, (2) creation of BLCCs, and (3) DIPA based on BLCCs. The details of each step are elaborated in Section 3.1, Section 3.2 and Section 3.3, respectively.
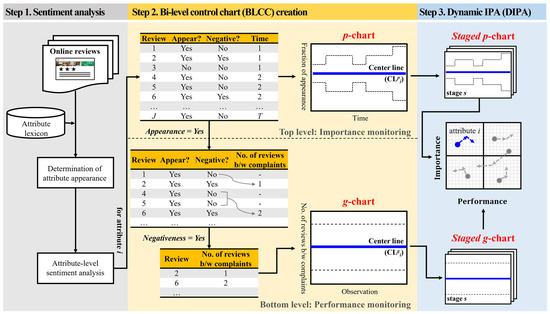
Figure 2.
Overview of the proposed method for review-based complaint analysis.
3.1. Sentiment Analysis
The proposed method begins with an attribute-level sentiment analysis to determine the sentiment expressed in each review regarding individual product attributes. Notably, the method presupposes that the corpus of product reviews is accessible and provided at the outset, assuming that access to the review database or the web crawling of online reviews is permitted. The sentiment analysis deals with typical online reviews that include a time stamp, target product, and textual review.
In addition, it is assumed that a predefined lexicon of attribute words is given at the beginning. This attribute lexicon comprises a list of nouns that represent the product attributes of interest and importance to the decision maker. However, the construction of the lexicon, or attribute extraction, is beyond the scope of this article. Various natural language processing (NLP) methods are available for developing the lexicon, including those based on domain-expert knowledge, term frequency, TF-IDF, and topic modelling techniques, such as LDA, LSA, and BERT, among others. Further details on the techniques for attribute extraction can be found in the literature [16,36,37,38,39,40,41,42].
Using the predefined attribute lexicon, the sentiment analysis identifies product attributes in each review and classifies sentiments toward individual attributes. The effectiveness of the review-based control charts significantly depends on the performance of the sentiment analysis. Therefore, it is crucial to choose an appropriate method and optimize its performance for the proposed method’s success. However, it should be noted that this article’s primary focus and contribution are on combining the results of the attribute-level sentiment analysis with BLCCs and DIPA, rather than advancing sentiment analysis techniques. Several techniques for sentiment analysis exist, such as deep learning-based, machine learning-based, and sentiment lexicon-based approaches. Any of these techniques can be employed within the proposed method’s framework, provided that the output form meets the requirements. Hence, this article concentrates on elaborating the necessary output of the sentiment analysis, rather than explaining the techniques themselves. Additional details on the available techniques for sentiment analysis can be found elsewhere [8,15,43,44,45,46].
Figure 3 depicts the procedure of sentiment analysis required for the proposed method. With respect to an individual attribute, i (), the sentiment analysis examines each review, j , that is collected at a given time, tj , and identifies two values, xi,j and yi,j, which indicate the appearance and negativeness of attribute i, respectively, as expressed in Equations (1) and (2).
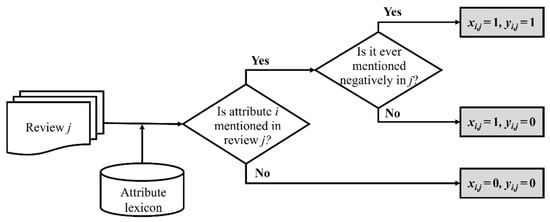
Figure 3.
Procedure of sentiment analysis.
Here, the appearance, xi,j, reflects the relative importance of attribute i to the customer of review j. Online reviews primarily aim to share opinions and experiences with the public, as well as assist others in making purchase decisions. Therefore, customers typically review only the attributes they consider significant in their purchase decision-making. In this regard, the appearance of an attribute in a group of reviews can be a measure of the attribute’s importance in the group; an attribute that appears more frequently is more important in the group.
The negativeness, yi,j, indicates whether attribute i is negatively mentioned in review j (=1) or not (=0). In other words, it indicates whether the review contains a complaint with respect to attribute i. Note that the sentiment intensity or strength is not considered in the proposed method. In addition, an attribute is allowed to have two-sided polarity in a review, which implies that the attribute is satisfactory in some aspects (or sub-attributes) but not in other aspects. Even if both pros and cons are mentioned in a review, the negative opinion is not offset, and yi,j is 1.
Table 3 presents an example of sentiment analysis results. The structured data become the key input for the next step, which is BLCC creation.
Table 3.
Example of structured data resulting from sentiment analysis.
3.2. BLCC Creation
The second step is to construct a BLCC using the structured data obtained from sentiment analysis. The BLCC is created for each attribute and is composed of two subordinate control charts. At the top level of the BLCC, a p-chart monitors the importance of an attribute (the attribute’s appearance frequency). At the bottom level of the BLCC, a g-chart, which is an opportunities-between-events control chart [47,48], monitors the performance of the attribute using the interval between complaints. Section 3.2.1 and Section 3.2.2 describe how to construct the control charts using the results of the sentiment analysis. The general characteristics of the p-charts and g-charts used in the BLCC are beyond the scope of this article and are summarized in Table A1 in the Appendix A.
3.2.1. Top Level: Review-Based p-Chart for Importance Monitoring
For each attribute, i, the p-chart plots the subgroup fraction of attribute appearance, pit, that is, the proportion of reviews mentioning the attribute regardless of the sentiment type (positive, negative, or neutral). Here, a subgroup refers to a set of reviews posted over a unit period of time (e.g., a month). More specifically, pit (corresponding to a point on the chart) is computed using Equation (3), where Rt denotes a set of reviews posted in a given time period, t (i.e., ), and |Rt| denotes the cardinality of set Rt, or, in other words, the total number of reviews posted in the time period. The CL, UCL, and LCL of the p-chart are calculated using Equations (4)–(6), respectively.
Notably, the subgroup size |Rt| can vary from month to month but should be large enough to establish accurate control limits. According to Benneyan [44], the total number of reviews |Rt| should be greater than or equal to 3/pit and 3/(1 − pit). If |Rt| does not satisfy the minimum subgroup size, the corresponding subgroup for time t is excluded in the BLCC.
If the level of attribute appearance (or attribute importance) is stable (in control), there should only be a common-cause variation, and the points of the p-chart should randomly vary around the CL. However, if a point is above the UCL or below the LCL, or if a non-random pattern or trend exists in the chart, a possibility of special-cause variation exists. In this regard, the proposed method applies the rules in Table 4 to identify whether special cause variations exist in the level of importance of an attribute or not [49,50].
Table 4.
Tests for special-cause variation for p-chart.
3.2.2. Bottom Level: Review-Based g-Chart for Performance Monitoring
At the bottom level of the BLCC, the performance of an attribute is monitored; only reviews mentioning the attribute are considered at this level to exclude the effect of attribute importance. To avoid the issue of a small number of reviews, a g-chart is adopted in the review-based control chart for the first time. A g-chart can monitor the intervals between rare events without being affected by the amount of data. In the present study, a g-chart is created for each attribute to monitor the number of non-negative reviews between two negative reviews (complaints). A large average interval implies fewer complaints for an attribute in a given time period, indicating a better performance of the attribute.
A g-chart requires the structured data in Table 3 to be transformed into a new format, that is, the number of non-negative reviews between negative reviews. Thus, the construction of a g-chart begins with data transformation, as shown in Figure 4.
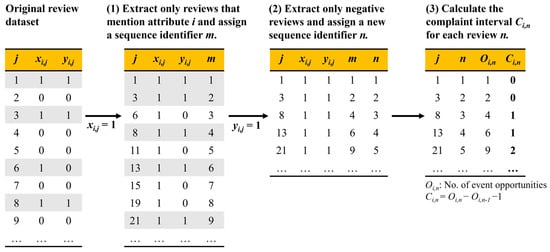
Figure 4.
Data transformation for constructing a g-chart.
Data transformation consists of three steps and is conducted for each attribute. First, only reviews that mention attribute i (xi,j = 1) are extracted as a new dataset, and a new review sequence identifier, m, is assigned to each review in chronological order, starting from 1 to Mi. Second, only negative reviews (i.e., yi,j = 1) are extracted as a new dataset, and another review sequence identifier, n, is assigned to each negative review in chronological order from 1 to Ni. Finally, for each negative review n, the number of event opportunities, Oi,n (i.e., the number of reviews that mention attribute i until the nth negative review, or, the sequence identifier m corresponding to review n), and the complaint interval, Ci,n (i.e., the number of non-negative reviews between the (n − 1)th and nth negative reviews), are calculated using Equation (7). For instance, if negative comments appear in the first and eleventh reviews and the reviews between them are non-negative, then Ci,s and Ci,2 are 0 and 10, respectively. If negative comments appear in a review and in the immediately succeeding review, then the interval is 0. It should be noted that Oi,1 for the first negative review can be set differently if information on the previous reviews is available so that an accurate value of Oi,1 can be obtained.
The g-chart is created using Ci,n. Following the studies by Benneyan [47,51], the complaint probability, qi, is estimated based on the minimum-variance unbiased estimator, as expressed in Equation (8).
The CL, UCL, and LCL are then calculated using Equations (9)–(11), respectively. Considering that the geometric distribution is highly skewed, the probability limit method [47] is adopted here instead of the more familiar ±3 standard deviation method. A UCL in the ±3 standard deviation method tends to be inadequate for a skewed geometric distribution, which results in an excessively high false alarm rate for the UCL in comparison to that for a normal distribution [47,48,52,53]. The probability limit method sets the UCL and LCL by considering the probability that a normal distribution has a point outside either the UCL (+3 standard deviation) or LCL (−3 standard deviation), that is, approximately 0.00135 each. Thus, for a geometric distribution with parameter qi, the UCL is set at the 99.865th percentile (=(1 − 0.00135) × 100) of the geometric distribution, whereas the LCL is set at the 0.135th percentile. The CL is set at the 50th percentile or median. The inverse cumulative distribution function (INVCDF) for a geometric distribution with parameter qi yields the control limits, and 1 is subtracted from the resulting INVCDF values because the proposed method considers the number between two successive events, rather the number until the next event.
For the interpretation of g-charts, it should be noted that an increase in the number of non-negative reviews between negative reviews corresponds to decreased complaints or improved performance. In addition, a greater CL implies fewer complaints for an attribute on average in a time period, indicating a better performance of the attribute. The four test rules in Table 4 can also be used in this step to judge whether the complaint rate or performance level is stable. Additionally, the Benneyan test is conducted to detect an abnormally high complaint rate. Because the LCL of g-charts is zero in most cases, plots beneath the LCL are not possible, given the non-negative nature of “number-between” data. Additional information on the Benneyan test can be found elsewhere [47,48,54].
3.3. DIPA with Staged Charts
In this step, DIPA is conducted based on the proposed review-based p- and g-charts. DIPA is a new visualization tool for representing the temporal changes in attributes’ importance and performance. The proposed DIPA focuses on the fact that the CL of attribute i’s p-chart and g-chart (i.e., CLpi and CLgi) can be an indicator of the attribute’s average importance and performance, respectively, as expressed in Equations (12) and (13). According to Equation (13), the performance index ranges from 0 to 1, given that CLgi can vary between zero and infinity. In this step, a dynamic IPA is conducted using DIPA, i.e., a new visualization tool for representing the time-varying changes of attributes’ importance and performance. The DIPA focuses on the fact that the CLpi and CLgi can be indicators of an attribute’s average importance and performance, respectively, as shown in Equations (12) and (13). Here, Equation (13) makes the performance index range from 0 to 1, given that the CLgi can vary between 0 and infinity.
In Section 3.1 and Section 3.2, the CL was calculated once for the entire dataset (or the entire time horizon), resulting in a single fixed value. The CL is useful to diagnose the overall status of the process in a retrospective manner, but it cannot grasp the trends over time or predict the future status. The DIPA overcomes this limitation using staged control charts.
The DIPA first divides the entire time horizon into multiple stages and calculates the CL, UCL, and LCL of the individual stages; such a control chart with multiple stages is called a staged control chart. The DIPA then calculates the average importance and performance levels of attribute i in each stage, s, using the CLs of staged BLCCs, as expressed in Equations (14) and (15). In these equations, CLpi,s and CLgi,s denote the CL of the staged p- and g-charts of attribute i in stage s, respectively.
The proposed DIPA is performed by tracking how the index values change over time. It is a two-dimensional graph with importance and performance on the y-axis and x-axis, respectively. According to Equations (14) and (15), the point (CLpi,s, 1 − 1/(1 + CLgi,s)) on the DIPA represents the average importance and performance of attribute i in stage s. The DIPA connects the points of the same attribute with arrows in the increasing order of s or in chronological order, which allows us to grasp temporal changes in attributes’ importance and performance.
The DIPA also requires the setting of two boundary values by which relatively low and high levels of importance and performance are determined. Basically, such boundary values can be set by the user. The average levels of the attributes can be used as a reference, and if available, the competitors’ status and market averages can be reflected by setting the boundary values.
4. Case Study
4.1. Data Collection and Sentiment Analysis
To demonstrate the application of BLCC and DIPA and validate their usefulness, this section presents a case study of a five-star hotel in Seoul, Korea (hereafter called Hotel A). Online reviews in Korean were extracted from Tripadvisor.com (accessed on 9 August 2020), the world’s largest travel guidance platform. Among the five-star hotels in Seoul, Hotel A has been reviewed most frequently on the website and was selected as the main analysis target. A total of 980 Korean reviews posted between January 2018 and April 2020 were used in this case study.
For this case study, sentiment analysis is conducted using the lexicon-based approach presented by Lee et al. [55], which utilizes predefined lexicons of product attributes and sentiment words tailored to the hotel domain. In the lexicon-based sentiment analysis, the attribute appearance is determined for the predefined set of attributes in the attribute lexicon. The sentiment for an attribute is then determined based on the sentiment words associated with it. The polarity of the sentiment words is detected using the sentiment lexicon, which is a list of sentiment words (mostly adjectives and adverbs), each of which is tagged with the corresponding sentiment category (positive or negative).
Although the lexicon-based sentiment analysis has a drawback in that it largely depends on the completeness and quality of the underlying sentiment lexicons, it has several advantages that make it a suitable choice for the case study. First, it does not require training of the model and can be applied to relatively small datasets [56]. Second, sentiment lexicons are relatively easy to modify and expand [57], making it possible to customize them to a particular domain and the specific needs of the decision maker [33,58]. Third, the approach enables tracking of the results of the sentiment analysis and understanding the root cause of the outcomes [58,59]. Finally, the approach has been shown to offer good performance when analyzing non-English reviews [58,60].
Table 5 shows the attribute lexicon employed in the case study, which defines seven attributes related to various aspects of hotel services: furniture and appliances (FA), bathroom condition (BC), room condition (RC), dining and food (DF), service and staff (SS), facility and conveniences (FC), and location and surroundings (LS). For each attribute, corresponding words, including sub-attributes and synonyms, are defined. In total, the attribute lexicon consists of 240 words.
Table 5.
Attribute lexicon used for the case study (translated from Korean to English) (adapted with permission from Ref. [55]; published by Elsevier, 2023).
In Table 6, the sentiment lexicon applied in the sentiment analysis is presented. Based on the Kunsan National University (KNU) Korean sentiment lexicon [61], the sentiment words that frequently appear in online hotel reviews are classified as positive or negative words. The sentiment lexicon comprises a total of 251 words, with 130 positive sentiment words and 121 negative sentiment words.
Table 6.
Sentiment-word lexicon used for the case study (translated from Korean to English) (adapted with permission from Ref. [55]; published by Elsevier, 2023).
The sentiment analysis process begins with preprocessing the original review text by splitting it into sentences. Next, tokenizing and part-of-speech tagging are applied to the sentences. In this case study, the Korean morphological analyzer RHINO library [62] was used for this preprocessing. Using the predefined lexicons, the attribute appearance and sentiment polarity are then detected at the sentence level, and the results for each sentence are aggregated at the review level. Table 7 presents the accuracy range of the lexicon-based sentiment analysis, which is between 82% and 89%. Table 8 presents the final output of the sentiment analysis, that is, structured data for the BLCC and DIPA applications.
Table 7.
Accuracy of sentiment-analysis method used for the case study (adapted with permission from Ref. [55]; published by Elsevier, 2023).
Table 8.
Transformed review data for the case study.
4.2. BLCC Creation for Hotel A
4.2.1. Top Level: p-Chart
To monitor the attribute importance, p-charts are drawn for each of the seven attributes, as shown in Figure 5. The fraction of appearance is plotted on a monthly basis; in other words, each point on the charts corresponds to a set of reviews posted in a month. Notably, if the number of reviews in a month does not satisfy the minimum size requirement, the reviews of the month are excluded from the chart. To clarify which months are excluded from the analysis, spaces are left in the charts for the excluded points, although leaving a space is optional. In this case study, Minitab 19, one of the most popular statistics packages for quality management, was used to draw control charts.
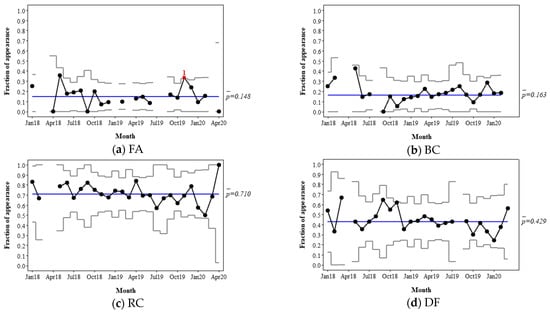
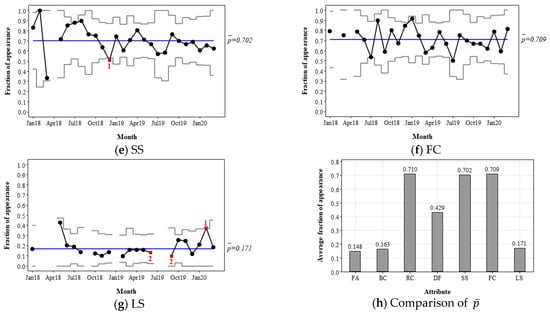
Figure 5.
Review-based p-chart for Hotel A. The red squares and the numbers below them indicate the existence of special-cause variation and the corresponding rule number, respectively. The rule numbers 1 and 2 indicate an out-of-control subgroup and a long-term bias, respectively.
The CL of the p-charts shows the average fraction of appearance of each attribute, and the UCL and LCL ±3 standard deviations off the average represent the range of expected variation. The p-charts can show the importance of an attribute from the customers’ viewpoint and whether any special-cause variations exist in the importance level of the attribute, such as a temporary aberration, a shift or trend in the average, or an increase or a decrease in the standard deviation. The four rules in Table 4 were applied to determine the special-cause variations. In Figure 5, such points of special-cause variations are represented as red squares, the number below which indicates the corresponding rule from 1–4 (i.e., out-of-control, prolonged bias, rising or falling trend, and oscillation).
For instance, the p-chart for attribute FA in Figure 5a shows that the mean appearance fraction of FA is 0.148, which implies that 14.8% of customers mentioned FA on average. The appearance fraction was stable for most of the time, except in November 2019, when the fraction was temporarily above the UCL. Such an increased appearance indicates that comments on FA (either compliments, complaints, or neutral comments) increased because of special cause(s) in that month. This phenomenon can be attributed to several potential root causes: quality issues (e.g., breakdown), changes in the attributes themselves (e.g., new furniture and appliances), temporal changes in the proportion of customer types (single, couple, family, etc.), customers having different preferences, and so on. Further investigation of the reviews of the month can help determine specific assignable root cause(s). FA’s g-chart statistics for the month can also be checked to quickly identify whether the special-cause variation relates to quality issues or increased complaints.
The p-chart of SS in Figure 5e shows the opposite case, where the appearance fraction dropped below the LCL. This indicates that the SS attribute was not very impressive. However, this can be a good sign of fewer complaints. Alternatively, thus may have been a result of the customers of the month being different from those of other months; the former customers may have assigned a lower importance to SS. The user can identify the root cause(s) through further analysis of the content of the reviews and establish an appropriate strategy.
The CLs of the p-charts can be a useful measure of attribute importance. As shown in Figure 5h, the average appearance fraction, , varies significantly between attributes. The chart indicates that RC, FC, and SS are the most frequently mentioned attributes in the market; DF is in the middle, followed by LS, BC, and FA in sequence.
4.2.2. Bottom Level: g-Chart
Figure 6 shows the review-based g-charts for performance monitoring drawn for Hotel A. To exclude the influence of attribute importance and support the apples-to-apples comparison of the attributes, the g-charts consider only the reviews that mention each attribute and plot complaint intervals, that is, the number of non-negative reviews between two consecutive negative reviews. The complaint interval can be a measure of attribute performance.
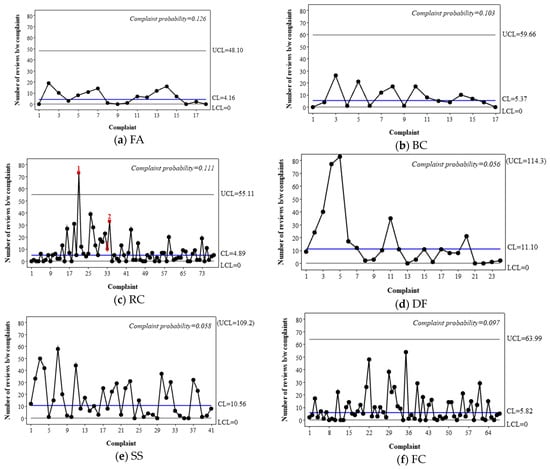
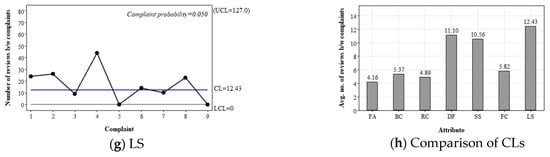
Figure 6.
Review-based g-chart for Hotel A. The red squares and the numbers below them indicate the existence of special-cause variation and the corresponding rule number, respectively. The rule numbers 1 and 2 indicate an out-of-control subgroup and a long-term bias, respectively.
In the proposed g-chart, the CL represents the median estimate of the complaint interval, while the UCL and LCL represent the expected range of complaint intervals under common-cause variations only. Plots above the UCL and those in a row above the CL are regarded as positive signals of decreased complaints or improved performance. For instance, Figure 6c reveals that there were special-cause variations in the performance of room condition, leading to an increased level for a certain period. Identifying the assignable root cause(s) responsible for this variation can offer valuable insights for quality enhancement, such as the factors that contribute to customer satisfaction with RC. In the case of Figure 6c, reviews during that period frequently mentioned the antique atmosphere and cleanliness of the rooms. Notably, there were fewer complaints regarding cleanliness compared to other periods.
A benefit of the proposed g-chart is that it enables the comparison of the performance of multiple attributes using CLs. For example, the CL of RC is 4.89, which implies that the median interval between two complaints is 4.89 reviews; in other words, complaints appear every 4.89 reviews on average. On the other hand, the CL of DF is 11.10, implying that complaints appear every 12.10 reviews on average. Thus, DF shows a better performance than RC with respect to the complaint level. Figure 6h compares the CL values of the seven attributes. It reveals that the performances of LS, DF, and SS were relatively high, whereas those of FC, BC, RC, and FA were relatively low.
4.3. DIPA for Hotel A
Although the BLCCs in Figure 5 and Figure 6 are useful in abstracting the overall history of an attribute, they are limited in their ability to reveal trends over time and predict the future status. Staged control charts can be a better solution for extracting changes over time.
For instance, Figure 7 shows two staged charts for DF, in which stages are defined based on the review year (2018, 2019, and 2020). The staged p-chart in Figure 7a shows that the mean appearance frequency gradually decreased from 0.481 in 2018 to 0.358 in 2020 (the first quarter only). This implies that customers’ interest in or the importance afforded to DF decreases over time. The staged g-chart in Figure 7b shows that the median complaint interval of DF decreased from 34.2 in 2018 through 10.0 in 2019 to 3.7 in 2020. This indicates that the complaint rate increased or the performance level decreased over time.
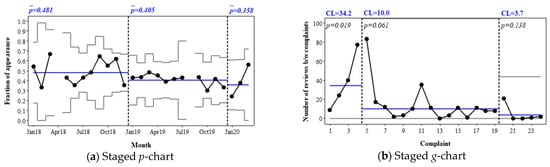
Figure 7.
Examples of staged control charts for the DF attribute of Hotel A.
As shown in the DF example, the CLs of an attribute’s staged p- and g-charts (i.e., CLpi,s and CLgi,s, respectively) can be an indicator of the attribute’s average importance and performance, respectively. By tracking how the CL values change over the stages through DIPA, it is possible to identify which attributes require urgent action to reduce complaints.
The proposed DIPA generates a two-dimensional graph in which the importance and performance levels are represented on the y- and x-axes, respectively. The importance and performance index values for the individual attributes of Hotel A are listed in Table 9 and Table 10, respectively. In addition, two boundary values are required to divide the low and high levels of importance and performance. In many IPA studies (e.g., [1,4,31,33,34,63]), a commonly accepted way to set the boundary values is to use the average values of all points on the charts. For this case study, the boundary values were set at 0.4310 for the importance index and 0.8654 for the performance index, based on the average values of all points on the charts.
Table 9.
Importance index values used in the DIPA for Hotel A.
Table 10.
Performance index values used in the DIPA for Hotel A.
Figure 8 shows the final graph of the proposed DIPA. The DIPA classifies attributes into four groups and identifies attributes with a greater need for quality improvement. The attributes in Q2 require the most attention and urgent improvement. In the case of Hotel A, the DIPA suggests that FC and RC require greater efforts to reduce complaints. They are frequently mentioned in customer reviews, but their performance levels are relatively low compared to those of other attributes. The DIPA also cautions that the performance levels of DF, BC, and FA are decreasing significantly. Although immediate actions may not be required because of their low importance, further investigation of the root causes behind the performance drops is recommended.
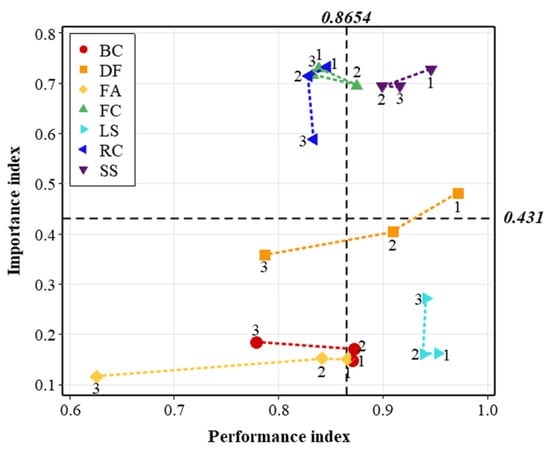
Figure 8.
DIPA for Hotel A. The numbers 1–3 above each data plot refer to the stage of the corresponding control chart.
5. Discussion
The BLCC combined with DIPA is a novel tool for monitoring and analyzing customer complaints through online customer reviews. It assists in observing how customer opinions change over time at the attribute level. Further, it enables us to grasp the average levels of attribute importance and performance in a certain period and to identify whether any special-cause variations have occurred; if special-cause variations exist, the tool also indicates the type(s) of variations. Using the new tool, one can easily identify any significant changes to the level and content of customer complaints. It is also possible to discern whether the changes are a natural event, a temporal aberration, or a gradual trend so that appropriate plans for quality management can be established.
Although several review-based control charts exist, the proposed method differs from existing ones in several ways. First, the proposed method converts a corpus of reviews into two types of control charts, separately visualizing attribute importance and performance. Such a separation of importance and performance facilitates highly accurate apples-to-apples comparison of quality levels among multiple attributes. This allows for identifying the main reasons for customer complaints and highlighting attributes in urgent need for improvement. Resources can be allocated accordingly for improving the attributes with high importance but low performance.
Second, the proposed approach is generally applicable and less susceptible to the uncontrollable and inconsistent nature of online customer reviews. This means that the current method aligns well with the natural characteristics of online customer reviews. To create a p-chart, the number of reviews must meet the minimum subgroup size requirements, which increase as the value of p decreases (i.e., 3/pit and 3/(1 − pit)). If a review subgroup fails to meet these requirements, it is excluded from the chart, resulting in unavoidable data loss.
Table 11 compares the data loss of the proposed method with that of previous review-based p-charts. Previous methods monitor the fraction of complaints for each attribute directly, leading to small p values and a high probability of data loss. In contrast, the proposed method considers attribute importance and performance separately, with the p-chart at the top level monitoring the fraction of attribute appearance, which is naturally greater than the fraction of complaints. Consequently, the chance of data loss is reduced. Moreover, even in cases where there is insufficient data to generate p-charts at the top level, g-charts at the bottom level remain applicable. This implies that performance monitoring is possible in most situations, regardless of the amount of data available.
Table 11.
Comparison of data loss (%) between the previous and the proposed methods.
In this case study, an average of 43% of the data was lost when using previous methods due to inadequate review subgroups. In contrast, the proposed method was more effective, with only 15% of data lost at the top level and no data loss at the bottom level.
Third, the proposed method is customizable and expandible depending on the situation. The UCL and LCL can be adjusted (narrowed or widened) according to the user’s requirements; additional lines that show the limits for specifications can be used to monitor whether the current quality level is satisfiable.
Fourth, by showing how the average of and variation in attribute importance and performance change over time, the proposed method enables not only the monitoring of the level of complaints, but also the prediction of the average in the near future. This enables a proactive approach to quality management by planning ahead of time and deciding how to reduce and respond to complaints in the future.
Fifth, the DIPA of the proposed approach provides an abstraction of multiple attribute-level control charts. Unlike previous approaches, which resulted in the creation of a number of review-based control charts, the current approach can assist in summarizing multiple control charts via a single IPA chart. Such an abstraction ability is particularly valuable when comparing temporal changes in multiple attributes and prioritizing them for improvement.
Lastly, the BLCC and DIPA facilitate a fair comparison of multiple products. Comparing the g-chart statistics of a product with those of its competitors can reveal its strengths and weaknesses. Comparing the DIPA results allows for an understanding of how customers perceive products differently. For example, Figure 9 illustrates the DIPA outcome of Hotel B, a four-star hotel in Seoul, Korea. The DIPA of Hotel B differs from that of Hotel A in some ways. Specifically, the attributes FC and DF are of relatively less importance in Hotel B, unlike in Hotel A. On the other hand, the attribute FA gains more importance in Hotel B compared to Hotel A.
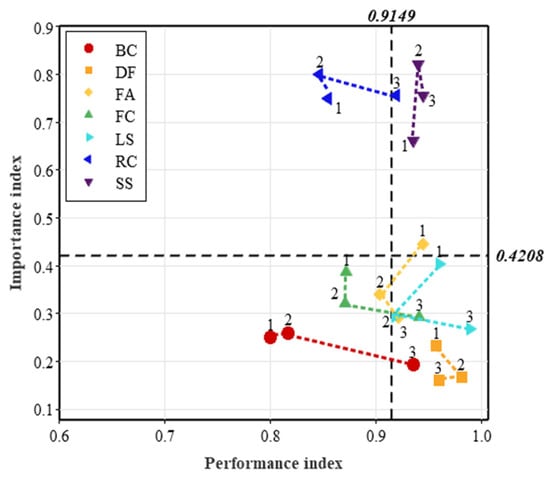
Figure 9.
DIPA for Hotel B (four-star hotel in Seoul). The numbers 1–3 above each data plot refer to the stage of the corresponding control chart.
In terms of attribute performance, Hotel B appears to outperform Hotel A in all attributes, indicating a lower level of complaints. However, in this case, it does not necessarily mean that the absolute attribute quality of Hotel B is better than that of Hotel A, as their star ratings are different. Customers may have distinct quality expectations for 4-star and 5-star hotels. Thus, the result should be interpreted as Hotel B better meeting the quality expectations of customers than Hotel A.
Whether online reviews can represent the opinions of all customers is a controversial topic. However, it is generally accepted that customer review analytics and derivatives can be an effective complement or alternative to conventional approaches using customer surveys or questionnaires. Similarly, the BLCCs with DIPA proposed in this article are expected to contribute to the literature and practices of quality management as a cost-effective real-time technique for automated complaint analysis.
6. Conclusions
This article proposes the use of BLCCs with DIPA as a novel technique for monitoring customer complaints utilizing online customer reviews. The primary objective of the BLCCs is to extract the importance and performance of attributes separately from customer reviews and to plot them in a two-level control chart. The BLCCs are review-based control charts that are less susceptible to the natural characteristics of online reviews and have a broader range of applications than existing methods. Due to their applicability even with a relatively small number of reviews, they can be employed by small private shops as well as large enterprises. The DIPA is introduced as a new tool for conducting IPA based on BLCCs. By providing a comprehensive view of multiple BLCCs through a single chart, the DIPA reveals changes in the average levels of importance and performance of each attribute over time. This information is valuable in prioritizing multiple attributes for improvement and establishing quality management strategies.
The main contribution of the proposed method is that it provides an integrated analysis framework linking statistical control charts with customer review analytics. The techniques utilized for extracting attributes and conducting sentiment analysis were not addressed in the present study, as the advancement of sentiment analysis techniques is left beyond the scope of this article. However, their performance is crucial for the success of review-based control charts, and it is worth noting that the proposed approach can perform even better with the availability of more advanced natural language processing (NLP) techniques. For example, the present lexicon-based approach for Korean reviews could be replaced with a deep learning-based or a machine learning-based approach if proven more effective. The inclusion of the intensity or strength of sentiments is also worth considering.
Another intriguing research topic for future studies is the reflection of linguistic diversity and the detection of emerging attributes. To adapt the proposed framework to different languages, future research should incorporate sentiment analysis for multiple languages. Furthermore, a language’s lexicon is continuously evolving, with new words and meanings being added over time. As such, updating and upgrading attribute lexicons is crucial for the success of the proposed method, and more research is needed in this area.
One limitation of control charts is that they are only able to classify the types of variations, without providing information on the underlying causes or reasons. Therefore, it is impossible to determine the specific factors contributing to changes in appearance frequency or complaint levels. To identify these root causes, a more detailed investigation of corresponding reviews is necessary. In this regard, combining BLCCs with topic modeling could be a promising avenue for future research.
Further research is necessary to incorporate competitors into the analysis to achieve a more accurate diagnosis of attribute importance and performance. Comparing products with their competitors in the market is recommended. As a potential method for future studies, it is suggested to establish the baseline values of DIPA at the market level by considering competitors’ attribute importance and performance. This can help understand the company’s competitiveness in the market and identify opportunities for differentiation from competitors, enabling more informed quality improvement decisions.
Additionally, future research can consider extending the current BLCCs, which focus on a single attribute of a single product, to a multivariate control chart. This would provide opportunities for large-scale analyses and a broader range of applications, including quality management at the franchise, brand, and industry levels.
Author Contributions
Conceptualization, S.K. and M.K.; methodology, S.K. and M.K.; software, S.K.; formal analysis, S.K. and M.K.; investigation, M.K.; resources, M.K.; data curation, S.K.; writing—original draft preparation, S.K. and M.K.; writing—review and editing, M.K.; visualization, S.K. and M.K.; supervision, M.K.; project administration, M.K.; funding acquisition, M.K. All authors have read and agreed to the published version of the manuscript.
Funding
This work was partially supported by the National Research Foundation of Korea (NRF) grant funded by the Korea government (Ministry of Science and ICT) (No. NRF-2019R1F1A1041099).
Institutional Review Board Statement
Not applicable.
Informed Consent Statement
Not applicable.
Data Availability Statement
The data that support the findings of this study are available from the corresponding author, [M.K.], upon reasonable request.
Conflicts of Interest
The authors declare no conflict of interest. The funders had no role in the design of the study; in the collection, analyses, or interpretation of data; in the writing of the manuscript; or in the decision to publish the results.
Abbreviations
The following abbreviations are used in this manuscript (listed in alphabetical order):
| BLCC | Bi-level control chart |
| CL | Center line |
| DIPA | Dynamic importance performance analysis |
| EWMA | Exponentially weighted moving average |
| IPA | Importance performance analysis |
| LCL | Lower control limit |
| LDA | Latent Dirichlet allocation |
| LSA | Latent semantic analysis |
| ML | Machine learning |
| NLP | Natural language processing |
| SRJST | Sequential reverse joint sentiment-topic |
| SVM | Support vector machine |
| TF-IDF | Term frequency–inverse document frequency |
| TSP | Time series plot |
| UCL | Upper control limit |
Appendix A
Table A1.
Summary of the general characteristics of p-charts and g-charts used in the BLCC.
Table A1.
Summary of the general characteristics of p-charts and g-charts used in the BLCC.
| p-Chart | g-Chart | |
|---|---|---|
| Appropriate use case | A process has dichotomous outcomes (e.g., conforming or nonconforming, happening or non-happening). | A process has rare events or a low defect level. |
| Data type | Fraction | Count |
| Charting value | Subgroup fraction of an event (the ratio of the number of instances of a certain event to the total number of opportunities) | Total number of opportunities between two successive events. |
| Probability distribution | Binomial | Geometric |
| Minimum subgroup size | The subgroup size n should satisfy the following conditions (Benneyan, 2008): and , where p is the expected nonconforming subgroup fraction. | Not required. |
References
- Bi, J.W.; Liu, Y.; Fan, Z.P.; Zhang, J. Exploring asymmetric effects of attribute performance on customer satisfaction in the hotel industry. Tour. Manag. 2020, 77, 104006. [Google Scholar] [CrossRef]
- Jin, J.; Liu, Y.; Ji, P.; Liu, H. Understanding big consumer opinion data for market-driven product design. Int. J. Prod. Res. 2016, 54, 3019–3041. [Google Scholar] [CrossRef]
- Bag, S.; Tiwari, M.K.; Chan, F.T. Predicting the consumer’s purchase intention of durable goods: An attribute-level analysis. J. Bus. Res. 2019, 94, 408–419. [Google Scholar] [CrossRef]
- Xiao, S.; Wei, C.P.; Dong, M. Crowd intelligence: Analyzing online product reviews for preference measurement. Inf. Manag. 2016, 53, 169–182. [Google Scholar] [CrossRef]
- Zhang, K.Z.K.; Zhao, S.J.; Cheung, C.M.K.; Lee, M.K.O. Examining the influence of online reviews on consumers’ decision-making: A heuristic–systematic model. Decis. Support Syst. 2014, 67, 78–89. [Google Scholar] [CrossRef]
- He, W.; Tian, X.; Hung, A.; Akula, V.; Zhang, W. Measuring and comparing service quality metrics through social media analytics: A case study. Inf. Syst. e-Bus. Manag. 2017, 16, 579–600. [Google Scholar] [CrossRef]
- Vencovský, F. Service Quality Evaluation Using Text Mining: A Systematic Literature Review. In Proceedings of the International Conference on Business Informatics Research, Vienna, Austria, 21–23 September 2020; pp. 159–173. [Google Scholar]
- Kaur, G.; Sharma, A. A deep learning-based model using hybrid feature extraction approach for consumer sentiment analysis. J. Big Data 2023, 10, 5. [Google Scholar] [CrossRef] [PubMed]
- Xu, K.; Liao, S.S.; Li, J.; Song, Y. Mining comparative opinions from customer reviews for competitive intelligence. Decis. Support Syst. 2011, 50, 743–754. [Google Scholar] [CrossRef]
- Kim, J.; Lim, C. Customer complaints monitoring with customer review data analytics: An integrated method of sentiment and statistical process control analyses. Adv. Eng. Inform. 2021, 49, 101304. [Google Scholar] [CrossRef]
- Lo, S. Web service quality control based on text mining using support vector machine. Expert Syst. Appl. 2008, 34, 603–610. [Google Scholar] [CrossRef]
- Kim, S.; Park, S.; Kwak, M. Review-based control charts for service quality monitoring: A brief review and future directions. ICIC Express Lett. 2021, 12, 707–714. [Google Scholar] [CrossRef]
- Martilla, J.A.; James, J.C. Importance-performance analysis. J. Mark. 1977, 41, 77–79. [Google Scholar] [CrossRef]
- Hou, T.; Yannou, B.; Leroy, Y.; Poirson, E. Mining customer product reviews for product development: A summarization process. Expert Syst. Appl. 2019, 132, 141–150. [Google Scholar] [CrossRef]
- Khan, K.; Baharudin, B.; Khan, A.; Ullah, A. Mining opinion components from unstructured reviews: A review. J. King Saud Univ. Comput. Inf. 2014, 26, 258–275. [Google Scholar] [CrossRef]
- Tucker, C.S.; Kim, H.M. Trend mining for predictive product design. J. Mech. Des. 2011, 133, 111008. [Google Scholar] [CrossRef]
- Min, H.; Yun, J.; Geum, Y. Analyzing Dynamic Change in Customer Requirements: An Approach Using Review-Based Kano Analysis. Sustainability 2018, 10, 746. [Google Scholar] [CrossRef]
- Chang, Y.C.; Ku, C.H.; Chen, C.H. Social media analytics: Extracting and visualizing Hilton hotel ratings and reviews from TripAdvisor. Int. J. Inf. Manag. 2019, 48, 263–279. [Google Scholar] [CrossRef]
- Joung, J.; Kim, K.H.; Kim, K. Data-Driven Approach to dual service failure monitoring from negative online reviews: Managerial perspective. SAGE Open 2021, 11, 1–14. [Google Scholar] [CrossRef]
- Ashton, T.; Evangelopoulos, N.; Prybutok, V.R. Exponentially weighted moving average control charts for monitoring customer service quality comments. Int. J. Serv. Stand. 2013, 8, 230–246. [Google Scholar] [CrossRef]
- Ashton, T.; Evangelopoulos, N.; Prybutok, V.R. Quantitative quality control from qualitative data: Control charts with latent semantic analysis. Qual. Quant. 2014, 49, 1081–1099. [Google Scholar] [CrossRef]
- Liang, Q.; Wang, K. Monitoring of user-generated reviews via a sequential reverse joint sentiment-topic model. Qual. Reliab. Eng. Int. 2019, 35, 1180–1199. [Google Scholar] [CrossRef]
- George, M.L.; Maxey, J.; Rowlands, D.T.; Upton, M. Lean Six Sigma Pocket Toolbook; McGraw-Hill Professional Publishing: New York, NY, USA, 2004. [Google Scholar]
- Montgomery, D.C. Introduction to Statistical Quality Control, 6th ed.; John Wiley & Sons: Hoboken, NJ, USA, 2009. [Google Scholar]
- Joung, J.; Kim, H.M. Approach for Importance–Performance Analysis of Product Attributes From Online Reviews. J. Mech. Des. 2021, 143, 081705. [Google Scholar] [CrossRef]
- Wu, J.; Wang, Y.; Zhang, R.; Cai, J. An Approach to Discovering Product/Service Improvement Priorities: Using Dynamic Importance-Performance Analysis. Sustainability 2018, 10, 3564. [Google Scholar] [CrossRef]
- Wang, D.; Xiang, Z.; Law, R.; Ki, T.P. Assessing Hotel-Related Smartphone Apps Using Online Reviews. J. Hosp. Mark. Manag. 2016, 25, 291–313. [Google Scholar] [CrossRef]
- Nam, S.; Lee, H.C. A Text Analytics-Based Importance Performance Analysis and Its Application to Airline Service. Sustainability 2019, 11, 6153. [Google Scholar] [CrossRef]
- Jeong, B.; Yoon, J.; Lee, J.M. Social media mining for product planning: A product opportunity mining approach based on topic modeling and sentiment analysis. Int. J. Inf. Manag. 2019, 48, 280–290. [Google Scholar] [CrossRef]
- Park, C.; Choi, K.H.; Lee, C.; Lim, S. Korean coreference resolution with guided mention pair model using deep learning. Etri. J. 2016, 38, 1207–1217. [Google Scholar] [CrossRef]
- Liu, X.; Zhang, N. Research on Customer Satisfaction of Budget Hotels Based on Revised IPA and Online Reviews. Sci. J. Bus. Manag. 2020, 8, 50. [Google Scholar] [CrossRef]
- Wang, A.; Zhang, Q.; Zhao, S.; Lu, X.; Peng, Z. A review-driven customer preference measurement model for product improvement: Sentiment-based importance–performance analysis. Inf. Syst. e-Bus. Manag. 2020, 18, 61–88. [Google Scholar] [CrossRef]
- Chen, Y.; Zhong, Y.; Yu, S.; Xiao, Y.; Chen, S. Exploring bidirectional performance of hotel attributes through online reviews based on sentiment analysis and Kano-IPA model. Appl. Sci. 2022, 12, 692. [Google Scholar] [CrossRef]
- Wang, Z.; Jie, H.; Fu, H.; Wang, L.; Jiang, H.; Ding, L.; Chen, Y. A social-media-based improvement index for urban renewal. Ecol. Indic. 2022, 137, 108775. [Google Scholar] [CrossRef]
- Bi, J.W.; Liu, Y.; Fan, Z.P.; Zhang, J. Wisdom of crowds: Conducting importance-performance analysis (IPA) through online reviews. Tour. Manag. 2019, 70, 460–478. [Google Scholar] [CrossRef]
- Angelov, D. Top2vec: Distributed representations of topics. arXiv 2020, arXiv:2008.09470. [Google Scholar]
- Asghar, M.Z.; Khan, A.; Ahmad, S.; Kundi, F.M. A review of feature extraction in sentiment analysis. Int. J. Basic Appl. Sci. Res. 2014, 4, 181–186. [Google Scholar]
- Chong, Y.T.; Chen, C.H. Management and forecast of dynamic customer needs: An artificial immune and neural system approach. Adv. Eng. Inform. 2010, 24, 96–106. [Google Scholar] [CrossRef]
- Grootendorst, M. BERTopic: Neural topic modeling with a class-based TF-IDF procedure. arXiv 2022, arXiv:2203.05794. [Google Scholar]
- Hu, Y.; Ding, J.; Dou, Z.; Chang, H. Short-text classification detector: A bert-based mental approach. Comput. Intell. Neurosci. 2022, 2022, 8660828. [Google Scholar] [CrossRef]
- Vencovsky, F.; Lucas, B.; Mahr, D.; Lemmink, J. Comparison of text mining techniques for service aspect extraction. In Proceedings of the 4th European Conference on Social Media (ECSM), Vilnius, Lithuania, 3–4 July 2017; pp. 297–307. [Google Scholar]
- Wang, T.; Cai, Y.; Leung, H.F.; Lau, R.Y.; Li, Q.; Min, H. Product aspect extraction supervised with online domain knowledge. Knowl. Based Syst. 2014, 71, 86–100. [Google Scholar] [CrossRef]
- Medhat, W.; Hassan, A.; Korashy, H. Sentiment analysis algorithms and applications: A survey. Ain Shams Eng. J. 2014, 5, 1093–1113. [Google Scholar] [CrossRef]
- Taboada, M.; Brooke, J.; Tofiloski, M.; Voll, K.; Stede, M. Lexicon-based methods for sentiment analysis. CompLing 2011, 37, 267–307. [Google Scholar] [CrossRef]
- Usama, M.; Ahmad, B.; Song, E.; Hossain, M.S.; Alrashoud, M.; Muhammad, G. Attention-based sentiment analysis using convolutional and recurrent neural network. Future Gener. Comput. Syst. 2020, 113, 571–578. [Google Scholar] [CrossRef]
- Wang, J.; Xu, B.; Zu, Y. Deep learning for aspect-based sentiment analysis. In Proceedings of the 2021 International Conference on Machine Learning and Intelligent Systems Engineering (MLISE), Chongqing, China, 9–11 July 2021; pp. 267–271. [Google Scholar]
- Benneyan, J.C. Performance of number-between g-type statistical control charts for monitoring adverse events. Health Care Manag. Sci. 2001, 4, 319–336. [Google Scholar] [CrossRef]
- Kaminsky, F.C.; Benneyan, J.C.; Davis, R.D.; Burke, R.J. Statistical control charts based on a geometric distribution. J. Qual. Technol. 1992, 24, 63–69. [Google Scholar] [CrossRef]
- Minitab, S. Select Tests for Special Causes for p Chart. Available online: https://support.minitab.com/ko-kr/minitab/21/help-and-how-to/quality-and-process-improvement/control-charts/how-to/attributes-charts/p-chart/perform-the-analysis/p-chart-options/select-tests-for-special-causes/ (accessed on 21 February 2023).
- Nelson, L.S. The Shewhart control chart—Tests for special causes. J. Qual. Technol. 1984, 16, 237–239. [Google Scholar] [CrossRef]
- Benneyan, J.C. Number-between g-type statistical quality control charts for monitoring adverse events. Health Care Manag. Sci. 2001, 4, 305–318. [Google Scholar] [CrossRef] [PubMed]
- Lee, S. Minitab Quality Control, 1st ed.; Park, J., Ed.; Eretec: Seoul, Republic of Korea, 2018. [Google Scholar]
- Minitab, S. Data Considerations for g Chart. Available online: https://support.minitab.com/en-us/minitab/19/help-and-how-to/quality-and-process-improvement/control-charts/how-to/rare-event-charts/g-chart/before-you-start/data-considerations/ (accessed on 21 February 2023).
- Minitab, S. Select Tests for Special Causes for g Chart. Available online: https://support.minitab.com/en-us/minitab/19/help-and-how-to/quality-and-process-improvement/control-charts/how-to/rare-event-charts/g-chart/perform-the-analysis/g-options/select-tests-for-special-causes/ (accessed on 21 February 2023).
- Lee, S.; Park, S.; Kwak, M. Revealing the dual importance and Kano type of attributes through customer review analytics. Adv. Eng. Inform. 2022, 51, 101533. [Google Scholar] [CrossRef]
- Naldi, M.; Petroni, S. A Testset-Based Method to Analyse the Negation-Detection Performance of Lexicon-Based Sentiment Analysis Tools. Computers 2023, 12, 18. [Google Scholar] [CrossRef]
- Sadia, A.; Khan, F.; Bashir, F. An overview of lexicon-based approach for sentiment analysis. In Proceedings of the 2018 3rd International Electrical Engineering Conference (IEEC 2018), Karachi, Pakistan, 21–22 December 2018; pp. 1–6. [Google Scholar]
- Sánchez-Rada, J.F.; Iglesias, C.A. Social context in sentiment analysis: Formal definition, overview of current trends and framework for comparison. Inf. Fusion 2019, 52, 344–356. [Google Scholar] [CrossRef]
- Araque, O.; Corcuera-Platas, I.; Sánchez-Rada, J.F.; Iglesias, C.A. Enhancing deep learning sentiment analysis with ensemble techniques in social applications. Expert Syst. Appl. 2017, 77, 236–246. [Google Scholar] [CrossRef]
- Sanagar, S.; Gupta, D. Unsupervised genre-based multidomain sentiment lexicon learning using corpus-generated polarity seed words. IEEE Access 2020, 8, 118050–118071. [Google Scholar] [CrossRef]
- Park, S.M.; Na, C.W.; Choi, M.S.; Lee, D.H.; On, B.W. KNU Korean sentiment lexicon: Bi-LSTM-based method for building a Korean sentiment lexicon. J. Intell. Inf. Syst. 2018, 24, 219–240. [Google Scholar]
- Lingua72. Korean Analyzer Rhino. Available online: https://sourceforge.net/projects/koreananalyzer/ (accessed on 21 April 2023).
- Ferreira, H.P.; Fernandes, P.O. Importance-performance analysis applied to a laboratory supplies and equipment company. Procedia Comput. Sci. 2015, 64, 824–831. [Google Scholar] [CrossRef]
Disclaimer/Publisher’s Note: The statements, opinions and data contained in all publications are solely those of the individual author(s) and contributor(s) and not of MDPI and/or the editor(s). MDPI and/or the editor(s) disclaim responsibility for any injury to people or property resulting from any ideas, methods, instructions or products referred to in the content. |
© 2023 by the authors. Licensee MDPI, Basel, Switzerland. This article is an open access article distributed under the terms and conditions of the Creative Commons Attribution (CC BY) license (https://creativecommons.org/licenses/by/4.0/).