Abstract
With the accelerating penetration of photovoltaics (PVs) and electric vehicles (EVs), distribution networks face the risks of voltage violations and fluctuations. On the one hand, conventional voltage regulation resources like OLTC transformers and capacitor banks feature slow response and limited lifetime duration, making them incapable of quickly responding to the temporary voltage issues created by PVs and EVs. On the other hand, EVs and PVs interact with the power grid via fully controllable power electronic converters capable of real-time adjusting their operating settings, making them ideal voltage support resources. To exploit the voltage support capability of PVs and EVs, this paper proposes a two-stage control scheme for the voltage regulation of distribution networks, consisting of the day-ahead and intraday control stages. The day-ahead control mitigates potential voltage violations via day-ahead scheduling of the operation settings for OLTC transformers and capacitor banks. The intraday control further alleviates voltage deviations and voltage fluctuations based on the reactive power support of PV systems and the rational EV charging/discharging scheduling. A rolling optimization-based control technique is proposed in the intraday control stage to achieve real-time control of EVs and PVs with the stochastic nature of EV charging behaviors inherently considered. The proposed two-stage voltage regulation scheme is validated via case studies performed on the IEEE 123-node test feeder integrated with PVs and EVs.
1. Introduction
With the progress of global decarbonization, distributed photovoltaics (PVs) and electric vehicles (EVs) are increasing their penetration into the power grid. According to the data disclosed by International Energy Agency (as in Figure 1), an exponential increase in the EV stock was seen in the past decade, and the global EV stock reached 11.27 million by 2020, with the dominant EV application belonging to light-duty passenger vehicles [1]. For the worldwide expansion of solar PVs, a steady increase was seen in the installed capacity of solar PVs, which was close to 900 GW by 2020 [2]. Although the high surge in the grid penetration of EVs and PVs is beneficial to the decarbonization of power supply and transportation sectors, the uncertainties of PV power generation and the stochastic EV charging behaviors further deteriorate the supply voltage quality, resulting in issues like voltage violations, voltage fluctuation, etc. The traditional voltage regulation of distribution networks is achieved with OLTC transformers and switchable capacitor banks (CBs). As OLTC transformers and CBs are characterized by inherent drawbacks in discrete voltage control and slow response, they are not capable of mitigating the voltage deviation and voltage fluctuation issues of distribution networks with high penetrations of EVs and PVs. By contrast, PVs and EVs are connected to the distribution networks via fully controllable power electronic converters, making them supplementary voltage support resources. The application of EVs and PVs for grid voltage support has been widely investigated in the existing literature.
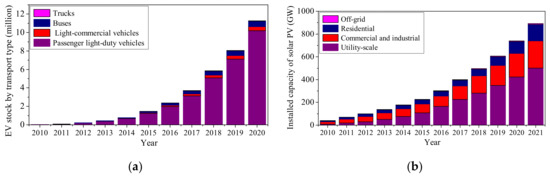
Figure 1.
The global growth of EVs and PVs in the last decade: (a) The EV stocks by transport types; (b) The installed capacity of solar PVs with different application purposes.
Conventionally, the distribution network voltage regulation is in the charge of the local distribution network operator (DNO) and is conducted in a centralized way with the operational settings of OLTC transformers and SCBs globally optimized. To make EVs and PVs get involved in the voltage regulation of distribution networks, both system-level optimal scheduling of EVs and PVs and device-level control of EV chargers and PV inverters are required, as illustrated in Figure 2. For system-level control, the optimal coordination schemes of EVs, PVs, and conventional voltage control devices have to be defined under the operational constraints of all available voltage support resources and the power grid. For device-level control, the optimal operation modes and operation setting parameters have to be defined to meet the system-level voltage support requirements. Acting as the grid-interaction interfaces, EV chargers, and PV inverters receive the commands from the device-level controller and provide real-time voltage support for distribution networks. The voltage regulation mechanism and the main features of typical voltage support resources available in distribution networks with EVs and PVs are summarized in Table 1.
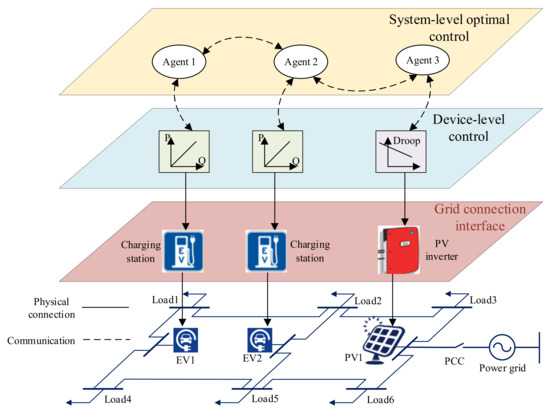
Figure 2.
The general control framework for participating EVs and PVs in the voltage regulation of distribution networks.

Table 1.
Characterization of the voltage support resources of distribution networks integrated with EVs and PVs.
Many studies have been carried out to investigate the distribution voltage regulation with the participation of EVs and PVs. Regarding the research on the participation of EVs in voltage regulation of the distribution network, ref. [3] carried out simulation modeling of a bidirectional onboard EV battery charge and investigated its capability of providing distribution voltage support. In [4], the impact of uncontrolled EV charging behaviors on the bus voltage profiles of distribution networks is evaluated via the Monte Carlo (MC) simulations, and a coordinated EV charging scheme based on bi-level dynamic game theory is proposed for alleviating the bus voltage deviation. Ref. [5], researchers designs a scheduling strategy for EV participation in the voltage regulation of a residential distribution network. The proposed scheduling strategy achieves the loss minimization and alleviation of bus voltage deviation simultaneously on the premise of satisfying the operational constraints of the substation transformer and sustaining competitive charging costs for EV owners. Ref. [6] describes a Volt-Var-Optimization-based EV charging scheduling scheme for the continuous bus voltage improvement of a distribution network with a high penetration of EVs and renewable energy sources (RESs). With the deepening of the research on the reactive power support capacity of the EV charger, the four-quadrant operation capability of EV chargers provides a new idea for the voltage regulation of the distribution network [7,8]. Most of the existing studies on the participation of EVs in distribution voltage regulation focus on developing the EV charging scheduling schemes without fully investigating the coordination potential of different types of voltage support resources (e.g., [9,10]) and the impact of EV transport types on the voltage support capability of EV fleets (e.g., [11,12]).
In terms of research on PV participation in distribution voltage regulation, refs. [13,14] dynamically adjust the voltage at the grid connection point based on PV inverters’ reactive power compensation capability. However, the reactive power compensation capability becomes restricted when the PV power generations are close to the power ratings of PV inverters. In [15,16], aiming at the power quality problem caused by the high-level penetration of PVs in the distribution network, semi-definite relaxation techniques and alternating direction method of multipliers are applied to optimize the reactive power outputs of the intelligent PV inverters to address the grid voltage deviation problem. Ref. [17] proposes a local voltage regulation technique that utilizes short-term PV power forecasts to circumvent potential bus voltage violations. In [18], an optimal coordination scheme between the active power curtailment and reactive power compensation is proposed for smart PV inverters to address the overvoltage issues. Among all the above studies, the voltage droop control is still the dominant voltage support approach for smart PV inverters, while the optimal operational settings of a droop controller can be achieved using a variety of optimization methods like machine learning [19], multi-time scale collaborative optimization [20], robust optimization [21] and stochastic optimization [22].
With respect to research on the coordination of EVs and PVs for distribution voltage regulation, an optimal reactive power support method of EVs and PVs is introduced to enhance the hosting capacity of distribution networks with EVs and PVs integrated [23]. Ref. [24] presents a decentralized voltage control algorithm that considers the active and reactive power control capability of both PVs and EVs. For rooftop PVs in industrial parks and EVs in residential areas, refs. [25,26] consider the V2G technology of EVs and propose a synergistic dispatch approach of EVs and PVs with the objective of minimizing the daily operating costs in PV-rich industrial parks. The direct integration of a PV system with an EV charging station (EVCS) as the solar PV-based EVCS is a possible way to accommodate more clean energy and alleviate peak charging load [27]. Ref. [28] proposes a distributed control strategy for solar PV-based EVCS to achieve optimal power allocation within the EVCS. In [29], the impact of the grid integration locations of PV-rich EVCSs on the performance of distribution voltage support is investigated. Ref. [30] proposes a coordination scheme between PV power generation and EV charging to alleviate voltage rise in feeders with PVs, using coordinated EV fleets as a virtual storage system.
To summarize, the voltage regulation methods applied to distribution networks with EVs and PVs connected can be generally categorized into four types, including local voltage control, centralized voltage control, distributed voltage control, and multi-time scale voltage control. Specifically, the local voltage control is generally in the form of the voltage droop control of smart PV inverters and EV chargers, which dynamically adjust their active or reactive power outputs based on the monitored terminal voltages [31,32]. This type of control is easy to implement, and no communication systems are required, although it cannot achieve the globally optimized voltage distribution patterns. The centralized voltage control relies on a dedicated communication system to collect information on the electrical operating conditions of all buses [33]. Afterward, the collected data will be sent to a centralized voltage controller, which determines the operation settings of all voltage support resources via optimal power flow analysis. Because the communication systems of low-voltage and medium-voltage distribution systems are still imperfect, it requires extensive investment in communication infrastructure to implement centralized voltage control for a medium-size or large-size distribution network with high penetrations of EVs and PVs. To overcome the drawbacks of centralized voltage control, distributed voltage control has attracted widespread attention from scholars. In distributed voltage control, the distribution network with EVs and PVs connected is first partitioned into several regions based on the similarity of bus voltage sensitivity. Then, regional voltage control is applied to each regional distribution network via the active and reactive power control of their member EVs and PVs [34,35]. As the integration of EVs and PV have a direct influence on the bus voltage sensitivity, the dynamic partition of distribution networks is required. As a modern distribution network is featured by the co-existence of diversified voltage support resources which respond at different time scales, multi-time-scale voltage regulation is required to achieve collaborative operation of those resources [36]. To make the most of various voltage support resources, dedicated coordinated control schemes are required. Finally, the advantages and disadvantages of all the above-mentioned distribution voltage regulation methods are summarized in Table 2.
Table 2.
Advantages and disadvantages of different types of distribution voltage regulation methods.
The limitations of the existing literature on the selected topic are summarized in the following. First, the current literature on EVs’ participation in distribution voltage regulation only considers snapshot operations of EV chargers. However, multiple time-step operations of EV chargers should be considered in the coordinated control strategy to ensure that the desired battery SoC of all EV owners is met. Second, most literature applied centralized control of EVs for their participation in distribution voltage regulation by assuming that the charging behaviors of all EV owners are known in advance within a predicted period. In practice, EV drivers’ willingness to charge can be affected by a variety of factors, including the charging price, the location of the EV charging station, and the planned mobility of EV drivers, etc., resulting in inherent randomness of EV charging behaviors. Third, the impact of EV transport type on the voltage support capability of aggregate EVs is rarely considered in the existing literature. Fourth, the current literature normally considers only one unique type of voltage support resource in the research on distribution voltage regulation, and the multi-time scale coordination potential among diversified voltage support resources is rarely investigated. To fill the research gaps in the current literature, a two-stage voltage control scheme is proposed in this paper, with the major contributions summarized below: (1) a multi-time scale coordination scheme is proposed for the collaborative operation of different types of voltage-support resources including OLTC transformers, CBs, EVs, and PVs; (2) a rolling optimization-based control scheme is proposed for the EV charging/discharging scheduling which adaptively adjusts the control period based on the states of EVs and EV chargers without having to foresee the EV charging demands; (3) the impact of EV transport type on the aggregate EV charging demands is investigated. The paper is organized as follows. It starts with the impact analysis of the grid penetrations of EVs and PVs, followed by a discussion of the grid voltage support capability of PV systems and the energy management scheme of EV charging. Later, a two-stage voltage regulation scheme is proposed for distribution networks having PVs and EVs connected, with its performance evaluated via comprehensive case studies performed on the IEEE 123-node test feeder.
2. Materials and Methods
2.1. Impact of EV and PV Penetration on the Votage Profiles of Distribution Networks
The typical configuration of a distribution network feeder having distributed EVs and PVs connected is illustrated in Figure 3. The voltage difference between adjacent buses can be represented by (1), indicating that the voltage difference is determined by the distribution cable impedance and the active and reactive powers flowing across the distribution cables. As EVs and PVs are mainly connected to LV distribution networks that are characterized by large resistance and relatively small reactance, (1) can be simplified as (2), indicating that the voltage difference between adjacent buses varies with the change of active and reactive power flows. By ignoring the power losses, the active and reactive power flowing from bus k−1 to bus k, Pk, and Qk, can be written as (3) and (4). Accordingly, the voltage profiles of distribution networks can be altered with the change of EV charging schemes and the fluctuating PV power outputs.
where Uk (V) is the terminal voltage of bus k, the active and reactive power flows from bus k−1 to bus k are represented by Pk (W) and Qk (Var), the distribution cable impedance between bus k−1 and bus k is represented by + , (W), (W), and (W) are the active powers of load, EV, and PV connected to bus k with the corresponding reactive powers represented by (Var), (Var), and (Var),and N is the last bus number of the feeder.
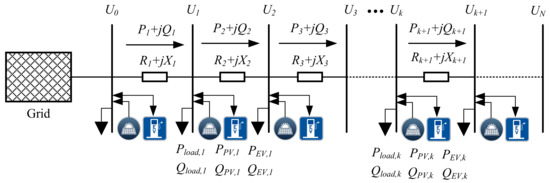
Figure 3.
The typical configuration of a distribution network feeder with EVs and PVs connected.
2.2. Grid Voltage Support Capability of PV Systems
2.2.1. Analysis of PV Generation Profiles
As the grid voltage support capability of PV systems is directly affected by the solar irradiance absorbed by the PV panel, it is necessary to investigate the PV generation profile with the environmental factors considered. Typically, daily solar irradiation follows a Beta distribution as represented by (5), while the power injected into the grid is represented by (6). It can be concluded that the operating power of the PV system almost linearly increases with the increasing solar irradiance, assuming the PV system is operating at its maximum power point. Due to the intermittent features of solar irradiation, the power output (and hence the grid voltage support capability) of the PV system will fluctuate with the varying weather conditions. Figure 4 illustrates the typical PV generation profiles of a PV system operating on a sunny day and a cloudy day.
where (W/m2) is the solar irradiance at time instance t while (W/m2) refers to its maximum value, and are the coefficients of the Beta distribution at time instance t, (W) is the active power injected into the grid at time instance t while its standard value is denoted (W), is the standard solar irradiance, and and refer to the photoelectric conversion efficiency and the efficiency of the PV inverter.
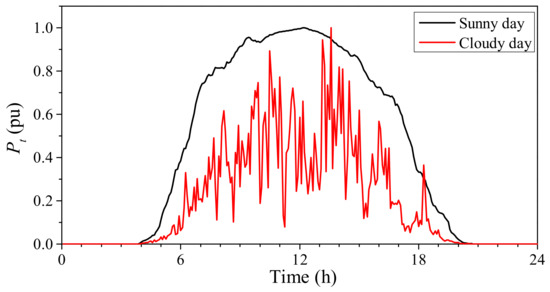
Figure 4.
Typical PV generation files under a sunny day and a cloudy day.
2.2.2. The Volt/VAr Control Scheme of PV Systems
PV systems are connected to distribution networks via power electronic converters, which can real-time monitor and control the current injected into the grid. By adequately adjusting the control circuits, PV inverters can provide a bidirectional reactive power exchange between the device and the distribution grid. This makes them ideal reactive power support resources for the voltage regulation of distribution networks. As PV operating power fluctuates with the varying solar irradiations absorbed by the PV panels and the operating power factor of PV systems has to be above a specific threshold value (e.g., 0.9), the reactive power control capability of a PV inverter at time instance t is determined by its operating power Pt, its minimum and maximum operating power Pmin, and Pmax and its minimum power factor pfmin (corresponds to a maximum phase angle difference between grid voltage and grid current, θmax). As illustrated in Figure 5, the maximum reactive power can be achieved when Pt equals Srcos(θmax) (denoted as Ps and Sr is the rated power of the PV system). When Pt is greater than Ps, the maximum achievable reactive power, Qmax,t, equals (illustrated by the yellow triangle in Figure 5). When Pt is less than Ps, the maximum reactive power equals Pttan(θmax) to ensure the power factor, pft, is no less than pfmin. To sum up, the maximum achievable reactive power at time instance t, Qmax,t, equals when Pt is within the range of [Pmin, Pmax]. Equivalently, the minimum power factor at time instance t, pfmin,t, equals .
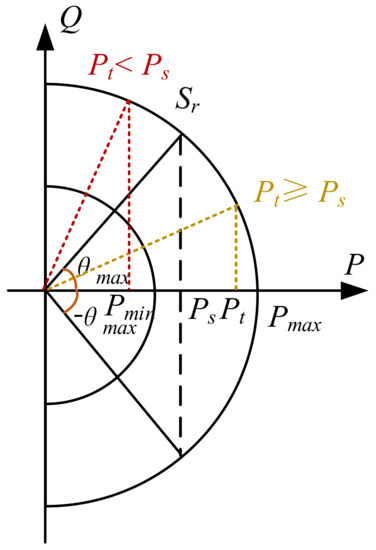
Figure 5.
The reactive power regulation range of PV inverters.
A voltage droop control is typically applied to establish the connection between the reactive power and the voltage of the grid integration point, as illustrated in Figure 6. To avoid the frequent voltage adjustment near the reference voltage, V0, a deadband for the voltage control (i.e., the region marked by D) is utilized. The overall voltage control can be divided into three regions depending on the grid-side voltage level of the PV system, Vt. When Vt is within the range of [V0 − D/2, V0 + D/2], the PV system operates at the unity power factor. When Vt is within the scope of [Vl, V0 − D/2] ∪ [Vu, V0 + D/2] (Vl and Vu are the lower and upper voltage limits declared by distribution network operators), the reactive power Qt varies linearly with the change of Vt. When Vt is below Vl or above Vu, the PV system operates at its maximum reactive power (and hence the lowest power factor). Accordingly, the mathematical representations of the voltage control schemes under the voltage droop control can be derived, as in (7).
where Qt refers to the reactive power of the PV system at time instance t, Qmax,t is the maximum reactive power that the PV system can provide, D is the control deadband, V0 and Vt are the per-unit nominal voltage and the grid-side supply voltage of a PV system at time instance t, and eps refers to the precision of floating numbers.
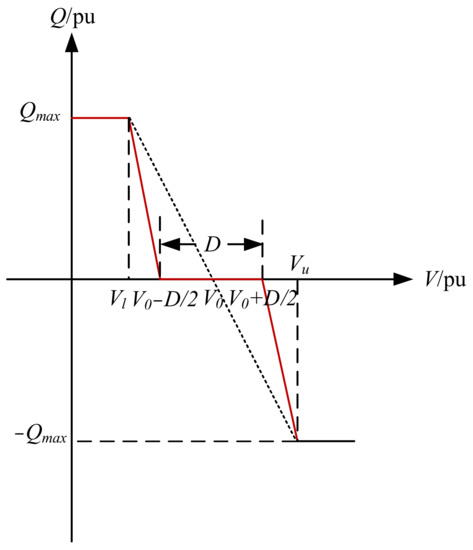
Figure 6.
Illustration of the voltage droop control applied to smart PV inverters.
2.3. Energy Management Schemes of EV Charging
2.3.1. Analysis of EV Charging Demands
To use EVs for grid voltage support, it is essential to investigate the spatiotemporal uncertainties of EV charging demands which are determined by the type of EVs, the initial EV battery, and the EV arrival time at and departure time from the charging station. Depending on vehicle application, EVs can be divided into four types: private cars, buses, taxis, and exclusively-used cars, resulting in diversified traveling patterns and hence the charging demands. According to the national household travel survey (NHTC) conducted by the US Department of Transportation, the EV charging start time is close to a normal distribution as in (8) [37,38]. Here, except for buses, all the other three EV types are assumed to have their arrival time at the charging station following a normal distribution. EVs of bus type have their traveling patterns following a uniform distribution. According to a survey of EV charging behaviors conducted by the China Electric Power Research Institute, the characterization of EV traveling patterns is tabulated in Table 3, providing preliminary data for estimating the EV charging demands.
where tini is the EV arrival time at the charging station while ut is its expected value, ut is the standard deviation.
Table 3.
Characterization of EV traveling patterns.
Based on the characterization of EV traveling patterns in Table 1, the daily charging demands for the four types of EVs can be estimated via the Monte Carlo approach. For each type of EV, the random sampling of the initial battery SoC and the EV arrival time to the charging station is first applied by using the probability distribution parameters tabulated in Table 1. By applying the Monte Carlo approach, 1000 diversified charging profiles are generated for each type of EV, with their aggregate charging profiles forming the daily charging demands, as illustrated in Figure 7. It is observed that different types of EVs have their unique patterns of charging demands, indicating that they may present a difference of potential in the application of grid voltage support.
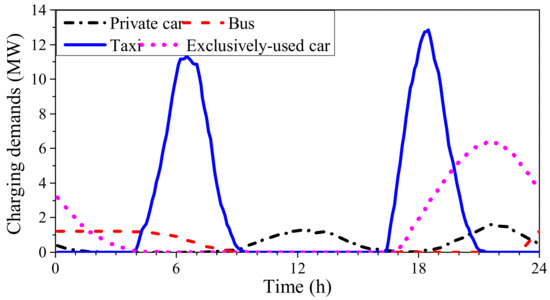
Figure 7.
The charging demands of EVs with different vehicle applications.
2.3.2. Modelling of the EV Charging/Discharging Scheme
During the real-time energy management of EVs, their charging and discharging powers (assuming vehicle-to-grid technology is supported) have to satisfy the power flow limits and the constraints of battery state of charge (SoC). For the power flow constraints, the charging and discharging powers of any EV at time instance tm (represented by Ptm,c and Ptm,d) should not exceed the power rating of the connected EV charger, Pr, as in (9) and (10). Accordingly, the operating power of an EV charger at time instance tm can be represented by (11) and (12), where atm,c and btm,d are values either 0 or 1 and have to satisfy (13). The varying operation status of an EV charger can be represented by different value combinations of atm,c and btm,d, as tabulated in Table 4. The actual charging power fed to the EV battery can be represented by (14), where ηc and ηd refer to the charging efficiency and the discharging efficiency of an EV charger.
0 ≤ Ptm,c ≤ Pr
0 ≤ Ptm,d ≤ Pr
Ptm = atm,c Ptm,c − btm,d Ptm,d
−Pr ≤ Ptm ≤ Pr
atm,c + btm,d ≤ 1
Ptm,batt = atm,c ηcPtm,c − btm,d Ptm,d/ηd,
Table 4.
Values of atm,c and btm,d under different operation statuses of an EV charger.
Regarding the SoC constraints, the feasible operation region of an EV battery SoC is illustrated in Figure 8. For an EV connected to an EV charger at time instance tini, its upper and lower boundaries of EV battery SoC are marked by the red curve and the blue curve in Figure 6, respectively. For the upper boundary, the EV will be first charged to its maximum SoC, SoCmax, at maximum charging power, Pr, and then kept constant at SoCmax, followed by being discharged to the user-expected battery SoC, SoCexp, at a power of Pr. Similarly, for the lower boundary, the EV is first discharged to the lowest battery SoC, SoCmin, at maximum discharging power, Pr, and then kept constant at SoCmin, followed by being charged to SoCexp at a power of Pr. The upper and lower boundaries of EV battery SoC at time instance tm can be represented by Equations (15) and (16).
where SoCup,tm and SoClo,tm refer to the upper boundary and lower boundary of battery SoC at time instance tm, SoCini and SoCexp are the initial battery SoC (i.e., the battery SoC when EV is connected to an EV charger) and the user expected battery SoC respectively, Pr and Er are the rated operating power and the rated battery capacity respectively, tini and texp are the EV arrival time and departure time, and Δt is the control time interval.
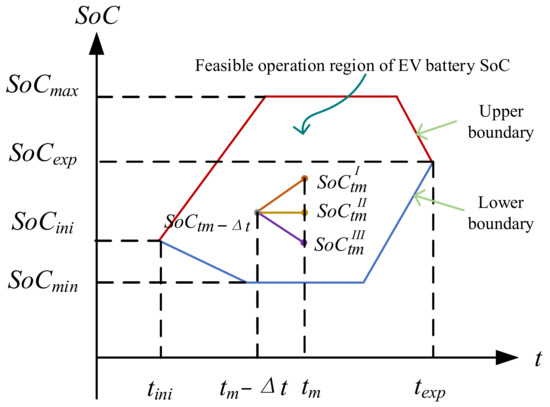
Figure 8.
The SoC constraints of a single EV supporting V2G technology.
As in Figure 7, for any charging time interval [tm − Δt, tm], EV has three different operation modes (charging, idle, and discharging modes), resulting in different battery SoCs (corresponding to , and in Figure 3). During the charging process, the EV battery SoC has to be within its feasible operation region, as represented by (17) and (18). In addition, (19) has to be satisfied to ensure SoCexp can be achieved within the user-defined charging period (i.e., texp − tini).
SoCtm = SoCtm−Δt + Ptm,battΔt/Er
SoClo,tm ≤ SoCtm ≤ SoCup,tm
2.4. A Two-Stage Voltage Regulation Scheme for Distribution Networks with PVs and EVs
The conventional voltage regulation resources in distribution networks include the OLTC transformers and the shunted CBs, which are featured by slow response and limited daily action times. By contrast, PVs and EVs are connected to the grid via power electronic converters, making them capable of real-time controlling their reactive powers. To fully exploit the voltage control capability of EVs and PVs, a two-stage coordinated EV and PV control scheme for the grid voltage regulation is proposed in this section, with its general framework illustrated in Figure 9. The coordinated EV and PV control scheme is divided into two stages-the day-ahead control stage and the intraday control stage, which will be discussed in the following subsections.
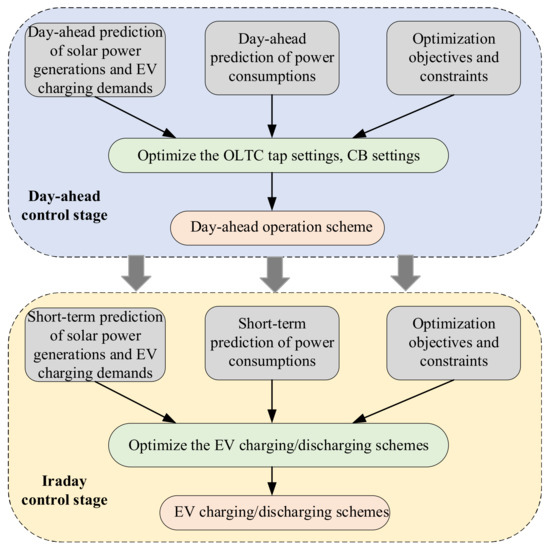
Figure 9.
The framework of the proposed two-stage voltage regulation scheme for distribution networks with PVs and EVs.
2.4.1. Modelling of the Day-Ahead Control Stage
The day-ahead control stage is to determine the optimal OLTC taps settings and CB settings one day in advance, based on the day-ahead forecasting of EV charging demands, PV generations, and preliminary load demands. The time resolution of the day-ahead control stage is assumed to be one hour. The corresponding control objective is to avoid any potential bus voltage violations as well as minimize the total network loss and voltage regulation costs, as in (20) and (21). The voltage regulation costs of the day-ahead control are made up of the switching action costs of OLTCs and CBs (represented by λ2 and λ3 in (20)). The action costs of OLTCs and CBs can be estimated by their equipment investment costs, maintenance costs, daily action limits, and expected lifespans, while the information on the marginal cost of power losses is provided by the electricity system operator. Specifically, the action cost of OLTC, λ2, can be calculated from the purchase and installation cost of OTLC (CTC), the maintenance cost (Cm,TC), the expected lifespan (LTC), and the daily action limit (ATTC), as in (26). The maintenance cost of OLTC is further made up of OLTC repair cost (Crp) and engineering study cost for load transfer (when an OLTC unit is removed, Ces) [39]. For example, according to [39], for a 7620 V (phase-to-neutral), 438 A OLTC transformer with its CTC, Crp, Ces, LTC, and ATTC equaling 120,000 USD, 4167 USD/year, 1667 USD/year, 30 years and 15 times/day, respectively, the corresponding OLTC action cost calculated from (26) is 1.80 USD/time. Similarly, the action cost of CB, λ3, can be calculated from the purchase and installation cost of CB (CCB), the maintenance cost (Cm,CB), the expected lifespan (LCB), and the daily action limit (ATCB) of CB, as in (27). For example, according to [40], for a 4.16 kV, 200 kVAr CB with its CCB, Cm,CB, LCB, and ATCB equaling 5200 USD, 200 USD/year, 10 years and 10 times/day, respectively, the corresponding CB action cost calculated from (27) is 0.20 USD/time. The variation of the action costs can result in different optimal settings for the switching actions of OLTCs and CBs but does not affect the applicability of the prosed control strategy. The considered constraints are the operational constraints of OLTC transformers and CBs ((22)–(25)).
where and are the bus voltage violations and the corresponding penalty factor, (pu) is the voltage of bus i at time instance t, and the total number of buses is denoted as Nb, the minimum and maximum bus voltages are represented by (pu) and (pu), and (USD/Wh) are the power losses at time instance t and its corresponding marginal price, is the tap position of the nth OLTC transformer at time instance t, while Ntp is the total number of OLTC transformers within the target distribution network, λ2 (USD/time) and λ3 (USD/time) are the action costs of OLTCs and CBs, is the switched-on capacitor banks of nth CB while Ncb is the total number of CBs, and are the minimum and maximum tap position of nth OLTC transformer while is its maximum daily action times, is the maximum number of switchable capacitor banks of nth CB.
2.4.2. Modelling of the Intraday Control Stage
As the mismatches between the day-ahead and the intraday power forecasting results are inevitable, the optimal daily operation settings of OLTC transformers and CBs obtained from the day-ahead control stage may not address all the potential voltage issues (e.g., voltage fluctuation and violations of bus voltage limits). Thanks to the real-time control capability of PV inverters and EV chargers, the PV systems and EVs are applied as supplementary voltage regulation resources in the intraday control. The control variables for the intraday control stage are the PV Var support settings (i.e., the knee pints of the voltage droop control in Figure 5) and the EV charging/discharging schemes. The control objective is to minimize the voltage deviation from its reference value and the voltage fluctuation between consecutive time slots, as in (28), with the operational constraints of EVs and PVs considered (as discussed in Section 2.2 and Section 2.3).
The optimal daily operation settings of OLTC transformers and CBs obtained from the day-ahead control stage are the predefined variables during the intraday control stage. The PV systems and EVs act as supplementary voltage regulation resources. The PV systems are always grid-connected, and their voltage regulation capability is achieved using the device-level reactive power control, with the control range mainly determined by the operating power level (and hence the solar irradiation level). For the EV fleet, its voltage regulation capability is achieved with the real-time charging/discharging scheduling under the constraints of EV battery SoC. Due to the diversified travel patterns of EV users, the operating condition of any individual EV charger will vary with time, which will directly affect its charging/discharging schemes and hence its voltage regulation capability. Accordingly, a rolling-optimization-based control scheme (ROCS) is proposed for the EV charging/discharging scheduling and is characterized by self-adaptive optimization window length, as illustrated in Figure 3. Specifically, assuming 5 EVs will be connected to an EV charging station at different time instances with diversified charging durations, the selected optimization window length for each time slot also has to be dynamically adjusted depending on the time-varying EV availability for the grid voltage support. For any time instance, the EV is either already connected to the charging station for a certain time or is just connected to the charging station. As illustrated in Figure 10, only EVs 1~2 are grid-connected at time instance t2, while EVs 1~4 are grid-connected at time instance t3. Based on the information on EV availability at a given time instance and the expected departure time of EV users, the optimization window length at the specified time instance can be defined by (29).
where is the optimization window at time instance tm, texp,i is the expected EV departure time of ith EV while is the total number of grid-connected EVs at time instance tm.
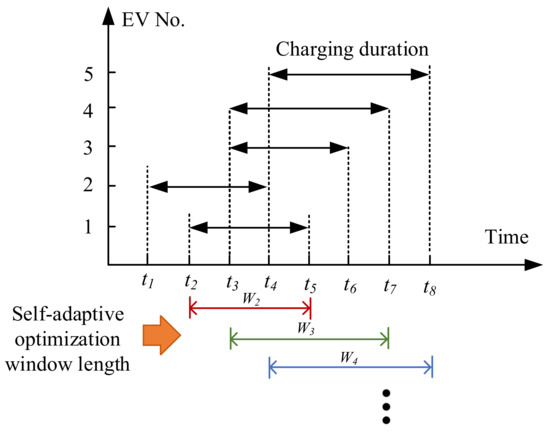
Figure 10.
The self-adaptive window length for the rolling-optimization-based control.
For the example in Figure 9, the EV availability and the EV control variables under each optimization window (i.e., W2, W3, and W4) are tabulated in Table 5 where refers to the charging/discharging power of ith EV at time instance tm of kth optimization window. It is noticed that the EV charging/discharging power for a given time slot may have different optimum values (e.g., under W2 and under W3 may have different optimum solutions). To address this issue, only the optimal charging power for the first time slot of each window is selected to make up the final scheduling schemes of EV charging. For example, the optimal charging schemes for EVs 1~5 in Figure 8 are achieved after applying ROCS, as tabulated in Table 6.
Table 5.
The correlations among the optimization window, the controlled objects, and the control variables (corresponding to Figure 8).
Table 6.
The optimal EV charging/discharging schemes under different time slots.
3. Case Studies
In this section, the performance of the proposed two-stage voltage regulation schemes will be evaluated via case studies performed on the IEEE 123-node test feeder integrated with EVs and PVs.
3.1. Basic Information of the Test Cases
The single-line diagram of the IEEE 123-node test feeder is shown in Figure 11, with three EV charging parks and six solar systems integrated. The power ratings for a single EV charging park and single solar system are 600 kW and 200 kW, respectively. To take into account the impact of preliminary load demand variation on the grid voltage profiles, selected residential load profiles are randomly distributed to the default loads, as in Figure 12. Figure 12 also denotes that the distribution network has the highest preliminary power consumption during the period of 7 p.m. to 11 p.m., which overlaps with the charging peak period of EVs. The EVs gathering to charge at peak hours can result in under-voltages issues and the overloading of power transformers and distribution cables. The typical PV generation profiles applied to the six solar systems are illustrated in Figure 13, assuming all the solar systems are operating on a sunny day. It is observed from Figure 13 that the solar systems have the highest power generation during the period of 10 a.m. to 2 p.m., which may mitigate the grid congestion due to EV charging. All applied daily load profiles and PV generation profiles are taken from a database disclosed by a UK DNO [41]. To provide the grid voltage support, all six solar systems are characterized by a voltage droop control, as described in Figure 6. The minimum allowed power factor for all solar systems is 0.9 (leading or lagging).
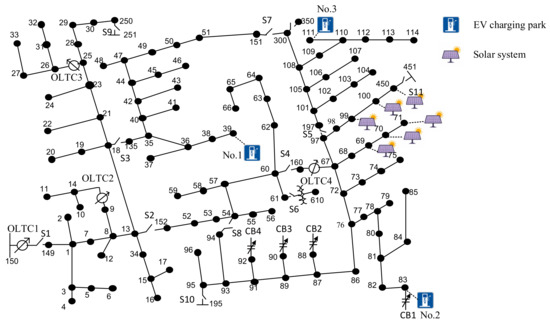
Figure 11.
The single-line diagram of the IEEE 123-node test feeder with EVs and PVs connected.
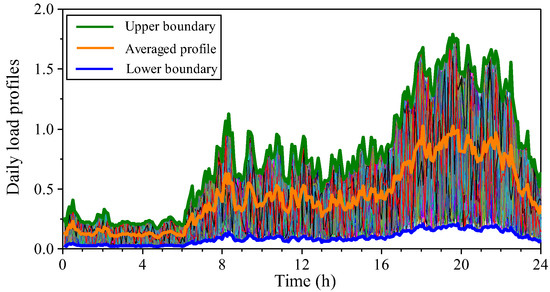
Figure 12.
The normalized daily load profiles applied for the IEEE 123-node test feeder.
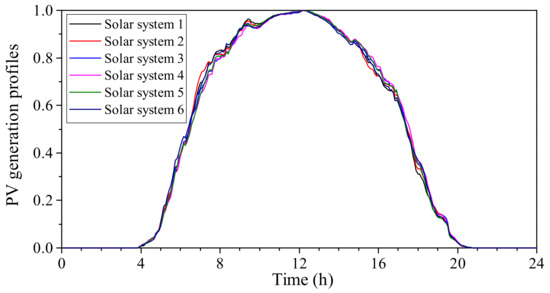
Figure 13.
The normalized PV generation profiles of the six solar parks.
Based on the Monte Carlo simulations conducted in Section 2.3.1, it is expected that each EV charging park with a power rating of 600 kW can accommodate up to 250 EVs per day. To emulate the uncontrolled EV charging behaviors, it is assumed that 700 EVs are connected to three EV charging parks with a combination of different arrival times and charging durations. All EVs are charged at unity power factor without considering the power losses during the charging process. As EVs of different transport types are featured by diversified charging patterns, it is assumed that all the 700 EVs are made up of private cars, buses, taxis, and exclusively-used cars, with their percentage share equaling 85%, 2%, 5%, and 8% respectively. Each EV’s arrival time, initial battery SoC, battery capacity, type of charging, and charging period are randomly generated from its typical charging pattern, as defined in Table 1. All the EVs have the V2G capability and can provide bidirectional active power flow between the power grid and the EV battery. It should be noted that the lithium-ion EV battery enters into constant voltage charge mode with a significantly slow charging speed when the EV battery SoC is above a threshold value of around 95%. Therefore, the expected EV battery SoC after charging is assumed to be 95%. For unregulated EV charging, all EVs are charged at their rated charging power once they arrive at the EV charging parks, with their aggregate daily EV charging demand profiles illustrated in Figure 14. It is noticed that the diversity of EV types results in several spikes in aggregate EV charging demands during the day. When those spikes are superimposed on the peak power consumption of preliminary loads, the bus voltages may drop below the safe margin. To address this issue, six OLTC transformers and four capacitor banks are deployed, and their basic information can be found in [42]. The minimum and maximum bus voltages are 0.95 pu and 1.05 pu, respectively. The optimization problems associated with the two-stage voltage control are solved with a modified JAYA evolutionary algorithm, with its details provided in [43].
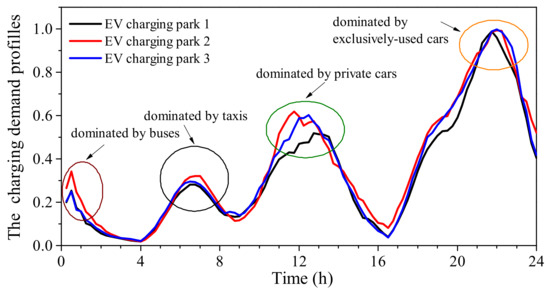
Figure 14.
The charging demand profiles allocated to three EV charging parks.
3.2. Simulation Results of the Day-Ahead Control Stage
According to the day-ahead forecasting of preliminary load consumptions, PV generations, and EV charging demands (Figure 11, Figure 12 and Figure 13), the grid voltage distribution patterns before the control activation can be estimated via the time series power flow simulations, as illustrated in Figure 15. When the day-ahead control is not activated, all OLTC transformers have their taps set at nominal positions, and none of the capacitor banks is switched on. It is observed from Figure 15 that a great portion of buses has their terminal voltages drop below 0.95 pu during the period of 7 p.m. to 11 p.m. due to the concurrence of high EV charging demand and peak power consumptions of basic loads. Significant voltage deviation (up to 0.09 pu) is also observed during the EV peak charging period.
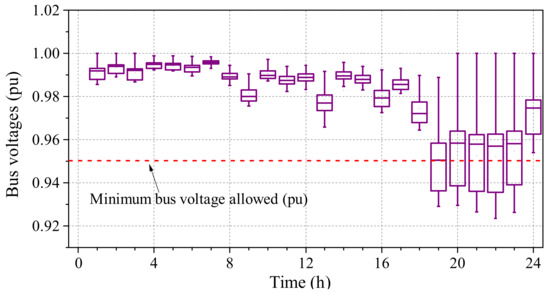
Figure 15.
The boxplot of bus voltages before the day-ahead control.
By applying the modeling procedure of the day-ahead control given in Section 2.4.1, the optimal operating curves for the OLTC transformers and CBs can be derived, as illustrated in Figure 16. According to [44], the switching action costs of OLTCs and CBs are assumed to be 1.4 USD/time and 0.24 USD/time, respectively, while the marginal cost of the power losses is set at 80 USD/MWh. The grid voltage distribution pattern with the day-ahead control being applied is shown in Figure 17. Comparing the grid voltages before and after the day-ahead control, it turns out that the day-ahead control successfully brings the bus voltages back to the safe operation margin (i.e., 0.95~1.05 pu) during the period of peak power demand, even though certain bus voltages are close to the boundaries.
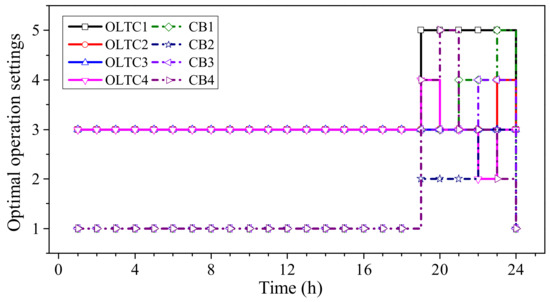
Figure 16.
The optimal operation settings for OLTC transformers and CBs.
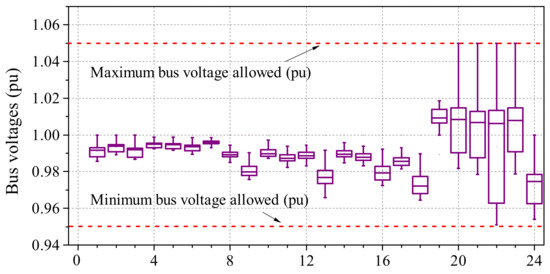
Figure 17.
The boxplot of bus voltages achieved from the day-ahead control.
3.3. Simulation Results of the Intraday Control Stage
To further improve the voltage profiles, intraday control has to be applied with the voltage support capability of solar systems and EV charging stations. During the intraday control stage, the control objects are the six solar systems and the 700 EVs, while the OLTC transformers and the CBs are operating at their optimal operating curves achieved from the day-ahead control (i.e., the operation settings in Figure 16). The grid voltage support is based on the voltage droop control of solar systems and the ROCS-based EV charging/discharging schedule. When the intraday control is not applied, all solar systems operate at a unity power factor, and EVs are charged without a schedule. The boxplot represents the corresponding simulation results of bus voltages in Figure 18, where the voltage limit violations are observed.
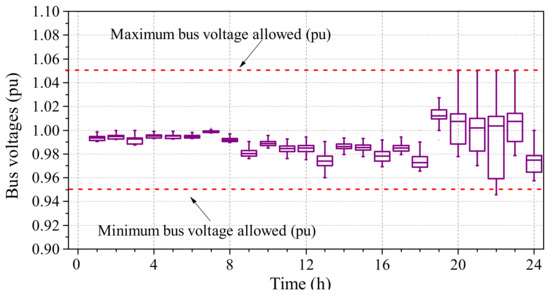
Figure 18.
The boxplot of bus voltages without the intraday control.
After the intraday control is enabled, voltage droop control is activated for the six solar systems while ROCS is applied to schedule the charging/discharging behaviors of all the 700 EVs. The voltage distribution pattern under the intraday control is shown in Figure 19, and the achieved bus voltage improvement is illustrated in Figure 20. It is observed that all bus voltages are within the safe operation margin, and the bus voltage fluctuation gets alleviated after the intraday control is applied. The total reactive power provided by the six solar systems is 378.07 kVArh, while the optimum EV charging/discharging scheme is illustrated in Figure 21.
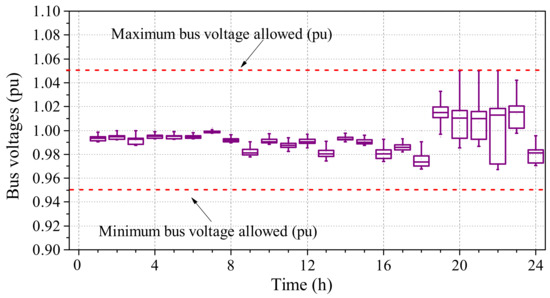
Figure 19.
The boxplot of bus voltages achieved from the intraday control.
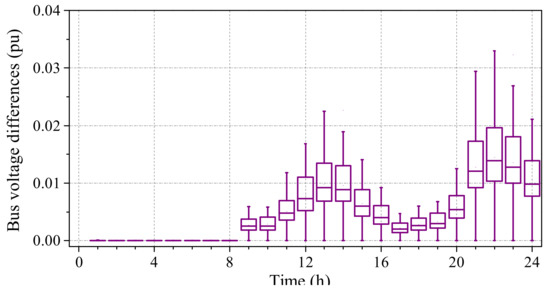
Figure 20.
The bus voltage improvement achieved from the intraday control.
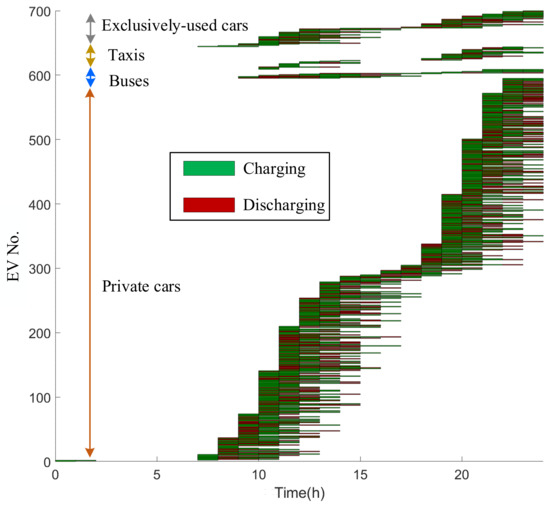
Figure 21.
The optimal EV charging schemes achieved from the intraday control (EV charging and discharging are represented by green color and red color respectively).
4. Discussion
Based on the case studies discussed in Section 3, the proposed two-stage voltage regulation scheme can improve the grid voltage distribution pattern with the aid of the coordination between conventional voltage regulation resources and distributed voltage resources, including PVs and EVs. For the day-ahead control, the daily optimal operation settings of OLTC transformers and CBs are predefined based on the day-ahead forecasting of preliminary load consumptions, EV charging demands, and solar PV generations. Due to the limited number of taps or capacitor units, the voltage regulation objective of the day-ahead control is to mitigate the potential voltage violations with minimum operating costs. Based on the case studies performed in Section 3, it turns out that the proposed day-ahead control can successfully keep all the bus voltages within the safe operation margin. However, the limited setting points of OLTCs and CBs bring in discrete voltage regulation, which cannot fully address the issues of voltage deviations and fluctuations. To further alleviate the voltage deviations and voltage fluctuations, intraday control is introduced where the voltage support capability of distributed PVs and EVs is considered. For the distributed PV systems, the voltage droop control is applied, for which the PV systems will automatically adjust their reactive power according to the predefined linear correlation between the maximum reactive power available and the terminal voltage. It should be noted that the reactive power compensation capability of a PV system is directly affected by its active power output (as discussed in Section 2.2.2). Due to the power constraint of PV inverters, higher active power generation indicates less reactive power compensation capability for a PV system. For EVs connected to charging stations, their voltage support capability is achieved by the optimal scheduling of the EV charging/discharging powers under the premise of meeting the charging requirements of EV users. However, due to spatiotemporal uncertainties of EV charging behaviors and the diversified EV charging patterns of different types, the EV grid support capability will vary with the EV availability and the EV fleet composition. In addition, the EV users’ willingness to participate in the grid voltage support can be affected by factors like the price subsidy, battery state of health, traffic conditions, etc. Accordingly, predicting the EV availability for the grid voltage support is complex, and the uncertainty of EV availability further affects the distribution voltage support performance of the connected EV charging station. To deal with the stochastic nature of EV charging behavior and EV drivers’ willingness to participate in V2G service, a ROCS-based control scheme is proposed for which the control window length is self-adjusted based on the monitored states of EVs and EV chargers. The case study results demonstrate that the ROCS-based intraday control can further alleviate the grid voltage deviation and fluctuation to some extent when compared to the voltage distribution patterns achieved by the day-ahead control. Due to the constraints of satisfying EVs’ desired departure SoC and PVs’ maximum power generation, the distribution voltage regulation capability of the ROCS-based intraday control is limited. To enhance the voltage support capability of intraday control, onsite battery energy storage systems can be incorporated into solar PV farms and EV charging stations to achieve a mild decoupling among EVs, PVs, and the distribution network.
As indicated in this work, the voltage support capability of a specific EV charging station is mainly decided by the time-varying EV availability and EV fleet composition. To motivate the EV drivers’ willingness to participate in V2G services, it is possible to provide price-based incentives in the form of charging price reductions or V2G participation revenues.
5. Conclusions
Due to the intermittent power generation of distributed PV systems and the spatiotemporal uncertainty of uncontrolled EV charging, the accelerating grid penetration of EVs and PVs brings in severe voltage deviations and voltage fluctuations. The conventional voltage regulation resources in distribution networks include OLTC transformers and CBs, which are featured by slow response and limited lifetime duration with the increased number of operations. Compared to OLTC transformers and CBs, PVs, and EVs get connected to the power grid via fully controllable power electronic converters, making them ideal voltage support resources. In this context, a two-stage control scheme for the voltage regulation of distribution networks is proposed and is made of day-ahead control and intraday control. The day-ahead control is for mitigating the potential voltage violations via the optimal operation settings of OLTC transformers and CBs. The intraday control is for further alleviating the voltage deviations and fluctuations based on the voltage drop control of PV systems and the ROCS-based EV charging/discharging schedule. To evaluate the feasibility of the proposed two-stage voltage regulation scheme, case studies are performed on the IEEE 123-node test feeder with EVs and PVs connected. The simulation results demonstrate that the proposed control scheme can effectively improve the grid voltage distribution patterns.
In future works, the proposed two-stage control scheme will be combined with the voltage adaptive dynamic partition methods to improve its applicability for large-scale distribution networks. In addition, as the aggregate voltage support capability will vary with different functional subareas of the city, subarea aggregation models will be developed for EVs and PVs, with the time and space couplings among agents fully considered. Ultimately, the voltage support capability of EV chargers and PV inverters is limited due to the constraints of fulfilling EV charging tasks and avoiding PV active power curtailments. To further enhance the voltage support capability of EV chargers and PV inverters in future studies, a mild decoupling between fully controllable PE converters and the power grid is required, which can be achieved by adequately designed battery energy storage systems integrated into EV charging stations and PV parks.
Author Contributions
Conceptualization, Y.Z. and F.G.; methodology, Z.Z.; software, S.Z.; validation, X.X., Y.Z. and Z.Z.; formal analysis, F.G.; investigation, X.X.; resources, S.Z.; data curation, X.X.; writing—original draft preparation, S.Z.; writing—review and editing, H.M.; visualization, X.X.; supervision, Z.Z.; project administration, Y.Z.; funding acquisition, H.G. All authors have read and agreed to the published version of the manuscript.
Funding
This work was supported by the Science and Technology Project of State Grid Jiangsu Electric Power Company, Ltd., (no: J2022136).
Institutional Review Board Statement
Not applicable.
Informed Consent Statement
Not applicable.
Data Availability Statement
Data are contained within the article.
Conflicts of Interest
The authors declare no conflict of interest.
References
- International Energy Agency. Global EV Outlook 2021; International Energy Agency: Paris, France, 2021; Available online: https://iea.blob.core.windows.net/assets/ed5f4484-f556-4110-8c5c-4ede8bcba637/GlobalEVOutlook2021.pdf (accessed on 27 March 2023).
- International Energy Agency. Solar PV Power Capacity in the Net Zero Scenario, 2010–2030; International Energy Agency: Paris, France, 2022; Available online: https://www.iea.org/data-and-statistics/charts/solar-pv-power-capacity-in-the-net-zero-scenario-2010-2030 (accessed on 27 March 2023).
- Kisacikoglu, M.C.; Ozpineci, B.; Tolbert, L.M. Reactive power operation analysis of a single-phase EV/PHEV bidirectional battery charger. In Proceedings of the 8th International Conference on Power Electronics (ECCE), Jeju, Republic of Korea, 30 May–3 June 2011; pp. 585–592. [Google Scholar]
- Ma, K.; Hu, X.Y.; Yue, Z.Y.; Wang, Y.Z.; Yang, J.; Zhao, H.; Liu, Z.X. Voltage Regulation with Electric Taxi Based on Dynamic Game Strategy. IEEE Trans. Veh. Technol. 2022, 71, 2413–2426. [Google Scholar] [CrossRef]
- Wu, C.Y. Optimal Dispatching Strategy for Distributed Electric Vehicles Participating in Grid Voltage Regulation; University of Electronic Science and Technology: Chengdu, China, 2018. [Google Scholar]
- Svenda, G.; Krstic, I.; Jajcanin, M.; Kanjuh, S. Voltage improvement in distribution networks with high penetration of electric Vehicles and renewable energy sources. In Proceedings of the CIRED Porto Workshop 2022: E-Mobility and Power Distribution Systems, Hybrid Conference, Porto, Portugal, 2–3 June 2022; pp. 364–368. [Google Scholar]
- De Melo, H.N.; Trovão, J.P.F.; Pereirinha, P.G.; Jorge, H.M.; Antunes, C.H. A controllable bidirectional battery charger for electric vehicles with vehicle-to-grid capability. IEEE Trans. Veh. Technol. 2018, 67, 114–123. [Google Scholar] [CrossRef]
- Vittorias, I.; Metzger, M.; Kunz, D.; Gerlich, M.; Bachmaier, G. A bidirectional battery charger for electric vehicles with V2G and V2H capability and active and reactive power control. In Proceedings of the IEEE Transportation Electrification Conference and Expo (ITEC), Dearborn, MI, USA, 15–18 June 2014; pp. 1–6. [Google Scholar]
- Kisacikoglu, M.C.; Ozpineci, B.; Tolbert, L.M. EV/PHEV bidirectional charger assessment for V2G reactive power operation. IEEE Trans. Power Electron. 2013, 28, 5717–5727. [Google Scholar] [CrossRef]
- El-Bayeh, C.Z.; Alzaareer, K.; Brahmi, B.; Zellagui, M. A novel algorithm for controlling active and reactive power flows of electric vehicles in buildings and its impact on the distribution network. World Electr. Veh. J. 2020, 11, 43. [Google Scholar] [CrossRef]
- Zhang, W.J.; Gandhi, O.; Quan, H.; Rodríguez-Gallegos, C.D.; Srinivasan, D. A multi-agent based integrated volt-var optimization engine for fast vehicle-to-grid reactive power dispatch and electric vehicle coordination. Appl. Energy 2018, 229, 96–110. [Google Scholar] [CrossRef]
- Rabiee, A.; Feshki, H.F.; Khalili, M.; Aghaei, J.; Muttaqi, K.M. Integration of plug-in electric vehicles into microgrids as energy and reactive power providers in market environment. IEEE Trans. Ind. Inform. 2016, 12, 1312–1320. [Google Scholar] [CrossRef]
- Zhang, C.; Xu, Y.; Dong, Z.; Ravishankar, J. Three-stage robust inverter-based voltage/var control for distribution networks with high-level PV. IEEE Trans. Smart Grid 2019, 10, 782–793. [Google Scholar] [CrossRef]
- Wang, Y.; Syed, M.H.; Guillo-Sansano, E.; Xu, Y.; Burt, G.M. Inverter-based voltage control of distribution networks: A three-level coordinated method and power hardware-in-the-loop validation. IEEE Trans. Sustain. Energy 2020, 11, 2380–2391. [Google Scholar] [CrossRef]
- Dall’Anese, E.; Dhople, S.V.; Giannakis, G.B. Optimal Dispatch of Photovoltaic Inverters in Residential Distribution Systems. IEEE Trans. Sustain. Energy 2014, 5, 487–497. [Google Scholar] [CrossRef]
- Guggilam, S.S.; Dall’Anese, E.; Chen, Y.C.; Dhople, S.V.; Giannakis, G.B. Scalable Optimization Methods for Distribution Networks with High PV Integration. IEEE Trans. Smart Grid 2016, 7, 2061–2070. [Google Scholar] [CrossRef]
- Ghosh, S.; Rahman, S.; Pipattanasomporn, M. Distribution Voltage Regulation Through Active Power Curtailment with PV Inverters and Solar Generation Forecasts. IEEE Trans. Sustain. Energy 2017, 8, 13–22. [Google Scholar] [CrossRef]
- Xia, P. A Wide-Area Source-Load Coordinated Optimal Dispatching Method for High Proportional New Energy Access to the Grid; North China Electric Power University (Beijing): Beijing, China, 2020. [Google Scholar]
- Wang, S.Y.; Du, L.; Fan, X.Y.; Huang, Q. Deep Reinforcement Scheduling of Energy Storage Systems for Real-Time Voltage Regulation in Unbalanced LV Networks with High PV Penetration. IEEE Trans. Sustain. Energy 2021, 12, 2342–2352. [Google Scholar] [CrossRef]
- Xu, Y.; Dong, Z.Y.; Zhang, R.; Hill, D.J. Muti-Timescale Coordinated Voltage/Var Control of High Renewable-Penetrated Distribution Systems. IEEE Trans. Power Syst. 2017, 32, 4398–4408. [Google Scholar] [CrossRef]
- Li, P.S.; Wu, Z.J.; Wang, Y.; Dou, X.B.; Hu, M.Q.; Hu, J.Y. Adaptive robust optimal reactive power dispatch in unbalanced distribution networks with high penetration of distributed generation. IET Gener. Transm. Distrib. 2018, 12, 1382–1389. [Google Scholar] [CrossRef]
- Ayyagari, K.S.; Gonzalez, R.; Jin, Y.F.; Alamaniotis, M.; Ahmed, S.; Gatsis, N. Artificial Neural Network-Based Adaptive Voltage Regulation in Distribution Systems using Data-Driven Stochastic Optimization. In Proceedings of the 2019 IEEE Energy Conversion Congress and Exposition (ECCE), Baltimore, MA, USA, 29 September–3 October 2019; pp. 5840–5847. [Google Scholar]
- Rabiee, A.; Keane, A.; Soroudi, A. Enhanced Transmission and Distribution Network Coordination to Host More Electric Vehicles and PV. IEEE Syst. J. 2022, 16, 2705–2716. [Google Scholar] [CrossRef]
- Wang, L.; Dubey, A.; Gebremedhin, A.H.; Srivastava, A.K.; Schulz, N. MPC-Based Decentralized Voltage Control in Power Distribution Systems with EV and PV Coordination. IEEE Trans. Smart Grid 2022, 13, 2908–2919. [Google Scholar] [CrossRef]
- Tao, J.S.; Huang, D.B.; Li, D.L.; Yang, X.; Ling, C. Pricing strategy and charging management for PV-assisted electric vehicle charging station. In Proceedings of the 2018 13th IEEE Conference on Industrial Electronics and Applications (ICIEA), Wuhan, China, 31 May–2 June 2018; pp. 577–581. [Google Scholar]
- Yuan, Z.Y.; Yu, L.; Xu, Q.; Zou, C.H.; Qv, K.; Xu, S.K.; Yin, S. Optimization of orderly charge and discharge scheduling of electric vehicles and photovoltaic in industrial Par. In Proceedings of the 2020 Asia Energy and Electrical Engineering Symposium (AEEES), Chengdu, China, 28–31 May 2020; pp. 226–229. [Google Scholar]
- Chen, Q.F.; Wang, F.; Hodge, B.-M.; Zhang, J.H.; Li, Z.G.; Shafie-Khah, M.; Catalão, J.P.S. Dynamic Price Vector Formation Model-Based Automatic Demand Response Strategy for PV-Assisted EV Charging Stations. IEEE Trans. Smart Grid 2017, 8, 2903–2915. [Google Scholar] [CrossRef]
- Shen, J.M.; Wang, L.L.; Zhang, J.L. Distributed Charging Control of Electric Vehicles in PV-based Charging Stations. In Proceedings of the 2021 IEEE Applied Power Electronics Conference and Exposition (APEC), Phoenix, AZ, USA, 14–17 June 2021; pp. 995–1000. [Google Scholar]
- Akhtar, Z.; Opatovsky, M.; Chaudhuri, B.; Ron Hui, S.Y. Comparison of point-of-load versus midfeeder compensation in LV distribution networks with high penetration of solar photovoltaic generation and electric vehicle charging stations. IET Smart Grid 2019, 2, 283–292. [Google Scholar] [CrossRef]
- Marra, F.; Yang, G.Y.; Fawzy, Y.T.; Træholt, C.; Larsen, E.; Garcia-Valle, R.; Jensen, M. Møller. Improvement of Local Voltage in Feeders with Photovoltaic Using Electric Vehicles. IEEE Trans. Power Syst. 2013, 28, 3515–3516. [Google Scholar] [CrossRef]
- Demirok, E.; González, P.C.; Frederiksen, K.H.B.; Sera, D.; Rodriguez, P.; Teodorescu, R. Local reactive power control methods for overvoltage prevention of distributed solar inverters in low-voltage grids. IEEE J. Photovolt. 2011, 1, 174–182. [Google Scholar] [CrossRef]
- Zhu, H.; Liu, H. Fast local voltage control under limited reactive power: Optimality and stability analysis. IEEE Trans. Power Syst. 2016, 31, 3794–3803. [Google Scholar] [CrossRef]
- Keane, A.; Ochoa, L.F.; Vittal, E.; Dent, C.J.; Harrison, G.P. Enhanced utilization of voltage control resources with distributed generation. IEEE Trans. Power Syst. 2011, 26, 252–260. [Google Scholar] [CrossRef]
- Zhao, B.; Xu, Z.; Xu, C.; Wang, C.; Lin, F. Network partition based zonal voltage control for distribution networks with distributed PV systems. IEEE Trans. Smart Grid 2018, 9, 4087–4098. [Google Scholar] [CrossRef]
- Ruan, H.; Gao, H.; Liu, Y.; Wang, L.; Liu, J. Distributed voltage control in active distribution network considering renewable energy: A novel network partitioning method. IEEE Trans. Power Syst. 2020, 35, 4220–4231. [Google Scholar] [CrossRef]
- Jha, R.R.; Dubey, A.; Liu, C.-C.; Schneider, K.P. Bi-level volt-VAR optimization to coordinate smart inverters with voltage control devices. IEEE Trans. Power Syst. 2019, 34, 1801–1813. [Google Scholar] [CrossRef]
- Taylor, M.J.; Alexander, A. Evaluation of the impact of plug-in electric vehicle loading on distribution system operations. In Proceedings of the IEEE Power & Energy Society General Meeting, Calgary, AB, Canada, 26–30 July 2009; pp. 1–6. [Google Scholar]
- Vyas, A.; Santini, D. Use of National Surveys for Estimating ‘Full’ PHEV Potential for Oil Use Reduction [EB/OL]. 21 July 2008. Available online: http://www.transportation.anl.gov/pdfs/HV/525.pdf (accessed on 27 March 2023).
- Eaton. Voltage Regulators vs. Load Tap Changers. Available online: https://www.eaton.com/content/dam/eaton/products/medium-voltage-power-distribution-control-systems/voltage-regulators/voltage-regulators-vs-load-tap-changers-information-td225012en.pdf (accessed on 1 April 2023).
- ETAP. Optimal Capacitor Placement Costs Benefits Due to Loss Reductions. Available online: https://etap.com/docs/default-source/white-papers/optimal-capacitor-placement-benefits.pdf?sfvrsn=9b37b27f_4 (accessed on 1 April 2023).
- Electricity North West. Low Voltage Network Solutions Closedown Report. 2014. Available online: https://www.enwl.co.uk/go-net-zero/innovation/smaller-projects/low-carbon-networks-fund/low-voltage-network-solutions/low-voltage-network-solutions-closedown-report/ (accessed on 27 March 2023).
- IEEE. PES Distribution Systems Analysis Subcommittee Radial Test Feeders. Available online: https://cmte.ieee.org/pestestfeeders/resources/ (accessed on 10 February 2023).
- Xu, X.; Gunda, J.; Dowling, R.; Djokic, S. A Two-stage Approach for Renewable Hosting Capacity Assessment. In Proceedings of the 2019 IEEE PES Innovative Smart Grid Technologies Europe (ISGT-Europe), Bucharest, Romania, 29 September–2 October 2019; pp. 1–5. [Google Scholar]
- Xiaojuan, L.; Jian, Z.; Sedgi, O. Two-layer operation optimization of concentrated solar power with thermal energy storage system and soft open point. Int. J. Electr. Power Energy Syst. 2023, 146, 108788. [Google Scholar]
Disclaimer/Publisher’s Note: The statements, opinions and data contained in all publications are solely those of the individual author(s) and contributor(s) and not of MDPI and/or the editor(s). MDPI and/or the editor(s) disclaim responsibility for any injury to people or property resulting from any ideas, methods, instructions or products referred to in the content. |
© 2023 by the authors. Licensee MDPI, Basel, Switzerland. This article is an open access article distributed under the terms and conditions of the Creative Commons Attribution (CC BY) license (https://creativecommons.org/licenses/by/4.0/).