Article

Traceability of the Micro Scale Pipe Viscometer for Traceable Calibration of Dynamic Viscosity

Federal Institute of Metrology METAS, Lindenweg 50, 3003 Bern-Wabern, Switzerland
*
Author to whom correspondence should be addressed.
Appl. Sci. 2023, 13(10), 5984; https://doi.org/10.3390/app13105984
Submission received: 25 April 2023 / Revised: 10 May 2023 / Accepted: 11 May 2023 / Published: 12 May 2023
(This article belongs to the Section Applied Physics General)

Abstract

:
Calibration of flow devices is important in several areas of pharmaceutical, flow chemistry and microfluidic applications where dosage of process liquids or accurate measurement of flow rate is important. The process-oriented liquid itself might influence the performance of a flow device and the simultaneous determination of dynamic viscosity under flow conditions might provide valuable information for process parameters. To offer simultaneous calibration of the dynamic viscosity of a process-oriented liquid at the corresponding flowrate, METAS built a pipe viscometer for the traceable inline measurement of dynamic viscosity in current flow facilities for low flowrates from 1 μL/min to 150 mL/min and pressure drops up to 10 bar. The traceability of all measuring quantities as well as geometrical dimensions of the microtube guarantee the traceability of the pipe viscometer to SI units. The most challenging part is the traceable determination of the inner diameter of the microtube. This can be achieved by measuring the pressure drop as a function of flowrate using a pipe viscometer and applying the Hagen–Poiseuille law with a traceable dynamic viscosity of a reference liquid (water) or performing measurements by utilizing the μ-CT facility at METAS, where the inner diameter is determined using X-ray diffraction. The validation of the stated measurement uncertainty of the pipe viscometer was performed by calibrating the dynamic viscosity of several reference liquids with traceable density and kinematic viscosity. The setup of the facility, traceability as well as uncertainty calculation of the pipe viscometer for inline measurement of dynamic viscosity are discussed in this paper.

1. Introduction

Calibration of flow devices is important in several areas of pharmaceutical, flow chemistry and HPLC applications where the dosage of process-oriented liquids or accurate measurement of flowrate are important. The process-oriented liquid itself might influence the performance of the flow meter. Coriolis flow meters are rather insensitive to the viscosity of the liquid and the flow profile in the piping. Thermal flow meters might be sensitive to the flow profile of the liquid inside the tube, which is influenced by the viscosity of the liquid and the flow regime, but they are obviously extremely sensitive to the thermal properties of the liquids [1]. Therefore, the calibration of the flow meter with the process-oriented liquid is important and the simultaneous determination of dynamic viscosity under flow conditions is valuable information for viscosity-dependent flow metering methods or other process parameters [1,2]. Pipe viscometers are widely used in industrial and research applications for measuring the dynamic viscosity of liquids [3,4,5,6], either to calculate average dynamic viscosity or determine the flow curve describing dynamic viscosity as a function of shear rate in the piping. Various instruments are available for the determining dynamic viscosity as a function of shear rate for piping diameters of tens of millimeters [5,7,8,9]. However, these instruments are not available for piping diameters in the order of several millimeters. The globally accepted method for the traceable measurement of the kinematic viscosity of a liquid is by use of a glass capillary viscometer, which requires sampling the liquid, but allows for measuring the temperature dependence of kinematic viscosity. By measuring liquid density as a function of temperature, the dynamic viscosity of the liquid can be calculated. Liquid sampling is not always an advantage in production processes. Currently, several commercially available instruments exist for performing inline measurements of the dynamic viscosity and density process liquids [10,11] that fulfill the advantages of inline measurement in small pipes. To monitor the accuracy of these sensors over time, they could be calibrated using a traceable pipe viscometer with any liquid to determine the deviations from reference values traceable to SI units at a given time interval.
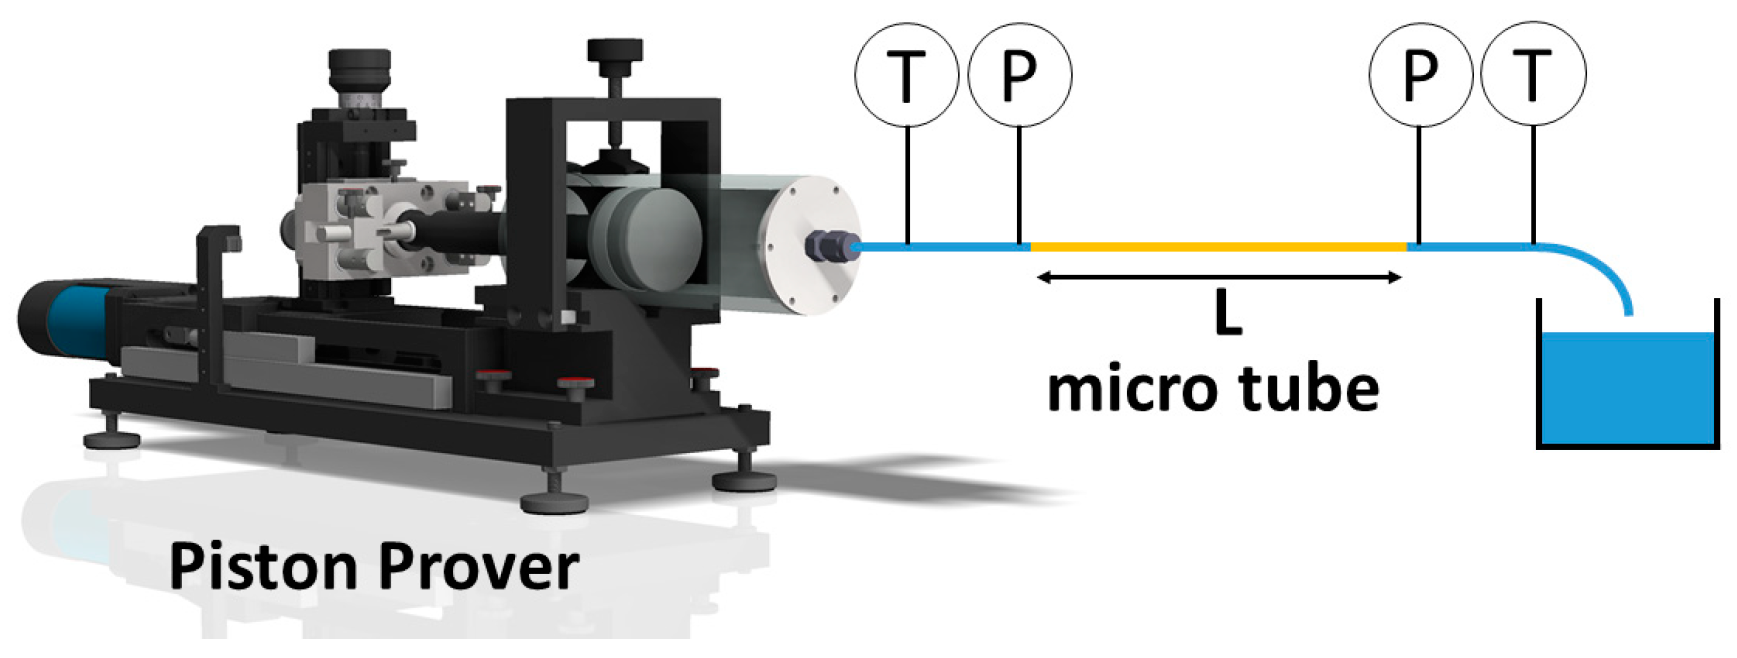
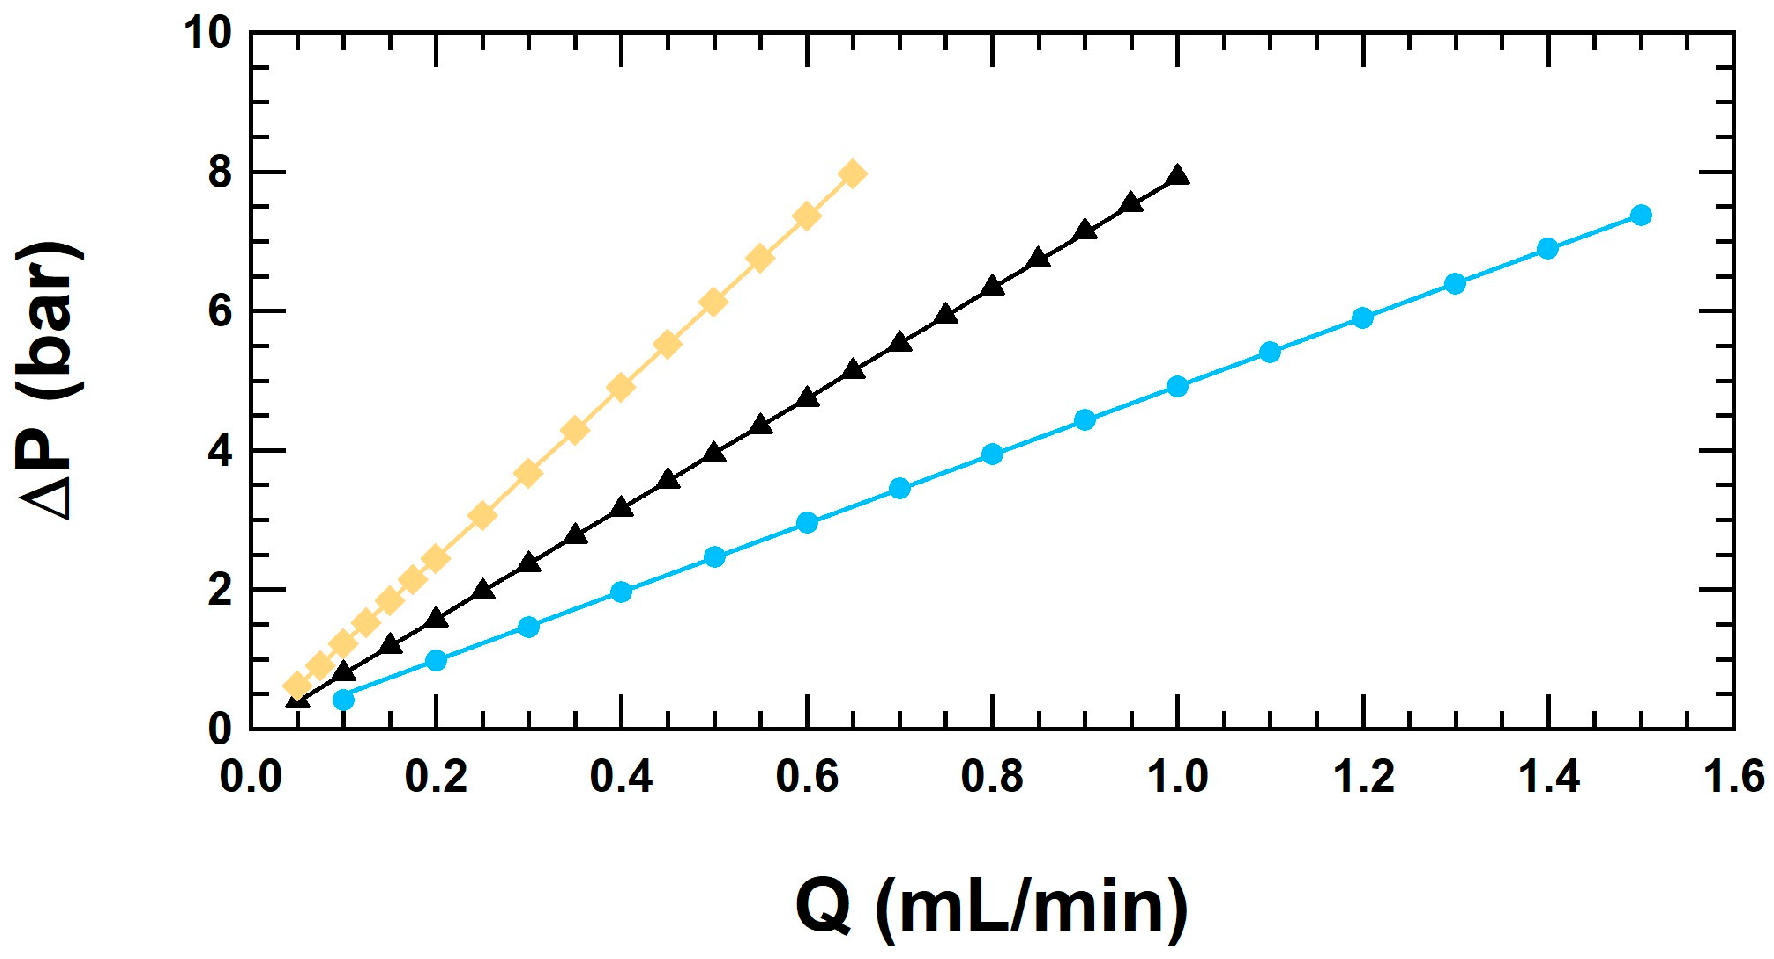
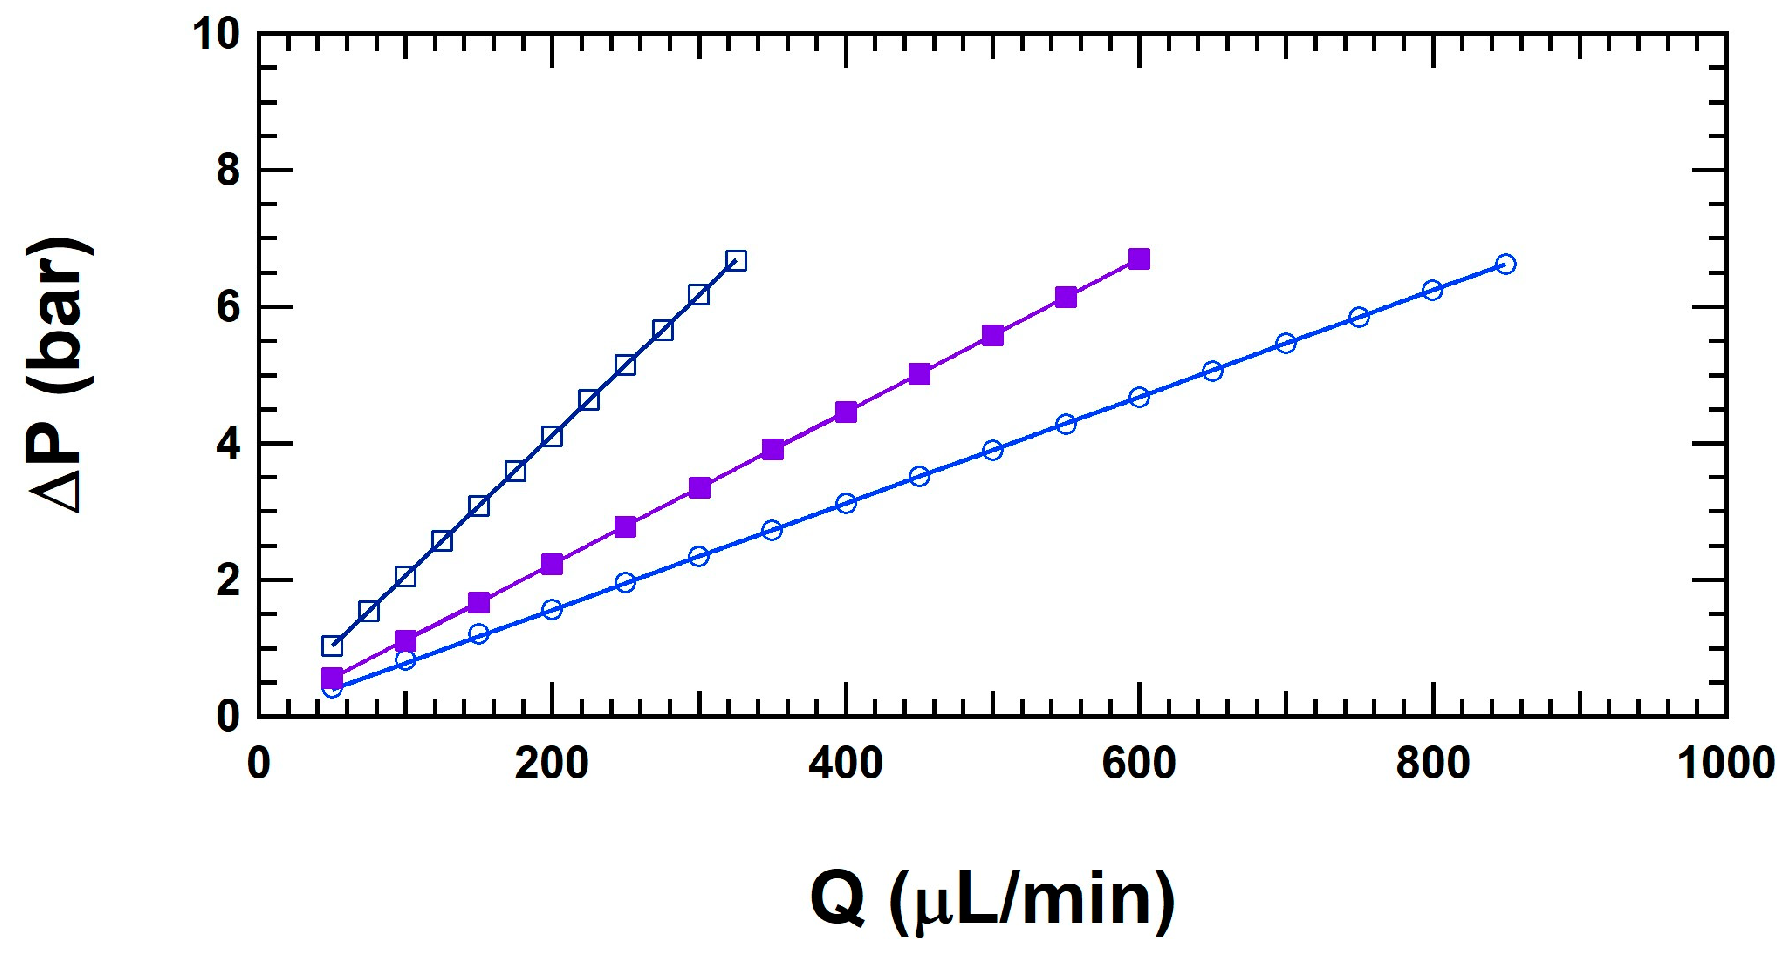
To offer the simultaneous calibration of the dynamic viscosity of a process-oriented liquid at the corresponding flowrate, METAS built a pipe viscometer for the traceable inline measurement of dynamic viscosity in current flow facilities for low flowrates from 1 μL/min to 150 mL/min and pressure drops up to 10 bar [
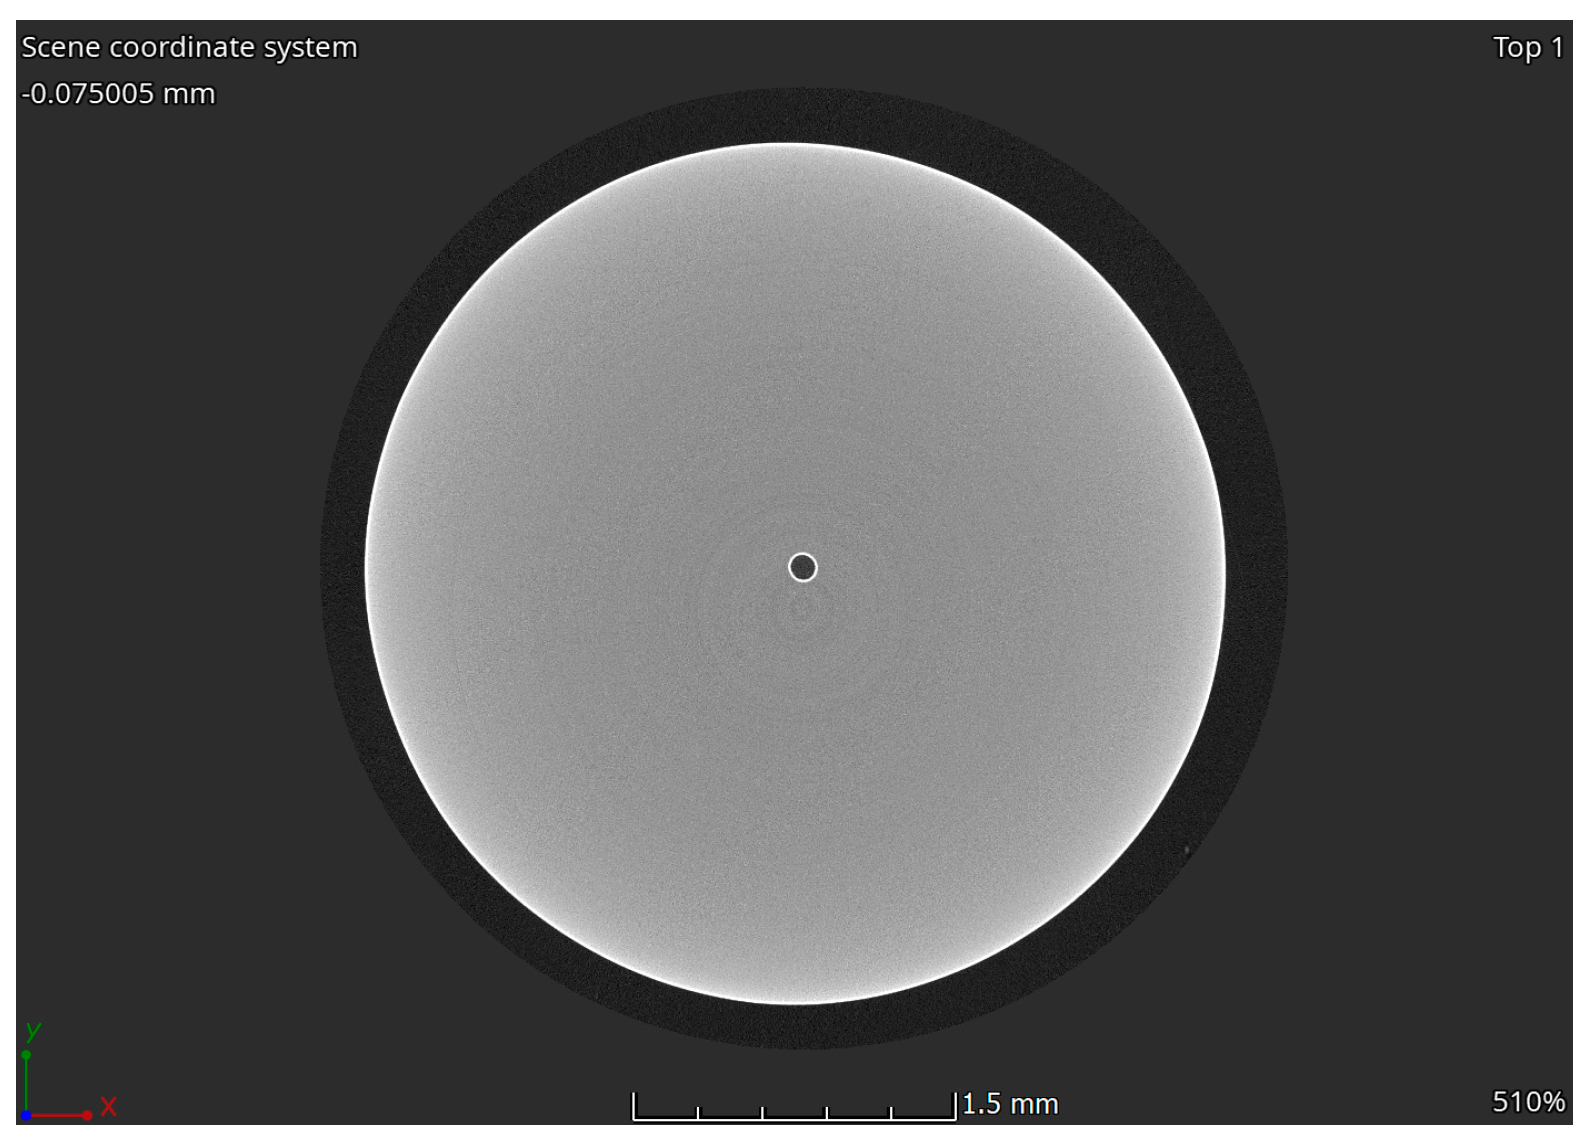
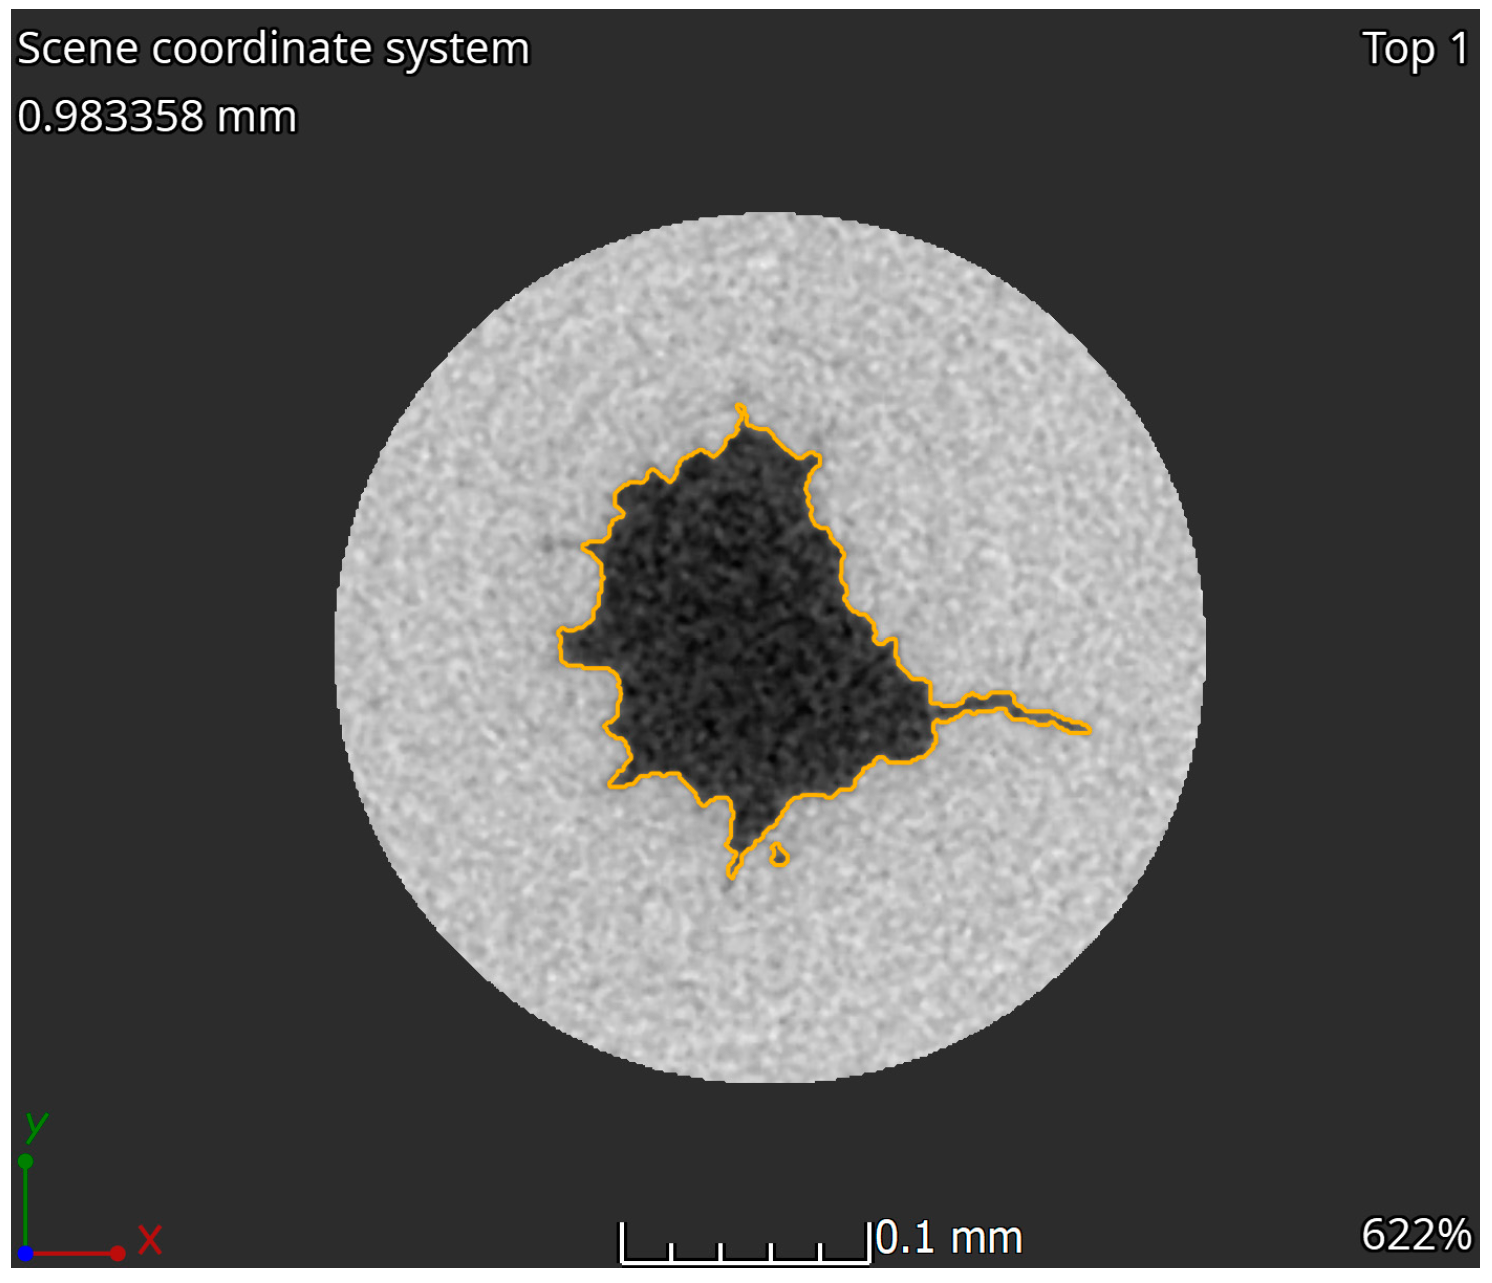
12]. Several microtubes were implemented into the pipe viscometer and characterization tests were performed to test the influence of different materials on the performance of the pipe viscometer. The knowledge of the geometrical dimensions of the microtube are essential for the calculation of the dynamic viscosity according to the Hagen–Poiseuille law. Therefore, characterization of the inner diameter of the microtube was performed by utilizing the μ-CT facility at METAS, where inner diameter is determined using X-ray diffraction [13,14]. This technique enables the determination of the inner diameter and the roundness of the micro tube at several sections along the microtube. Thus, a detailed analysis is possible and not only an average inner diameter is obtained. It turns out that glass microtubes are most suitable for the pipe viscometer as the inner diameter is circular and the cross-section revealed excellent roundness. Another method for the determining inner diameter is to measure the pressure drop as a function of flowrate and apply the Hagen–Poiseuille law with a well-known liquid (water), which is referred to as the flow calibration method in this paper. This method provides an average inner diameter of the micro tube and no information on the roundness and the variation of the inner diameter along the micro tube is available. A detailed analysis of both methods is described later in this paper for a soda glass and a stainless steel microtube.
This paper first describes the experimental setup of the pipe viscometer, the calibration procedure for the various sensors, the methods of calibration of the inner diameter of the micro tube with its measurement uncertainty, and the determination of the measurement uncertainty of the micro pipe viscometer. Then, the results of the calibration of the inner diameter of the soda glass, stainless steel and PEEK microtube are presented and the validation of the stated measurement uncertainty of the micropipe viscometer with reference liquids are reported. Finally, single measurement point analysis and a comparison with glass capillary viscometers are discussed.
The procedure for achieving traceability of the micropipe viscometer, its detailed measurement uncertainty description and validation offer new insights into the pipe viscometer method. A detailed description of the flow calibration method for calibrating the inner diameter of the microtube highlights a simple procedure for obtaining this geometrical dimension, which is an important constant in the concept of the micropipe viscometer.

2. Materials and Methods

2.1. Experimental Setup of Pipe Viscometer

The current flow facility at METAS [15] has been modified to include a section with a pipe viscometer as can be seen in Figure 1 and Figure 2. The pipe viscometer consists of a microtube with temperature and pressure sensors upstream and downstream of the microtube.
Measuring the flowrate, the pressure drop, the temperature and including the geometrical specifications of the microtube allows for calculation of the dynamic viscosity of the liquid according to the Hagen–Poisseuille equation:
η = Δ P · π · r 4 8 · Q · L ,
where η is the dynamic viscosity, ΔP is the pressure drop over the microtube, Q is the volumetric flowrate, L is the length of the micro tube, and r is the inner radius of the microtube.

2.2. Calibration of All Sensors Measuring Physical Quantities

To guarantee the traceability of the pipe viscometer, all the sensors or instruments measuring physical quantities have to be calibrated and therefore be traceable to SI units. In the next section, the different sensors or instruments are described, and their traceability discussed.

2.2.1. Piston Prover

The piston prover generates the volume flowrate, which is traceable to time and length [15]. The inner diameter of conventional glass syringes ILS from WICOM International GmbH or homemade stainless steel pistons are calibrated by the length laboratory at various positions and an average inner diameter with corresponding uncertainty is determined [16,17]. The position of the plunger of the piston is measured using the linear measuring system LMS-LIMES80-130 of the high-precision linear stage LIMES 80-130-Hi00 from OWIS GmbH (Staufen im Breisgau, Germany), which is calibrated using interferometry to obtain traceability. The linear measuring system sends pulses that are counted using an FPGA and a timestamp of the FPGA is recorded in order to form a pair of values that are the position and the corresponding timestamp. The real-time speed is then determined using a linear fit of the position as a function of time. The counter clock on the FPGA is calibrated and thus the timestamps are traceable, obtaining the speed of the piston and the calculated volume flowrate traceable to length and time.

2.2.2. Pressure Sensor

The pressure is measured using a pressure transducer UC2 from Endress+Hauer AG (Reinach, Switzerland) with a pressure range of 0–10 bar(g) and an analog output signal of 4–20 mA. The pressure sensors are calibrated regularly using a traceable pressure controller PPC3 from Fluke Calibration (Everett, WA, USA) in order to include repeatability, drift of the sensor and hysteresis effect in the measurement uncertainty calculation of the sensor. With this knowledge, the operation range of the pressure difference to fulfill the measurement uncertainty can be defined as 0.4–10 bar(g).

2.2.3. Temperature Sensor

The temperature sensors are NTC sensors R2152-F (10kOhm@25 °C) from Moser TMT AG (Hombrechtikon, Switzerland). The outer diameter of the tubing of the sensor part is 3.175 mm (1/8″). The sensor part is mounted in a Swagelok T-junction (1/8″ connectors), where the inner diameter has been perforated slightly larger than 1/8″ allowing the sensor part to be surrounded by the flowing liquid. The temperature sensors are calibrated regularly using a traceable field metrology well from Fluke Calibration (Everett, WA, USA). Repeatability, drift of the sensor and hysteresis effect are included in the measurement uncertainty calculation of the temperature sensors.

2.3. Calibration of the Geometrical Dimensions of the Micro Tube

The length and the inner diameter of the microtube have to be calibrated. The calibration of the length is daily business for the length metrology [18]. However, the calibration of the inner diameter of the microtube is more challenging. One method is to calibrate the inner diameter of the microtube by utilizing the μ-CT facility at METAS, where the inner diameter is determined using X-ray diffraction [13,14]. The other method is the flow calibration method, where the pressure drop is measured as a function of the flowrate with a reference liquid with known dynamic viscosity in order to calculate the inner diameter of the microtube according to the Hagen–Poisseuille law. Both methods were used to determine the inner diameter of the soda glass and stainless steel microtube, whereas only the flow calibration method was applied for the determination of the inner diameter of the PEEK beige microtube (Table 1). The methods are described in the next paragraphs.

2.3.1. μ-CT Method

The μ-CT method was used for the calibration of the inner diameter of the soda glass micro tube and the stainless steel microtube in order to compare it to the flow calibration method and validate the latter method.
µ-CT measurements were performed on a high-accuracy METAS-CT system [13,14]. The measurement conditions are provided in Table 2. Grey value volumes were analyzed using VG Studio MAX v3.5 (Volume Graphics) as follows: Gradient-based surface determination and subsequent least-squares fitting of cylindrical primitives to determine the mean diameter for the soda glass microtube and threshold-based segmentation and volume determination to derive an equivalent diameter of the steel microtube. Measurement uncertainties were estimated using a hybrid approach, which combines reference measurements and a CT simulation of the actual workpiece [13].

2.3.2. Flow Calibration Method

Another method for the calibration of the inner diameter of the micro tubes is the flow calibration method in the laminar regime. A reference liquid with known dynamic viscosity is used to measure the pressure drop as a function of the flowrate and to calculate the inner diameter of the microtube according to Equation (2):
r = 8 · η · Q · L π · Δ P 4 ,
where η is the dynamic viscosity, ΔP is the pressure drop over the microtube, Q is the volumetric flowrate, L is the length of the micro tube, and r is the inner radius of the micro tube.
The reference liquid chosen is pure water as the viscosity and the density formulas as a function of temperature are well established and these quantities can be determined by measuring the temperature of the pure water. The dynamic viscosity and the density of the pure water are calculated according to equations from the NIST database [19] by measuring the temperature in the tubing before and after the microtube. Measurements are performed in the corresponding flowrate range to obtain pressure drops in the range from 0.5 bar to 8.0 bar. Thus, the pressure drop over the micro tube as a function of flowrate can be fitted linearly in the laminar regime to obtain the slope ΔP/Q and then calculate the inner diameter of the micro tube.
For the determination of the inner diameter of the micro tubes with the flow calibration method, the following values of the dynamic viscosity and density of pure water were taken from the NIST database [19] (listed in Table 3), which is based on the IAPWS R12-08 [20].
The values at 1 bar absolute pressure are applied, which corresponds roughly to the ambient pressure of the laboratory conditions. The change rate of the dynamic viscosity as a function of the pressure is −4·10−5 mPa·s/bar. As the measurements are performed for pressure drops in the range from 0.5 bar to 8.0 bar, the maximum average pressure in the liquid over the full capillary is half of the maximum pressure drop, 4.0 bar. This implies a maximum change in the dynamic viscosity of 1.6·10−4 mPa·s, which corresponds to 0.016% of the dynamic viscosity at ambient conditions. This contribution is negligible as we assume the uncertainty contribution from the calculation of the dynamic viscosity of pure water with the measured temperature as 0.5% (see Table 4).

2.4. Measurement Uncertainty of the Flow Calibration Method

Several contributions to the measurement uncertainty have already been mentioned in the text above. In this paragraph, an overview of the contributions to the uncertainty is listed in Table 4 for the flow calibration method determining the inner diameter of the microtube in the pipe viscometer with a liquid of known dynamic viscosity.
The main contribution relates to the determination of the dynamic viscosity of water, where the temperature of the water is measured, and the viscosity value is calculated from the known formula of the dynamic viscosity as a function of temperature and pressure [19]. The expanded uncertainty of the temperature measurement is 0.2 °C leading to an extended uncertainty contribution of the dynamic viscosity of 0.5%. Additionally, the uncertainty of the formula is stated being 0.5% [21], which lead to an extended uncertainty contribution of 0.71% for the dynamic viscosity of water. The other important contribution is the pressure measurements upstream and downstream of the microtube leading to an extended uncertainty of 0.28% for the pressure drop measurement larger than 0.4 bar(g). Therefore, the extended uncertainty of the determination of the inner diameter is 0.20% (k = 2).
Table 4. Uncertainty contributions for the determination of the inner diameter of the microtube with water as reference liquid. All these values are either direct uncertainties from calibration certificates and/or empiric estimations.
ContributionUncertainty (k = 2)Coefficient
Piston prover for the generation of flow0.10%0.25
Length measurement of the microtube0.01%0.25
Pressure difference measured using 2 sensors of maximum pressure at 10 bar in the range of 0.4 bar(g) to 10.0 bar(g).0.28%0.25
Dynamic viscosity of water calculated according to [19] by measuring the temperature and pressure. Uncertainty of temperature measurement is 0.2 °C, leading to an uncertainty contribution of 0.50% of the dynamic viscosity. Uncertainty from the formula is 0.50% [20,21].0.71%0.25

2.5. Measurement Uncertainty of the Pipe Viscometer

Now that the extended uncertainty of the inner diameter of the microtube is determined, the uncertainty contributions of the pipe viscometer are known and are listed in Table 5. Three main contributions can be identified. The largest contribution is the measurement of the pressure drop in the microtube with an uncertainty contribution of 0.28% for pressure drops larger than 0.4 bar(g). Other important contributions are the uncertainty of the inner diameter of the microtube being 0.20% and the uncertainty of single-point analysis for the determination of the dynamic viscosity being 0.20%. The latter was determined empirically by analyzing several sets of data, where the linear fit method and the single point analysis were used for the determination of dynamic viscosity and the additional contribution to it. Therefore, the expanded uncertainty was set to 0.90% for the pipe viscometer build with the glass micro tube.

3. Results and Discussion

3.1. Calibration of the Inner Diameter of the Microtube

3.1.1. Soda Glass Microtube Using the μ-CT Method

Figure 3 shows the cross section of the soda glass microtube with a nominal inner diameter of 0.130 mm determined by means of the μ-CT method. The surface of the cylindrical hole is identified to determine the inner diameter of the microtube, as can be seen in Figure 4. The average inner diameter of the soda glass microtube measured at nine different positions is (0.1269 ± 0.0010) mm.

3.1.2. Stainless Steel Microtube Using the μ-CT Method

The stainless steel microtube with a nominal inner diameter of 0.150 mm was also characterized using the μ-CT method. It reveals noncircular cross-sections, as shown in Figure 5. Therefore, the surface areas of the cross sections were, determined and an equivalent inner diameter was calculated from the equivalent circular area according to i n n e r d i a m e t e r = 2 c r o s s s e c t i o n / π . The result of the equivalent inner diameter is (0.144 ± 0.010) mm. The uncertainty is dominated by the variation in the equivalent diameter along the microtube. This result is close to the nominal diameter specified by the manufacturer.

3.1.3. Glass, Stainless Steel and PEEK Microtube Using the Flow Calibration Method

The flow calibration method shows laminar flow behavior over the full range of the generated flow rates as shown in Figure 6 for the glass, stainless steel and PEEK beige microtube. The data were fitted with a linear fit with forced zero intercept to obtain the slope ΔP/Q. As mentioned earlier, the inner diameter is then calculated according to Equation (2) by taking into account the slope of the fit ΔP/Q, the dynamic viscosity of pure water obtained by calculation with the measured temperature and the length of the microtube. The results are listed in Table 6.
It is important to mention here that the two pressure drops of the connectors between the ends of the microtube and the pressure sensors have to be taken into account if they are not negligible compared to the main pressure drop over the microtube. Otherwise, the inner diameter is underestimated. This correction has been applied in these measurements, although the nominal inner diameter of the micro tubes are of an order of 0.13–0.15 mm and much smaller than the inner diameter of the connectors (more than 2 mm for this setup). Thus, the corrections due to the pressure drop in the connectors are negligible compared to the main pressure drop over the micro tube.
The results of the inner diameter of the soda glass micro tube obtained with both methods are in perfect agreement. For the case of the stainless steel micro tube, the structure of the cross-sections lead to the assumption that the hydrodynamic diameter has to be smaller, as the structure represents a more random surface with a high surface roughness instead of a circular cross-section with smooth surface roughness. Thus, both methods show different results, as expected. Therefore, the stainless steel microtube is less feasible for the pipe viscometer.

3.2. Validation of the Pipe Viscometer with Reference Liquids

The pipe viscometer was then validated by measuring the dynamic viscosity of reference liquids. These reference liquids have certificates for the density and dynamic viscosity as a function of temperature and are traceable to SI-units [22]. Three reference liquids with dynamic viscosities in the range from 1.5 mPa·s to 4.0 mPa·s were measured at the liquid temperature of 21.3 °C and their dynamic viscosities and densities are listed in Table 7. The certificates of the reference liquids contain the reference values at temperatures 20 °C, 23 °C, 25 °C, 30 °C and 40 °C. A linear fit of the first order was applied to the data of the density and a linear fit of the second order was applied to the date of the dynamic viscosity to obtain the values at a measurement temperature of 21.3 °C, which corresponds to the liquid temperature in the tubing being measured using several temperature sensors.
The three reference liquids “2AW”, “2BW” and “5AW” were calibrated using a pipe viscometer with the three microtubes in Table 4 and the results are listed in Table 8. The measurement data with the pipe viscometer including the soda glass microtube are shown in Figure 7, where the pressure drop is shown as a function of the flow rate. The data were fitted with a linear fit with forced zero intercept to obtain the slope ΔP/Q. The dynamic viscosity was then calculated according to Equation (1) by taking into account the slope of the fit ΔP/Q, the length and the inner diameter of the microtube. The calibration results are consistent with the reference values (Table 7) within the expanded uncertainty of this pipe viscometer, 0.90%. The calibration results of the three reference liquids lead to a deviation with respect to the reference values between +0.42% and +0.43%, which seems to be a systematic deviation, as the deviation is nearly the same for all three reference liquids. However, the deviations are smaller than the stated measurement uncertainty of 0.90%.
The pipe viscometer with the stainless steel micro tube and the PEEK beige micro tube show larger deviations for all three reference liquids and are not consistent within the measurement uncertainties with the reference values. The noncircular shape of the stainless steel micro tube is probably one of the reasons for the large deviations as the inner surface of the micro tube shows large irregularities, which do not meet the requirements for the law of Hagen–Poisseuille. The reason for the large deviations in the PEEK beige micro tube are not obvious and further investigations are needed to fully understand these results.
All these measurement results show that the soda glass microtube is the most suitable microtube. Therefore, single measurement point analysis was investigated for the pipe viscometer including the soda glass microtube.

3.3. Single Measurement Point Analysis

The linear fit with forced zero intercept over a range of pressure drops as a function of flow rate is one method used to obtain the quotient ΔP/Q. The reason for forcing the intercept to zero is to compare the result from the linear fit over the measured flow rate range in the laminar regime to the results obtained using single measurement point analysis. This means that the quotient ΔP/Q is calculated from a single measurement. The results of the single measurement point analysis of the measurement with the pipe viscometer including the soda glass microtube and the reference liquid “2BW” are listed in Table 9. The single measurement point analysis results are very consistent with the result from the linear fit analysis. Although the result for the lowest pressure drop of 0.56 bar shows a larger deviation, it is still consistent within the measurement uncertainty with the result of the linear fit over the full range.
Note that the pressure measurement downstream of the microtube is performed with a pressure sensor of maximum 10 bar and measures pressures of the order of tens of mbar with an uncertainty of 10 mbar. This might be the reason for the larger deviation at the lowest pressure drop. One option for improvement is the use of a pressure sensor downstream of the microtube with a lower maximum pressure at an order of 0.5 bar. Additionally, measurements at zero flow leading to zero pressure drop for the verification of the indication of the pressure sensors can be performed to investigate if there are systematic deviations due to short time drift.

3.4. Comparison with Glass Capillary Viscometers

The measurement uncertainty of the micro pipe viscometer has also been validated by a comparison between several metrology institutes, which use either a pipe viscometer or a glass capillary viscosity meter to determine the dynamic viscosity or the kinematic viscosity, which is transformed into the dynamic viscosity with the measured density of the liquid [2,23]. Eight different liquids were used and all the details of the comparison can be found in the references mentioned above. Only the results of two liquids measured by three pipe viscometers (METAS, RISE and NEL) and two glass capillary viscosity meters (NQIS/EIM and KRISS) with the corresponding reference value for the dynamic viscosity of the liquids are listed in Table 10. Liquid C is a 10%wt glucose solution and liquid E is a solution of 0.22%wt NaCl and 5.55%wt glucose. The calculation of the reference value and the consistency check of the results is explained in detail in [2]. The results shown here are consistent within the measurement uncertainty and strengthen the stated measurement uncertainty of the pipe viscometer described in this paper.

4. Conclusions

Extensive investigations for the characterization of the pipe viscometer for the traceable inline measurement of dynamic viscosity for flowrates from 1 μL/min to 150 mL/min and pressure drops up to 10 bar were presented. The glass microtube is the best option and was therefore integrated in the pipe viscometer, leading to the extended uncertainty of the pipe viscometer being 0.90%. The stated measurement uncertainty was validated with measurements of three traceable reference liquids for the dynamic viscosity, where the deviations were either (0.43 ± 0.90)% or (0.42 ± 0.90)%. Comparison with other pipe viscometers and glass capillary viscosity meters showed consistent results with the reference values within the stated uncertainties, and more details can be found in Reference [
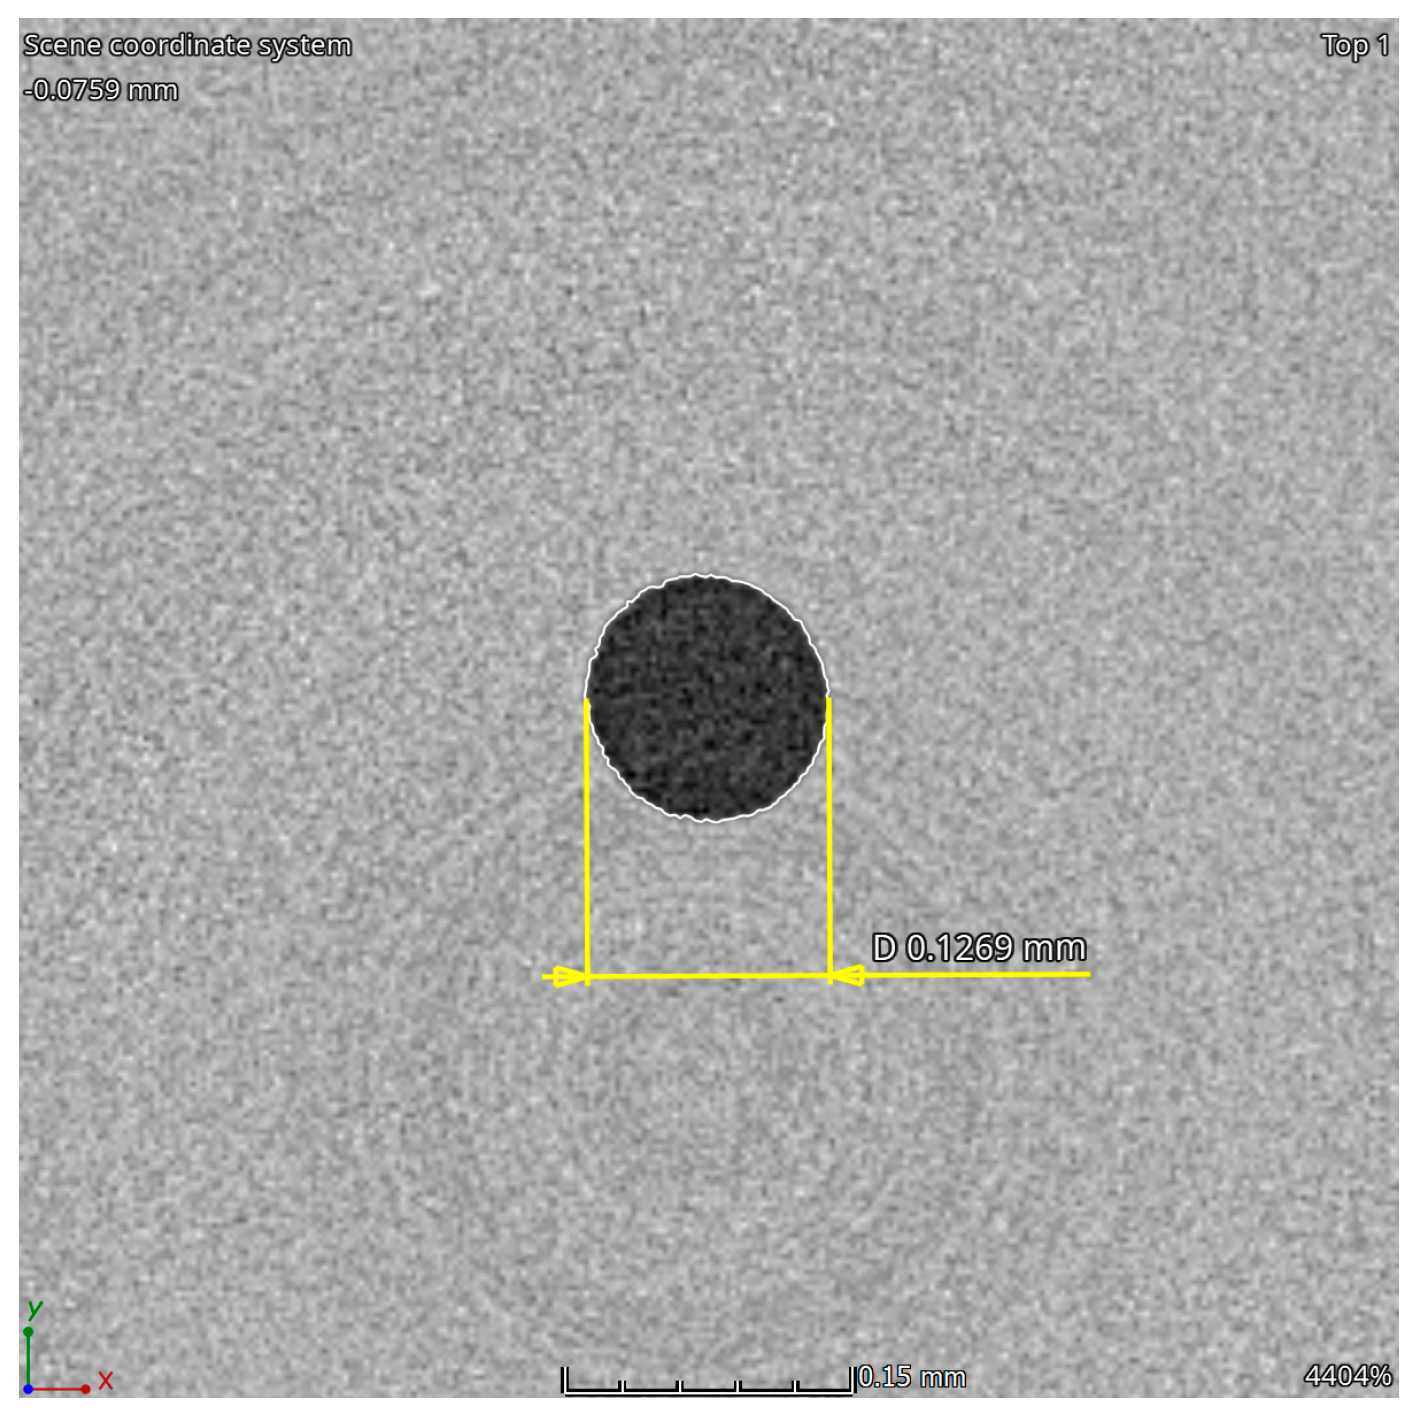
2]. Additionally, the glass microtube was characterized by utilizing the μ-CT facility at METAS. These measurements also showed consistent results for the inner diameter of (0.1269 ± 0.0010) mm compared to the flow calibration method, where an inner diameter of (0.1267 ± 0.0003) mm was determined. These consistent results validate both methods for determining the inner diameter of the glass microtube and the stated measurement uncertainty of the pipe viscometer was validated by the consistent results of the measurements of the dynamic viscosity of the various liquids reported in this paper.
The determination of the dynamic viscosity with the linear fit method over several measurement data or the single-point method with a single measurement is possible as long as the pressure drop is not too small compared to the resolution of the pressure sensors installed.

Author Contributions

Conceptualization, H.B.; methodology, H.B. and B.A.B.; validation, B.A.B., S.N. and H.B.; formal analysis, B.A.B. and S.N.; investigation, B.A.B., S.N. and H.B.; writing—original draft preparation, H.B.; writing—review and editing, H.B., B.A.B. and M.d.H.; supervision, M.d.H. All authors have read and agreed to the published version of the manuscript.

Funding

This research received no external funding.

Institutional Review Board Statement

Not applicable.

Informed Consent Statement

Not applicable.

Data Availability Statement

The data presented in this study are available on request from the corresponding author. Most of the relevant data are already presented in the tables.

Conflicts of Interest

The authors declare no conflict of interest.

References

  1. Bissig, H.; Tschannen, M.; de Huu, M. Liquid properties effects on Coriolis and thermal mass flow meters at very low flow rates. In Proceedings of the Flomeko 2016, Sydney, Australia, 26–29 September 2016. [Google Scholar]
  2. Bissig, H.; Büker, O.; Stolt, K.; Graham, E.; Wales, L.; Furtado, A.; Moura, S.; Metaxiotou, Z.; Lee, S.H.; Kartmann, S.; et al. In-line measurements of the physical and thermodynamic properties of single and multicomponent liquids. Biomed. Eng./Biomed. Tech. 2023, 68, 39–50. [Google Scholar] [CrossRef] [PubMed]
  3. Richter, M.; Woias, P.; Weiss, D. Microchannels for applications in liquid dosing and flow-rate measurement. Sens. Actuators A Phys. 1997, 62, 480–483. [Google Scholar] [CrossRef]
  4. Draad, A.A.; Kuiken, G.D.C.; Nieuwstadt, F.T.M. Laminar-turbulent transition in pipe flow for Newtonian and non-Newtonian fluids. J. Fluid Mech. 1998, 377, 267–312. [Google Scholar] [CrossRef]
  5. Haavisto, S.; Liukkonen, J.; Jäsberg, A.; Koponen, A.; Lille, M.; Salmela, J. Laboratory scale pipe rheometry: A study of a microfibrillated cellulose suspension. Pap. Conf. Trade Show 2011, 357–370. Available online: https://www.tappi.org/content/events/11papercon/documents/330.350.pdf (accessed on 10 May 2023).
  6. Salipante, P.F.; Dharmaraj, V.L.; Hudson, S.D. Entrance effects and high shear rate rheology of shear-banding wormlike micelle fluids in a microcapillary flow. J. Rheol. 2020, 64, 481. [Google Scholar] [CrossRef]
  7. Ouriev, B.; Windhab, E. Rheological study of concentrated suspensions in pressure-driven shear flow using a novel in-line ultrasound Doppler method. Exp. Fluids 2002, 32, 204–211. [Google Scholar] [CrossRef]
  8. Birkhofer, B.; Debacker, A.; Russo, S.; Ricci, S.; Lootens, D. In-Line Rheometry Based on Ultrasonic Velocity Profiles: Comparison of Data Processing Methods. Appl. Rheol. 2012, 22, 44701. [Google Scholar] [CrossRef]
  9. Wiklund, J.; Shahram, I.; Stading, M. Methodology for in-line rheology by ultrasound Doppler velocity profiling- and pressure difference technique. Chem. Eng. Sci. 2007, 62, 4277–4293. [Google Scholar] [CrossRef]
  10. VLO-M1 Sensor from TrueDyne Sensors, AG. Available online: https://www.truedyne.com/viscosity_sensors_for_liquids/vlo-m1-for-liquids/?lang=en (accessed on 10 May 2023).
  11. DVM Sensor from Rheonics GmbH. Available online: https://rheonics.com/products/hpht-pvt-density-meter-viscometer-dvm/ (accessed on 10 May 2023).
  12. Neuhaus, S.; Bissig, H.; Bircher, B.A.; de Huu, M. Presentation of the METAS pipe viscometer. In Proceedings of the Flomeko 2022, Chongqing, China, 17–21 October 2022. [Google Scholar]
  13. Bircher, B.A.; Meli, F.; Küng, A.; Thalmann, R. METAS-CT: Metrological X-ray computed tomography at sub-micrometre precision. In Proceedings of the Euspen’s 20th International Conference & Exhibition, Geneva, Switzerland, 8–12 June 2020. [Google Scholar]
  14. Bircher, B.A.; Meli, F.; Küng, A.; Thalmann, R. X-ray source tracking to compensate focal spot drifts for dimensional CT measurements. In Proceedings of the 10th Conference on Industrial Computed Tomography, Wels, Austria, 4–7 February 2020. [Google Scholar]
  15. Bissig, H.; Tschannen, M.; de Huu, M. Recent Innovations in the field of traceable calibration of liquid milli-flow rates with liquids other than water. In Proceedings of the Flomeko 2016, Sydney, Australia, 26–29 September 2016. [Google Scholar]
  16. METAS, Laboratory “Length, Nano- and Microtechnology”, Metrological X-ray Computed Tomography (XCT), METAS-CT. Available online: https://www.metas.ch/metas/en/home/fabe/laenge/computed-tomography.html (accessed on 10 May 2023).
  17. METAS, Laboratory “Length, Nano- and Microtechnology”, Nano- and Microtechnology, Micro Coordinate Metrology. Available online: https://www.metas.ch/metas/en/home/fabe/laenge/nano-and-microtechnology.html (accessed on 10 May 2023).
  18. METAS, Laboratory “Length, Nano- and Microtechnology”, Length and Form. Available online: https://www.metas.ch/metas/en/home/fabe/laenge/length-and-form.html (accessed on 10 May 2023).
  19. Lemmon, E.W.; Bell, I.H.; Huber, M.L.; McLinden, M.O. NIST Standard Reference Database 23: Reference Fluid Thermodynamic and Transport Properties-REFPROP, Version 10.0; National Institute of Standards and Technology, Standard Reference Data Program: Gaithersburg, MD, USA, 2018. [CrossRef]
  20. IAPWS R12-08; Release on the IAPS Formulation 2008 for the Viscosity of Ordinary Water Substance. International Association for the Properties of Water and Steam: Berlin, Germany, 2008.
  21. Huber, M.L.; Perkins, R.A.; Laesecke, A.; Friend, D.G. New International Formulation for the viscosity of H2O. J. Phys. Chem. Ref. Data 2009, 38, 101. [Google Scholar] [CrossRef]
  22. ZMK Zentrum für Messen und Kalibrieren & ANALYTIK GmbH, Bitterfeld-Wolfen, Germany. Available online: www.zmk-wolfen.de (accessed on 10 May 2023).
  23. EURAMET. Validation of the Pipe Viscometers (Primary Standards) for the In-Line Measurement of the Dynamic Viscosity of Newtonian Liquids. Report A2.1.4, EURAMET, Braunschweig 2022. Available online: www.drugmetrology.com (accessed on 10 May 2023).
Figure 1. Schematic setup of the pipe viscometer with temperature (T) and pressure (P) sensors upstream and downstream of the microtube.
Applsci 13 05984 g001
Figure 2. The micro pipe viscometer at METAS: (A) piston prover, (B) temperature sensors, (C) pressure sensors and (D) the glass microtube with an inner diameter of 0.13 mm and a length of 200 mm.
Applsci 13 05984 g002
Figure 3. Cross-section of the glass microtube determined by means of μ-CT method.
Applsci 13 05984 g003
Figure 4. Zoomed-in cross section of the microtube shown in Figure 3 for the determination of inner diameter using the μ-CT method. The average inner diameter of the soda glass microtube measured at nine different positions is (0.1269 ± 0.0010) mm.
Applsci 13 05984 g004
Figure 5. Cross-section of the stainless steel microtube determined by means of the μ-CT method. Due to the noncircular shape of the cross sections, the volumes were determined to calculate an equivalent inner diameter as (0.144 ± 0.010) mm.
Applsci 13 05984 g005
Figure 6. Pressure drop as a function of flow rate for the laminar flow of water through the soda glass micro tube (light blue circle), stainless steel microtube (black triangles) and PEEK Beige microtube (beige diamonds).
Applsci 13 05984 g006
Figure 7. Pressure drop as a function of flowrate flow through the glassmicro tube of reference liquid 2AW (blue open circles), reference liquid 2BW (violet solid squares) and reference liquid 5AW (dark blue open squares) with the corresponding linear fit with forced zero intercept.
Applsci 13 05984 g007
Table 1. The materials and dimensions of the different tested microtubes. The length and the inner diameter are nominal values from the specifications of the manufacturers.
MaterialLength (mm)Nominal Inner Diameter (mm)
Soda glass200.00.130
Stainless steel300.00.150
PEEK beige981.00.150
Table 2. µ-CT measurement conditions.
ParameterSoda Glass Micro TubeStainless Steel Micro Tube
Positions92
X-ray tube voltage100 kV160 kV
Target power10 W5 W
X-ray filter0.03 mm Al0.1 mm Cu
Exposure time1.3 s5.5 s
Projections800800
Voxel size2.8 μm1.0 μm
Table 3. Density and dynamic viscosity of water according to the NIST database [19] at a temperature of 21.3 °C and several values of absolute pressure.
Reference LiquidAbsolute Pressure (bara)Dynamic Viscosity (mPa·s)Density (kg/m3)
H2O1.00.97052997.93
H2O2.00.97048997.97
H2O4.00.97041998.07
H2O8.00.97026998.25
Table 5. Uncertainty contributions of the pipe viscometer for the determination of the dynamic viscosity. All values are either direct uncertainties from calibration certificates and/or empirical estimations.
ContributionUncertainty (k = 2)Coefficient
Piston prover for the generation of flow0.10%1.0
Length measurement of the microtube0.01%1.0
Pressure difference measured using 2 sensors of maximum pressure at 10 bar in the range of 0.4 bar(g) to 10.0 bar(g).0.28%1.0
Inner diameter of microtubes determined with the pipe viscometer and reference liquid (water).0.20%4.0
Single-point analysis at each flowrate for a given pressure drop vs. linear regression over the flowrate range.0.20%1.0
Table 6. Determination of the inner diameter by means of the flow calibration and μ-CT methods. The results include the expanded uncertainty (k = 2).
MaterialFlow Calibration Method (mm)μ-CT Method (mm)
Soda glass0.1267 ± 0.00030.1269 ± 0.0010
Stainless steel0.1257 ± 0.00030.144 ± 0.010
PEEK beige0.1515 ± 0.0004Not applied
Table 7. Reference liquids [22] with traceable density and dynamic viscosity at a temperature of 21.3 °C with the stated expanded (k = 2) uncertainty of 0.20% for the dynamic viscosity and 0.1 kg/m3 for the density.
Reference Liquid NameDynamic Viscosity (mPa·s)Density (kg/m3)
2AW1.5319 ± 0.0031751.2 ± 0.1
2BW2.1913 ± 0.0044764.7 ± 0.1
5AW4.0393 ± 0.0081785.3 ± 0.1
Table 8. The determination of the dynamic viscosities of reference liquids 2AW, 2BW, 5AW [22] by means of a pipe viscometer in the laminar regime. The uncertainty (k = 2) of the pipe viscometer is 0.90%.
Material 2AW2BW5AW
Soda glassDynamic viscosity (mPa·s)1.53842.20054.0563
Deviation incl. uncertainty (%)0.43 ± 0.900.42 ± 0.900.43 ± 0.90
Stainless steelDynamic viscosity (mPa·s)1.50902.15173.9797
Deviation incl. uncertainty (%)−1.50 ± 0.90−1.81 ± 0.90−1.48 ± 0.90
PEEK beigeDynamic viscosity (mPa·s)1.51412.16713.9928
Deviation incl. uncertainty (%)−1.16 ± 0.90−1.10 ± 0.90−1.15 ± 0.90
Table 9. Dynamic viscosity η of the reference liquid “2BW” determined using a pipe viscometer with the soda glass microtube.
Method/Pressure Drop (bar)η @ 21.3 °C (mPa·s)Deviation to Reference (%)
Linear fit/full range
ΔP = 0.56–6.70
2.201 ± 0.0200.42 ± 0.90
Single point/ΔP = 6.702.203 ± 0.0200.54 ± 0.90
Single point/ΔP = 6.152.200 ± 0.0200.39 ± 0.90
Single point/ΔP = 5.582.199 ± 0.0200.33 ± 0.90
Single point/ΔP = 5.022.200 ± 0.0200.41 ± 0.90
Single point/ΔP = 4.462.202 ± 0.0200.47 ± 0.90
Single point/ΔP = 3.912.202 ± 0.0200.48 ± 0.90
Single point/ΔP = 3.352.193 ± 0.0200.08 ± 0.90
Single point/ΔP = 2.782.195 ± 0.0200.16 ± 0.90
Single point/ΔP = 1.672.197 ± 0.0200.27 ± 0.90
Single point/ΔP = 1.112.195 ± 0.0200.19 ± 0.90
Single point/ΔP = 0.562.219 ± 0.0201.27 ± 0.90
Table 10. Dynamic viscosity of the liquids measured by means of pipe viscometers and glass capillary viscometers at temperature of 22 °C [2,23].
FacilityLiquid CLiquid E
METAS1.810 ± 0.0171.110 ± 0.010
RISE1.800 ± 0.0371.112 ± 0.023
NEL1.795 ± 0.0181.123 ± 0.012
NQIS/EIM1.823 ± 0.0191.119 ± 0.012
KRISS1.803 ± 0.0361.107 ± 0.023
Reference value1.809 ± 0.0091.116 ± 0.006
Disclaimer/Publisher’s Note: The statements, opinions and data contained in all publications are solely those of the individual author(s) and contributor(s) and not of MDPI and/or the editor(s). MDPI and/or the editor(s) disclaim responsibility for any injury to people or property resulting from any ideas, methods, instructions or products referred to in the content.

