Article

The Effect of Scaling Building Configuration Blast Experiments on Positive Phase Blast Wave Parameters

by
Sherlyn Gabriel
1,*,
Jack Denny
2,
Steeve Chung Kim Yuen
1,
Genevieve S. Langdon
1,3 and
Reuben A. Govender
1
1
Blast Impact Survivability Research Centre (BISRU), Department of Mechanical Engineering, University of Cape Town, Rondebosch 7700, South Africa
2
Department of Civil, Maritime & Environmental Engineering, University of Southampton, Boldrewood Innovation Campus, Burgess Road, Southampton SO16 7QF, UK
3
Department of Civil and Structural Engineering, University of Sheffield, Mappin Street, Sheffield S1 3JD, UK
*
Author to whom correspondence should be addressed.
Appl. Sci. 2023, 13(10), 5956; https://doi.org/10.3390/app13105956
Submission received: 5 April 2023 / Revised: 5 May 2023 / Accepted: 6 May 2023 / Published: 12 May 2023
(This article belongs to the Special Issue Explosion Effects in the Built Environment)

Abstract

:
Explosions in an urban setting can have a significant negative impact. There is a need to further understand the loading effects caused by the blast’s interaction with structures. In conjunction with this, the effects of scaling and understanding the limitations of laboratory experiments are equally important given the cost incurred for full-scale experiments. The aim of this study was to determine the scaling effects on blast wave parameters found for reduced-scale urban blast scenario laboratory experiments. This paper presents the results of numerical modelling and physical experiments on detonating cuboidal PE-4 charges and measuring the pressure in direct line of sight and at three distinct positions around the corner of a small-scale “building” parallel to the rear wall. Two scales were used, namely 75% and 100%. Inter-scaling between 75% and 100% worked fairly well for positions shielded by the corner of the wall. Additionally, the lab-scale results were compared to similar (but not identical) field trials at an equivalent scale of 250%. The comparison between lab-scale idealised testing and the larger-scale field trials published by Gajewksi and Sielicki in 2020, indicated sensitivity to factors such as detonator positioning, explosive material, charge confinement/mounting, building surface roughness, and environment.

1. Introduction

In 2018, more than 55% of the global population resided in urban areas, with the percentage rising to over 70% in Europe and the Americas [1,2]. By 2030, urban areas are expected to house 60% of the world’s population. When the population becomes concentrated in densely populated cities and informal urban settlements, the resilience of these areas to natural and manufactured shocks becomes increasingly important.
The changing nature of military conflict (the development of hypersonic weapons, the re-emergence of armed conflict in Europe, increases in terrorist activity, and the rise of asymmetric warfare tactics) has left cityscapes vulnerable to explosions in ways not previously envisaged. The proximity of large populations to industrial regions (caused by urban sprawl) makes accidental explosions in urban areas of particular concern. Recent examples of lives lost and infrastructure damage due to explosions include the devastation in Ukraine following the Russian invasion [3], the tragic 2020 Beirut port explosion [4,5], and most recently, a gas tanker blast at a hospital in Boksburg, South Africa, which resulted in 41 deaths [6]. Action on Armed Violence (AOAV) has collected extensive data on the casualty rates when explosive weapons are used in towns and cities, finding that 91% of the casualties are civilians [7].
Improving the resilience of urban areas to explosions is an enormous undertaking that needs to be informed by an improved understanding of the shock pressure and thermal loads caused by explosions and their propagation in geo-spatially complex urban centres. While a great deal is known about free-field explosions and their propagation across large distances without the presence of obstacles [8,9,10], research efforts are currently focussed on various built environment aspects as these are far less well understood. These include building geometry in singular structure experiments [11,12,13,14], environmental landscapes [15], protective structures [16,17], and the influence of cities [18,19,20] and street configurations [20,21], for example. For a review of blast wave interaction effects with structures conceptualised as obstacles, the reader is directed to Isaac et al. [22], while Radcliff et al. [23] contain a comprehensive review of blast loading in urban settings.
Blast loading effects are fairly well known for an isolated building, particularly the pressures reflected from the side of the building directly facing the explosive. Yet, prior to work conducted by Gajewski and Sielicki [11], little was known about the blast wave behaviour behind the building corner (of an isolated building) parallel to an explosive detonation. This would be an important feature for relatively small stand-off distances, as this may be an area where people could seek refuge. The results obtained [11] were compared with blast injury criteria, specifically for lung and eardrum damage. It would seem that the person would be safer behind the corner for the positions and TNT masses concerned. Denny et al. [24] performed further numerical simulations using Autodyn and concluded that the corner offered shielding effects that lowered the risk of primary blast injuries. Gajewski and Sielicki [11] also found good agreement between empirical formulae and data from experimental tests, leading to the possibility that the loading overpressure profiles in the experimental study could be used for benchmark comparisons.
A necessary step to understanding the effects of blast loading on cityscapes is conducting experiments. However, performing large-scale field tests comes with logistical challenges that include financial and space implications. As laboratory studies are usually conducted at a smaller scale than real-life city explosions (for reasons of space availability, cost, and repeatability), the ability to perform small-scale “urban explosion” test cases to validate city-scale predictive modelling would be extremely attractive. Additionally, Shi et al. [19] found that a large body of small-scale explosive trials can provide researchers with a reliable understanding of the structure’s effects on blast wave propagation. Furthermore, it is important to determine whether these scaling laws are valid for an isolated building outside the areas of well-known blast-facing scenarios prior to tackling the complexities found in cityscapes.
Less is known about whether scaling methods that apply readily to free-field explosions can be applied to urban explosive events without modification. This paper provides novel insight into the influence of scaling urban explosive detonations to a laboratory scale. Findings are reported from a series of reduced-scale blast experiments designed to examine an urban blast scenario involving a rigid corner structure (Figure 1). Through a comparison of models and experiments conducted at different scales, this paper evaluates the capability of geometrically similar scaling methods to “transform” measurements obtained from small-scale urban blast scenarios (where blast–structure interaction effects are prominent) to predict blast parameters at larger scales. While this has been previously explored for free-field explosions, it has not been considered for scenarios relevant to urban areas that are characterised by far more complex loading.

2. Materials and Methods

2.1. Experimental Design

Eight lab-scale experiments were undertaken using the blast chamber facility at the Blast Impact and Survivability Research Unit (BISRU) at the University of Cape Town (UCT). The lab-scale experiments involved detonating small cuboidal charges of PE-4 in close proximity to a rigid structure, as shown in Figure 1, imitating an explosion near the corner of a building. Four tests were conducted at each scale, 75% and 100%, respectively (so each test scale has four sets of data due to the repeat detonations). The distance RA, which was equal to the height of the sensor hs, measured 405 and 540 mm. Additionally, the distance between B gauges (xb) was 150 and 200 mm for the 75% and 100% scaled tests, respectively. The blast overpressure histories were measured at four positions (A, B1–B3) to allow additional comparisons to field trial data reported by Gajewski and Sielicki [11].

2.1.1. Scaling Charge Mass

In this study, Hopkinson–Cranz (H–C) scaling [25,26] was used to compare the test results at different length scales. For near-identical charge shapes and ambient conditions, this scaling law states that two explosions are expected to produce identical blast waves at distances that are proportional to the cube root of the respective energy release. Since the energy within the explosive is directly proportional to its mass, denoted as W, the concept of scaled distance Z establishes a relationship between blast wave parameters in a free-field environment [10]. This relationship is illustrated in Equation (1), where R represents the stand-off distance:
Z = R W 3
According to the H–C scaling law, pressures and velocities remain unchanged across scales since similar blast waves are generated. However, arrival times, durations, and impulses are scaled by the length scale factor K, as shown in Equation (2):
Z = R W 3 = K R K 3 W 3
In order to facilitate a comparison with the 400 g series of field tests conducted by [11], this study used two reduced-scale PE-4 charges of W100% and W75%, amounting to 21.3 g and 9.0 g of PE-4, respectively (equivalent to 25.6 g TNT and 10.8 g TNT, respectively). This calculation was performed using Equation (2) while assuming a TNT equivalence factor of 1.2 for PE-4 [27]. The charge masses were shaped into a cuboid with an approximate ratio of width:height:length = 1:1:2. For consistency, a 3D-printed mould was used to shape the charge, and its cross-section dimensions were maintained when the detonator was inserted. The explosive was positioned in such a manner that the long side faced the front face of the wall. Specifically, its longitudinal axis was parallel to the wall, as depicted in Figure 1.

2.1.2. Scaling Corner Feature

Corner structures were manufactured from 10 mm thick steel plates to have exterior dimensions of 400 × 700 mm and a height of 1080 mm (at 100% scale) and 300 × 525 mm and 810 mm high (75% scale), as shown in Figure 2. The steel plates on the sides and top surfaces were attached to a 50 × 50 × 4 mm square hollow section steel frame assembly. The corner structures were designed to exhibit near-rigid (minimal elastic response) behaviour when subjected to blast loading to ensure minimal energy absorption through fluid–structure interaction (FSI) effects. This was to ensure a comparison of blast propagation between the reduced-scale tests and field trial data [11].
The corner structures were attached to a 1100 × 1100 × 12 mm S355 square steel base plate that represented the ground surface. The corner structure and base plate surfaces were painted in white as shown in Figure 2. The experimental set-up was carefully designed to ensure blast wave reflections from the blast chamber walls did not interfere with the initial measurements at pressure gauge locations. Additionally, efforts were made to minimise damage to equipment inside the blast chamber. Wire-cut polystyrene supports were used to position the explosive charges above the base plate and were manually adjusted to the intended position, as shown in Figure 2.

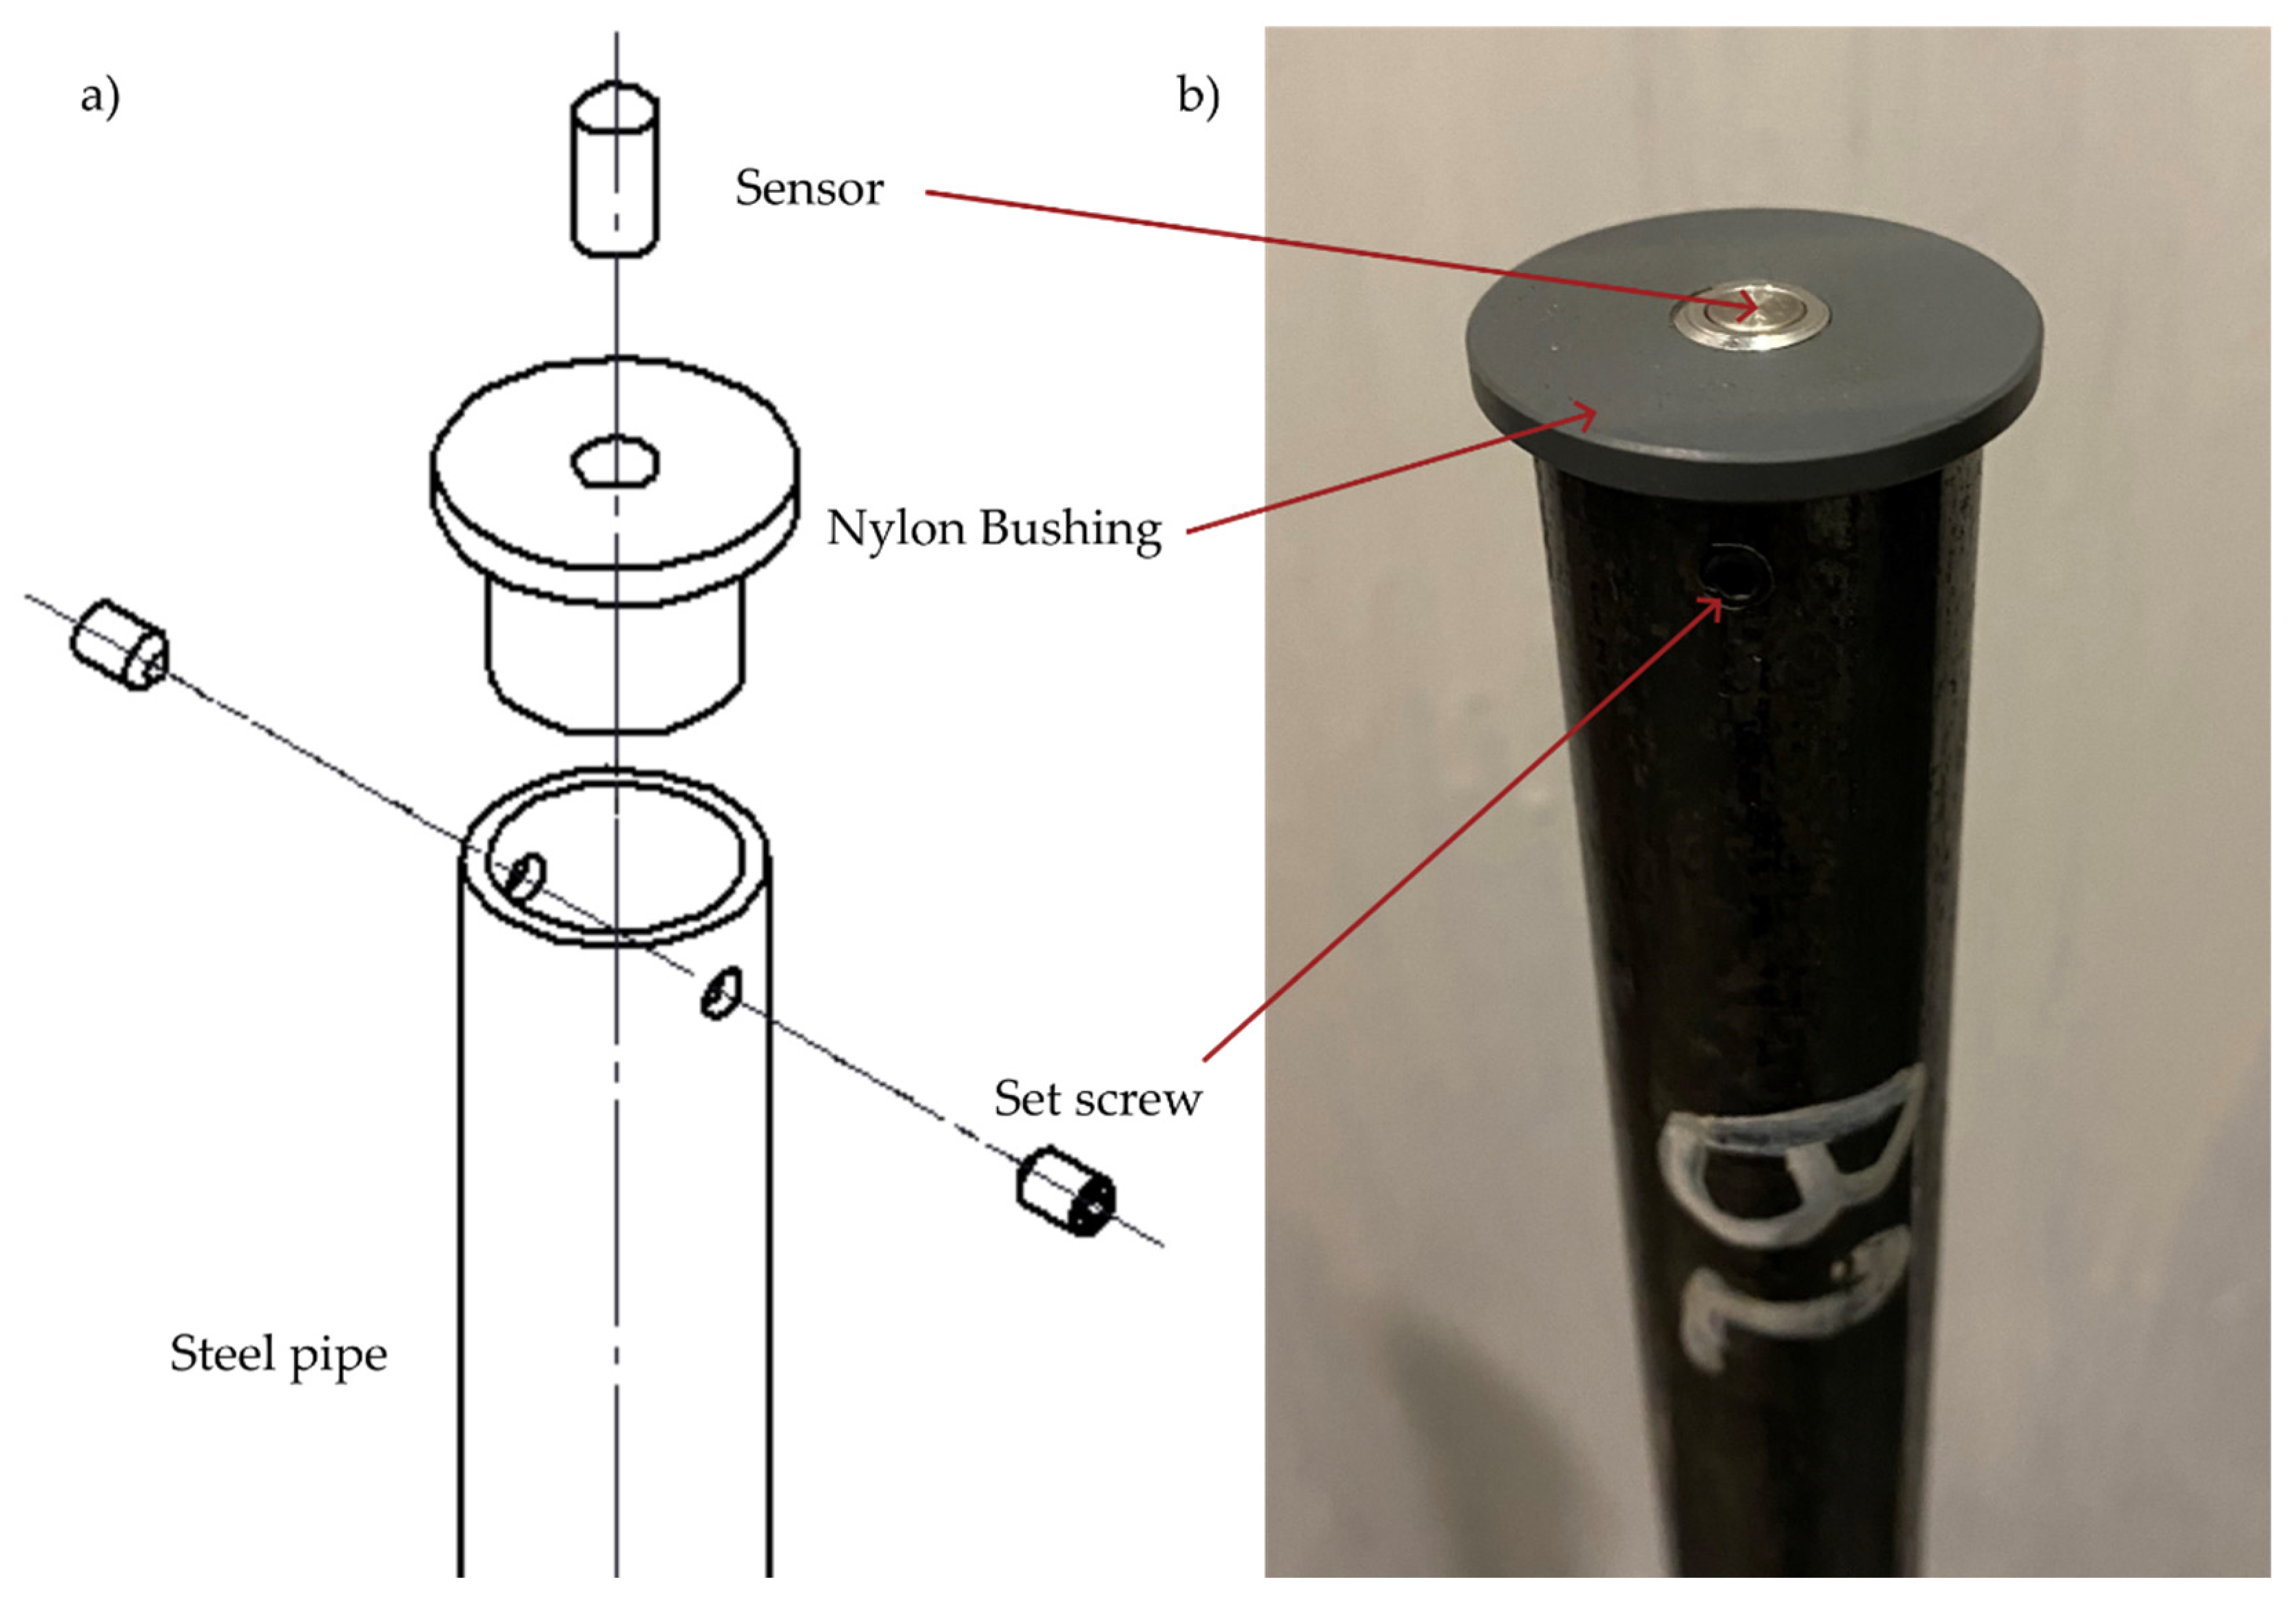
2.2. Instrumentation

PCB piezo-electric pressure transducers (gauges) were used to measure blast overpressure histories at the different points of interest. Each gauge was positioned such that the piezo-electric diaphragms were at heights of 540 mm and 405 mm with respect to the base plate (consistent with the charge centres) for the 100% and 75% scale tests, respectively at locations A, B1–B3. Pressure sensor diaphragms face vertically upwards to measure the unobstructed blast overpressure histories perpendicular to the incident blast propagation direction.
Pressure gauges were mounted flush inside bespoke nylon bushings that were inserted into the top of S355 steel pipes (Figure 3) and fixed to the base plate at the specified locations. The nylon bushings helped isolate pressure gauges to reduce ringing caused by stress waves propagating through the steel assembly after detonation.
Different specification pressure sensors were allocated to different gauge locations based on the maximum operating pressure and sensitivity (Table 1), as different pressure magnitudes and sensitivity were expected based on location. A Butterworth 200 kHz low-pass filter was applied to all channels with a frequency cut-off, fc = −3 dB to remove unwanted high-frequency signal components. The manufacturer quotes a rise time of 1 µs and a natural frequency of >500 kHz for the pressure sensors used [28,29,30].
All pressure gauges were connected to a HBM Genesis 2TB tethered data acquisition (DAQ) system via low-noise cables. The DAQ was fitted with a signal conditioner (HBM GN815) designed to capture data from IEPE pressure transducers at a sample rate of 2 MHz, ensuring high-fidelity pressure histories at each gauge location.
A simple break-wire circuit, constructed from aluminium foil in direct contact with the explosive charge and powered by a 4.5 V DC battery, was connected to the DAQ to trigger instrumentation recording following detonation. For each trial, the time of detonation was synchronised to have a time of 0.0 ms at the moment of detonation. This reference time was then used to determine the subsequent blast wave times of arrival at each pressure gauge surrounding the assembly.

3. Numerical Modelling Approach

3.1. CFD Methodology

Viper::Blast [31] (Version 1.20.8, Viper Applied Sciences, UK) was used to perform computational fluid dynamics (CFD) analyses of both scales of experimental tests. The basic functionality of Viper is based on the methodology described by Rose [32] and uses the AUSMDV numerical scheme as described by Wada and Liou [33].
Numerical models were developed in a two-stage approach. First, the detonation of each PE-4 explosive charge was modelled as a three-dimensional (3D) free-air explosion, capturing the early stages of blast wave propagation. This modelling was conducted up to a stand-off distance of R < 0.15 m in the 75% scale setup, and R < 0.2 m in the 100% scale setup. These distances were chosen to represent the scenario just before the blast wave encounters the first reflective surface. Second, 3D CFD analyses were used to model the blast wave propagation and interaction with the corner geometry in a larger domain, including blast reflections at the corner walls and ground surface. In these models, initial conditions were “remapped” from the initial 3D models of the charge detonation and early stage blast wave propagation (Figure 4). This allowed an efficient means (in terms of numerical accuracy and computational cost) to use a fine mesh in the first stage of 3D analysis and then a larger mesh (when compared to the mesh used in the first stage) for secondary 3D analysis.

3.2. Detonation and Near-Field Blast Propagation (Stage 1)

Cubic 3D domains were used to model detonation and subsequent blast wave propagation in the air. The simulations were conducted up to a distance of R < 0.15 m in the 75% scale setup and R < 0.2 m in the 100% scale setup. These distances corresponded to the blast wave propagation reaching the nearest reflective surface, which in this case was the corner side wall (Figure 4).
PE-4 material was specified at the centre of the domain containing elements of atmospheric air, such that the explosion and resulting shockwave propagated outwards from the centre. Cuboid charge geometries were specified to have an aspect ratio of 1:1:2, consistent with the experiments. For a specified density of 1601 kg/m3 for PE-4, the 9 g charge had dimensions 14.1 × 14.1 × 28.2 mm, and the 21.3 g charge had dimensions 18.8 × 18.8 × 37.6 mm. Transmissive boundary conditions were assigned to all domain faces to allow air to exit after being accelerated by the shock wave. Default values for the PE-4 and air equations of state (EOS) were used in the computations and retrieved from the Viper::Blast library (Table 2). The Jones–Wilkins–Lee (JWL) EOS [34,35] was used to model the PE-4 material (Equation (3))
p = a ( 1 ω R 1 V ) e R 1 V + B ( 1 ω R 2 V ) e R 2 V + ω V e
In Equation (3), p denotes pressure, and V and e are the specific volume and specific internal energy of the explosive, respectively. Parameters A, B, R1, R2, and ω are constants evaluated through experiments for any high-explosive material. For the PE-4 material, values for these parameters were taken from the Viper::Blast built-in material library is listed in Table 2.
The air was modelled as an ideal gas EOS with an ambient pressure of 101.3 kPa by specifying the adiabatic constant, γ = 1.4, the air density, ρ = 1.225 kg/m3, and the initial internal energy, e = 2.068 × 10⁵ kJ/kg (Table 2).
Table 2. Parameters used for modelling air and PE-4.
AirPE-4
Equation of State (EOS)Ideal gasJWL
Initial Conditionsγ = 1.4
e = 2.068 × 10⁵ kJ/kg
ρ = 1.225 kg/m3
A = 9.593 × 10⁵ MPa
B = 4.914 GPa
R1 = 5.616
R2 = 1.804
ω = 0.136
A JWL + afterburn solver modelled both the detonation of explosive material and subsequent shock wave propagation through the air. It includes a programmed burn model and a Jones–Wilkins–Lee (JWL) equation of state to enable modelling detonation of the charge and detonation products, along with an additional afterburn component. A cell size of 0.75 mm was specified as it was found to maximise the accuracy of the charge detonation and early blast wave propagation.
CFD analyses for each cuboid charge mass (9 g and 21.3 g PE-4) were performed until the shock front propagated to the domain boundary, then saved as a 3D remap file for the initial conditions for subsequent 3D analyses.

3.3. Blast Wave Propagation and Structural Interaction (Stage 2)

The corner structure was modelled within a 3D domain filled with air (as an ideal gas) using a series of cuboid obstacles with dimensions and arrangements consistent with the experiments (Figure 4). By default, obstacles specified in Viper::Blast have reflective boundary conditions, thus modelling a perfectly rigid structure with reflective surfaces. Pressure monitoring points were assigned at four locations (A, B1, B2, and B3) in the domain using 3D Cartesian coordinates corresponding to the experimental setups. To accurately model the scenario, a reflective boundary condition was assigned to the lower z-plane of the domain to model the ground surface. Additionally, transmissive boundary conditions were assigned to all other domain boundaries to model free-field (unobstructed) blast wave propagation. In the first stage, the 3D remap file was incorporated into the larger 3D domain (containing the structure) using coordinates for the detonation point corresponding to the experimental setup (Figure 4). The same multi-material solver was used in the second stage.
The outer dimensions of the 3D domain were made sufficiently large to prevent any potential boundary perturbations from interfering with regions of interest, particularly in the vicinity of pressure gauge locations. During the development of the 3D model, an iterative approach was taken to optimise the domain size. The objective was to strike a balance between providing ample space to minimise unwanted boundary interference effects and reducing the computational cost associated with the modelling problem. The 3D modelling domains comprised exterior dimensions of 600 × 1000 × 900 mm for the 75% scale and 800 × 1400 × 1100 mm for the 100% experiments.
Sensitivity studies were undertaken to optimise the mesh size and verify the accuracy of the 3D models. In Viper::Blast, a Cartesian mesh with uniformly sized cube-shaped cells was specified. Using a multi-material solver (method number 4), model sizes (total number of cells) were limited by the size of the graphics card. For this study, mesh convergence was observed for cell sizes of 1.5 mm and 2 mm for the 75% scale and 100% scale models, respectively. This led to a total of 160 million cells for the 75% scale model and 154 million cells for the 100% scale model within the respective modelling domains.
Following sensitivity studies, each 3D model was run for 5.0 ms, which allowed sufficient time for the primary blast wavefront to propagate around the corner and pass the furthest measurement location (gauge B3). Pressure data were extracted at time increments of 0.1 ms; this provided adequate resolution of pressure histories while maintaining manageable data storage. Simulations were run on a Dell Alienware Aurora R11 workstation (Intel(R) Core(TM) i9-10900KF @ 3.70 GHz CPU) with 64 GB RAM and NVIDIA GeForce RTX 3080 Ti 12,287 Mb graphics card.

4. Results and Discussion

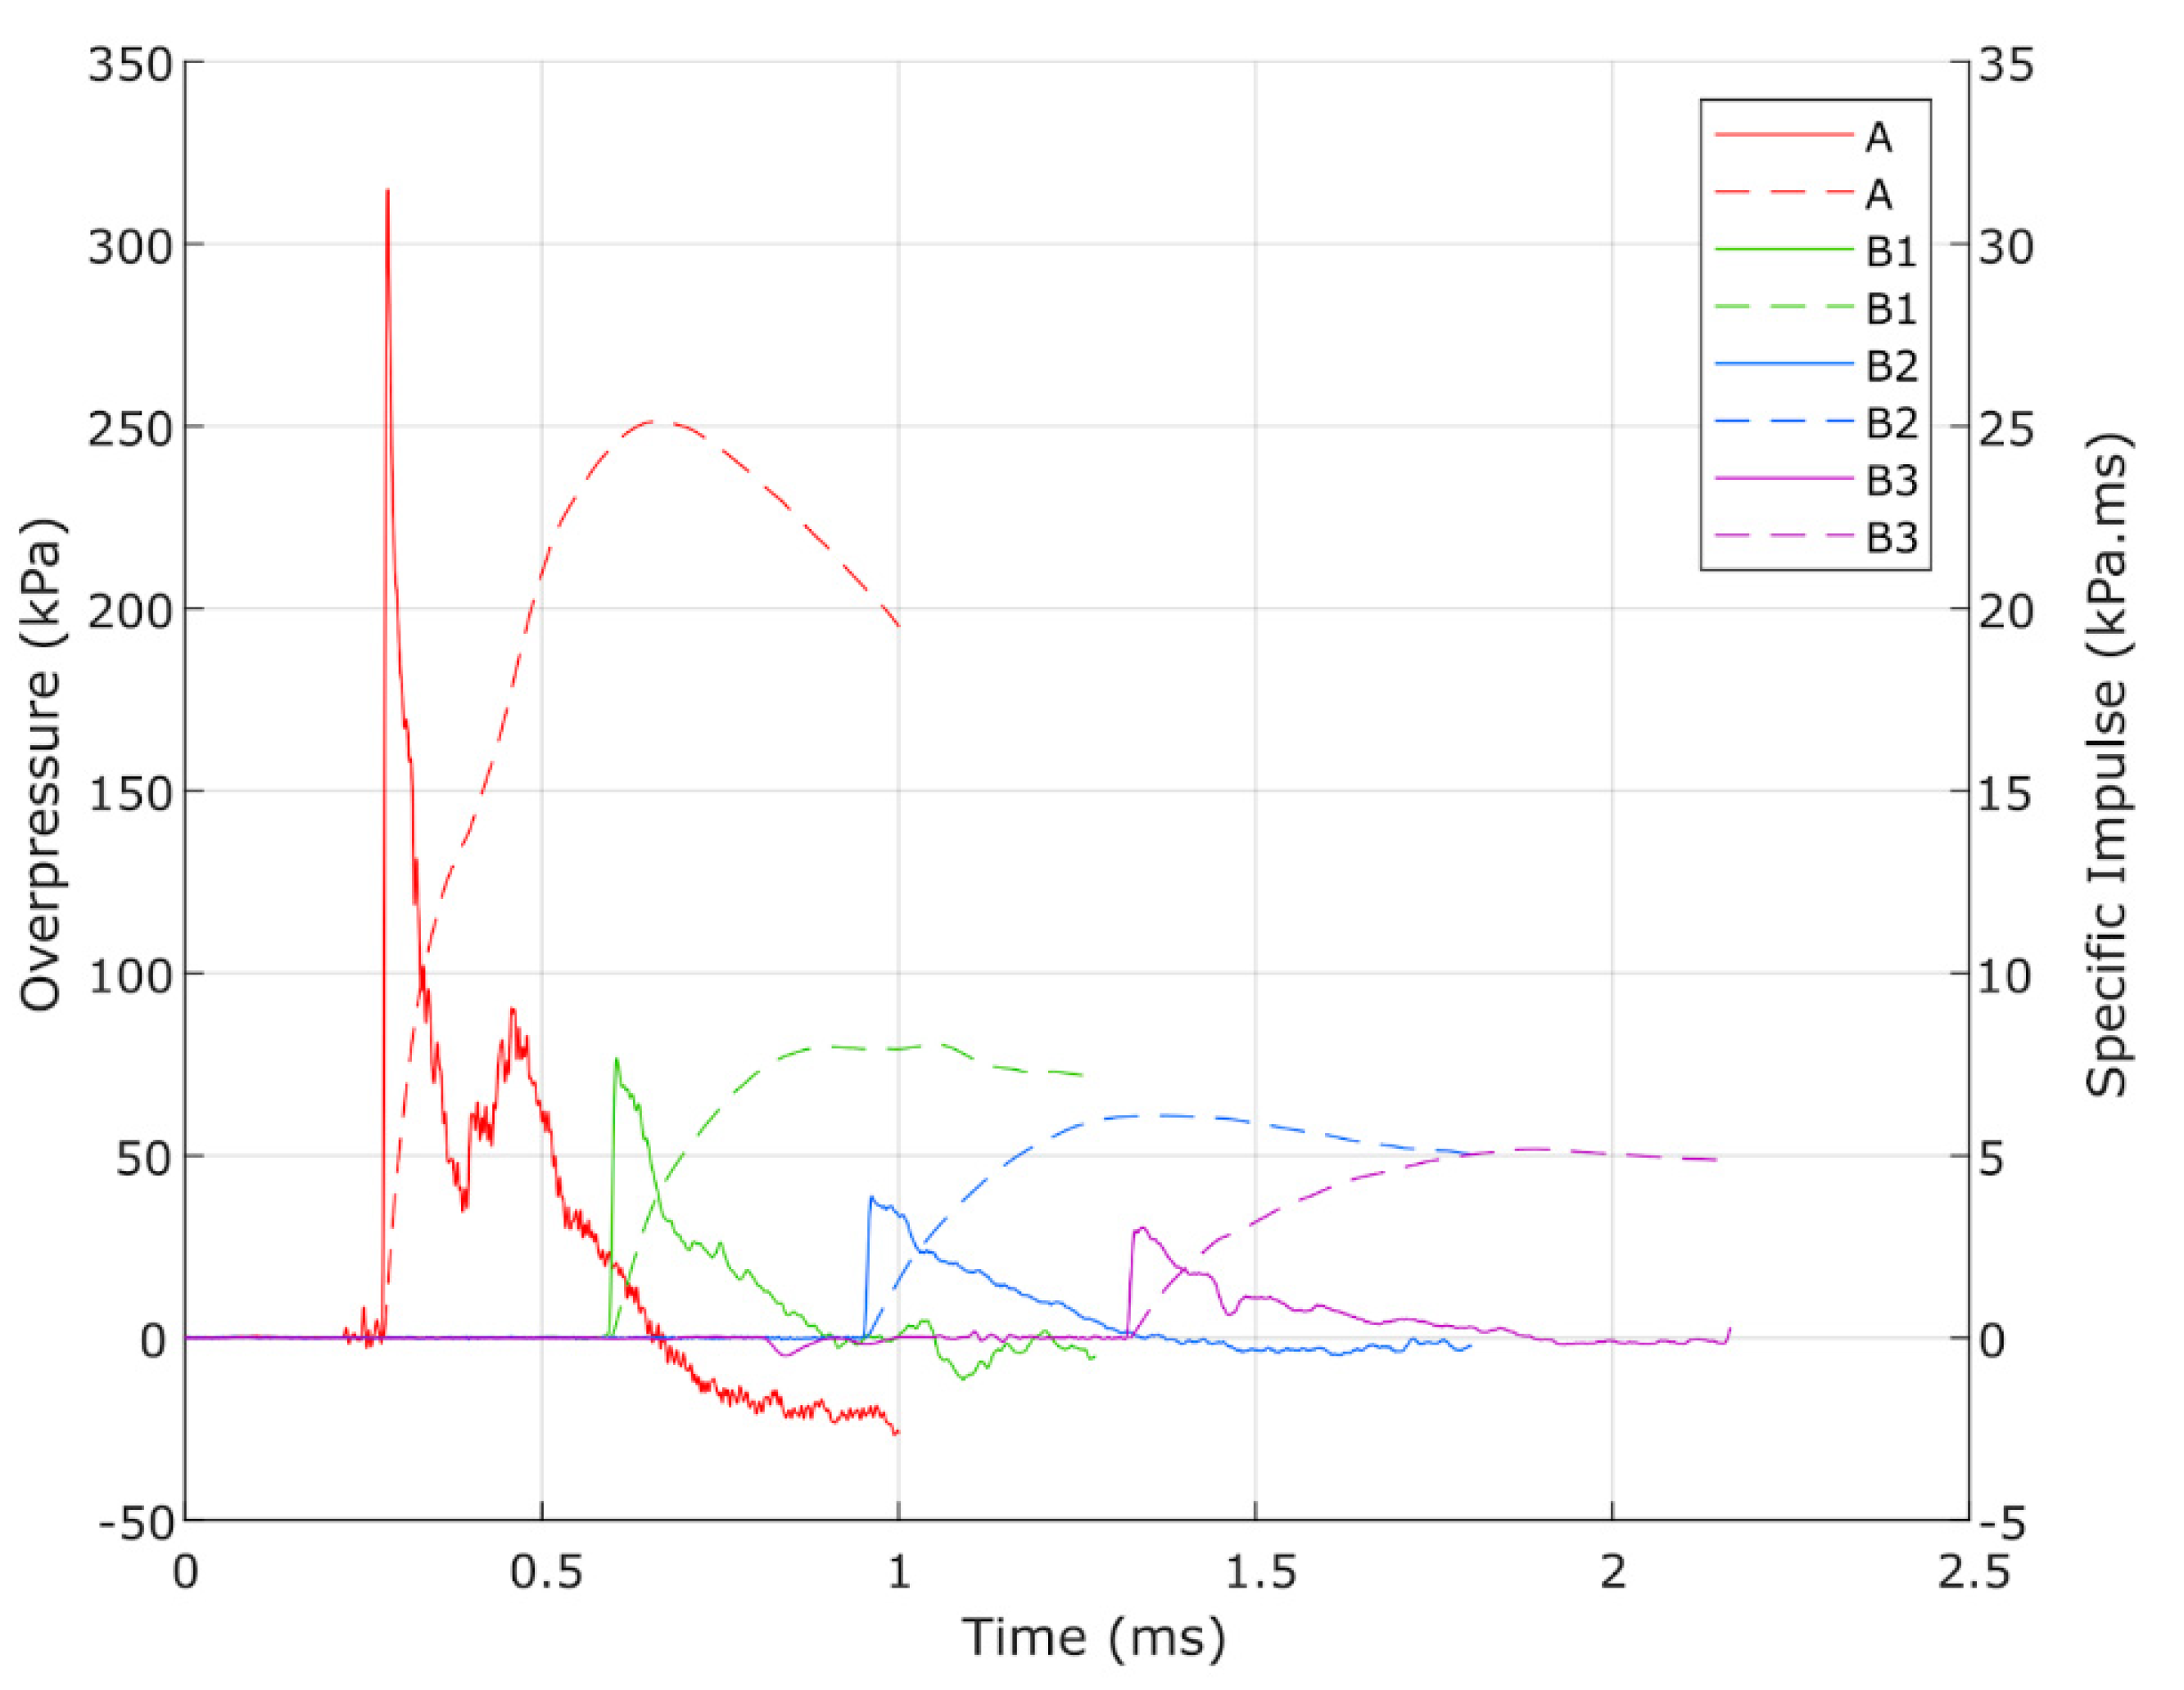
4.1. Experimental Results

Individual pressure histories for each gauge location from one of the four repeat experiments at geometric scales of 75% and 100% are overlaid with cumulative specific impulse curves in Figure 5a,b, respectively.
The noise in the dynamic pressure readings was insignificant during the initial positive duration. However, as the blast wave decayed and time progressed, the level of noise in the readings increased. This increase in noise is likely due to vibrations and movement within the bushings and steel pipes. A summary of the average value for the different blast wave parameters for the initial positive phase is shown in Table 3. The effects of the negative phase were neglected. Due to the variable nature of conducting blast tests, the range (in brackets) and standard deviation were also given.
Pressure histories measured at gauge A exhibited an initial peak overpressure, followed by a secondary pressure peak. The secondary peak was lower in magnitude and more variable than the first peak at a similar arrival time as the span for the positive phase duration (shown in Table 3). The numerical simulations revealed that the secondary peak was caused by pressure reflections from the front wall.
A Friedlander-type blast wave can be observed for gauges B1–B3 in Figure 5, whereby the peak overpressure magnitude decreases exponentially with respect to time. Peak incident overpressure decreased with increasing distance around the corner, as expected due to the greater stand-off distances. However, an enhanced reduction was observed due to shielding from the corner structure compared to a free-field explosion without the structure, consistent with the findings of Denny et al. [24]. This is similar to shielding observed from barriers used to mitigate blast effects on other buildings due to an external detonation [36,37] or clearing, which occurs on the reflected wall of a building and reduces the positive phase blast load [38]. Later blast wave arrival times and elongated positive phase durations were also evident with increasing distance around the corner.
Table 3 shows good repeatability in the peak pressure magnitudes for the initial peak values for all gauges, except for gauge A, where larger variations and secondary peak pressure were found. Figure 6 shows all valid pressure histories of gauge A as well as gauge B2 for both laboratory-scale tests. The largest variation in incident pressure (and consequently impulse) occurred at gauge A, possibly because it was directly exposed to the detonation and therefore more susceptible to jetting. Small experimental errors in charge positioning (relative to the corner) will have influenced subsequent reflection behaviour, potentially affecting peak values measured at these locations. Despite a mould being used to create charge consistency, it is possible that slight differences would occur when setting up the experiment. The secondary peak at gauge A was more sensitive to the positioning, orientation, and shape of the charge. Furthermore, the reflection wave interacts with the surrounding environment and the initial propagating pressure wave. There were also slightly larger variations in pressure and arrival time for the 75% scale tests, attributed here to the test arrangement being more sensitive to small absolute positioning errors. As expected, blast waves in the 75% scale experiments arrived at all pressure gauge locations earlier than in the 100% scale experiments, as observed from the additional pressure–time curves provided in Appendix B and Appendix C.

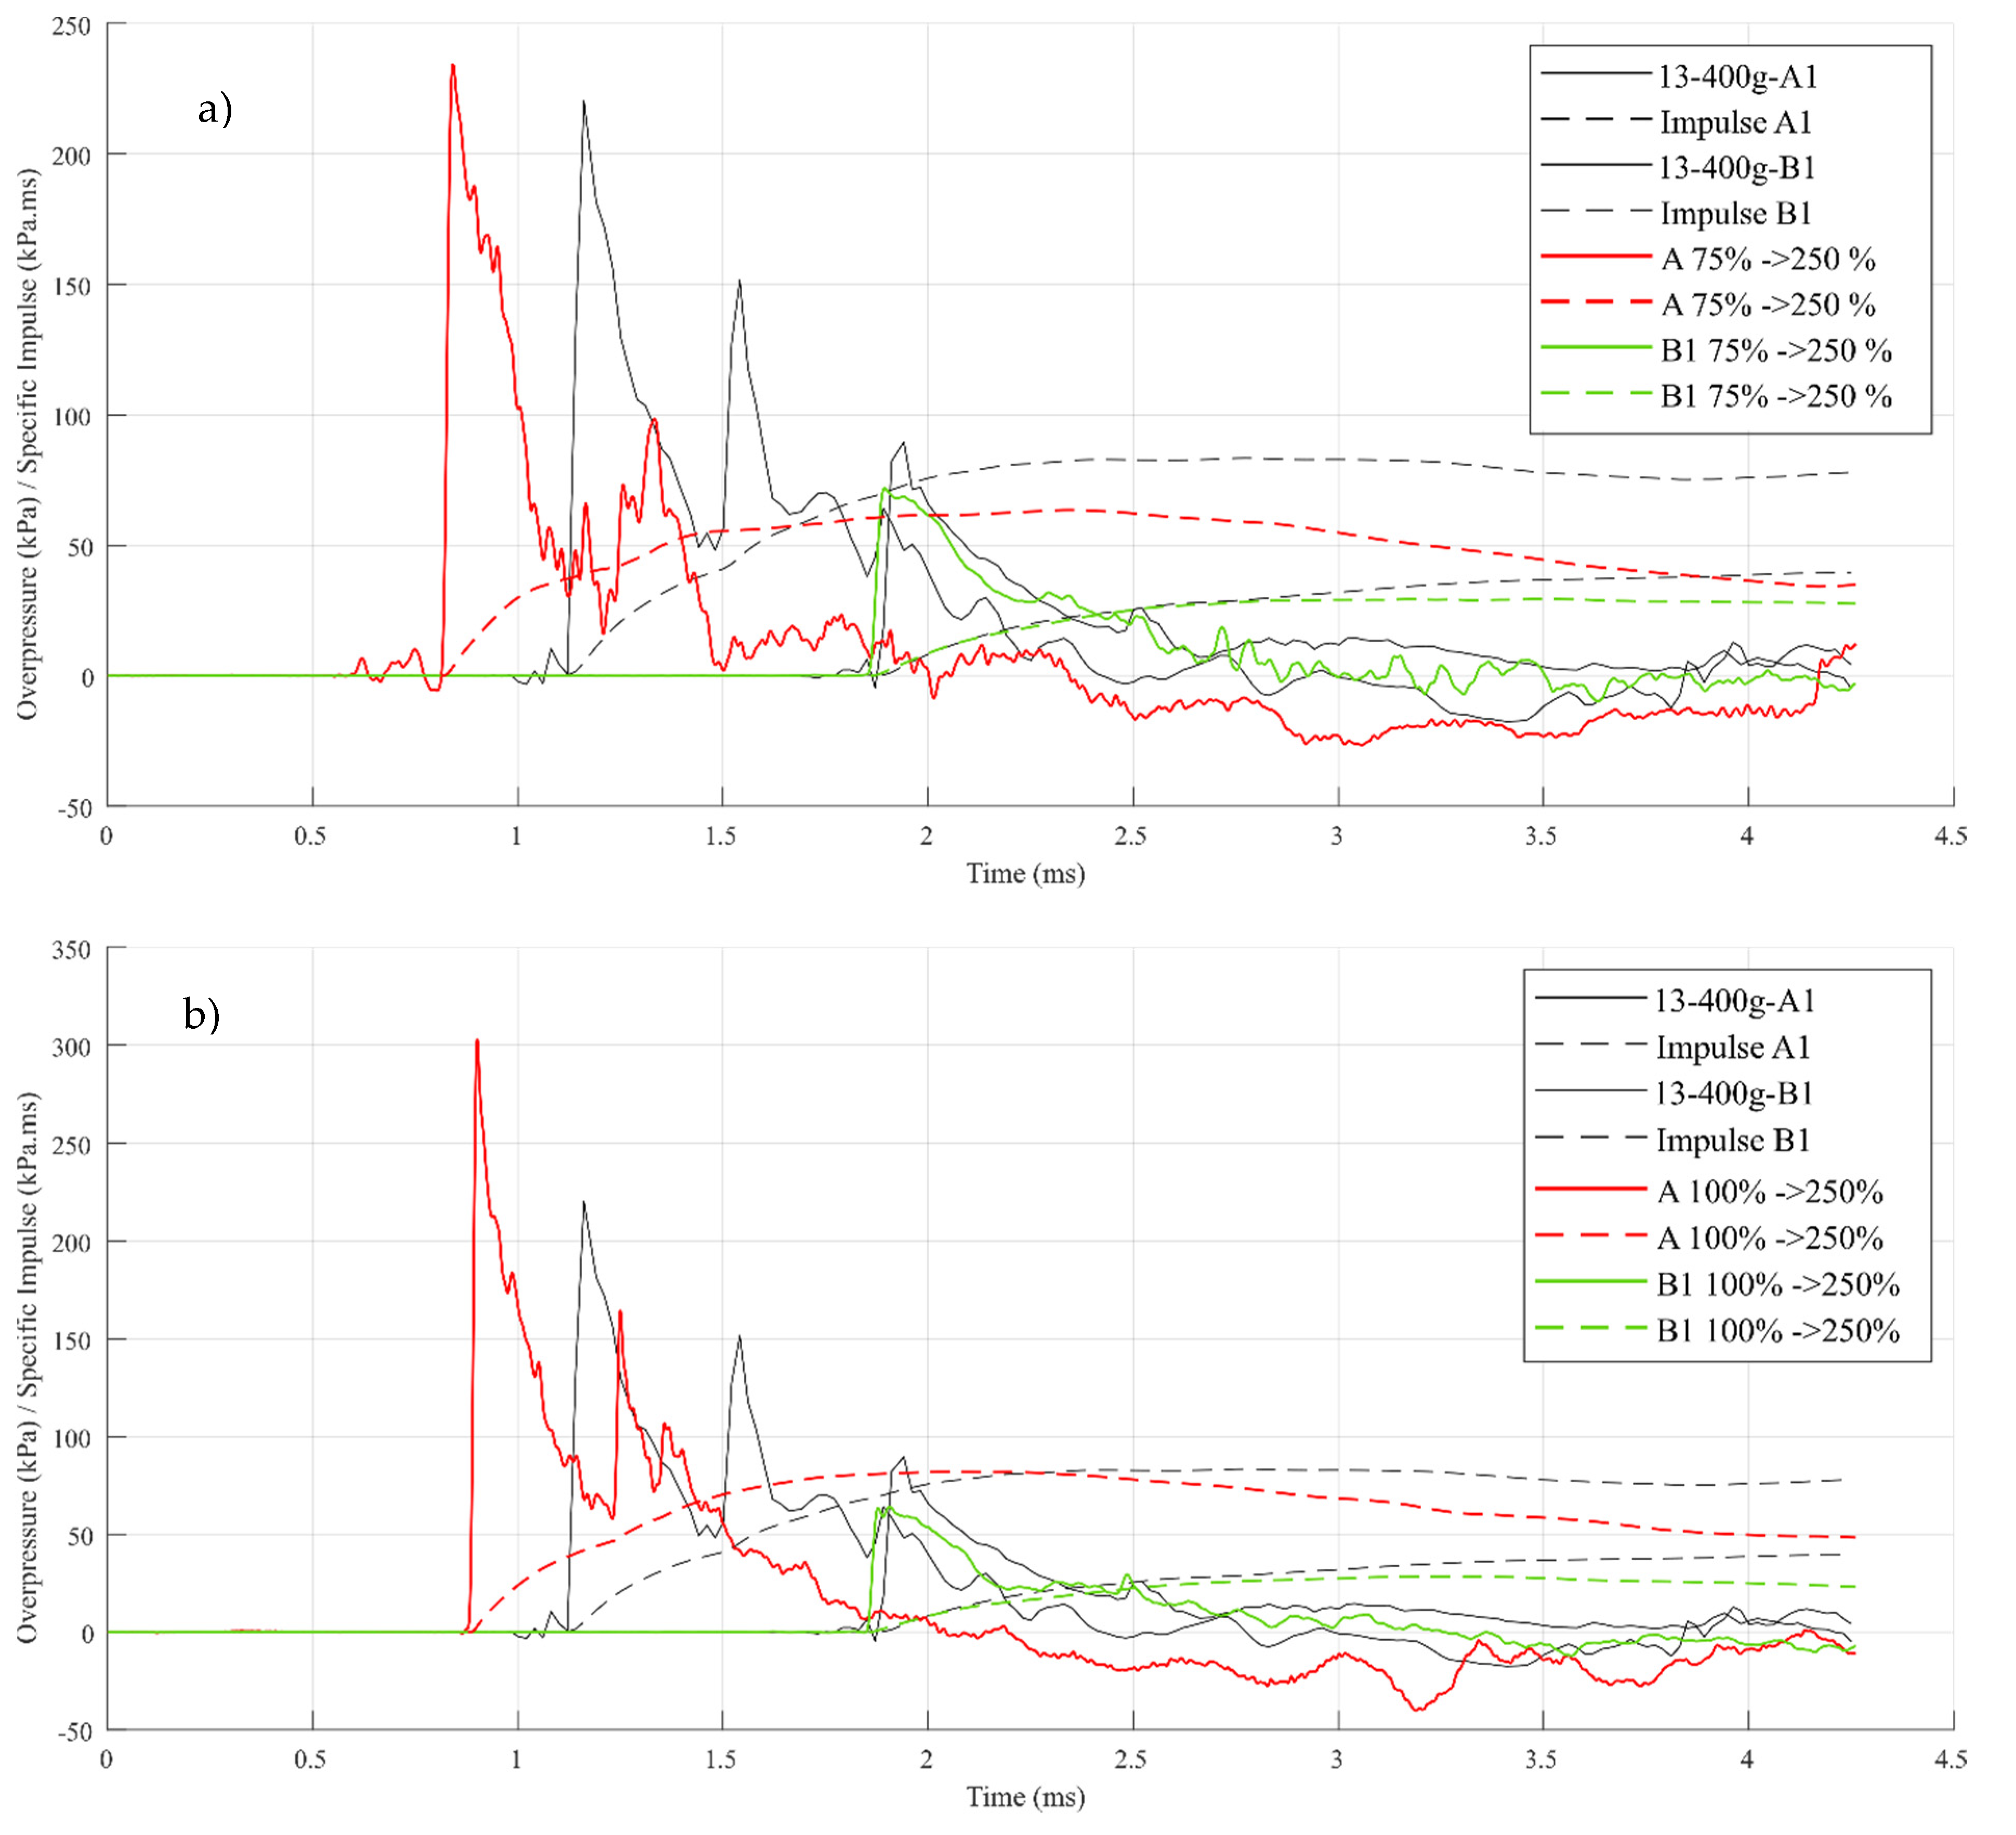
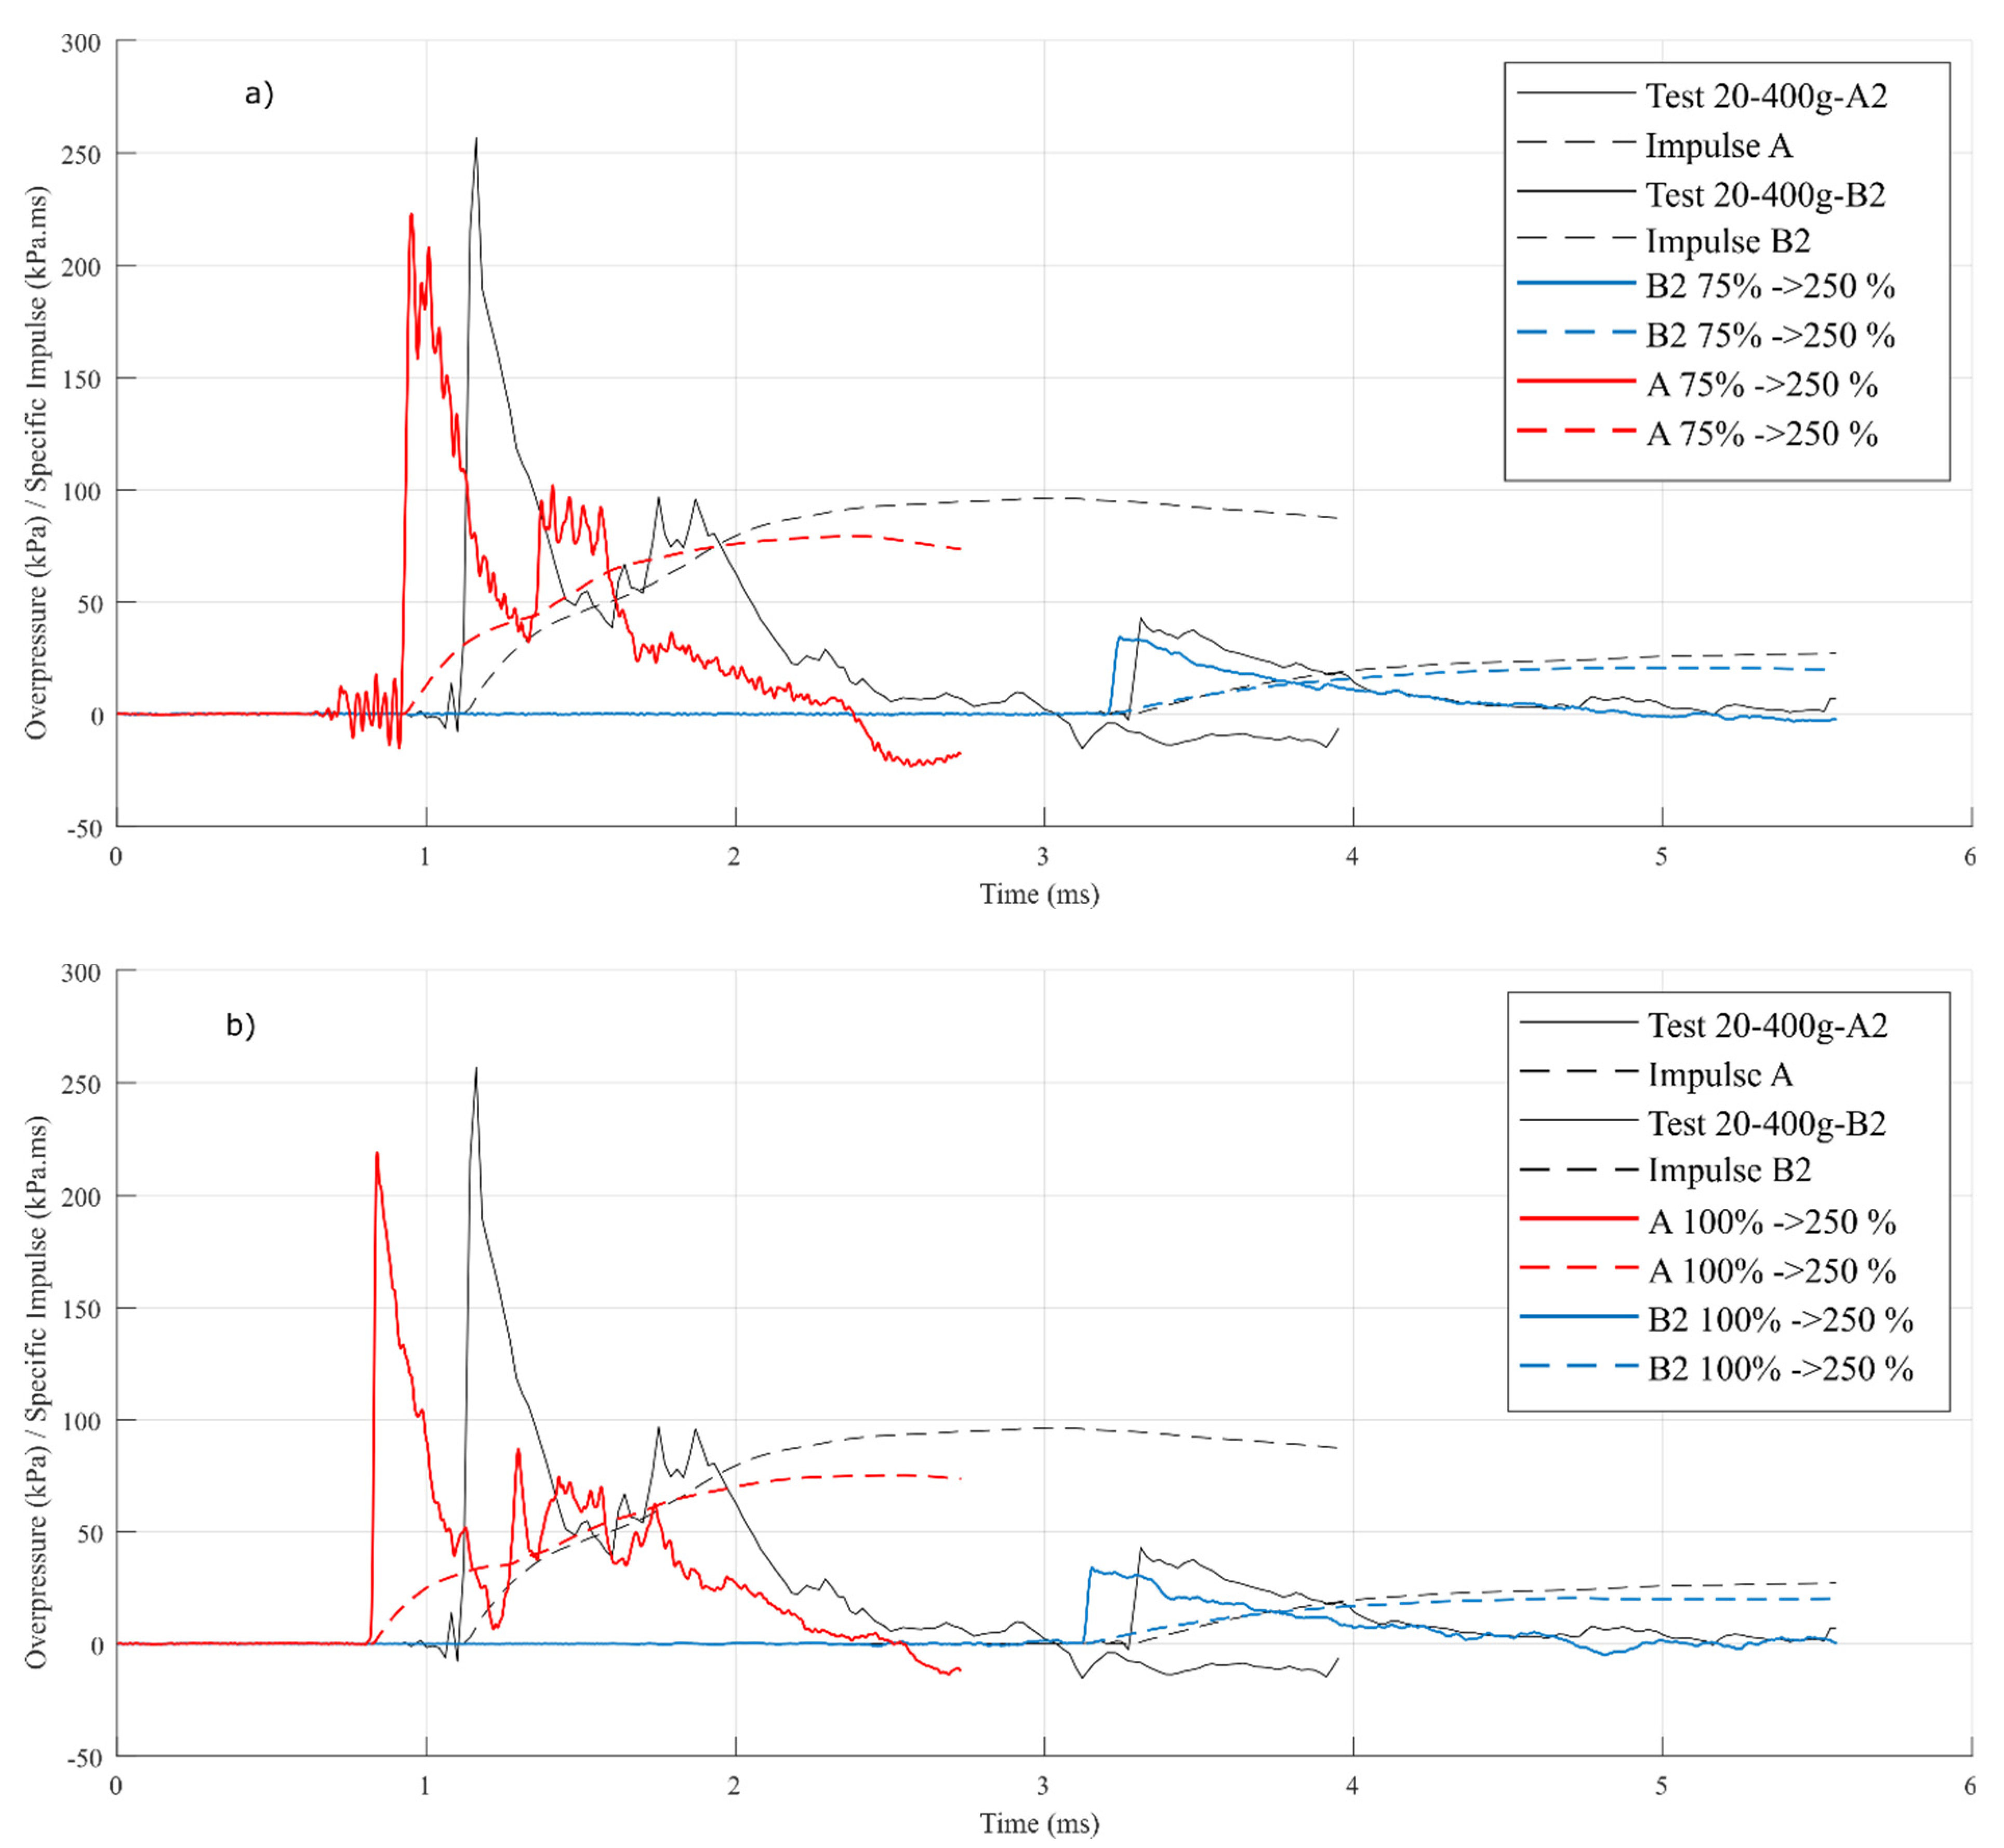
4.2. Scaling 75% Results to Predict Blast Parameters at 100% Scale

Using H–C scaling, peak incident overpressures should be consistent between different geometric scales, although time-based parameters require scaling. The mean time-based blast parameters (time of arrival, positive phase duration, and impulse) obtained in the 75% scale tests were multiplied by 1/K = 1.33 (where K = 0.75) to calculate the equivalent parameters expected at the 100% geometric scale.
Blast parameters measured in the 100% scale experiments, including the mean and range (in brackets), are summarised in Table 4 for each pressure gauge location. Table 4 presents the predicted 100% values, which were obtained by scaling the mean 75% values derived from the 75% scale experiments. The table also includes the corresponding percentage differences and absolute differences between the two mean values, allowing for the assessment of agreement levels. The 75% overpressure time histories were also scaled to 100% (Figure 7).
Gauge A: Compared to the B gauges, agreement between the 100% scale and predicted results for gauge A had higher discrepancies (4% to 8%) for the initial incident overpressure, arrival time, positive phase duration, and impulse. Despite these discrepancies, the predicted 100% and 75% values were within the experimental range for all four parameters. There was a considerable difference (12% to 27%) between the measured and predicted secondary peak overpressure values at the 100% scale. While the predicted secondary peak overpressure was within the measured range of the 100% test results, it occurred later than expected and persisted for a shorter time. These differences caused a divergence in the cumulative impulse curves beyond the primary peak decay time and in the peak cumulative impulse magnitude at gauge A. The secondary peak pressure was sensitive to charge conditions such as shape and location. In general, values were found to have a larger range within an experimental scale test series compared to other gauges. Furthermore, the angle of the charge relative to the corner wall will change the behaviour of the reflected wave (particularly the time of arrival and magnitude of pressure as the reflective wave reaches gauge A). That said, the predicted initial and overall (positive phase duration and impulse) parameters of gauge A were reasonable. Further work is recommended to understand what influences the secondary peak overpressure.
Gauges B1 and B2: There was a 2 to 5% variation in the parameters found for gauges B1 and B2. Additionally, the curves for the predicted 100% were similar to the actual 100% curves (see Figure 7). In general, these gauges showed good agreement between the two scales. The predicted time of arrival from the mean 75% value was slightly later (by 4% to 5%) than the measured 100% experimental mean averages.
Gauge B3: Similar to gauges B1 and B2, the time of arrival for the predicted 100% was slightly later than expected (by 2%). The incident overpressure of the predicted 100% was within the actual 100% range, with a difference of 4% between the mean values, showing good agreement for this parameter. The predicted positive phase duration of 0.79 ms was just outside the experimental upper bound of 0.78 ms, with a difference of 5% from the mean values. Despite the similar values found for these three parameters, the impulse was under-predicted by 11% at gauge B3. A noticeable decrease in pressure for the predicted 100% curve occurred at 2 ms in Figure 7. Considering the blast wave travelled through the internal structure of the building (further insight is found in the numerical results), the interaction between the corner wall propagating wave and the internal structure may have influenced the measurement at gauge B3. As the same square hollow sections were used to construct the corner structure in both tests (i.e., it was not scaled), the effect would not be scalable.

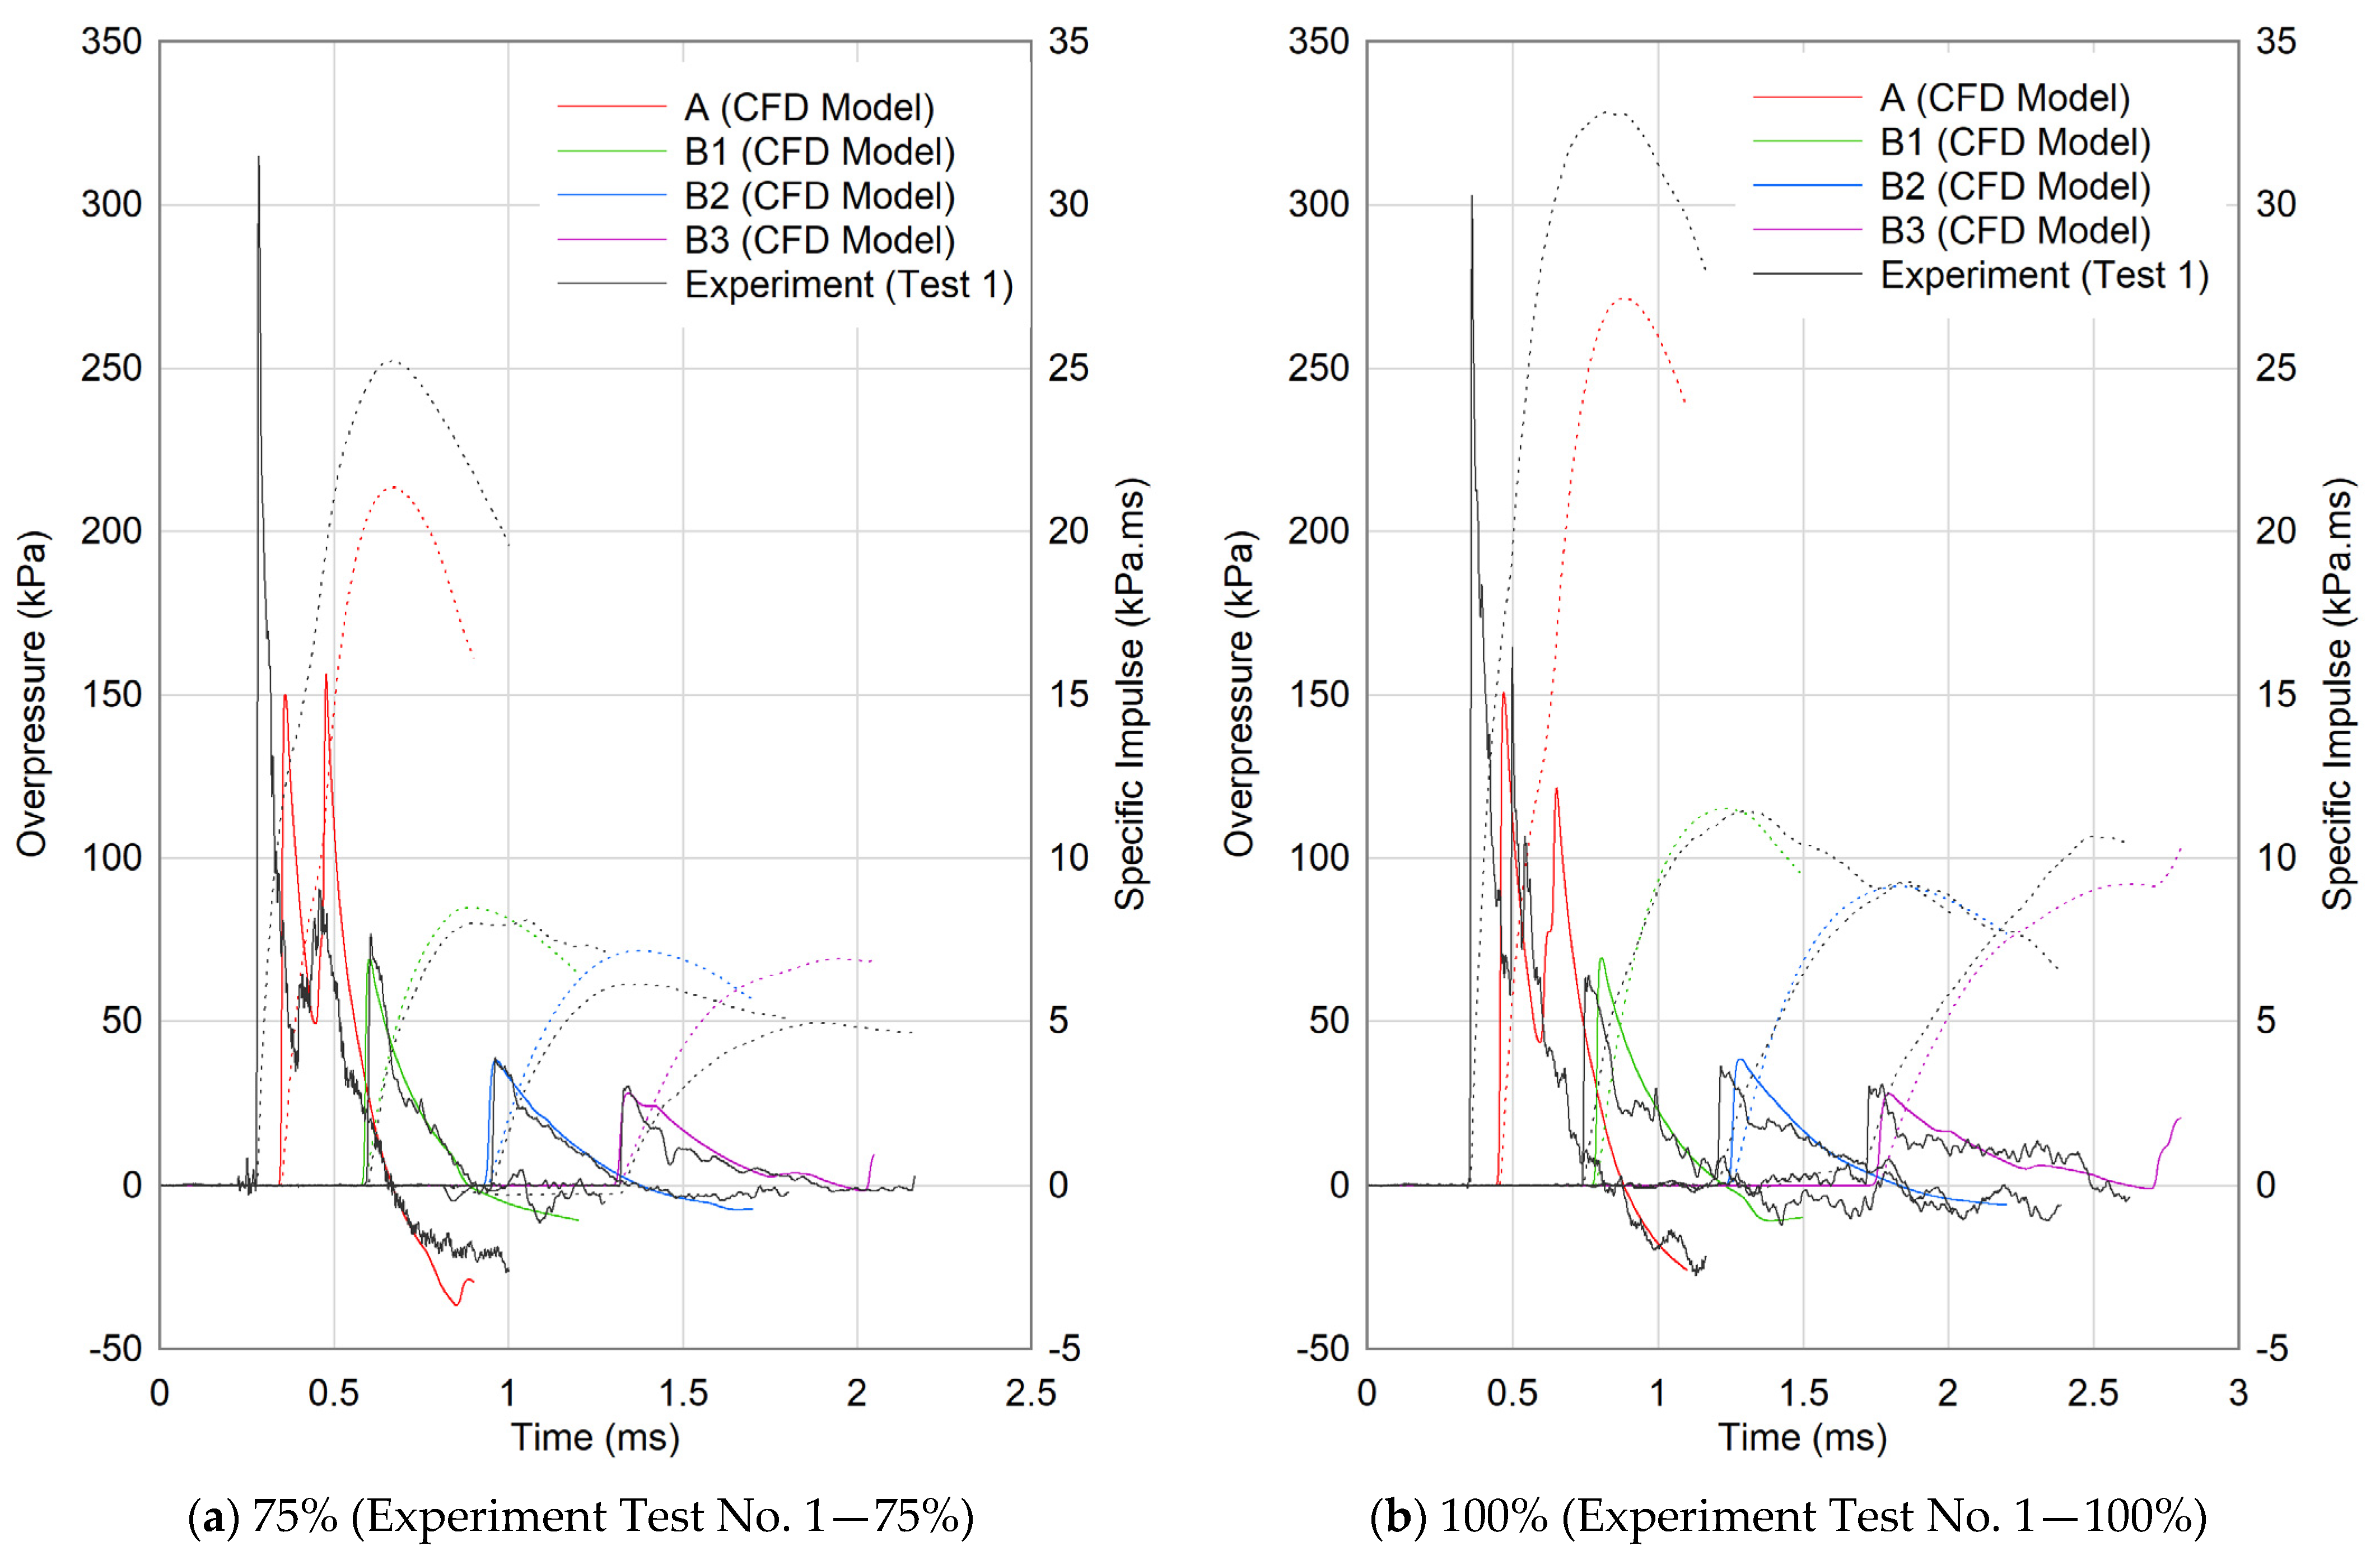
4.3. Numerical Modelling Results and Comparison to Experimental Work

Pressure–time histories and cumulative specific impulses calculated by CFD models for each gauge location are plotted in Figure 8 and overlaid with corresponding experimental traces measured in the 75% and 100% scale tests. CFD models showed good agreement with the experimental data, exhibiting similar waveforms at pressure gauge locations surrounding the corner for each geometric scale (Figure 8).
In both the 75% and 100% scale tests, the CFD models underestimated the peak overpressure at gauge A. The underpredictions were approximately 45% and 40% for the 75% and 100% scale tests, respectively, when compared to experimental data. This resulted in absolute differences of 124 kPa for the 75% scale test and 103 kPa for the 100% scale test, as indicated in Table 5 and Table 6. Apart from these differences, time of arrival and positive phase duration exhibited acceptable agreement between the CFD models and the experimental data. Furthermore, the specific impulses showed fair agreement, with absolute differences of up to 4 kPa.ms.
Good agreement was observed between the CFD models and experiments for gauges B1–B3. Calculated peak overpressures at gauges B1–B3 were all within 10% of experimental mean values, representing small absolute differences of 1–3 kPa. Calculated times of arrival were within 5% of experimental mean values, and positive specific impulses had low absolute differences of less than 1 kPa.ms.
Given inevitable experimental variability, the numerically modelled pressure histories and positive phase blast wave parameters demonstrated acceptable agreement with test results.

4.4. Using Laboratory Results to Predict Parameters Found for Field Tests (at 250% Scale)

Gajewski and Sielicki [11] performed a set of field trials in the open air, detonating 400 g TNT cuboids with a width:height:length ratio of 1:1:2. The experimental layout (gauge distances and structure dimensions) reported herein are geometrically similar, with the field trials representing a scale of 250%. A schematic and photograph of the field tests are shown in Figure 9. The charge mass and dimensions were also scaled using a factor of 250% when assuming a TNT equivalency of 1.2 for PE-4 [24]. The differences between the experiments herein and the field trials [11] exist:
  • The detonator position was not identical—for the field trials, the explosive was rear detonated at the cross-sectional centre of the bottom of the two 200 g TNT blocks (referred to as the rear–below centre). However, in the current work, the PE-4 cuboid was a single moulded part with a centrally located detonator (referred to as middle–centre detonated);
  • Instead of a relatively smooth corner structure manufactured from 12 mm plated steel and a lightweight steel frame, a reinforced concrete structure with a similar corner geometry was used. A slight gap between the side covering wall and the front wall is evident in the photographs of the field trials (Figure 9) [11]. The current work used a steel baseplate for the lab-scale indoor tests rather than earth (this is likely to be less important as the charges were detonated considerably high above the ground).
  • The geometry is not quite identical—in the current tests, the front wall was simplified to facilitate efficient numerical simulations by enabling a half-symmetry assumption (Figure 10). The implications of this assumption are considered in the following discussion.
Figure 9. Schematic of the experimental set-up (a) and field test photographs (b,c) used in [11].
Applsci 13 05956 g009

4.4.1. Assessing the Effect of Employing Half-Symmetry

Additional numerical simulations were conducted to determine the effect of this half-symmetry assumption on loading at each pressure gauge and to understand the validity of comparing experimental results to the large-scale (250%) field tests in [11]. CFD models for the 100% scale setup (employing half symmetry) were undertaken to examine loading at each location in comparison to a larger obstacle with a 50% longer side length, akin to [11] (Figure 10).
CFD models of the experimental geometry showed that blast waves diffracted around the rear of the corner structure (anti-clockwise in Figure 10), reaching gauge B3 towards the end of the positive phase duration of the primary blast wave. This resulted in a slightly elongated positive phase duration (by 0.17 ms) and increased specific impulse (by 0.9 kPa.ms) at gauge B3 in comparison to models of the larger geometry (Figure 11). However, no difference was observed for pressure measurements at gauges A, B1, and B2 (Figure 11). Employing half symmetry for the corner geometry in the experiments and comparing it to the geometrically equivalent results in [11] was therefore deemed acceptable (Figure 12).

4.4.2. Comparing Experimental Values between Field and Laboratory Tests

To estimate the equivalent blast parameters at a 250% geometric scale, the mean time-based blast parameters (time of arrival, positive phase duration, and impulse) obtained from the 75% and 100% scale tests were multiplied by the factor (1/K). In this case, K is the geometric scale factor, which equates to 3.33 (K = 0.3) for the 75% scale and 2.5 (K = 0.4) for the 100% scale. By applying this scaling factor, the corresponding blast parameters at the 250% geometric scale can be calculated. The predicted values based on the mean values (refer to Table 3), along with the Gajewski and Sielicki [11] results for the mean and range (in brackets), are shown in Table 7.
It should be noted that only two gauges were available for the field tests [11], one of which was kept for location A while the other was shared between the B locations. Therefore, the results given for gauge A have a richer data set, and the range given for the B gauges is not indicative of all the tests conducted and results from gauge A. Figure 13, Figure 14 and Figure 15 show overlaid 75% and 100% overpressure time histories scaled up to 250%, overlaid with test data from [11].
Gauge A: There was significant variability in the field trials [11], including instances where a distinct secondary peak was not observed. Despite this, the positive phase duration and impulse at gauge A were well predicted by the lab-scaling approach (<5% difference, Table 7). In comparison to the mean values reported in [11], the incident overpressure was over-predicted by 23% for the 100% laboratory-scaled tests and 33% for the 75% laboratory-scaled tests. However, it is worth noting that these values fall within the range of overpressures measured in the field trials.
Gauge A is located in close proximity to the explosive and is directly in the line of sight of the detonation. As a result, it is highly influenced by the charge setup conditions. There could be several reasons explaining the variability observed at gauge A. One proposed reason was the effect of the detonator on the aspect ratio of the charge mass and, consequently, the behaviour of the reflected pressure. Further numerical work should be conducted to determine the influence of detonators on different-sized charge masses.
The size of the detonator in relation to the charge masses used in the laboratory tests would likely be a cause for the difference. It is assumed that a similar wired electric detonator was used in both the field and laboratory tests (21.3 g and 9 g charge masses versus a 400 g charge mass). The size of the detonator and its net explosive content remained consistent for both the 75% and 100% scale tests, meaning it could not be scaled accordingly. However, specific details regarding the detonator size and net explosive content were not provided in the field trials [11].
In the field trials [11], the presence of wind (3.4 m/s) and the use of string to hold the charge would make it difficult to ensure the detonator and charge were oriented parallel to the front wall. Oscillations were observed in the field trials. Slight changes to the orientation angle can cause significant differences in the overpressure and impulse generated, as observed in Xiao et al. [39] for cylindrical charges with an aspect ratio (length/diameter) of 2. It is also noted that the pressure mounts in the field trials were very slender, so the wind may have affected the positioning of the pencil pressure gauges (whereas the pressure gauges herein were mounted onto steel pipes fixed to the base via screw mounts).
Furthermore, the difference in detonator position (middle–centre detonated in the lab-scale work and rear–below centre detonated in [11]) may also affect the initial peak pressure at gauge A. Xiao et al. [39] showed that the peak pressure was approximately 8% lower for the middle–centre detonated cylindrical charge (L/D = 2) compared to a rear–centre detonated cylindrical charge at Z = 1.83 m/kg (the location of gauge A). This did not account for the effects of reflection from the front wall, as the work in [39] was a free field with the charge situated on the ground. Hence, the true pressure and impulse states would be more complex given the lower detonation position in the field trials.
In addition, two different explosive materials were used (TNT for field experiments and PE-4 for laboratory experiments). While the TNT equivalence for PE-4 of 1.2 is well-documented [27], the combination of scaling up to 250% and using TNT equivalence could have influenced the arrival time of the overpressure wave. This is because the two explosives, PE-4 and TNT, would have different detonation velocities.
Additionally, the weather conditions measured onsite were 20 °C with 58% humidity, whereas the temperature and humidity when the laboratory experiments took place were closer to 25 °C and 30%, respectively. These weather factors would not only affect gauge A but also the B gauges as they influenced the wave propagation in ambient air. Along with this, the surrounding environment and structure (a flat steel base plate with a smooth steel structure versus grasslands with a concrete structure) would influence the behaviour of the wave propagation.
B (1,2,3) Gauges: As a reminder, less data was available for the B gauges. Hence, the range given in [11] is not indicative of the full set of tests where A was measured. Despite this, the incident overpressure and time of arrival for the B gauges were well predicted compared to gauge A.
Large variations were observed for the positive phase duration and, consequently, the cumulative impulse. Upon further observation of the curves for B1 (see Figure 16), where the largest percentage difference of −44 and −45% for the 100% and 75% scales were found, initially the three curves tended to align with one another. However, at 2.8 ms, a rise in pressure occurs in the field trial measurements. This rise was likely a reflective pressure wave from the surroundings and appeared to extend the duration when compared to the scaled lab experiments. This also occurred for B2 at 4.7 ms where a slight rise in pressure was observed in the field trial data. The converse was true for B3 where the predicted durations were longer than the field trial values (due to the half symmetry model implemented in the laboratory tests). As shown in the numerical models, B3 was influenced by the blast wave propagating through the rear of the corner structure (considered on the symmetric plane of field trials [11]). This caused a pressure rise as the initial blast wave decayed, extending the duration.
In general, blast parameters at the B gauges were well predicted, especially within the initial forward blast wave propagating past the corner. The surrounding environment and details of the structure (including symmetry) would have had an effect as the pressure decayed. Further testing is recommended in the future to determine the extent of these influences, which can be built upon the existing laboratory set-up as a basis, moving towards quantifying the distinct aspects of the surrounding environment and structure and decomposing the complexities found in field tests.

5. Conclusions

Within the laboratory setting, H–C scaling enabled reasonable predictions of blast parameters at different scales. Lab-scale limitations prevented exact geometric similarity between different-scale experiments. However, despite this limitation, the blast profile during the initial positive phase appeared to scale well for gauges B1 and B2. These locations were shielded by the corner and were not affected by the blast wave wrapping around the other side of the structure. Notably, nearly identical profiles were observed between the two different scales at these gauges.
Comparisons were made between the laboratory setup and field trials [11] that featured a similar arrangement. The experimental geometry of the structure in the laboratory setup exhibited half symmetric, and simulations showed that only gauge B3 (located farthest from the explosive and nearest to the back wall) would be affected by this symmetry condition. As predicted by numerical models, the positive phase duration experimental results for B3 were longer than in the field tests. Despite this, the B gauges showed a good correlation between the laboratory-predicted values (using H–C scaling) and the field tests for the time of arrival and incident overpressure. Larger variations were found for the positive phase duration and impulse.
In the field tests, a reflective pressure wave was observed as the initial pressure wave decayed. This phenomenon, which was not observed in the laboratory experiments, resulted in a longer positive phase duration and a higher cumulative impulse. At gauge A, the laboratory results were used to reasonably predict incident overpressure, positive phase duration, and impulse. However, the time of arrival in the laboratory experiments was significantly shorter because different explosive materials were used in the two test scenarios.
This is the first study of its kind to show the interscalability of laboratory experiments relevant to urban blast scenarios and compare the findings to field trials conducted elsewhere. It shows that it is possible to address the challenges and complexities associated with urban blast-loading scenarios using this approach. These findings have the potential to contribute to the development of comprehensive guidelines for blast protection design in urban environments. Additionally, they can aid in the modelling of blast injury risk in urban environments, enabling the assessment of potential injuries that medical personnel may encounter in specific areas.

Supplementary Materials

The following supporting information can be downloaded at: https://www.mdpi.com/article/10.3390/app13105956/s1.

Author Contributions

Conceptualisation, J.D. and G.S.L.; methodology, J.D., S.G., S.C.K.Y. and R.A.G.; software, J.D.; validation, S.G. and J.D.; formal analysis, S.G., J.D. and G.S.L.; investigation, S.G., J.D. and S.C.K.Y.; resources, J.D., G.S.L., R.A.G. and S.C.K.Y.; data curation, J.D. and S.G.; writing—original draft preparation, S.G., J.D. and G.S.L.; writing—review and editing, S.C.K.Y., R.A.G. and G.S.L.; visualisation, J.D. and S.G.; supervision, G.S.L. and S.C.K.Y.; project administration, J.D. and S.C.K.Y.; funding acquisition, G.S.L., J.D. and S.C.K.Y. All authors have read and agreed to the published version of the manuscript.

Funding

This research was supported by funding from the University of Cape Town Research Committee, the University of Southampton Global Partnerships Award, the Clinical Informatics Research Unit (CIRU), the University of Southampton, and the International Blast Injury Research Network (IBRN).

Data Availability Statement

The data for pressure histories found in the experiments were included as Supplementary Materials.

Acknowledgments

The authors wish to acknowledge the Mechanical Engineering Workshop staff and Matthew Hoare for their assistance with the technical design.

Conflicts of Interest

The authors declare no conflict of interest. The funders had no role in the design of the study; in the collection, analyses, or interpretation of data; in the writing of the manuscript; or in the decision to publish the results.

Appendix A. Test Data for Laboratory-Scaled Tests Conducted

Table A1. Test data for the 100% scaled tests.
Test 1Test 2
Pi (kPa)ta (ms)t+ (ms)Ii (kPa.ms)Pi (kPa)ta (ms)t+ (ms)Ii (kPa.ms)
Gauge A303.0540.3510.46432.783
Gauge A *164.5140.5000.31519.128
Gauge B163.3730.7390.56211.38874.2190.7580.43411.620
Gauge B236.2821.2050.6539.19439.3201.2330.6178.747
Gauge B330.2151.7150.7799.81732.6201.7420.7347.897
Test 3Test 4
Pi (kPa)ta (ms)t+ (ms)Ii (kPa.ms)Pi (kPa)ta (ms)t+ (ms)Ii (kPa.ms)
Gauge A239.7550.318 219.1570.3230.69229.534
Gauge A * 86.3240.5190.49714.006
Gauge B170.9600.7750.41810.49566.4170.7760.41910.062
Gauge B238.0001.2350.6558.59133.9551.2450.6418.166
Gauge B329.3471.748
* refers to the 2nd peak of gauge A.
Table A2. Test data for the 75% scaled tests.
Test 1Test 2
Pi (kPa)ta (ms)t+ (ms)Ii (kPa.ms)Pi (kPa)ta (ms)t+ (ms)Ii (kPa.ms)
Gauge A314.9210.2760.39125.128322.5200.269
Gauge A *89.8910.4910.20618.098
Gauge B176.6290.5920.31979.82665.5510.6650.3278.322
Gauge B238.8580.9500.42660.99338.7331.0270.4676.375
Gauge B329.4001.3180.5725.17529.5141.3970.5726.065
Test 3Test 4
Pi (kPa)ta (ms)t+ (ms)Ii (kPa.ms)Pi (kPa)ta (ms)t+ (ms)Ii (kPa.ms)
Gauge A222.8780.2750.44123.837234.2970.2400.36118.474
Gauge A *101.9260.4230.29314.61798.5050.4000.20214.507
Gauge B167.5220.5910.3548.16171.8730.5560.3498.740
Gauge B234.3800.9600.5106.22640.6250.9100.4889.544
Gauge B327.5801.3350.6086.15032.0341.2760.6266.143
* refers to the 2nd peak of gauge A.

Appendix B. Overpressure–Time Histories and Cumulative Specific Impulse at Each Gauge Location Measured in the 100% Experiments

Figure A1. Overpressure−time histories and cumulative specific impulse at each gauge location measured for Test 1.
Applsci 13 05956 g0a1
Figure A2. Overpressure–time histories and cumulative specific impulse at each gauge location measured for Test 2.
Applsci 13 05956 g0a2
Figure A3. Overpressure–time histories and cumulative specific impulse at each gauge location measured for Test 3.
Applsci 13 05956 g0a3
Figure A4. Overpressure–time histories and cumulative specific impulse at each gauge location measured for Test 4.
Applsci 13 05956 g0a4

Appendix C. Overpressure–Time Histories and Cumulative Specific Impulse at Each Gauge Location Measured in the 75% Experiments

Figure A5. Overpressure–time histories and cumulative specific impulse at each gauge location measured for Test 1.
Applsci 13 05956 g0a5
Figure A6. Overpressure–time histories and cumulative specific impulse at each gauge location measured for Test 2.
Applsci 13 05956 g0a6
Figure A7. Overpressure–time histories and cumulative specific impulse at each gauge location measured for Test 3.
Applsci 13 05956 g0a7
Figure A8. Overpressure–time histories and cumulative specific impulse at each gauge location measured for Test 4.
Applsci 13 05956 g0a8

References

  1. United Nations. World Urbanization Prospects 2018: Highlights (ST/ESA/SER.A/421). 2020. Available online: https://www.un.org/development/desa/pd/sites/www.un.org.development.desa.pd-/files/wpp2022_summary_of_results.pdf (accessed on 10 November 2022).
  2. United Nations. World population Prospects 2022: Summary of Results. UN DESA/POP/2022/TR/NO. 3, Department of Economic and Social Affairs, Population Division, 2022. 2022. Available online: https://www.un.org/development/desa/pd/sites/www.un.org.development.desa.pd/files/wpp2022_sum-mary_of_results.pdf (accessed on 10 October 2022).
  3. Hayda, J.; Beaubien, J.; Lonsdorf, K.; Maynes, C.; Deadly Missile Strikes Hit Kyiv as Explosions Reported in Other Cities Across Ukraine. National Public Radio (NPR), 10 October 2022. Available online: https://www.npr.org/2022/10/10/1127794708/explosions-hit-kyiv-and-other-cities (accessed on 10 November 2022).
  4. Rigby, S.E.; Lodge, T.J.; Alotaibi, S.; Barr, A.D.; Clarke, S.D.; Langdon, G.S.; Tyas, A. Preliminary yield estimation of the 2020 Beirut explosion using video footage from social media. Shock Waves 2020, 30, 671–675. [Google Scholar] [CrossRef]
  5. Valsamos, G.; Larcher, M.; Casadei, F. Beirut explosion 2020: A case study for a large-scale urban blast simulation. Saf. Sci. 2021, 137, 105190. [Google Scholar] [CrossRef]
  6. Banda, M. Death Toll in Boksburg Gas Tanker Explosion Rises to 41 as Class Action Gathers Steam, Daily Maverick South Africa, Boksburg, 23 January 2023. Available online: https://www.dailymaverick.co.za-/article/2023-01-23-death-toll-in-boksburg-gas-tanker-explosion-rises-to-41-as-class-action-gathers-steam/ (accessed on 29 March 2023).
  7. AOAV. Action on Armed Violence, ‘Explosive Vviolence Monitor 2019: Initial Findings’. 2019. Available online: https://aoav.org.uk/2020/explosive-violence-in-2019/ (accessed on 10 October 2022).
  8. Baker, W.E.; Cox, P.A.; Westine, P.S.; Kulesz, J.J.; Strehlow, R.A. Chapter 2—Free-field explosions and their characteristics. In Fundamental Studies in Engineering; Elsevier: Amsterdam, The Netherlands, 1983; pp. 106–221. [Google Scholar]
  9. Held, M. Blast Waves in Free Air. Propellants Explos. Pyrotech. 1983, 8, 1–7. [Google Scholar] [CrossRef]
  10. Kinney, G.F.; Graham, K.J. Explosive Shocks in Air; Springer: Berlin/Heidelberg, Germany, 1985. [Google Scholar] [CrossRef]
  11. Gajewski, T.; Sielicki, P.W. Experimental study of blast loading behind a building corner. Shock Waves 2020, 30, 385–394. [Google Scholar] [CrossRef]
  12. Heggelund, S.; Brekken, K.; Ingier, P.; Christensen, S.O. Global response of a three-story building exposed to blast loading. Proceedings 2018, 2, 386. [Google Scholar] [CrossRef]
  13. Rose, T.A.; Smith, P.D.; May, J.H. The interaction of oblique blast waves with buildings. Shock Waves 2006, 16, 35–44. [Google Scholar] [CrossRef]
  14. Xiao, W.; Andrae, M.; Steyerer, M.; Gebbeken, N. Investigations of blast loads on a two-storeyed building with a gable roof: Full-scale experiments and numerical study. J. Build. Eng. 2021, 43, 103111. [Google Scholar] [CrossRef]
  15. Sugiyama, Y.; Izumo, M.; Ando, H.; Matsuo, A. Two-dimensional explosion experiments examining the interaction between a blast wave and a sand hill. Shock Waves 2018, 28, 627–630. [Google Scholar] [CrossRef]
  16. Jin, M.; Hao, Y.; Hao, H. Numerical study of fence type blast walls for blast load mitigation. Int. J. Impact Eng. 2019, 131, 238–255. [Google Scholar] [CrossRef]
  17. Warnstedt, P.; Gebbeken, N. Innovative protection of urban areas—Experimental research on the blast mitigating potential of hedges. Landsc. Urban Plan. 2020, 202, 103876. [Google Scholar] [CrossRef]
  18. Ghajari, Y.E.; Alesheikh, A.A.; Modiri, M.; Hosnavi, R.; Abbasi, M.; Sharifi, A. Urban vulnerability under various blast loading scenarios: Analysis using GIS-based multi-criteria decision analysis techniques. Cities 2018, 72, 102–114. [Google Scholar] [CrossRef]
  19. Shi, Y.; Liu, S.; Li, Z.; Ding, Y. Review on quick safety assessment of building structures in complex urban environment after extreme explosion events. In International Journal of Protective Structures; Sage Publications Inc.: Thousand Oaks, CA, USA, 2022. [Google Scholar] [CrossRef]
  20. Smith, P.D.; Rose, T.A. Blast wave propagation in city streets—An overview. Prog. Struct. Eng. Mater. 2005, 8, 16–28. [Google Scholar] [CrossRef]
  21. Rose, T.; Smith, P. Influence of the principal geometrical parameters of straight city streets on positive and negative phase blast wave impulses. Int. J. Impact Eng. 2002, 27, 359–376. [Google Scholar] [CrossRef]
  22. Isaac, O.S.; Alshammari, O.G.; Pickering, E.G.; Clarke, S.D.; Rigby, S.E. Blast wave interaction with structures—An overview. In International Journal of Protective Structures; Sage Publications Inc.: Thousand Oaks, CA, USA, 2022. [Google Scholar] [CrossRef]
  23. Ratcliff, A.; Rigby, S.; Clarke, S.; Fay, S. A Review of Blast Loading in the Urban Environment. Appl. Sci. 2023, 13, 5349. [Google Scholar] [CrossRef]
  24. Denny, J.; Langdon, G.; Rigby, S.; Dickinson, A.; Batchelor, J. A numerical investigation of blast-structure interaction effects on primary blast injury risk and the suitability of existing injury prediction methods. Int. J. Prot. Struct. 2022, Preprint. [Google Scholar] [CrossRef]
  25. Cranz, C.; Poppenberg, O.; von Eberhard, O. (Eds.) Innere Ballistik; Springer: Berlin/Heidelberg, Germany, 1926. [Google Scholar] [CrossRef]
  26. Hopkinson, B. British Ordnance Board Minutes, 13565; The National Archive: Kew, UK, 1926. [Google Scholar]
  27. Rigby, S.E.; Sielicki, P.W. An investigation of TNT equivalence of hemispherical pe4 charges. Eng. Trans. 2014, 62, 423–435. [Google Scholar]
  28. PCB Piezotronics, ICP Pressure Sensor Model 113B28 Product Specifications. 2021. Available online: https://www.pcb.com-/contentStore/docs/pcb_corporate/pressure/products/specsheets/113b28_f.pdf (accessed on 1 March 2022).
  29. PCB Piezotronics, ICP Pressure Sensor Model 113B27 Product Specifications. 2021. Available online: https://www.pcb.com-/contentStore/-docs/pcb_corporate/pressure/products/specsheets/113b27_f.pdf (accessed on 1 March 2022).
  30. PCB Piezotronics, ICP Pressure Sensor Model 113B21 Product Specifications. 2021. Available online: https://www.pcb.com-/contentStore/-docs/pcb_corporate/pressure/products/specsheets/113b21_f.pdf (accessed on 1 March 2022).
  31. Stirling, C. Viper::Blast; Stirling Simulation Services Limited: Edinburgh, Scotland, UK, 2021. [Google Scholar]
  32. Rose, T.A. An Approach to the Evaluation of Blast Loads on Finites and Semi-Infinite Structures. Ph.D. Thesis, Cranfield University, Cranfield, UK, 2010. [Google Scholar]
  33. Wada, Y.; Liou, M.-S. An Accurate and Robust Flux Splitting Scheme for Shock and Contact Discontinuities. SIAM J. Sci. Comput. 1997, 18, 633–657. [Google Scholar] [CrossRef]
  34. Dobratz, B.M.; Crawford, P.C. LLNL Explosives handbook, properties of chemical explosives and simulants. In Report UCRL-52997; Livermore National Laboratory: Livermore, CA, USA, 1985. [Google Scholar]
  35. Lee, E.L.; Hornig, H.C.; Kury, J.W. Adiabatic Expansion of High Explosive Detonation Products; University of California Radiation Laboratory at Livermore: Livermore, CA, USA, 1968. [Google Scholar]
  36. Zhou, X.; Hao, H. Prediction of airblast loads on structures behind a protective barrier. Int. J. Impact Eng. 2008, 35, 363–375. [Google Scholar] [CrossRef]
  37. Sung, S.-H.; Chong, J.-W. A fast-running method for blast load prediction shielding by a protective barrier. Def. Technol. 2020, 16, 308–315. [Google Scholar] [CrossRef]
  38. Rigby, S.E.; Tyas, A.; Bennett, T.; Fay, S.D.; Clarke, S.; Warren, J.A. A Numerical Investigation of Blast Loading and Clearing on Small Targets. Int. J. Prot. Struct. 2014, 5, 253–274. [Google Scholar] [CrossRef]
  39. Xiao, W.; Andrae, M.; Gebbeken, N. Influence of charge shape and point of detonation of high explosive cylinders detonated on ground surface on blast-resistant design. Int. J. Mech. Sci. 2020, 181, 105697. [Google Scholar] [CrossRef]
Figure 1. Schematic of the blast corner diffraction scenario examined in the experimental tests [11].
Applsci 13 05956 g001
Figure 2. Photographs of the 75% experimental corner set-up.
Applsci 13 05956 g002
Figure 3. (a) Exploded view (schematic) and (b) photograph of the experimental pressure instrumentation set-up.
Applsci 13 05956 g003
Figure 4. A total of a 100% scale CFD model set up in Viper::Blast after remapping the initial 3D analysis in plain view (left) and elevation view (right).
Applsci 13 05956 g004
Figure 5. Overpressure–time histories and cumulative specific impulse at each gauge for the (a) 75% and (b) 100% scale tests.
Applsci 13 05956 g005
Figure 6. Overpressure–time histories and cumulative specific impulse gauge A for the (a) 75% and (b) 100% scale tests, and gauge B2 for the (c) 75% and (d) 100% scale tests.
Applsci 13 05956 g006
Figure 7. Overpressure–time histories and cumulative specific impulse at each gauge for the 100% (from Test 1—100%) and predicted 75% to 100% (from Test 4—75%) scale tests.
Applsci 13 05956 g007
Figure 8. CFD models pressure histories and cumulative specific impulse vs. experimental measurements at each gauge for the (a) 75% and (b) 100% scale tests.
Applsci 13 05956 g008
Figure 10. CFD models assessed the influence of employing half symmetry for experimental corner geometry in comparison to the larger geometry used in [11].
Applsci 13 05956 g010
Figure 11. Numerically modelled pressure histories for the 100% scale experimental geometry (employing half symmetry) and “larger geometry” akin to Gajewski and Sielicki [11] (dashed curves).
Applsci 13 05956 g011
Figure 12. Plan view of pressure contours at height z = 0.54 m for a 100% scale CFD model showing blast wave diffraction around the experimental corner structure at two-time points.
Applsci 13 05956 g012
Figure 13. Overpressure–time histories and cumulative specific impulse at gauges A and B1 for the 250% (black) with predicted 75% (a) and 100% (b) laboratory-scaled tests.
Applsci 13 05956 g013
Figure 14. Overpressure−time histories and cumulative specific impulse at gauges A and B2 for the 250% (black) with predicted 75% (a) and 100% (b) laboratory-scaled tests.
Applsci 13 05956 g014
Figure 15. Overpressure−time histories and cumulative specific impulse at gauges A and B3 for the 250% (black) with predicted 75% (a) and 100% (b) laboratory-scaled tests.
Applsci 13 05956 g015
Figure 16. Overpressure−time histories and cumulative specific impulse for B1 between t = 1.5 and 4.5 ms.
Applsci 13 05956 g016
Table 1. Pressure instrumentation properties and experiment allocation.
Sensor ModelMaximum Operating PressureSensitivityAllocated Gauge
PCB 113B28 [28]50 psi344 kPa100 mV/psiB3
PCB 113B27 [29]100 psi689 kPa50 mV/psiB1, B2
PCB 113B21 [30]200 psi1378 kPa25 mV/psiA
Table 3. Summary of experimental results for the average blast wave parameters measured at each gauge for the (a) 75% scale and (b) 100% scale tests. (Detailed results of individual tests can be found in Appendix A).
(a) 75%Mean [Range], Standard Deviation
GaugePi (kPa)ta (ms)t+ (ms)I+ (kPa.ms)
A274 [323–223], 520.26 [0.28–0.24], 0.020.40 [0.44–0.36], 0.0422.5 [25.1–18.5], 3.5
A(2nd peak)97 [102–90], 60.43 [0.46–0.40], 0.030.23 [0.29–0.20], 0.05 115.7 [18.1–14.5], 2.0 2
B170 [77–66], 50.60 [0.67–0.56], 0.050.34 [0.35–0.32], 0.028.3 [8.7–8.0], 0.3
B238 [41–34], 30.96 [1.03–0.91], 0.050.47 [0.51–0.43], 0.046.3 [6.5–6.1], 0.2
B330 [32–28], 21.33 [1.40–1.28], 0.050.59 [0.63–0.57], 0.035.9 [6.2–5.2], 0.5
(b) 100%Mean [Range], Standard Deviation
GaugePi (kPa)ta (ms)t+ (ms)I+ (kPa.ms)
A254 [303–219], 440.33 [0.35–0.32], 0.020.58 [0.69–0.46], 0.1631.2 [32.8–29.5], 2.3
A(2nd peak)125 [165–86], 550.51 [0.52–0.50], 0.010.41 [0.52–0.32], 0.13 116.6 [19.1–14.0], 3.6 2
B169 [74–63], 50.76 [0.78–0.74], 0.020.46 [0.56–0.42], 0.0710.9 [11.6–10.1], 0.7
B237 [39–34], 21.23 [1.24–1.21], 0.020.64 [0.65–0.62], 0.028.7 [9.2–8.2], 0.4
B331 [33–29], 21.73 [1.75–1.72], 0.020.76 [0.78–0.73], 0.038.9 [9.8–7.9], 1.4
1 Difference in time from when the second peak occurred to the end of the positive phase. 2 Cumulative impulses at the time of the arrival of the secondary pressure peak.
Table 4. Scaling blast parameters from 75% to 100% to assess the agreement of predicted blast parameters with those measured in experiments at 100% (difference between mean values given in percent and absolute values).
GaugePi (kPa)ta (ms)t+ (ms)I+ (kPa.ms)
Experiment A 100% mean [range]254 [303–219]0.33 [0.35–0.32]0.58 [0.69–0.46]31.2 [32.8–29.5]
Expected A from 75%2740.350.5330.0
Difference8%; 207%; 0.028%; 0.05−4%; 1.2
Experiment A2 100% mean [range]125 [165–86]0.51 [0.52–0.50]0.41 [0.52–0.32] 116.6 [19.1–14.0] 2
Expected A2 from 75%970.570.31 121.0 2
Difference−23%; 2912%; 0.06−23%; 0.0927%; 4.4
Experiment B1 100% mean [range]69 [74–63]0.76 [0.78–0.74]0.46 [0.56–0.42]10.9 [11.6–10.1]
Expected B1 from 75%700.800.4511.1
Difference2%; 25%; 0.04−2%; 0.012%; 0.2
Experiment B2 100% mean [range]37 [39–34]1.23 [1.24–1.21]0.64 [0.65–0.62]8.7 [9.2–8.2]
Expected B2 from 75%381.280.638.4
Difference3%; 14%; 0.05−2%; 0.01−3%; 0.3
Experiment B3 100% mean [range]31 [33–29]1.73 [1.75–1.72]0.76 [0.78–0.73]8.9 [9.8–7.9]
Expected B3 from 75%301.770.797.8
Difference−4%; 12%; 0.045%; 0.04−11%; 1.0
1 Difference in time from when the second peak occurred to the end of the positive phase. 2 Cumulative impulses at the time of the arrival of the secondary pressure peak.
Table 5. Comparing CFD modelling results with 75% experimental data: positive phase blast parameters at each gauge location. (Difference between mean values given in percent and absolute values).
GaugePi (kPa)ta (ms)t+ (ms)I+ (kPa.ms)
Experiment A 75% mean [range]274 [323–223]0.26 [0.28–0.24]0.40 [0.44–0.36]22.5 [25.1–18.5]
CFD Model1500.330.3421.3
Difference−45%; −12427%; 0.07−16%; −0.06−5.3%; −1.2
Experiment B1 75% mean [range]70 [77–66]0.60 [0.67–0.56]0.34 [0.35–0.32]8.3 [8.7–8.0]
CFD Model690.570.328.5
Difference−1%; −1−5%; −0.03−7%; −0.022%; 0.2
Experiment B2 75% mean [range]38 [41–34]0.96 [1.03–0.91]0.47 [0.51–0.43]6.3 [6.5–6.1]
CFD Model380.920.467.2
Difference0%; 0−4%; −0.04−2.4%; −0.0114%; 0.9
Experiment B3 75% mean [range]30 [32–28]1.33 [1.40–1.28]0.59 [0.63–0.57]5.9 [6.2–5.2]
CFD Model281.300.656.9
Difference−7%; −22%; 0.03 10%; 0.0617%; 1.0
Table 6. Comparing CFD modelling results with 100% experimental data: positive phase blast parameters at each gauge location. (Difference between mean values given in percent and absolute values).
GaugePi (kPa)ta (ms)t+ (ms)I+ (kPa.ms)
Experiment A 100% mean [range]254 [303–219]0.33 [0.35–0.32]0.58 [0.69–0.46]31.2 [32.8–29.5]
CFD Model1510.440.4427.1
Difference−41%; −10333%; 0.11−24%; −0.14−13%; 4.1
Experiment B1 100% mean [range]69 [74–63]0.76 [0.78–0.74]0.46 [0.56–0.42]10.9 [11.6–10.1]
CFD Model690.770.4611.5
Difference0%; 01%; 0.01−0%; 06%; 0.6
Experiment B2 100% mean [range]37 [39–34]1.23 [1.24–1.21]0.64 [0.65–0.62]8.7 [9.2–8.2]
CFD Model381.230.609.1
Difference3%; 10%; 0−6%; −0.045%; 0.4
Experiment B3 100% mean [range]31 [33–29]1.73 [1.75–1.72]0.76 [0.78–0.73]8.9 [9.8–7.9]
CFD Model281.730.899.2
Difference−10%; −30%; 017%; 0.133%; 0.3
Table 7. Comparing CFD modelling results with 100% experimental data: positive phase blast parameters at each gauge location. (Difference between mean values given in percent and absolute values).
GaugePi (kPa)ta (ms)t+ (ms)I+ (kPa.ms)
Experiment A 250% mean [range]206 [336–134]1.15 [1.17–1.12] 1.38 [1.89–0.92]75.9 [95.7–58.3]
Expected A from 100%2540.831.4577.9
Expected A from 75%2740.881.3374.9
Percentage Difference23%; 33%−28%; −23%5%; −4%3%; −1%
Experiment A2 250% mean [range] 1106 [152–56|N/A]1.58 [1.75–1.44|N/A]0.93 [1.34–0.44|N/A] 242.0 [59.7–32.1|N/A] 3
Expected A2 from 100%1251.271.01 241.4 3
Expected A2 from 75%971.430.78 252.5 3
Percentage Difference18%; −9%−19%; −10%9%; −16%−1%; 25%
Experiment B1 250% mean [range]70 [90–74]1.93 [1.94–1.92]2.04 [1.75–2.34]38.5 [41.1–35.8]
Expected B1 from 100%691.901.1427.2
Expected B1 from 75%702.001.1227.7
Percentage Difference−2%; 0%−1%; 4%−44%, −45%−29%; −28%
Experiment B2 250% mean [range]42 [42–41]2.98 [3.31–2.58]2.15 [2.50–1.87]29.7 [34.4–25.8]
Expected B2 from 100%373.071.6021.7
Expected B2 from 75%383.211.5721.0
Percentage Difference−12%; −9%3%; 7%−25%; −27%−27%; −29%
Experiment B3 250% mean [range]36 [37–35]4.22 [4.50–3.93]1.49 [single data point]24.2 [single data point]
Expected B3 from 100%314.341.8922.14
Expected B3 from 75%304.441.9819.81
Percentage Difference−14%; −17%3%; 5%27%; 33%−4%; −15%
1 Test 25 from [11]—no distinctive secondary peak, hence “N/A” was given as a value alongside the lowest value measured. 2 Difference in time from when the second peak occurred to the end of the positive phase. 3 Cumulative impulses at the time of the arrival of the secondary pressure peak.
Disclaimer/Publisher’s Note: The statements, opinions and data contained in all publications are solely those of the individual author(s) and contributor(s) and not of MDPI and/or the editor(s). MDPI and/or the editor(s) disclaim responsibility for any injury to people or property resulting from any ideas, methods, instructions or products referred to in the content.

