Abstract
Blade tip-timing is one of the most widely used non-contact measurement methods for rotating blade vibration. The classic blade tip-timing method is to identify the vibration parameters of the blade based on the time of blade tip arrival to the tip-timing sensor installed on the casing. Since the vibration measurement of blade tip-timing is a serious under-sampling method, the blade resonance frequency is usually higher than the sampling frequency of the BTT data acquisition system, resulting in a large identification error of blade vibration parameters. In view of the above shortcomings, a blade vibration parameters identification method is proposed based on the mapping matching between the static waveform of the sensor and the dynamic waveform of the blade tip-timing. The modulation effects of different vibration displacements, velocities and vibration amplitudes on the tip-timing waveform of the sensor are analyzed. The vibration displacements and velocities of the blade tip passing through the sensor are obtained by the waveform mapping method, and then the vibration parameters of the blade are identified. The influence of the number of blade tip-timing sensors on the identification accuracy of the blade vibration parameters identification algorithm is observed based on the waveform mapping theory. The identification accuracy of waveform mapping method is compared with other methods. The results show that compared with the under-sampled time of arrival (TOA) data of classic BTT applications, the modulation of the sensor waveform output by blade vibration can provide additional data, and the waveform mapping method can not only reduce the number of sensors but also improve the identification accuracy of blade vibration parameters. The waveform mapping method has higher identification accuracy of blade vibration parameters compared with the waveform method in the reference.
1. Introduction
As the key component of aero-engine, the rotor blade is subjected to loads such as high speed, high temperature, high pressure and various complex forces, which make it the most easily vibration parts. In order to reduce the risk of high cycle fatigue failure of blade vibration, the real-time monitoring of blade vibration is applied to ensure the safe operation of aero-engine.
The blade tip-timing method is one of the research hotspots in non-contact vibration monitoring of rotating blades. It develops on the basis of discontinuous phase method and pulse modulation method. Compared with other measurement methods, the blade tip-timing method is not only simple in structure and convenient in use, but also can measure the vibration of all blades at the same time.
The basic principle of the blade tip-timing method is to install the blade tip-timing sensors on the casing at the top of the blade and use the sensors to sense the arrival time of the blade. Due to the vibration of the blade, the arrival time of the blade would be ahead or behind. Through the use of different blade tip-timing processing algorithms to process the time series, the blade vibration information can be obtained [1].
The AMERICAN ALLIANCE for ADVANCING TEST WORK has regarded blade tip-timing measurement technology as an important online monitoring technology [2]. In recent years, the extensive research has been carried out on blade tip-timing vibration measurement technology abroad, such as the UNIVERSITY of MANCHESTER in the UNITED KINGDOM, HOOD COMPANY in the UNITED STATES, FOGALE COMPANY in FRANCE, ROTADATA COMPANY in the UNITED KINGDOM and MTU COMPANY in GERMANY [3,4,5,6]. This technology can be used to measure blade flutter, blade stress, blade fatigue and other abnormal blade vibration. In China, TIANJIN UNIVERSITY has firstly carried out research on the measurement of vibration parameters of non-contact rotating blades based on tip-timing [7,8,9]. In addition, the NATIONAL UNIVERSITY of DEFENSE TECHNOLOGY, BEIJING UNIVERSITY of CHEMICAL TECHNOLOGY and LIAONING UNIVERSITY of TECHNOLOGY have also conducted in-depth research on this technology [10,11,12,13,14,15].
According to the different number and distribution of sensors, different blade vibration forms and different test conditions, a variety of blade tip-timing vibration signal analysis algorithms are proposed. The velocity vector end trace method is also called the single-sensor method; only one blade tip-timing sensor is needed to obtain blade synchronous vibration information [16]. In this method, the rotating speed is changed gradually; that is, the exciting frequency of the blade is changed, and the amplitude and phase of synchronous vibration of the blade are also changed accordingly, so the vibration displacement curve obtained is also changed according to certain rules. The basic principle of the two parameter method, also known as the double-sensor method, is to obtain two groups of blade vibration displacement signals by using two blade tip-timing sensors distributed according to a certain angle on the basis of the velocity vector end trace method [17,18]. Taking these two groups of displacement signals as the horizontal and longitudinal coordinates, an elliptic curve can be obtained. According to the relevant parameters of the ellipse (major and minor axis, inclination angle, etc.), the synchronous vibration amplitude and frequency doubling of the blade can be calculated. The autoregressive method is based on the principle of autoregression and the single-mode single degree of freedom model, at least four blade tip-timing sensors are needed to identify the blade vibration parameters, and the angle distribution between sensors is equal as far as possible. Four vibration displacements at different times of the blade are obtained, and every revolution and the vibration frequency, vibration amplitude and the other parameters of the blade are obtained through the autoregressive linear equations [19]. The uniform distribution method and “5 + 2” method distribute the multi blade tip-timing sensors evenly around the casing and improve the sampling frequency of the corresponding vibration signal [20].
Because the blade tip-timing vibration measurement is a seriously under-sampling method, the blade resonance frequency is usually higher than the sampling frequency of the BTT data acquisition system, which leads to large identification error of blade vibration parameters. This has aroused people’s desire for the new measurement and signal processing methods [21,22,23,24,25,26,27]. Ref. [28] proposes a new identification approach based on nonlinear free vibration decay. The nonlinear free response of the system was determined by the coupling of generalized variation iteration and the modified differential transformation methods.
The waveform of the blade tip-timing sensor can be used as an additional information source for blade vibration analysis, which enriches the traditional blade tip-timing data. In [29,30,31], the importance of sensor waveform analysis and the need for new signal processing technology are pointed out. Ref. [30] proposed a method for blade vibration identification based on the whole sensor signal waveform, which significantly improved the available data volume of BTT sensor. However, the error between the identified resonance frequency and the real resonance frequency is large. The method needs further improvement to improve its identification accuracy. In Ref. [32], a method for identifying blade vibration parameters of turbomachinery based on blade tip-timing and tip clearance sensor waveforms is proposed. Since there is noise in the measured waveform signal, the iterative convergence analysis method, increasing the number of optimized waveforms, is needed to identify the blade vibration parameters, which is time-consuming and is not suitable for real-time monitoring of blade vibration.
Aiming at the shortcomings, a method of blade vibration parameter identification is proposed based on the mapping of sensor static waveform and dynamic waveform. The chapters of this paper are as follows: Section 2 presents the theory of waveform mapping method; the influence of different parameters on the waveform shape is observed in Section 3; Section 4 analyzes the influence of number of sensors on the identification accuracy of waveform mapping method; Section 5 summarizes the main conclusions.
2. Waveform Mapping Theory
2.1. Static Calibration of Sensor Waveform
When the blade tip-timing sensor is used to measure the tip-timing data of the given thickness blade, the output voltage waveform of the blade tip-timing sensor mainly depends on the radial distance between the blade tip and the sensor probe and the angle between the blade center line and the sensor center line (i.e., the coincidence degree between the blade tip and the sensor probe). The output voltage can be expressed as
The sensor waveform is calibrated in the static state. First of all, we are given a blade tip radial clearance value, then we change the included angle to measure the output voltage value of different angles. Secondly, we are given the next blade tip radial clearance value, then we change the included angle to measure the output voltage value of different included angles, and so on. Finally, in the range of radial clearance measurement and coincidence degree, the output voltage values under different radial clearance angles is obtained. The calibrated output waveform group of the sensor is obtained by data fitting.
The static calibration system mainly consists of a radial calibration system and circumferential calibration system, as shown in Figure 1. The radial calibration system consists of manually fine-tuning the X–Y displacement platform, the blade tip-timing sensor and its fixing bracket. During the radial calibration, we adjust the Y-direction micrometer head to ensure that the center line of the blade and the center line of the sensor overlap as much as possible. Then, the X-direction micrometer head is adjusted to make the sensor move with the bracket fixed on the displacement platform along the X direction, and then the radial distance between the sensor probe and the blade tip is adjusted. The circumferential calibration system consists of an R-direction manual fine-tuning rotation platform, a fixed bracket, a circumferential adjustment plate and other components. The fixing bracket is connected with the fixing hole on the operating platform. The rotation platform is connected with a fixing bracket by bolts, and a circumferential adjusting plate is fixed on it. During the circumferential calibration, the rotation platform is first set to rough shift, and the rotation platform is rotated to move the blade and sensor into the center position. Then, the rotation platform is adjusted to the fine-tuning gear, the R-direction micrometer head is rotated to drive the circumferential regulating plate to rotate and then the blade is slightly rotated to complete the circumferential calibration.
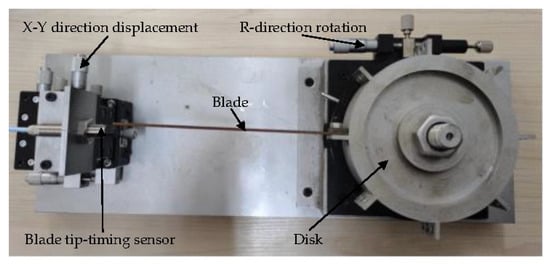
Figure 1.
Diagram of static calibration system.
When the blade tip clearance is a fixed value, the output voltage of the sensor can be expressed as follows:
where is the circumferential displacement of the blade tip relative to the OPR sensor and is the fitting static calibration waveform function.
2.2. Dynamic Measurement of Blade Tip Timing Sensor Waveform
The output voltage of the sensor can be expressed as follows:
Here, is the time interval between the blade tip-timing sensor and the OPR sensor. When the blade tip is not entering the measurement range of blade tip-timing sensor (coincidence degree), the output voltage is 0. is the measurement waveform function.
2.3. Identification of Blade Vibration Parameters Based on Waveform Mapping Method
The single harmonic vibration equation of blade is as follows:
where is the blade tip vibration displacement, is the vibration amplitude of blade tip, is the excitation order, is the rotational speed, is the vibration initial phase and is the vibration constant offset.
The position of the first blade root coincides with that of the OPR groove in the axial direction. When the first blade tip passes through the first tip-timing sensor, the circumferential displacement of the first blade tip relative to the OPR sensor is as follows:
when the blade tip rotates into the sensor measurement range; that is, when , is the blade tip radius, is the angle between the first blade tip-timing sensor and the OPR sensor and is the maximum angle between the blade center line and the sensor center line in the measurement range.
According to the mapping relationship between the dynamic test voltage waveform and the static calibration voltage waveform of blade tip timing sensor, as shown in Figure 2, in the same monotone interval, the data points with the same voltage values of the two waveforms are in the same time state; that is:
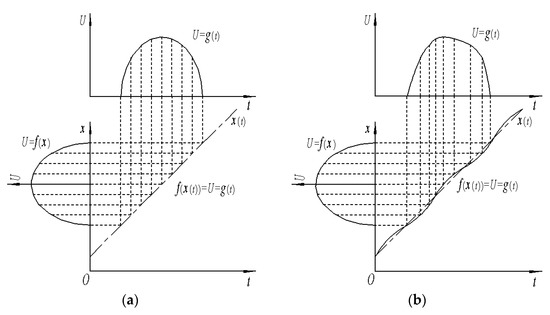
Figure 2.
Mapping relationship between blade tip-timing waveform and static calibration waveform. (a) Waveform mapping when the blade is not vibrating. (b) Waveform mapping when the blade is vibrating.
The inverse function of Equation (6) is solved as follows:
Substituting Equations (4) and (5) into Equation (7), and sorting out the following results,
When the time of the first blade passing through the -th data point of the first waveform of the first blade tip timing sensor is , then Equation (8) becomes:
Here, is the number of data points in the waveform.
Let
Equation (9) is expressed in matrix form:
The range of the main excitation order of a rotating machinery can be estimated, since the excitation order is a natural number. We select a certain range of excitation order, substitute its value into Equation (13) and use the least square method to solve the corresponding solution vector. The solution vector is as follows:
Equation (14) is substituted into Equation (13), and the measured vibration displacement value is subtracted, then the residual is
where is a column vector of element , j = 1, j = 2 …… j = n − 1. The deviation between the traversal value and the actual measured value is expressed by root mean square of residual error, and the formula is as follows:
It is assumed that the actual excitation order of blade synchronous vibration is and the theoretical displacement residual is = 0; that is, the coefficient matrix and solution vector corresponding to the excitation order completely satisfy Equation (13). However, there are various errors in the actual blade vibration measurement; the condition for to take the minimum is the traversal excitation order . The excitation order corresponding to the minimum value is obtained through the excitation order traversal process, and the nonlinear least square method in Equations (14)–(16) is used to solve the corresponding solution vector . According to the vibration frequency, vibration amplitude, initial phase and constant offset formulae in Equations (17)–(20), the synchronous vibration parameters of blade are obtained.
Vibration frequency:
Vibration amplitude:
Initial phase:
Constant offset:
3. Analysis of Influencing Factors of Blade Tip-Timing Waveform Shape
The blade dynamics model is established to simulate the blade vibration. Assuming that the blade performs single-frequency simple harmonic vibration, the vibration equation is as in Equation (8), where the vibration amplitude = 3 mm, excitation order = 8, rotational speed rad/s, initial phase rad and constant offset = 0.2 mm. The vibration displacement and vibration velocity waveform of the blade tip are shown in Figure 3. In Figure 3, Case 1 is the vibration equilibrium position; the vibration displacement is the smallest and the vibration velocity is the positive maximum. Case 2 is the position of the positive maximum value of the vibration displacement, and the vibration velocity passes the 0 point from positive to negative. Case 3 is the vibration equilibrium position; the vibration displacement is the smallest and the vibration velocity is the negative maximum. Case 4 is the position of the negative maximum value of the vibration displacement, and the vibration velocity passes the 0 point from negative to positive.
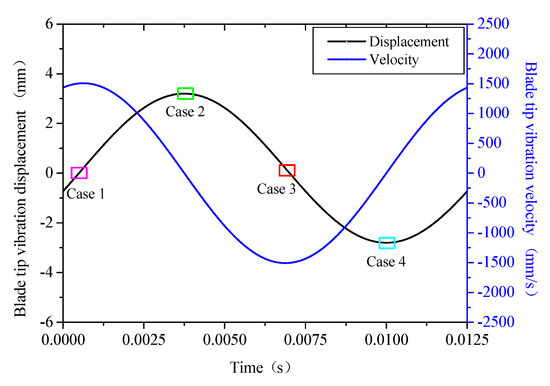
Figure 3.
Vibration displacement and vibration velocity of blade tip.
Figure 4 shows the waveform of the blade tip passing through the timing sensor when the blade is rigidly rotated and vibrating. Figure 4a, Case 1, shows the positive synchronization of the vibration. Vibration displacement changes from negative to positive and passes through the equilibrium position, and the vibration displacement is close to 0, so the times when the highest points of the two waveforms appear basically coincide. Since the vibration displacement changes from negative to positive and passes through the equilibrium position, compared with the tip of the rigid rotating blade, the tip of the vibrating blade enters the sensing range of the sensor with a lag and exits the sensing range of the sensor first. Figure 4b, Case 2, shows the vibration ahead; the vibration speed changes from positive to negative and passes through the 0 position, and the vibration displacement is the largest, so the tip-timing waveform of vibrating blade is shifted to the left compared with the tip-timing waveform of rigid rotating blade—that is, the vibration is ahead. Compared with the tip of the rigid rotating blade, the tip of the vibrating blade enters and exits the sensing range of the sensor first. Figure 4c, Case 3, is the case of negative vibration synchronization. Vibration displacement changes from positive to negative through the equilibrium position, and the vibration displacement is close to 0, so the times when the highest points of the two waveforms appear basically coincide. Since the vibration displacement changes from positive to negative through the equilibrium position, compared with the tip of the rigid rotating blade, the tip of the vibrating blade enters the sensing range of the sensor first and exits the sensing range of the sensor with a lag. Figure 4d, Case 4, is the case of vibration hysteresis; the vibration velocity changes from negative to positive and passes through the 0 position, and the vibration displacement is the largest negative, so the tip-timing waveform of vibrating blade is shifted to the right compared with the tip-timing waveform of rigid rotating blade; that is, in vibration hysteresis, compared with the tip of the rigid rotating blade, the tip of the vibrating blade enters and exits the sensing range of the sensor with a lag.
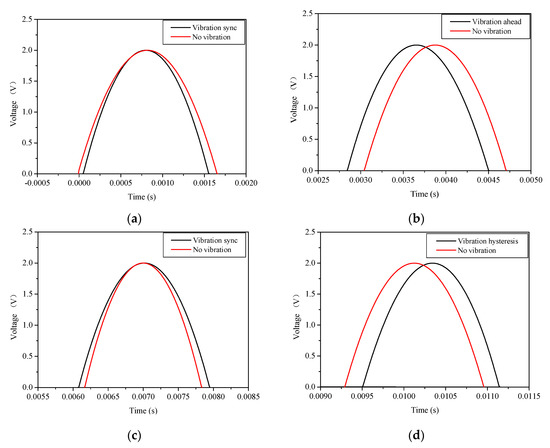
Figure 4.
Comparison of blade tip timing waveform with or without blade vibration: (a) Case 1; (b) Case 2; (c) Case 3; (d) Case 4.
The influence of blade vibration amplitude on the blade tip-timing waveform is shown in Figure 5. Figure 5a, Case 1, shows the positive synchronization of vibration. When the blade vibration amplitudes are different, the times of highest points of tip-timing waveforms appear basically coincide. With the increase of vibration amplitude, the waveform shrinks inward and the time for the blade tip to pass through the sensing range of the sensor becomes shorter. Figure 5b, Case 2, shows the vibration ahead. When the blade vibration amplitudes are different, the highest point of each tip-timing waveform appears at different times. As the vibration amplitude increases, the time interval of waveform shifting to the left is larger, but the time of blade tip passing through the sensing range of the sensor is basically unchanged. Figure 5c, Case 3, is the case of negative vibration synchronization. When the blade vibration amplitudes are different, the times at which the highest points of each tip-timing waveform appear are basically coincident. With the increase of vibration amplitude, the waveform expands outward and the time for the blade to pass through the sensing range of the sensor becomes longer. Figure 5d, Case 4, is the case of vibration hysteresis. When the blade vibration amplitudes are different, the timing of the highest point of each tip-timing waveform is different. As the vibration amplitude increases, the time interval of waveform shifting to the right is larger, but the time of blade tip passing through the sensing range of the sensor is basically unchanged.
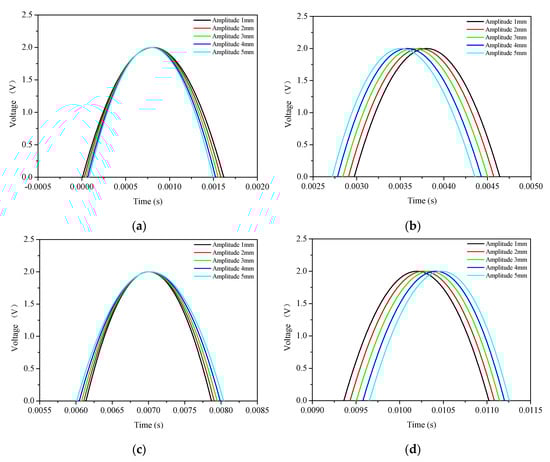
Figure 5.
Influence of vibration amplitude on blade tip timing waveform: (a) Case 1; (b) Case 2; (c) Case 3; (d) Case 4.
Figure 6 shows the vibration displacement and vibration velocity curves of the blade tip passing through the sensing range of the sensor obtained by using the waveform mapping theory. Figure 6a–d covers, respectively, the vibration displacement and vibration velocity of the blade tip passing through the sensing range of the sensor mapped when the vibration is in positive synchronization, in vibration ahead, in negative synchronization and in vibration hysteresis. It can be seen from Figure 6 that the values and variation trends of the vibration displacement and vibration velocity of the mapped blade tip passing through the sensing region of the sensor are consistent with those of Case 1, Case 2, Case 3 and Case 4 region in Figure 3, respectively, which verifies the correctness of the waveform mapping theory.
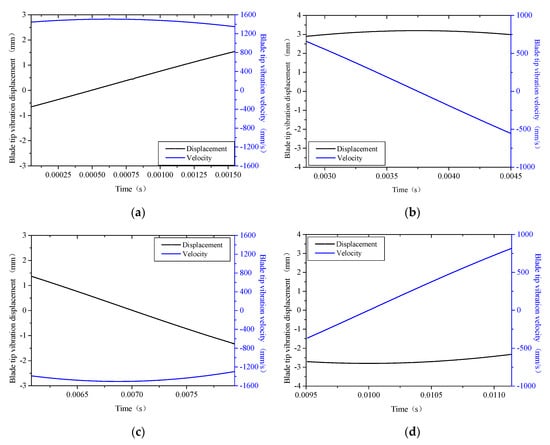
Figure 6.
Vibration displacement and vibration velocity mapping based on blade tip timing waveform: (a) Case 1; (b) Case 2; (c) Case 3; (d) Case 4.
4. Identification Accuracy Analysis of Waveform Mapping Method
4.1. Identification Accuracy Analysis of Single-Sensor Waveform Mapping Method
Figure 7 shows the influence of excitation orders on the identification average error of the single-sensor waveform matching method with different signal-to-noise ratios (SNR). The average error includes the relative error of initial phase, the relative error of vibration amplitude and the relative error of constant offset. It can be seen from Figure 7a–f that when the SNR is 40 db, 50 db, 60 db, 70 db, 80 db and 90 db, the single-sensor waveform matching method can accurately identify the vibration parameters when the excitation order is , , , , , , respectively. The identified relative error of the initial phase, relative error of vibration amplitude and the relative error of constant offset meet the accuracy requirements. The identification accuracy of vibration amplitude is the highest, followed by the initial phase and finally the constant offset. With the increase of SNR, the higher the precision of the signal, the larger the range of excitation order accurately identified. When the SNR is 90 db, all excitation orders can be accurately identified by this method.
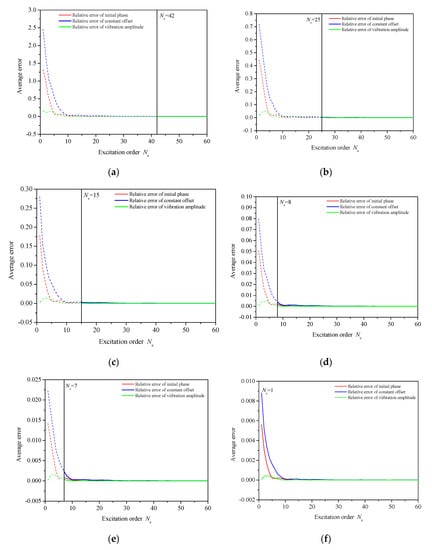
Figure 7.
Influence of excitation order on the average error of single-sensor waveform identification under different SNR: (a) SNR 40 db; (b) SNR 50 db; (c) SNR 60 db; (d) SNR 70 db; (e) SNR 80 db; (f) SNR 90 db.
4.2. Identification Accuracy Analysis of Double-Sensors Waveform Mapping Method
The influence of excitation orders on the average error of the double-sensor waveform matching method with different SNR is shown in Figure 8. It can be found from Figure 8a–e that when the SNR is 20 dB, 30 dB, 40 dB, 50 dB and 60 dB, and the excitation order is , , , and , respectively, the excitation order can be accurately identified by the double-sensor waveform matching method, and the accuracy of the identified initial phase, amplitude and constant offset meet the requirements. The relative error of vibration constant offset identification is the largest, the relative error of initial phase is in the middle and the relative error of vibration amplitude is the smallest. As the SNR becomes smaller, the lower the accuracy of the signal, the smaller the range of excitation order accurately identified. This method can accurately identify all excitation orders when the SNR is 60 db.
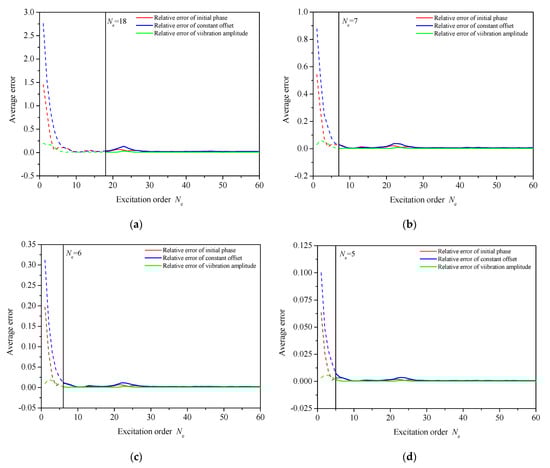
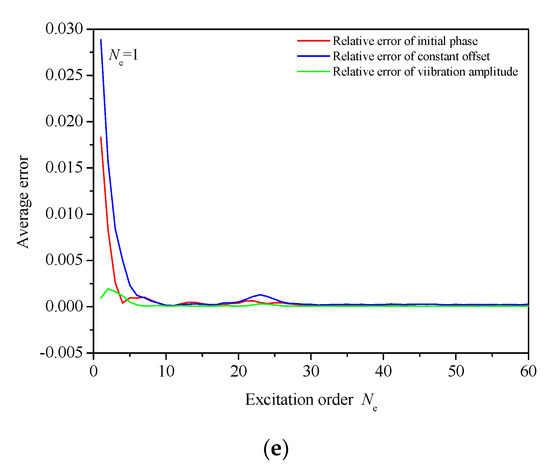
Figure 8.
Influence of excitation order on the average error of double-sensor waveform identification under different SNR: (a) SNR 20 db; (b) SNR 30 db; (c) SNR 40 db; (d) SNR 50 db; (e) SNR 60 db.
4.3. Identification Accuracy Analysis of Three-Sensors Waveform Mapping Method
Figure 9 shows the influence of excitation orders on the identification average error of the three-sensor waveform matching method with different SNR. From Figure 9a–e, it can be seen that when the SNR is 10 db, 20 db, 30 db, 40 db and 50 db, and the excitation order is , , , and , respectively, the three-sensors waveform matching method can accurately identify the excitation order, the identified relative error of vibration initial phase, the relative error of amplitude and the relative error of constant offset meet the accuracy requirements. The identification accuracy of vibration amplitude is higher than that of vibration initial phase, while the identification accuracy of vibration initial phase is higher than that of vibration constant offset. With the SNR ratio increases, the higher the accuracy of the signal, the larger the range of accurately identified excitation orders. It can accurately identify any excitation order when the SNR is 50 db.
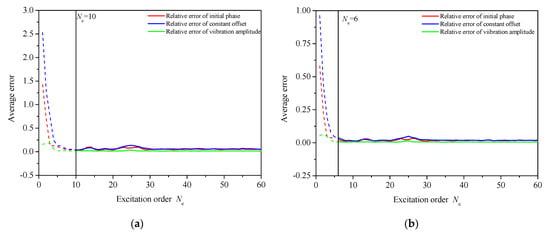
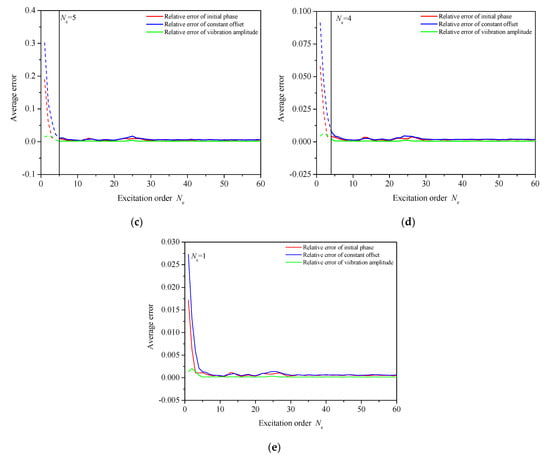
Figure 9.
Influence of excitation order on the average error of three-sensor waveform identification under different SNR: (a) SNR 10 db; (b) SNR 20 db; (c) SNR 30 db; (d) SNR 40 db; (e) SNR 50 db.
4.4. Influence of Number of Sensors on Identification Accuracy of Waveform Mapping Method
The relative error of amplitude, relative error of constant offset and relative error of initial phase identified by the single-sensor, double-sensor and three-sensor waveform matching methods with different SNR are shown in Figure 10, Figure 11 and Figure 12, respectively. It can be found from Figure 10, Figure 11 and Figure 12 that when the SNR is constant, the initial excitation order of accurate recognition gradually decreases with the increase of the number of sensors, and the relative error of amplitude, relative error of constant offset and relative error of initial phase are all relatively small; that is, the recognition accuracy is high. As the SNR increases, the accurately identified initial excitation order is smaller. For a certain SNR, with the increase of excitation order, the relative error of amplitude, relative error of constant offset and relative error of initial phase are all smaller; that is, the identification accuracy of vibration amplitude, constant offset and initial phase is higher. When the excitation order is the same, the larger the SNR, the smaller relative error of amplitude, relative error of constant offset and relative error of initial phase.
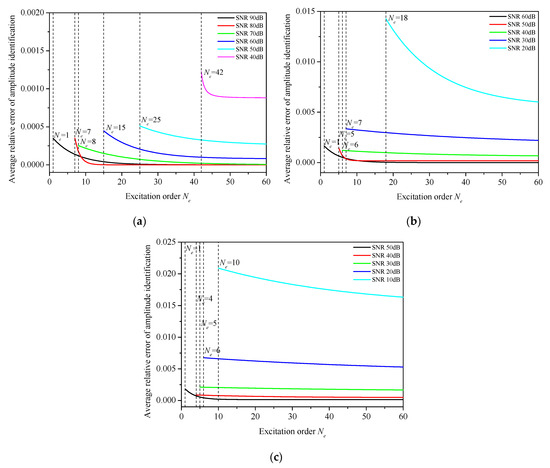
Figure 10.
Relative error of amplitude identification by waveform method under different SNR: (a) single-sensor; (b) double-sensor; (c) three-sensor.
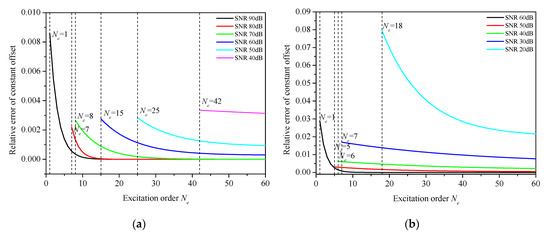
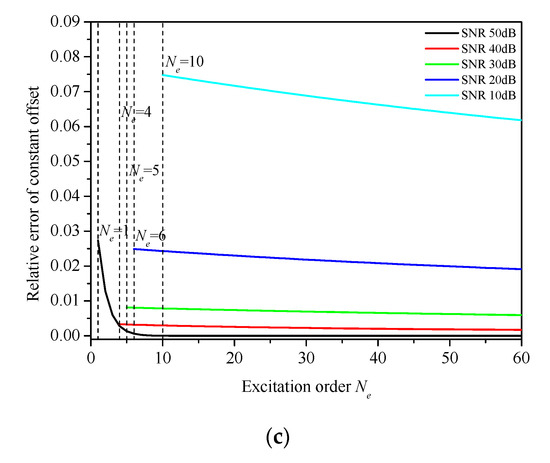
Figure 11.
Relative error of constant offset identification by waveform method under different SNR: (a) single-sensor; (b) double-sensor; (c) three-sensor.
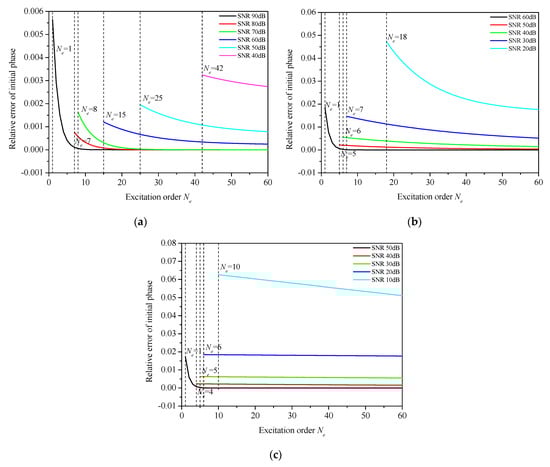
Figure 12.
Relative error of initial phase identification by waveform method under different SNR: (a) single-sensor; (b) double-sensor; (c) three-sensors.
4.5. Comparison of Identification Accuracy between Waveform Mapping Method and Other Methods
The identification accuracy of blade synchronous vibration parameters is compared between the waveform mapping method and the classical blade tip-timing method. According to the classical blade tip-timing theory, at least four blade tip-timing sensors are needed to identify the blade synchronous vibration parameters (amplitude, excitation order, initial phase and constant offset). When the SNR is 30 db, the classical blade tip-timing method (four sensors) and waveform mapping method (four sensors, three sensors and two sensors) are used to identify the synchronous vibration parameters of the blade. The accuracy of classical blade tip-timing method and waveform mapping method in identifying excitation order is shown in Figure 13. The number of identifications is 100 times. As can be seen from Figure 13, the accuracy of waveform mapping method (four sensors) in identifying excitation order is higher than that of classical blade tip-timing method. With the decrease of the number of sensors, the accuracy of the waveform mapping method for identifying the excitation order decreases, but it is still higher than that of the classical blade tip-timing method. Figure 14, Figure 15 and Figure 16 show the average relative error of vibration amplitude, average relative error of initial phase and average of relative error constant offset obtained by the classical blade tip-timing method and waveform mapping method, respectively. It can be found from Figure 14, Figure 15 and Figure 16 that within the order range of 100% accuracy of excitation order identification, the average relative error of vibration amplitude, average relative error of initial phase and average relative error of constant offset obtained by the waveform mapping method (four sensors) are all smaller than those obtained by classical blade tip-timing method. With the decrease of the number of sensors, the average relative error of vibration amplitude, the average relative error of initial phase and the average relative error of constant offset of the waveform mapping method increase, but they are still smaller than the identification error of the classical blade tip-timing method. It shows that compared with the classical blade tip-timing method, the waveform mapping method can not only reduce the number of blade tip-timing sensors used but also improve the identification accuracy of the synchronous vibration parameters of blades.
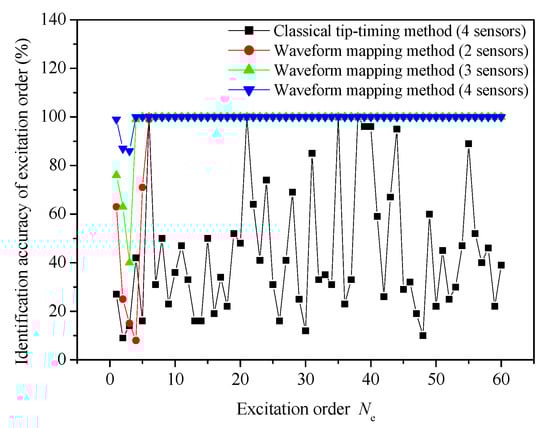
Figure 13.
Identification accuracy of excitation order.
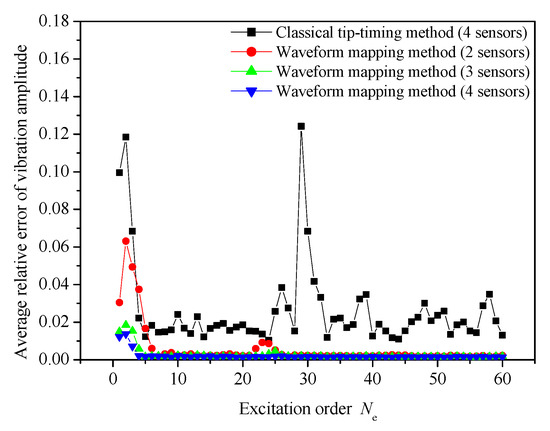
Figure 14.
Average relative error of vibration amplitude.
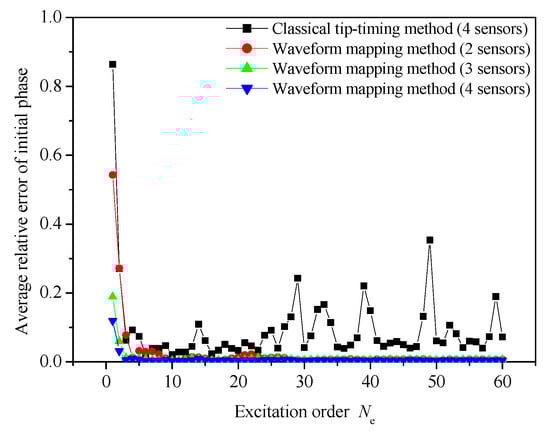
Figure 15.
Average relative error of initial phase.
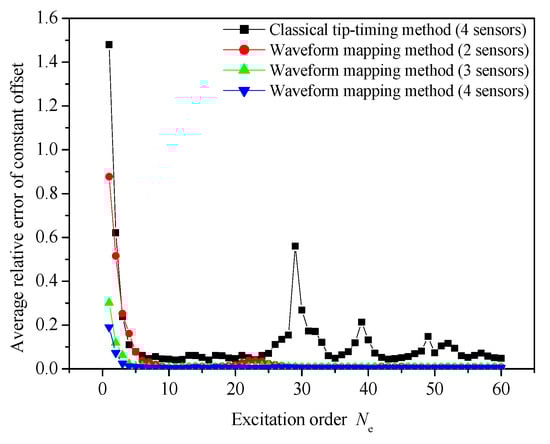
Figure 16.
Average relative error of constant offset.
The identification accuracy of excitation order and vibration frequency of the waveform mapping method and waveform method in Ref. [29] are compared, as shown in Table 1. According to Table 1, when the SNR is infinity (no error), the relative error of vibration frequency identification of waveform method in Ref. [29] is 14.10%, the excitation order identification accuracy of waveform mapping method is 100% and the relative error of vibration frequency identification is 0%. The vibration frequency identification accuracy of the waveform mapping method is higher than that of the waveform method in Ref. [29]. With the decrease of SNR, the identification accuracy of excitation order of waveform mapping method decreases. However, as long as the excitation order identification is accurate, the relative error of vibration frequency identification is 0%.

Table 1.
Comparison of identification accuracy of excitation order and vibration frequency between the waveform mapping method and the waveform method in reference.
5. Conclusions
A blade vibration parameter identification method based on the mapping matching between the static waveform of the sensor and the dynamic waveform of the blade tip-timing is proposed in this paper. First, the standard waveform of the non-vibration blade passing through the sensor is obtained by the static calibration simulation experiment of the sensor. Secondly, the blade tip-timing modulation waveform output by the sensor when the blade vibrates is presented through the dynamic measurement simulation experiment. Finally, the blade vibration parameters are identified based on the mapping matching between the static standard waveform of the sensor and the blade tip-timing modulation waveform. The influences of vibration displacements, velocities and vibration amplitudes on the tip-timing waveform of sensor are analyzed. The vibration displacement and velocity of the blade tip passing through the sensor are presented by the waveform mapping matching method, and then the vibration parameters of blade are identified. The influence of the number of blade tip-timing sensors on the identification accuracy of blade vibration parameters identification algorithm is observed based on waveform mapping matching theory. The conclusions are as follows:
- (1)
- When the vibration is in positive or negative synchronization, the highest point of the tip-timing waveform of the vibration blade coincides with that of the non-vibration blade. With the increase of amplitude, the waveform shrinks inward or expands outward; that is, the time interval between the blade tip passing through the sensing range of the sensor becomes smaller or larger. When the vibration is ahead or in hysteresis, the highest point of the tip-timing waveform of vibration blade does not coincide with that of non-vibration blade. With the increase of amplitude, the time interval of the waveform moving left or right is larger, but the time interval of blade tip passing through the sensing range of the sensor is basically unchanged;
- (2)
- The identification accuracy of vibration amplitude is the highest, followed by the initial vibration phase and finally the constant offset, whether it a single-sensor, double-sensor and three-sensor waveform mapping method is employed. As the SNR increases, the accurately identified initial excitation order decreases. For a certain SNR, with the increase of excitation order, the relative error of amplitude, relative error of constant offset and relative error of initial phase are all smaller; that is, the identification accuracy of the vibration amplitude, constant offset and initial phase is higher. When the excitation order is the same, the larger the SNR, the smaller the relative error of amplitude, the relative error of constant offset and the relative error of initial phase;
- (3)
- When the SNR is constant, with the increase of the number of sensors, the accurately identified initial excitation order gradually becomes smaller, and the relative error of vibration amplitude, relative error of constant offset and relative error of initial phase are all smaller, i.e., there is higher identification accuracy. When the SNR is 90 db, 60 db and 50 db, respectively, single-sensor, double-sensor and three-sensor waveform matching methods can accurately identify all excitation orders. This research result indicates that increasing the number of sensors can improve the identification accuracy of the excitation order and other vibration parameters by the waveform matching method under the condition of low SNR;
- (4)
- Compared with the classical blade tip-timing method, the waveform mapping method can not only reduce the number of tip-timing sensors used but also improve the identification accuracy of the blade-synchronous vibration parameters. The vibration frequency identification accuracy of the waveform mapping method is higher than that of the waveform method in reference.
Author Contributions
Conceptualization, L.Z.; methodology L.Z.; software, Q.W.; validation, L.Z.; formal analysis, Q.W.; investigation, X.L.; data curation, Q.W.; writing-original draft preparation, L.Z.; writing-review and editing, L.Z., Q.W. and X.L.; visualization, X.L.; supervision, L.Z.; project administration, L.Z. All authors have read and agreed to the published version of the manuscript.
Funding
The work is supported by National Natural Science Foundation of China (Grant no. 51505206), Liaoning Province Applied Basic Research Program Project (Grant no. 2023JH2/101300227), Key Laboratory of Vibration and Control of Aero-Propulsion System, Ministry of Education, Northeastern University (Grant no. VCAME202211), Liaoning Provincial Natural Science Foundation Guidance Program Project (Grant no. 2019-ZD-0694), Liaoning Provincial Department of Education Scientific Research General Project (Grant no. L2014246) and Liaoning University of Technology Teacher Research Start Fund Project (Grant no.X201202).
Institutional Review Board Statement
Not applicable.
Informed Consent Statement
Not applicable.
Data Availability Statement
The data used to support the findings of this paper are available from the corresponding author upon request.
Conflicts of Interest
The authors declared no conflict of interest.
Abbreviations
| output voltage waveform of the blade tip-timing sensor | |
| radial distance between the blade tip and the sensor probe | |
| the angle between the blade center line and the sensor center line | |
| the circumferential displacement of the blade tip relative to the OPR sensor | |
| the fitting static calibration waveform function | |
| the time interval between the blade tip-timing sensor and the OPR sensor | |
| the measurement waveform function | |
| the blade tip vibration displacement | |
| the vibration amplitude of blade tip | |
| the excitation order | |
| the rotational speed | |
| the vibration initial phase | |
| the vibration constant offset | |
| circumferential displacement of the first blade tip relative to the OPR sensor | |
| the blade tip radius | |
| the angle between the first blade tip-timing sensor and the OPR sensor | |
| the maximum angle between the blade center line and the sensor center line in the measurement range. | |
| the time of the first blade passing through the -th data point of the first waveform of the first blade tip timing sensor | |
| the number of data points in the waveform | |
| a known vector | |
| the coefficient matrix | |
| an unknown vector | |
| the solution vector | |
| the residual | |
| the element of column vector , = 1, = 2 …… = − 1 | |
| the deviation between the traversal value and the actual measured value by root mean square of residual error | |
| assumed that the actual excitation order of blade synchronous vibration | |
| the theoretical displacement residual | |
| the traversal excitation order | |
| the corresponding solution vector by the nonlinear least square method | |
| , and | the three components of |
| vibration frequency |
References
- Heath, S.; Imregun, M. An improved single-parameter tip-timing method for turbomachinery blade vibration measurements using optical laser probes. Int. J. Mech. Sci. 1996, 38, 1047–1058. [Google Scholar] [CrossRef]
- Bryan, H.; Terry, H.; Tom, T. NSMS Hot Section Sensor Testing and Evaluation. In Proceedings of the IIS/PIWG Spring Meeting, San Diego, CA, USA, 4–7 June 2012. [Google Scholar]
- Zielinski, M.; Ziller, G. Noncontact Blade Vibration Measurement System for Aero Engine Application. In Proceedings of the XVII International Symposium on Air Breathing Engines, Munich, Germany, 1 January 2005. [Google Scholar]
- Heath, S.; Imregun, M. A survey of blade tip-timing measurement techniques for turbomachinery vibration. J. Eng. Gas Turbines Power 1998, 120, 784–791. [Google Scholar] [CrossRef]
- Zielinski, M.; Ziller, G. Noncontact vibration measurements on compressor rotor blades. Meas. Sci. Technol. 2000, 11, 847–856. [Google Scholar] [CrossRef]
- HOOD Technology. Overview of Blade Vibration Monitoring Capabilities. 2010. Available online: http://www.hoodtech.com (accessed on 12 July 2021).
- Guo, H.; Duan, F.; Zhang, J. Blade resonance parameter identification based on tip-timing method without the once-per revolution sensor. Mech. Syst. Signal Process. 2016, 66–67, 625–639. [Google Scholar] [CrossRef]
- Guo, H.; Duan, F.; Wang, M. Blade Synchronous Vibration Measurement Based on Tip-Timing at Constant Rotating Speed without Once-Per Revolution Sensor. In Proceedings of the Seventh International Symposium on Precision Mechanical Measurements, Xia’men, China, 8–12 August 2015. [Google Scholar]
- Zhang, J.L.; Duan, F.J.; Niu, G.Y. The preprocessing method of the blade tip-timing measurement without a once-per-revolution sensor and error analysis. Acta Metrol. Sin. 2018, 39, 498–503. [Google Scholar]
- Lin, J.; Hu, Z.; Chen, Z.S.; Yang, Y.M.; Xu, H.L. Sparse reconstruction of blade tip-timing signals for multi-mode blade vibration monitoring. Mech. Syst. Signal Process. 2016, 81, 250–258. [Google Scholar] [CrossRef]
- Hu, Z.; Lin, J.; Chen, Z.-S.; Yang, Y.-M.; Li, X.-J. A Non-Uniformly Under-Sampled Blade Tip-Timing Signal Reconstruction Method for Blade Vibration Monitoring. Sensors 2015, 15, 2419–2437. [Google Scholar] [CrossRef] [PubMed]
- Chen, K.; Wang, W.; Zhang, X.; Zhang, Y. New Step to Improve the Accuracy of Blade Tip Timing Method without Once Per Revolution. Mech. Syst. Signal Process. 2019, 134, 106321. [Google Scholar] [CrossRef]
- Wang, W.M.; Zhang, X.L.; Chen, K.; Hu, D.F.; Li, W.B. Vibration monitoring and fault pre-warning method for large axial compressor blades without OPR sensor. J. Vib. Shock 2019, 38, 54–61. [Google Scholar]
- Zhang, L.; Yuan, H.; Li, X. Synchronous Vibration Parameters Identification of Variable Rotating Speed Blades based on New Improved Two-Parameter Method without OPR Sensor. Shock Vib. 2021, 2021, 5860353. [Google Scholar] [CrossRef]
- Zhang, L.; Wang, Q.; Li, X. An Improved Blade Vibration Parameter Identification Method considering Tip Clearance Variation. Shock Vib. 2021, 2021, 3537006. [Google Scholar] [CrossRef]
- Guo, H.T.; Duan, F.J.; Wang, M. Engine Order Identification Based on Blade Tip-Timing Single Parameter Method. J. Tianjin Univ. 2016, 49, 951–955. [Google Scholar]
- Heath, S. A new technique for identifying synchronous resonances using tip-timing. J. Eng. Gas Turb. Power 2000, 122, 219–225. [Google Scholar] [CrossRef]
- Zhou, C.Y.; Hu, H.F.; Yang, Y.M.; Guan, F.J.; Xu, H.L. Research on blade synchronous vibration parameter Identification using blade tip timing without the once per revolution sensor. J. Mech. Eng. 2019, 55, 64–71. [Google Scholar]
- Dimitriadis, G.; Carrington, I.B.; Wright, J.R.; Cooper, J.E. Blade-tip timing measurement of synchronous vibrations of rotating bladed assemblies. Mech. Syst. Signal Process. 2002, 16, 599–622. [Google Scholar] [CrossRef]
- Beauseroy, P.; Lengellé, R. Nonintrusive Turbomachine Blade Vibration Measurement System. Mech. Syst. Signal Process. 2007, 21, 1717–1738. [Google Scholar] [CrossRef]
- Russhard, P.; Back, J.D. Method for Analyzing Vibration in Rotor Blades. Patent EP2136189A2, 15 May 2009. [Google Scholar]
- Badami, V. GE Perspective on Tip-Timing. In Proceedings of the Panel Session, Tip-Timing: State of the Art and Future Developments, ASME TURBO-EXPO, Copenhagen, Denmark, 11–15 June 2012. [Google Scholar]
- Vining, C. lntroduction and History of Tip-Timing. In Proceedings of the Panel Session, Tip-Timing: State of the Art and Future Developments, ASME TURBO-EXPO, Copenhagen, Denmark, 11–15 June 2012. [Google Scholar]
- Zielinski, M. MTU Perspective on Tip-Timing. In Proceedings of the Panel Session, Tip-Timing: State of the Art and Future Developments, ASME TURBO-EXPO, Copenhagen, Denmark, 11–15 June 2012. [Google Scholar]
- Russhard, P. RR Perspective on Tip-Timing. In Proceedings of the Panel Session, Tip-Timing: State of the Art and Future Developments, ASME TURBO-EXPO, Copenhagen, Denmark, 11–15 June 2012. [Google Scholar]
- Mittelbach, M. Siemens Perspective on Tip-Timing. In Proceedings of the Panel Session, Tip-Timing: State of the Art and Future Developments, ASME TURBO-EXPO, Copenhagen, Denmark, 11–15 June 2012. [Google Scholar]
- Klein, B. Tip-Timing Measurements on Turbochargers. In Proceedings of the Panel Session, Tip-Timing: State of the Art and Future Developments, ASME TURBO-EXPO, Copenhagen, Denmark, 11–15 June 2012. [Google Scholar]
- Mahariq, I.; Kavyanpoor, M.; Ghalandari, M.; Puia, A. Identification of nonlinear model for rotary high aspect ratio flexible blade using free vibration response. Alex. Eng. J. 2020, 4, 2131–2139. [Google Scholar] [CrossRef]
- Heller, D.; Sever, I.; Schwingshackl, C.W. Vibration Analysis from Simulated Tip Timing Sensor Signal Shape Modulation. In Proceedings of the ASME Turbo Expo 2018: Turbine Technical Conference and Exposition, Oslo, Norway, 11–15 June 2018. [Google Scholar]
- Heller, D.; Sever, I.; Schwingshackl, C.W. Determination of Blade Vibration by Blade Tip-Timing Sensor Waveform Analysis. In Proceedings of the 23rd Blade Mechanics Seminar, Winterthur, Switzerland, 11 September 2018. [Google Scholar]
- Heller, D.; Sever, I.; Schwingshackl, C.W. Vibration Analysis Using Blade Tip-Timing Sensor Signals. In Proceedings of the Engineering Integrity Society Conference, Hyderabad, India, 23 October 2018. [Google Scholar]
- Heller, D.; Sever, I.; Schwingshackl, C. A method for multi-harmonic vibration analysis of turbomachinery blades using Blade Tip-Timing and clearance sensor waveforms and optimization techniques. Mech. Syst. Signal Process. 2020, 142, 106741. [Google Scholar] [CrossRef]
Disclaimer/Publisher’s Note: The statements, opinions and data contained in all publications are solely those of the individual author(s) and contributor(s) and not of MDPI and/or the editor(s). MDPI and/or the editor(s) disclaim responsibility for any injury to people or property resulting from any ideas, methods, instructions or products referred to in the content. |
© 2023 by the authors. Licensee MDPI, Basel, Switzerland. This article is an open access article distributed under the terms and conditions of the Creative Commons Attribution (CC BY) license (https://creativecommons.org/licenses/by/4.0/).