Abstract
The constant fluctuation of thermal loads on steel members, especially during construction, causes non-uniform distributions of temperatures, resulting in possible constructional and structural defects leading to unfavorable thermally induced responses and potential safety risks. The Canadian Highway Bridge Design Code (CHBDC) provides one thermal gradient variation profile without accounting for the differences in the geometrical parameters of the steel members and the variations in the climate regions of Canada. Therefore, in this study, three-dimensional finite element (FE) thermal simulations were conducted to investigate the maximum effective temperatures and positive vertical thermal gradients for different Canadian climate regions. Parametric studies were performed to conduct the FE thermal analysis using the thermal model validated in ANSYS. The comprehensive study results showed that Canada could be divided into two main zones for vertical thermal gradient calculations, meaning that one stationary thermal gradient profile cannot be applicable to all climate regions of Canada, as recommended by the CHBDC. Based on the FE thermal analysis results, empirical formulas as a function of the significant parameters were proposed to predict the maximum effective temperature and thermal gradient variations of the steel I-girder. The predicted maximum effective temperature and thermal gradient variation values were found to be highly correlated with the FE values with coefficients of determination R2 of approximately 0.97 and 0.98, respectively.
1. Introduction
Many experimental and numerical studies have been conducted to study the effect of thermal loads on temperatures and thermal gradients for concrete and composite girder bridges. However, limited research has been conducted to investigate the thermal behavior of steel members, especially during the construction period. The inaccurate determination of the temperature distributions of steel members during construction can potentially cause constructional and structural deficiencies, resulting in thermal stresses and other safety hazards. Moreover, the Canadian highway bridge design code (CHBDC) [1] has implemented a single thermal gradient differential profile for all of Canada without considering each region’s varying geographical conditions and geometry parameters. This could lead to different solar radiation intensities, drastically altering the girder section’s temperature gradients and distributions. In this study, finite element thermal analysis was carried out using the validated thermal model to investigate the maximum effective temperatures and vertical thermal gradients. The abovementioned thermal behaviors were evaluated for one summer month using parametric studies for different Canadian climate regions and standard steel girders. Comparisons and observations of the FE thermal behaviors were conducted to propose the appropriate maximum effective temperatures, thermal gradient profiles and maximum thermal gradient variations based on the environmental and geometry parameters. Using regression analysis, formulas were proposed to predict the maximum effective temperature and maximum thermal gradient variation. Finally, the proposed maximum effective temperatures and maximum thermal gradient pattern and variations were compared with the corresponding values and pattern recommended by the CHBDC [1]. The results of the finite element thermal analysis in this study are valuable for designers to understand the influences of climate regions and geometrical parameters on the thermal responses of steel bridge girders. Furthermore, the findings can be used to develop realistic thermal gradient variation profiles for steel bridge girders in the Canadian highway bridge design code (CHBDC), ensuring the safety and reliability of steel bridges in different climate regions of Canada.
2. Literature Review
2.1. Potential Impacts of Climate Change on Bridge Infrastructure in Canada
The impact of climate change has been studied recently by many researchers worldwide [2,3]. An increasing temperature due to climate change accelerates material degradation and exacerbates the bridge’s structural integrity and serviceability [4,5]. The Canadian Infrastructure report card released in 2019 stated that functional and structural deficiencies are more noticeable for approximately 40% of Canadian bridges due to increasing climate change loads and not considering the temperature increase properly during the design phase [6,7].
2.2. Effects of Time-Dependent Thermal Loads on Steel Bridge Structures
The steel girder might be exposed to time-dependent thermal loads for a long time during the construction phase. The thermal loads, including solar radiation, air temperature and wind load, constantly fluctuate. The daily and seasonal fluctuations of thermal loads result in unfavorable thermally induced stresses and deformations, which severely cause damage to structures [8,9,10]. The thermal stresses induced by the fluctuation of the thermal loads can be significant and comparable to the dead load-induced stresses. For large-span reticulated domes with ETFE membrane roofs, solar radiation induced strong non-uniform temperatures, resulting in significant thermal stresses and displacements [11]. An axial stress of approximately 20 MPa can be induced due to changes in the thermal loads [11]. Steel truss bridge performance may be affected by variations in average and differential temperatures over time, presenting additional challenges for their design, construction and maintenance [12]. The impact of the thermal-induced stresses is not limited to steel members and could impose distinguished cracks in concrete structures [13]. Stress-induced cracks impact mechanical performance and durability, reducing the structure’s lifespan and serviceability [14,15]. The broader difference in daily temperature could induce vertical and lateral temperature gradients for some sections, which might produce undesired flexural thermal-induced stresses [16,17]. On the other hand, the seasonal temperature variation leads to higher restrained moments and larger displacement in the continuous spans and simply supported superstructure, respectively [18,19].
2.3. Experimental and Numerical Thermal Analyses of Temperature Distribution and Gradient and Their Thermally Induced Responses in Steel Structures
The literature review revealed that concrete and composite structures received more attention than steel structures considering experimental and numerical research to predict temperature distributions and gradients [20,21,22,23,24]. Abid et al. conducted a thermal analysis using the finite element (FE) method to investigate the effect of steel girder configurations on the thermal gradient and temperature stress induced by thermal loads. It was found that the geometrical parameters significantly affect temperature gradients and stresses [25]. Gottsater et al. [26] found that the nonlinear thermal gradient developed due to time-dependent thermal loads resulted in thermal self-equilibrating stresses, which led to cracking in concrete members with higher depths. Hagedorn et al. [27] conducted experimental work on three concrete I-girders with different top flange dimensions to investigate the temperature gradients. They found that the developed vertical thermal gradient differs from the code thermal gradient and that the lateral gradients need to be modeled more accurately [27]. Chen et al. [9] experimentally and numerically studied the effect of solar radiation variations on the non-uniform temperature distributions of a rectangular steel tube, I-shaped steel tube and circular steel tube by conducting parametrical studies. The steel members were instrumented with thermocouples to collect the thermal load data and accordingly to develop temperature gradients. It was found that the high thermal conductivity and small thickness of steel plates lead to approximately no difference in temperature distributions along the plate thickness and steel section span. The authors found that the section’s size is considered the most prominent parameter affecting the nonlinear temperature gradients in the studied sections. Increasing the section’s size leads to higher temperature gradients [9]. Based on the numerical method, a simplified calculation approach for the temperature field was presented, which provides practical and effective suggestions for thermally based design, monitoring, and controlling steel structures [9]. The thermal behavior of spatial structures under solar irradiation was investigated. It was revealed that a significant temperature difference occurs between the steel member under a glass roof and negative thermal load is the prominent factor for member stresses [28]. Using FE simulation, Lee et al. [29] investigated the influence of summer thermal loads on steel girder buckling behavior. The configurations of the steel flange, such as the width and the thickness, were considered in studying the steel girders’ buckling behavior [29]. Deng et al. [30] showed that the beam’s thickness significantly affects the vibration response of cable-beam structures induced by temperature changes. Sang-Hyo Kim et al. [31] investigated the temperature variation and distribution of the steel box girder bridge during construction, considering the effect of the temperature distributions of the steel box girder segment during construction, which might cause unfavorable thermal stresses. Therefore, a numerical approach was recommended to be applied during the planning and designing phases to accurately predict the temperatures during construction [31]. Abid et al. [32] conducted an FE thermal analysis to investigate the behavior of the temperatures across the steel girder section and along the girder depth, finding that the thermal gradient variations at the top and bottom surfaces were comparable. Shiji Huang et al. [33] used experimental and numerical thermal analysis methods to investigate the nonuniform and time-dependent temperatures of corrugated web steel beams under environmental thermal loads. To study the effect of the location and its corresponding climatic conditions, a thermal analysis study was conducted for eight cities. The results indicated a complex and nonuniform action of the steel girder. The maximum temperature difference of approximately 47 °C was determined in the steel girder [33]. Wucheng Xu et al. [34] showed that the heat exchange between the different solar radiation components, heat convection and other factors and the boundaries of the steel structures resulted in a significant nonuniform distribution of the temperatures in steel structures. Due to the complexity of the heat exchange phenomena and not applying it accurately, understanding the steel structure thermal actions can be restrained, leading to jeopardizing the structure safety. The study provided a better understanding of the steel structure thermal behaviors and some recommendations to improve the temperature prediction and distribution in steel structures [34]. The continued exposure of steel structures to solar radiation and other thermal loads during construction can lead to nonlinear and complex temperature variations and distributions, which might impact the quality of engineering construction, the accuracy of structural closures [35], and consequently, the safety of the structure [36].
3. Methodology
Three-dimensional finite element thermal simulations were conducted to investigate the maximum effective temperatures and positive vertical thermal gradients for different Canadian climate regions. To better understand the combined effect of geometrical parameters of the steel members and the variation in Canadian climate regions on temperature distributions and the variations of steel girders, parametric studies using eight standard steel girders and seven representative cities of the climate regions were performed to conduct the finite element thermal analysis using the thermal model validated in ANSYS. The thermal model was established by validating the thermal load data obtained from the study conducted by Abid et al. [37]. The thermal material properties used in the developed thermal model were the same thermal properties used by Abid et al. [37]. The transient thermal analysis was carried out for a summer month where the highest average air temperature was recorded. The beam solar radiation, diffuse solar radiation, reflected solar radiation and average air temperature data were calculated hourly for the selected month. The shortwave heat flux, convective heat transfer and longwave heat flux were the main thermal boundary conditions considered in the finite element thermal analysis. The results obtained from the simulations were compared with the values recommended by the CHBDC, and formulas were developed to predict the maximum effective temperatures and thermal gradient variations. To better understand and visualize the research methodology, a flowchart depicting the research methodology steps for the thermal gradient and effective temperature analysis in different Canadian climate regions is illustrated in Figure 1.
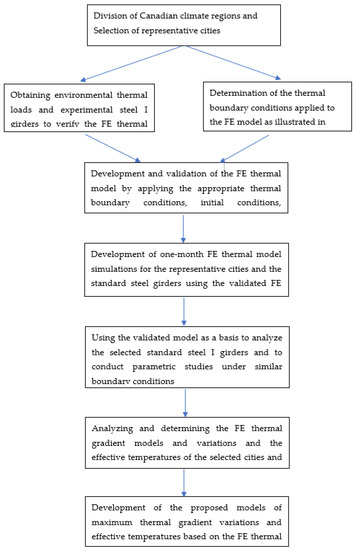
Figure 1.
Research methodology steps for thermal gradient and effective temperature analyses in different Canadian climate regions.
Data Acquisition
The steel I-girder was instrumented with three sensors to experimentally measure the air temperature, solar radiation, and wind speed data for 21 consecutive days starting from 5 June 2015 to 25 June 2015 [37]. The steel girder was also instrumented with thermocouples to measure the surface temperatures in various locations. To validate the finite element model, the solar radiation, air temperature and wind speed data between 11 June 2015 and 14 June 2015 were obtained from the study conducted by Abid et al. [37]. As a temperature validation method, the temperatures of the thermocouples shown in Figure 2 for 14 June 2015 were compared with the predicted finite element temperatures. Moreover, a comprehensive comparison was conducted between the finite element model and the thermocouple data to thoroughly validate the finite element model.
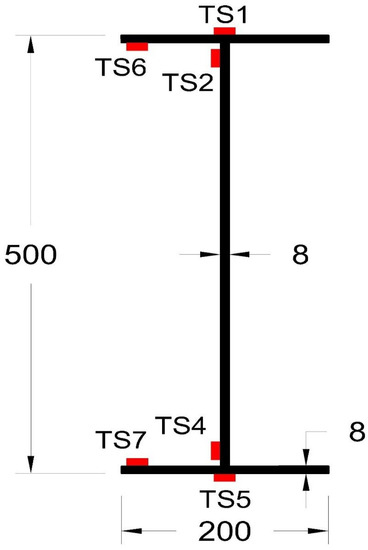
Figure 2.
Cross-section of the steel I girder with the locations of the thermocouples.
4. Heat Transfer Equation and Thermal Boundary Conditions
The heat transfer partial equation is used to model the heat conduction within the girder. The temperature variation over time, position and material properties, such as the density, specific heat and thermal conductivity coefficient, can be determined using Equation (1). The heat conduction equation expressed in Equation (1) considers the variations in temperature (T) as a function of time (t) at position (x, y, z). The heat conduction within the girder depends on the material density (ρ), the material specific heat (C) and the thermal conductivity coefficient (k) [38].
The heat energy exchange between the girder surfaces and the surrounding environment has been greatly enhanced due to climate change exposure. The heat transfer mechanisms responsible for the heat energy exchange are (1) conduction heat transfer, (2) convection heat transfer between the bridge surfaces and ambient temperature and (3) solar radiation exposed by the bridge and irradiation reflected from the bridge surface [37]. Moreover, the thermal boundary conditions equation (Equation (2)) has been modified to account for the increased heat fluxes on the girder surfaces, as expressed in Equation (3), where (q) is the sum of the heat fluxes on the girder surfaces and represents the direction cosine (x, y, z) of the unit outward vector perpendicular to the boundary surfaces.
where , and are the total solar radiation heat flux, heat convection and longwave radiation in W/m2, respectively.
The total solar radiation (Is) striking the girder surfaces from the sun consists of three components, as expressed in Equation (4): beam solar radiation, which is the direct solar radiation from the sun without being diffused; diffuse solar radiation, which is the scattered part of the beam solar radiation due to the surroundings; and ground-reflected radiation. The total solar radiation (Is) is determined by the solar incident angle (θ), which is the angle between the sun’s rays and the normal direction of the surface; the solar zenith angle (β), which is the angle between the sun’s rays and the vertical direction; and the tilted angle between the girder surface and the horizontal plane These three components work together to determine the total solar radiation (Is) striking the girder surfaces of a structure.
The reflected radiation from the ground shown in Equation (5) depends on the ground reflection coefficient (albedo) which is 0.2 for ground reflection [39] and the tilted angle between the girder surface and the horizontal plane . The total solar radiation heat flux is controlled by the girder section’s absorptivity (α) as presented in Equation (6) [37]. This absorptivity is a crucial factor in determining the amount of thermal energy that the girder section is capable of absorbing.
where represent the beam and diffuse solar radiations striking the horizontal surfaces, respectively.
The heat transfer convection between the ambient air and the girder surfaces can be determined as expressed in Equation (7). This convection of heat is considered a cooling process and is determined by the difference between the surface temperature and ambient air temperature . The surface convection coefficient of heat transfer controls the rate of heat exchange, which is measured in W/m2·k. is a function of wind speed (u) as presented in Equation (8) [37].
The longwave radiation represents the heat emitted from the exposed surfaces to the surrounding atmosphere due to thermal irradiation. depends on the surface emissivity of the girder (ϵ), the Stefan-Boltzman constant (F) which is 5.67 × 10⁻⁸ W/m2 k4 and the difference between the surface temperature and ambient air temperatures presented in Equation (9). This longwave radiation is of particular importance when assessing the thermal performance of the girder, as it has the potential to significantly impact the temperature of the girder and its surrounding environment.
The shaded length of the web can have a significant influence on the temperature of the web surface. The shaded length of the web (LS) varies with the sun’s movement, and the shaded part of the web can be calculated as presented in Equation (10). The calculation of the shaded length depends on the length of the overhang (LC), the angle between the web and the horizontal direction (β), the solar altitude angle (h) and the solar azimuth angle of the sun (ø). The shaded parts of the web have a lower heat than those without shade. This is because the shaded parts are not exposed to the direct (beam) solar radiation component.
The study by Kalogirou and Peng can be used to determine and calculate the solar incident angle, altitude angle, azimuth angle and other geometric factors [40,41]. The thermal boundary conditions of heat fluxes (q) that describe the thermal loads and the heat transfer equation that depends on the thermal material properties are numerically complicated to solve. Therefore, ANSYS finite element software is used to conduct thermal analysis.
5. Implementation of Transient Thermal Analysis
The FE simulation software ANSYS [42] is used to simulate the heat conduction and thermal boundary condition equations described in the previous section. Time-dependent temperature distributions and thermal gradients for steel I-girders are developed using a transient thermal module [42]. To conduct thermal analysis and to apply the total solar radiation heat flux accurately, the steel girder model was divided into three categories depending on the nature of the surface:
- 1.
- The top surface of the top flange and the top surfaces of the bottom flange,
- 2.
- The bottom surface of the bottom flange and the subsurface of the overhangs, and
- 3.
- Vertical webs considering the shadowing effect that changes with time.
The solar radiation heat flux components described in Equation (4) were applied on the ANSYS model surfaces after considering the different solar angles and their directions in addition to the solar incidence angles at each model surface [43]. The heat transfer convection coefficient presented in Equation (8) was calculated based on the wind speed, and the air temperature data were applied to the model surfaces to govern the convection thermal boundary condition. The longwave radiation was applied on the ANSYS thermal model surfaces as cooling thermal irradiation as presented in Equation (9). The meshing was conducted using the quadratic and triangle elements to simulate an accurate thermal finite element model as shown in Figure 3. The Solid90 element is used to simulate the steel web and flanges. Surf152 is the thermal element used to simulate the thermal boundary conditions (convection, solar radiation and longwave radiation). A diagram of the thermal boundary conditions (boundary environmental thermal loads) applied to the thermal FE steel girder model is illustrated in Figure 4. The thermal material properties significantly control the heat transfer conduction and the thermal boundary conditions described in the previous section. The thermal properties of steel were accurately applied to the ANSYS thermal model as previously used by Abid [37], with the following parameters: density = 7850 kg/m3, thermal conductivity = 44.5 W/mK, specific heat = 475 J/(kg·K), surface emissivity of 0.9 and absorption coefficient of 0.7. The initial time to initiate the thermal analysis simulation was taken at midnight due to the approximate temperature uniformity across the exposed steel girder. To further reduce the effect of this assumption, the thermal analysis was started three days before the day of interest that was used for the thermal validation. For thermal model verification, the steel I-girder’s air temperature, global solar radiation and wind speed data, recorded between 11 June 2015 and 14 June 2015, as shown in Figure 5, were utilized as the thermal loads to apply the thermal boundary conditions described in Equation (3).
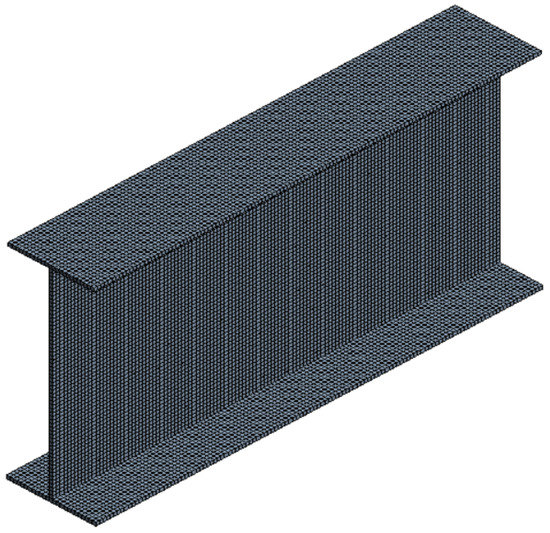
Figure 3.
The mesh of the 3-D finite element model.
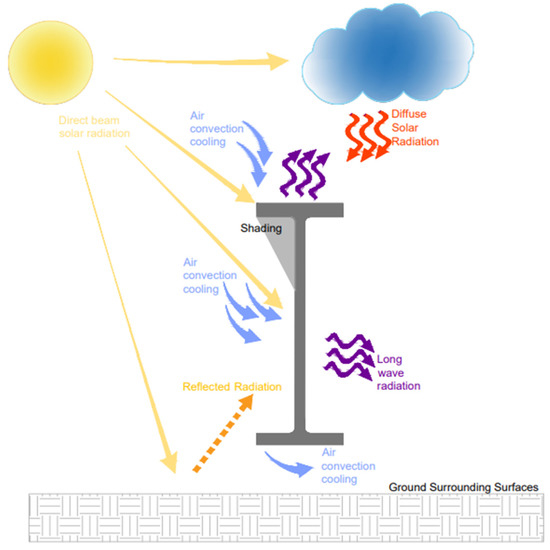
Figure 4.
The thermal boundary conditions applied to the FE steel girder model.
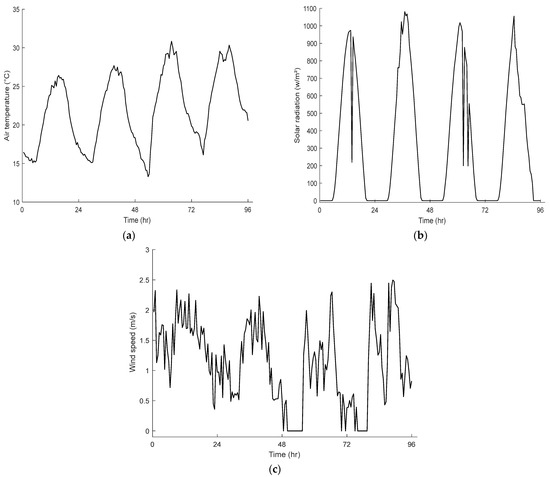
Figure 5.
The time-dependent thermal loads used for the thermal model verification are (a) air temperature, (b) global solar radiation and (c) wind speed.
6. ANSYS Thermal Model Validation
A three-dimensional FE simulation was conducted using ANSYS to validate the thermal analysis model. The measured temperatures of the thermocouples shown in Figure 2 and measured by Abid at Gaziantep University [37] were compared with the predicted FE temperatures for 14 June 2015. Temperature comparisons were conducted to validate the accuracy of the ANSYS thermal model. Figure 6 shows that the temperatures measured by the thermocouples and the predicted temperatures obtained from the transient thermal model were comparable. The maximum difference between the predicted FE and experimental temperatures was approximately 1.5 °C. The predicted FE temperatures displayed good agreement with the experimental temperatures, thus demonstrating the validity of the ANSYS thermal model. This model can now be used to accurately predict the temperature distributions and the resulting temperature gradients for different cross-section steel I girders in different climate regions of Canada.
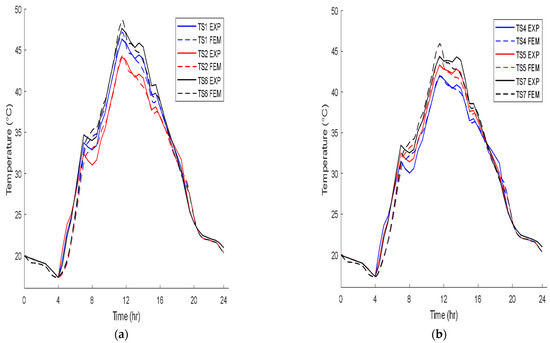
Figure 6.
Comparison between predicted FE temperatures and experimental temperatures for (a) thermocouples (T1, T2 and T6) and (b) thermocouples (T4, T5 and T7).
7. The Parametric Study
The validated FE thermal model was used to investigate the daily maximum effective mean temperature and the positive thermal gradient for different climate regions of Canada. A parametric study was performed using four pairs of standard steel I girders with varying dimensions, including the depth of the steel girder, while the top flange width was the main variation between the two girders of the same steel standard. The two girders of the same steel standard observed slight differences between the web and flange thicknesses. The standard steel sections used in this study were W36 × 282, W36 × 232, W30 × 191, W30 × 148, W18 × 86, W18 × 71, W10 × 26 and W10 × 19. Table 1 shows the dimensions of the selected standard steel girders.

Table 1.
The dimensions of the selected standard steel I girders.
7.1. The Canadian Climate Regions
The difference in the climatological conditions in Canada can significantly affect the temperature distribution and variation of the steel girder. To better understand this effect, Canada has been divided into seven distinct climate regions, with a representative city chosen for each region. The climate regions and their corresponding representative cities, including the geographical locations, are presented in Table 2.

Table 2.
The geographical locations of the representative cities.
7.2. Ambient Air Temperature and Solar Radiation Data for the Representative Cities of the Climate Regions
To investigate the daily maximum effective mean temperatures and positive thermal gradients of the representative cities, thermal analysis was performed using the validated thermal model for one summer month that witnessed the highest recorded air temperature. Environment Canada [44] provided the hourly ambient air temperature data for each representative city’s selected month. The hourly average wind speed was set to zero to maximize the effective temperatures and the thermal gradients. The solar radiation components significantly affect the temperature distributions and variations. The direct solar radiation and diffuse solar radiation striking the horizontal plane are required to calculate the total solar radiation heat flux shown in Equation (4). can be expressed as [39,40,41]:
where P represents the atmospheric transmission coefficient as given in Equation (13) and n is the day of the year calculated from January 1st as n = 1. is the solar zenith angle.
where represents the relative atmospheric pressure, which can be calculated based on the altitude of the selected city. is the turbidity factor that depends on the atmospheric conditions and generally ranges between 1.8 and 3. For this research, the turbidity coefficient is assumed to be the average value (2.4), whereas h is the solar altitude angle.
8. One-Month FE Thermal Simulations
One-month transient thermal simulations are conducted for the standard steel girders based on the validated EF thermal model. The FEM simulations used to conduct the parametric studies are performed for the representative cities of the climate regions. ANSYS [42] was used to perform the three-dimensional FE thermal analysis of the selected standard steel girders based on the verified model. The boundary conditions, including beam and diffuse solar radiation (total solar radiation), ground-reflected solar radiation, heat transfer convection and longwave radiation, were applied to the developed FE model for each girder. The thermal loads, including the air temperature and solar radiation components shown in Equations (11) and (12), were used to determine the initial temperatures and thermal boundary conditions and then applied to the FEM simulations. The horizontal beam solar radiation (Equation (11)), diffuse solar radiation (Equation (12)) and reflected solar radiation (Equation (5)) are used to determine the total solar radiation heat flux (Equation (6)). The total solar radiation heat flux is applied to each girder’s surface considering the geometry and the shadowing effect. The heat transfer convection coefficient (Equation (8)) and the hourly average air temperature are applied in the FE thermal model to govern the convective heat transfer (Equation (7)). Longwave radiation (Equation (9)) is also applied to the FE simulations. The thermal boundary conditions illustrated in Figure 4 remained the same and were applied to the FE model of each steel girder. However, the vertical web of each girder is exposed to a different solar radiation heat flux, which is calculated based on the total solar radiation. This is because of the overhang shading length on the web, which changes according to the flange width and girder depth in which the direct solar radiation should be subtracted from the total solar radiation feat flux in the shaded area of the vertical web. A time step of 1 h is used to run the transient thermal simulations, which means that the thermal boundary conditions are determined for 720 time steps with an interval of 1 h. The thermal properties of the materials used for thermal model verification were applied in the FE model of each girder.
9. Results and Discussion
9.1. Positive Thermal Gradient Profiles for the Climate Regions
This study aims to first develop and optimize positive vertical thermal gradient profiles for different climate regions. To achieve this, eight standard steel I girders were used in parametric studies to accurately determine the vertical thermal gradient variations. Positive thermal gradient profiles were developed based on extreme positive vertical thermal gradient variations for different climate regions as shown in Table 3. Figure 7 shows the maximum vertical thermal gradient profiles of the standard steel girders for the climate regions. The thermal gradient profiles have the same pattern regardless of the climate regions and selected standard steel girders. The maximum thermal gradient variations occurred at approximately 1:00 pm due to higher air temperatures and direct solar radiation on the top surface of the steel girder during this time, and the web was shaded and prevented from direct solar radiation. Thus, this leads to maximizing the thermal gradient differences (variations). Generally, Figure 7 shows that the maximum thermal gradient variations at the steel girder’s top and bottom surfaces decrease with a decrease in the steel girder depth. A shorter steel girder means that the amount of heat transferred from the top steel girder’s surface to the mid-depth section is faster than the heat transfer for the longer girders. This leads to higher heating of the mid-depth web and thus reduces the vertical thermal gradient variation.

Table 3.
Extreme positive vertical thermal gradient variations (°C) for different climate regions.
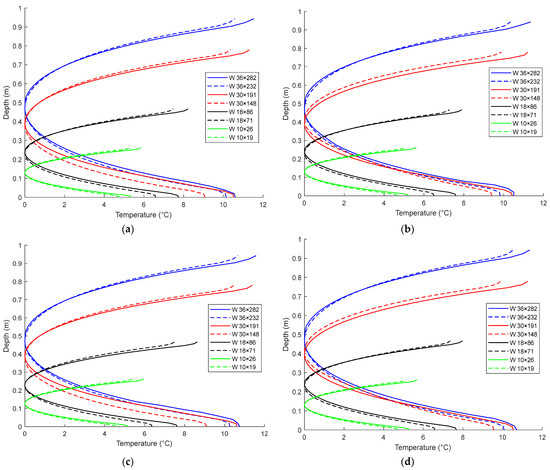
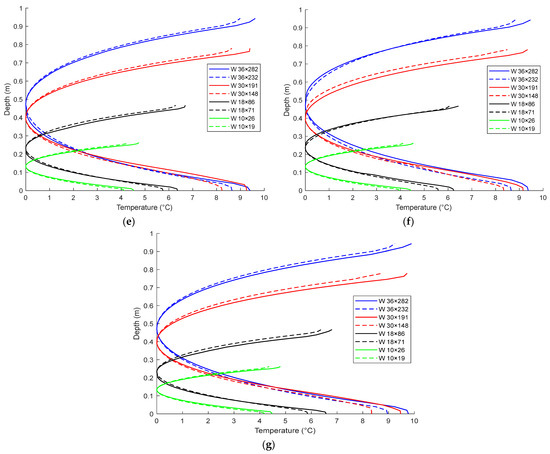
Figure 7.
The positive vertical thermal gradient for (a) Region 1, (b) Region 2, (c) Region 3, (d) Region 4, (e) Region 5, (f) Region 6 and (g) Region 7.
By comparing the steel girders of each standard steel pair, the steel girder with a wider flange shows higher thermal gradient variations, attributed to the shadowing effect of the flange overhang. The wider flange of the girder exposes the flange to more shadowing effect, meaning that the web is not exposed to direct solar radiation. Thus, the web’s heating is slowed down, resulting in a higher thermal gradient difference. Regardless of the climate regions, the thermal gradient variations in W36 × 282 are slightly higher than the thermal gradient variations observed for W30 × 191. This is attributed to the higher flange thickness of W36 × 282. A higher flange thickness slows the heat transfer from the top surface to the web’s mid, thus reducing the thermal gradient difference.
9.2. The Prediction Model of the Daily Maximum Thermal Gradient Variation
The experimental thermal loads shown in Figure 4 were used to verify the experimental steel I girder model as a first step in conducting the thermal analysis. The verified thermal FE model was then used to analyze the selected standard steel I girders under similar conditions (thermal boundary conditions, solar radiation components, initial temperature conditions, air temperatures, material properties and other similar conditions). Using the data collected from the parametric studies and applying a regression analysis, a reliable prediction model was developed to predict the daily maximum thermal gradient variation (DTGmax). A regression analysis was conducted for seven climate regions and eight standard steel I girders. The parameters used to develop the prediction model are half the girder’s depth (d/2), half the flange width (b/2), the flange thickness (t), the total solar radiation (I) and the daily maximum air temperature (DTa). A proposed equation, a function of the parameters mentioned earlier, was developed to predict the daily maximum thermal gradient variation in °C. The proposed equation is expressed in Equation (14). The prediction model accuracy was evaluated based on the coefficient of determination (R2). An impressive R2 of 0.98 was obtained, which is a strong indication of the excellent correlation between the proposed daily maximum thermal gradient variation and the FE daily maximum thermal gradient variation, as illustrated in Figure 8. This result demonstrates the effectiveness of the proposed equation in predicting DTGmax with a high degree of accuracy.
DTGmax = 15.87(b/2) + 20.80(d/2) + 0.0103(I) − 0.0213(DTa) − 142.53(t) − 5.87
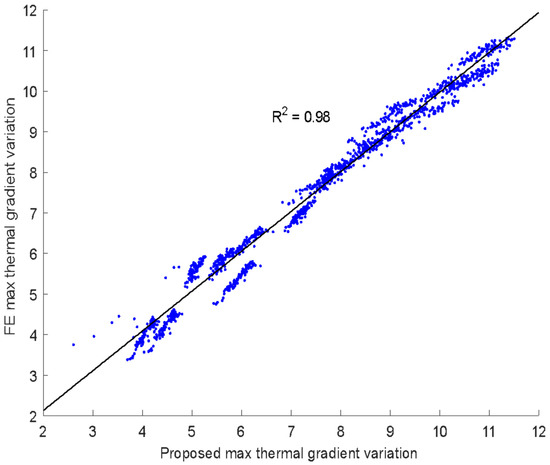
Figure 8.
Relationship between the proposed maximum thermal gradient variation and FE maximum thermal gradient variation.
9.3. The Proposed Thermal Gradient Variation for the Climate Regions
The proposed thermal gradient variations for the climate regions were evaluated based on the extreme daily thermal gradient variations. The results of Table 2 show that regardless of the standard steel girders, the extreme thermal gradient variations for regions 1–4 can be comparable and close to each other. Regions 5–7 have approximately the same extreme thermal gradient variations but are evidently lower than the extreme thermal gradient variations measured for regions 1–4. This is attributed to the higher solar radiation recorded for regions 1–4 compared to those recorded for regions 5–7, which means that solar radiation is the prominent factor affecting the thermal gradient variations. Figure 9 shows the extreme positive thermal gradient profiles for the climate regions for W36 × 282 and W30 × 191, and it is evident that regions 1–4 have approximately the same pattern and maximum thermal gradient variations, while the pattern and maximum thermal gradient variation values are almost the same for regions 5–7.
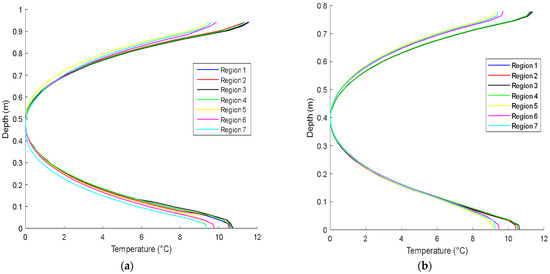
Figure 9.
The extreme positive thermal gradient profiles of the different climate regions in (a) W36 × 282 and (b) W30 × 191.
Based on the observations presented, it is evident that the Canadian climate regions can be divided into two distinct zones. These zones are characterized by distinct weather patterns and temperatures, which vary significantly throughout the country. Zone 1 represents regions 1–4, and zone 2 represents regions 5–7. The proposed maximum thermal gradient variations for zones 1 and 2 can be taken as the maximum thermal variations of regions 1–4 and 5–7, respectively. The proposed maximum thermal gradient variation values of zones 1 and 2 are presented in Figure 10. Zone 1 has higher solar radiation, leading to higher thermal gradient variations than zone 2. After reducing the number of climate regions to two main zones, a formula was developed for the predicted maximum thermal gradient variation (PMGmax). The total solar radiation taken in the formula was the value corresponding to the extreme thermal gradient variation. The total solar radiations of zone 1 and zone 2 are 1000 w/m2 and 825 w/m2, respectively. The predicted formula, as illustrated in Equation (15), gives high accuracy values of the thermal gradient variations compared to the proposed thermal gradient variations extracted from FE simulations, with a coefficient of determination R2 of approximately 0.99.
PMGmax = 18.49(b/2) + 26.25(d/2) + 0.00836(I) − 195.36(t) − 4.81
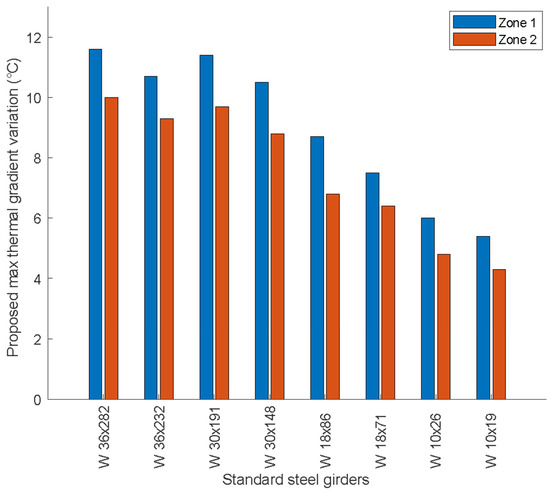
Figure 10.
Proposed maximum thermal gradient variation in zone 1 and zone 2 for the selected standard steel girders.
9.4. The Maximum Effective Temperatures of the Representative Cities of the Climate Regions
The standard steel girder daily maximum mean temperatures were evaluated for all climate regions during the selected month. The effective temperature is defined as the temperature that governs the thermal-induced superstructure expansion and contraction movements, which directly affect the structures’ durability. The effective temperature of the bridge represents the average of the superstructure’s different part temperatures. The average temperature of the bridge (effective temperature) was determined at each timestep in the thermal FE model. The maximum average temperature on each day of the studied month was determined based on the thermal results of the FE model. In this study, the maximum effective temperature represents the extreme daily average temperature (mean temperature) analyzed and determined based on the results of the FE thermal analysis. It was observed from the FE simulation results that the maximum effective temperatures correspond to the daily maximum air temperature for the selected cities. Table 4 presents the FE maximum effective temperatures of the standard steel girders for the representative cities of the climate regions. A comparison between the steel girders of each standard pair, such as W36 × 282 and W36 × 232, revealed that increasing the flange width increases the maximum effective temperature. This is attributed to the higher amount of solar radiation absorbed by the wider flange, thus leading to more heat and increasing whole-body temperature. This observation is applicable for the remaining standard pairs. Generally, Table 4 shows that decreasing the girder’s depth leads to increasing the maximum effective temperature in most cases. A shorter girder depth leads to a shorter heat path from the top surface to the web, which means gaining more heat by the shorter web compared to the longer, thus increasing the maximum effective temperature. However, this observation does not apply to all cases presented, such as W18 × 86 and W10 × 19. Although W10 × 19 has a shorter depth, it shows a lower maximum effective temperature than W18 × 86. W18 × 86 has a wider flange width than W10 × 19 by approximately three times, meaning that higher heat and solar radiation are absorbed by W18 × 86, leading to higher maximum effective temperatures. This proves that the girder’s depth should not be considered solely as a comparison tool.

Table 4.
The FE maximum effective temperatures (°C) of the representative cities.
9.5. Predicted Maximum Effective Temperature Formula
The discussions and comparisons conducted in the previous section revealed that the maximum effective temperature can be affected by environmental and geometric parameters. A regression analysis was conducted to develop a prediction model for the maximum effective temperature. In the regression analysis, the coefficient of determination R2 and a p-value test (95% acceptance) were used to evaluate the model accuracy and to identify the significant parameters, respectively. The proposed model used for effective temperature prediction was developed based on the FE effective temperature data, which were determined based on the thermal analysis of the FE model that was verified using an experimental steel girder and thermal loads. Therefore, the proposed model can be considered reliable. Moreover, the effective temperatures of the CHBDC were determined based on air temperature data recorded decades ago, which are lower than the air temperature data used to determine the effective temperatures of FE, resulting in higher effective temperatures of FE than the corresponding effective temperatures of the CHBDC. Accordingly, the FE thermal model and the proposed model for effective temperature prediction are reliable. It was found that the daily maximum air temperature (DTa), flange width (b) and girder depth (d) are the prominent parameters forming the predicted maximum effective temperature formula. In addition, the effect of the flange width and the girder’s depth should not be studied separately; instead, their combined effect should be considered. The predicted formula of the maximum effective temperature (PETmax) in °C is expressed in Equation (16).
PETmax = 8.80(b) + 0.94(DTa) − 4.98(d) + 22.54
Figure 11 shows that the predicted maximum effective temperatures are highly correlated with their corresponding FE maximum effective temperatures. The predicted formula shows a high correlation with a coefficient of determination R2 of approximately 0.97.
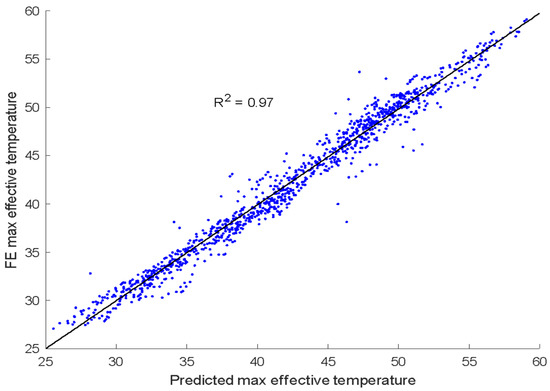
Figure 11.
Predicted maximum effective temperature vs. FE maximum effective temperature.
9.6. Comparison between the Predicted FE Thermal Results and the Corresponding Results Recommended by the CHBDC
The maximum effective temperatures recommended by the CHBDC are calculated based on the air temperature and modified according to the superstructure’s depth [1]. However, the FE maximum effective temperatures are not solely affected by the superstructure’s depth. Instead, combining the superstructure’s depth and flange width significantly affects the maximum effective temperatures. To observe the difference between the FE maximum effective temperatures and the CHBDC maximum effective temperatures, the extreme maximum effective temperatures recorded for W18 × 86 were compared with their corresponding values recommended by the CHBDC. The comparison is presented in Figure 12 and shows that the FE maximum effective temperatures are higher than the CHBDC values for the representative cities. The maximum difference was 6 °C in Victoria (region 4), and the minimum difference was 1.5 °C in Winnipeg (region 2). On average, the FE values were 2.5 °C higher than the CHBDC values. The CHBDC underestimated the maximum effective temperature compared to FE values, which might lead to a reduction in the structure’s durability as the thermal expansion calculations are underestimated [1]. Therefore, it is essential to consider the superstructure’s depth and flange width when calculating the maximum effective temperatures to ensure the optimal safety and durability of the structure.
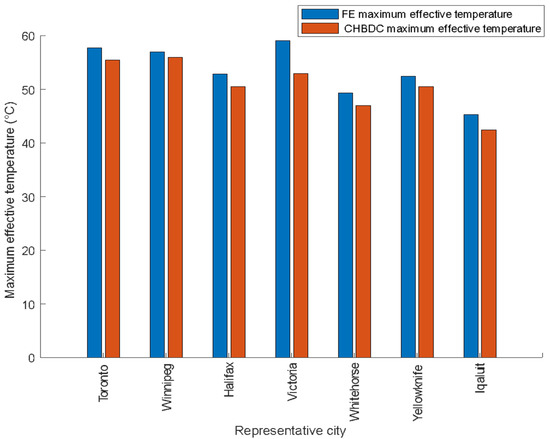
Figure 12.
Comparison of FE and the CHBDC maximum effective temperatures for the representative cities of the climate regions.
The CHBDC recommended a stationary thermal gradient design guideline for steel beams [1]. In the code, the thermal gradient profile showing the temperature distribution along the beam’s depth was not provided. Instead, temperature differentials based on the beam’s depth were recommended. However, based on the parametric studies conducted, it can be said that one stationary thermal gradient profile cannot be considered applicable for all climate regions of Canada. The climate regions were divided into two main zones for thermal gradient calculations. The pattern of the thermal gradient profiles was observed to be stationary for the climate regions. The thermal gradient variations at the standard steel beams’ top surfaces were developed for the climate zones. The thermal gradient variations at the steel beams’ bottom surfaces were observed to be slightly less than the thermal gradient variations measured at the top surfaces, which was not considered in the CHBDC [1]. In addition, the proposed thermal gradient variations depend not only on the beam’s depth but also on the flange width and thickness.
10. Conclusions
Based on the comprehensive parametric studies conducted for different standard steel girders in seven Canadian climate regions using FE thermal simulation, the following key conclusions can be drawn:
- The maximum thermal gradient variations and the maximum effective temperatures were found to not occur simultaneously. Extreme heat conditions can lead to the maximum effective temperature. However, the maximum thermal gradient is not necessarily associated with such conditions.
- The developed thermal gradient profiles for each climate region divided the climate regions into two distinct zones, and their maximum thermal gradient variations were determined. A regression analysis was conducted to further analyze the data, and a predicted formula was developed to determine the maximum thermal gradient variation based on geometry and environmental parameters such as flange width, web depth, total solar radiation, daily maximum air temperature and flange thickness. The predicted formula demonstrated a strong correlation between the predicted maximum thermal gradient variations and the FE maximum thermal gradient variations, with a coefficient of determination R2 of 0.98. This indicates that increasing the flange width, web depth and total solar radiation and decreasing the daily maximum air temperature and flange thickness all lead to an increase in the maximum thermal gradient variation. For the determined maximum effective temperature values of standard steel girders in each representative city of the climate regions. A regression analysis model was developed to predict the maximum effective temperature. The predicted formula of the maximum effective temperature was developed. The results of the predicted formula and the comparison of the maximum effective temperature values clearly indicate that the daily air temperature is a major factor to be considered. In addition, it is essential to consider the combined effect of the flange width and the girder’s depth rather than examining them independently to obtain accurate results.
- The comparison between the predicted FE thermal results and their corresponding CHBDC specifications revealed that the FE maximum effective temperatures are higher than their corresponding CHBDC values. In addition, the current study showed that the girder’s depth had a direct impact on the maximum effective temperature and that other parameters should be taken into account. By comparing the thermal gradient profiles and values, it was revealed that a single stationary thermal gradient profile and fixed thermal gradient variations would not satisfy the design requirements of the Canadian climate regions. The CHBDC did not clearly provide an explicit thermal gradient profile or the gradient variation values along the web. However, the current study was able to predict the thermal gradient profile pattern and the maximum thermal gradient variations for two main climate zones.
- The uncertain changes within projected temperature distributions and ranges, heatwaves and extremely high temperatures due to climate change and global warming directly affect the temperature field (thermal gradients and effective temperature) of steel structures, resulting in significant thermally induced responses and effects. A future research direction would be to examine the impact of climate change and global warming on steel structures’ temperature fields. Extreme conditions of future multiyear meteorological and thermal load data can be used as inputs for thermal boundary conditions to simulate the long-term temperature field of steel structures. An extensive thermal analysis can be conducted based on long-term temperature field simulations, and this thermal analysis can be used as a basis for studying and determining extreme temperature events, thermal gradients and temperature variations over time, thus improving structural design methods and specifications.
Author Contributions
All authors participated sufficiently in the work, including participation in the concept, design, analysis, writing or revision of the manuscript. Conceptualization, M.N. and L.A.; methodology and ANSYS FE, M.N.; project administration and supervision, L.A.; data curation, M.N.; validation and visualization, M.N. and L.A.; writing—original draft, M.N.; writing—review and editing M.N. and L.A. All authors have read and agreed to the published version of the manuscript.
Funding
This project was funded by the National Research Council of Canada under the Methodologies and Guidelines for Design and Evaluation of Highway Bridge in a Changing Climate Project managed by NRC (121491807RP0457).
Institutional Review Board Statement
Not applicable.
Informed Consent Statement
Not applicable.
Data Availability Statement
The authors confirm that the data supporting the findings of this study are available within the article, However, additional data can be provided upon reasonable request.
Acknowledgments
The authors gratefully acknowledge Sallal Abid, Department of Civil Engineering at Wasit University, for sharing his experimental field data and insightful discussions.
Conflicts of Interest
The authors declare no conflict of interest.
References
- Groupe Csa. Canadian Highway Bridge Design Code (CHBDC); Csa Group: Toronto, ON, Canada, 2019. [Google Scholar]
- Nasr, A.; Kjellström, E.; Björnsson, I.; Honfi, D.; Ivanov, O.L.; Johansson, J. Bridges in a changing climate: A study of the potential impacts of climate change on bridges and their possible adaptations. Struct. Infrastruct. Eng. 2019, 16, 738–749. [Google Scholar] [CrossRef]
- Khotbehsara, M.M.; Manalo, A.; Aravinthan, T.; Turner, J.; Ferdous, W.; Hota, G. Effects of ultraviolet solar radiation on the properties of particulate-filled epoxy based polymer coating. Polym. Degrad. Stab. 2020, 181, 109352. [Google Scholar] [CrossRef]
- Guest, G.; Zhang, J.; Atadero, R.; Shirkhani, H. Incorporating the Effects of Climate Change into Bridge Deterioration Modeling: The Case of Slab-on-Girder Highway Bridge Deck Designs across Canada. J. Mater. Civ. Eng. 2020, 32, 04020175. [Google Scholar] [CrossRef]
- Nasr, A.; Honfi, D.; Larsson Ivanov, O. Probabilistic analysis of climate change impact on chloride-induced deterioration of reinforced concrete considering Nordic climate. J. Infrastruct. Preserv. Resil. 2022, 3, 8. [Google Scholar] [CrossRef]
- Felio, G.; Canadian Construction Association; Canadian Public Works Association; Canadian Society for Civil Engineering and Federation of Canadian Municipalities. Canadian Infrastructure Report Card 2019; Municipal Roads and Water Systems; Canadian Construction Association: Ottawa, ON, Canada, 2019; Volume 1. [Google Scholar]
- Siddiquee, K.; Alam, M.S. Highway bridge infrastructure in the province of British Columbia (BC), Canada. Infrastructures 2017, 2, 7. [Google Scholar] [CrossRef]
- Gu, B.; Chen, Z.; Chen, X. Temperature gradients in concrete box girder bridge under effect of cold wave. J. Cent. South Univ. 2014, 21, 1227–1241. [Google Scholar] [CrossRef]
- Chen, D.; Qian, H.; Wang, H.; Chen, Y.; Fan, F.; Shen, S. Experimental and numerical investigation on the non-uniform temperature distribution of thin-walled steel members under solar radiation. Thin-Walled Struct. 2018, 122, 242–251. [Google Scholar] [CrossRef]
- Liu, J.; Liu, Y.; Jiang, L.; Zhang, N. Long-term field test of temperature gradients on the composite girder of a long-span cable-stayed bridge. Adv. Struct. Eng. 2019, 22, 2785–2798. [Google Scholar] [CrossRef]
- Zhao, Z.; Liu, H.; Chen, Z. Thermal behavior of large-span reticulated domes covered by ETFE membrane roofs under solar radiation. Thin-Walled Struct. 2017, 115, 1–11. [Google Scholar] [CrossRef]
- Zhu, Q.-X.; Wang, H.; Mao, J.-X.; Wan, H.-; Zheng, W.-Z.; Zhang, Y.-M. Investigation of Temperature Effects on Steel-Truss Bridge Based on Long-Term Monitoring Data: Case Study. J. Bridge Eng. 2020, 25, 05020007. [Google Scholar] [CrossRef]
- Abid, S.R.; Tayşi, N.; Özakça, M. Experimental analysis of temperature gradients in concrete box-girders. Constr. Build. Mater. 2016, 106, 523–532. [Google Scholar] [CrossRef]
- Wu, H.; Lin, X.; Zhou, A. A review of mechanical properties of fibre reinforced concrete at elevated temperatures. Cem. Concr. Res. 2020, 135, 106–117. [Google Scholar] [CrossRef]
- Düğenci, O.; Haktanir, T.; Altun, F. Experimental research for the effect of high temperature on the mechanical properties of steel fiber-reinforced concrete. Constr. Build. Mater. 2015, 75, 82–88. [Google Scholar] [CrossRef]
- Elbadry, M.; Ghali, A. Thermal stresses and cracking of concrete bridges. J. Proc. 1986, 83, 1001–1009. [Google Scholar]
- Wang, H.; Zhang, Y.-M.; Mao, J.-X.; Wan, H.-; Tao, T.-Y.; Zhu, Q.-X. Modeling and forecasting of temperature-induced strain of a long-span bridge using an improved Bayesian dynamic linear model. Eng. Struct. 2019, 192, 220–232. [Google Scholar] [CrossRef]
- Zhou, G.-D.; Yi, T.-H. Thermal Load in Large-Scale Bridges: A State-of-the-Art Review. Int. J. Distrib. Sens. Netw. 2013, 9, 217983. [Google Scholar] [CrossRef]
- Abid, S.R.; Mussa, F.; Tayşi, N.; Özakça, M. Experimental and finite element investigation of temperature distributions in concrete-encased steel girders. Struct. Control. Health Monit. 2018, 25, e2042. [Google Scholar] [CrossRef]
- Lei, X.; Jiang, H.; Wang, J. Temperature effects on horizontally curved concrete box-girder bridges with single-column piers. J. Aerosp. Eng. 2019, 32, 04019008. [Google Scholar] [CrossRef]
- Huang, S.; Cai, C.; Zou, Y.; He, X.; Zhou, T.; Zhu, X. Experimental and numerical investigation on the temperature distribution of composite box-girders with corrugated steel webs. Struct. Control Health Monit. 2022, 29, e3123. [Google Scholar] [CrossRef]
- Lee, J.-H. Investigation of Extreme Environmental Conditions and Design Thermal Gradients during Construction for Prestressed Concrete Bridge Girders. J. Bridge Eng. 2012, 17, 547–556. [Google Scholar] [CrossRef]
- Abid, S.a.l.l.a.l.R.; Tayşi, N.; Özakça, M. Temperature Records in Concrete Box-Girder Segment Subjected to Solar Radiation and Air Temperature Changes. IOP Conf. Ser. Mater. Sci. Eng. 2020, 870, 012074. [Google Scholar] [CrossRef]
- Lu, H.; Hao, J.; Zhong, J.; Wang, Y.; Yang, H. Analysis of Sunshine Temperature Field of Steel Box Girder Based on Monitoring Data. Adv. Civ. Eng. 2020, 2020, 9572602. [Google Scholar] [CrossRef]
- Abid, S.R.; Al-Gasham, T.S.; Xue, J.; Liu, Y.; Liu, J.; Briseghella, B. Geometrical Parametric Study on Steel Beams Exposed to Solar Radiation. Appl. Sci. 2021, 11, 9198. [Google Scholar] [CrossRef]
- Gottsäter, E.; Larsson Ivanov, O. Spatial Temperature Differences in Portal Frame Bridges. Struct. Eng. Int. 2019, 30, 254–261. [Google Scholar] [CrossRef]
- Hagedorn, R.; Martí-Vargas, J.R.; Dang, C.N.; Hale, W.M.; Floyd, R.W. Temperature Gradients in Bridge Concrete I-Girders under Heat Wave. J. Bridge Eng. 2019, 24. [Google Scholar] [CrossRef]
- Liu, H.; Liao, X.; Chen, Z.; Zhang, Q. Thermal behavior of spatial structures under solar irradiation. Appl. Therm. Eng. 2015, 87, 328–335. [Google Scholar] [CrossRef]
- Lee, J.; Jeong, Y.; Kim, W. Buckling behavior of steel girder in integral abutment bridges under thermal loadings in summer season during deck replacement. Int. J. Steel Struct. 2016, 16, 1071–1082. [Google Scholar] [CrossRef]
- Deng, H.-Q.; Li, T.-J.; Xue, B.-J.; Wang, Z.-W. Analysis of thermally induced vibration of cable-beam structures. Struct. Eng. Mech. 2015, 53, 443–453. [Google Scholar] [CrossRef]
- Kim, S.H.; Park, S.J.; Wu, J.; Won, J.H. Temperature variation in steel box girders of cable-stayed bridges during construction. J. Constr. Steel Res. 2015, 112, 80–92. [Google Scholar] [CrossRef]
- Abid, S.R.; Al-Gasham, T.S. Finite element simulation of vertical temperature gradients in a standard W40×235 steel beam. IOP Conf. Ser. Mater. Sci. Eng. 2020, 988, 012035. [Google Scholar] [CrossRef]
- Huang, S.; Cai, C.; Zou, Y.; He, X.; Zhou, T. Investigation of Temperature Variations and Extreme Temperature Differences for the Corrugated Web Steel Beams under Solar Radiation. Sensors 2022, 22, 4557. [Google Scholar] [CrossRef]
- Xu, W.; Chen, D.; Qian, H. Non-Uniform Temperature Fields and Effects of Steel Structures: Review and Outlook. Appl. Sci. 2020, 10, 5255. [Google Scholar] [CrossRef]
- Chen, D.; Xu, W.; Qian, H.; Sun, J.; Li, J. Effects of non-uniform temperature on closure construction of spatial truss structure. J. Build. Eng. 2020, 32, 101532. [Google Scholar] [CrossRef]
- Xu, W.; Chen, D.; Qian, H.; Chen, W. Non-uniform temperature field and effects of large-span spatial truss structure under construction: Field monitoring and numerical analysis. Structures 2021, 29, 416–426. [Google Scholar] [CrossRef]
- Abid, S.R. Temperature variation in steel beams subjected to thermal loads. Steel Compos. Struct. 2020, 34, 819–835. [Google Scholar]
- Ghali, A.; Favre, R.; Elbadry, M. Concrete Structures: Stresses and Deformations: Analysis and Design for Sustainability; CRC Press: Boca Raton, FL, USA, 2019. [Google Scholar]
- Zhang, C.; Liu, Y.; Liu, J.; Yuan, Z.; Zhang, G.; Ma, Z. Validation of long-term temperature simulations in a steel-concrete composite girder. Structures 2020, 27, 1962–1976. [Google Scholar] [CrossRef]
- Kalogirou, S.A. Solar Energy Engineering: Processes and Systems; Academic Press: Cambridge, MA, USA, 2014. [Google Scholar]
- Peng, Y.S. Studies on Theory of Solar Radiation Thermal Effects on Concrete Bridges with Application; Southwest Jiao Tong University: Chengdu, China, 2007. [Google Scholar]
- ANSYS 12 [Computer Software]; ANSYS: Canonsburg, PA, USA, 2009.
- Kehlbeck, F. Einfluss der Sonnenstrahlung bei Brückenbauwerken [Effect of Solar Radiation on Bridge Structure]; Werner: Düsseldorf, Germany, 1975. (In German) [Google Scholar]
- Canada weather stats, Canada Weather Stats. 2022. Available online: https://www.weatherstats.ca/ (accessed on 1 July 2022).
Disclaimer/Publisher’s Note: The statements, opinions and data contained in all publications are solely those of the individual author(s) and contributor(s) and not of MDPI and/or the editor(s). MDPI and/or the editor(s) disclaim responsibility for any injury to people or property resulting from any ideas, methods, instructions or products referred to in the content. |
© 2023 by the authors. Licensee MDPI, Basel, Switzerland. This article is an open access article distributed under the terms and conditions of the Creative Commons Attribution (CC BY) license (https://creativecommons.org/licenses/by/4.0/).