Abstract
This paper presents a mobile, easy-to-maintain wireless electroencephalograph (EEG) system designed for work with children in a school environment. This EEG data acquisition platform is a small-sized, battery-powered system with a high sampling rate that is scalable to different channel numbers. The system was validated in a study of live z-score neurofeedback training for quantitative EEG (zNF-qEEG) for typical-reading children and those with developmental dyslexia (DD). This system reads and controls real-time neurofeedback (zNF) signals, synchronizing visual stimuli (low spatial frequency (LSF) illusions) with the alpha/theta (z-α/θ) score neural oscillations. The NF sessions were applied during discrimination of LSF illusions with different contrasts. Visual feedback was provided with color cues to remodulate neural activity in children with DD and their cognitive abilities. The combined zNF-qEEG and training with different visual magnocellular and parvocellular tasks (VTs) compensated for the deficits in the temporal areas affecting the occipitotemporal pathway more in the left-hemispheric ventral brain areas of the post-training children with dyslexia in the low-contrast LSF illusion and dorsal dysfunction in the high-contrast LSF illusion. The better α/θ scores for postD in the temporoparietal and middle occipital regions can be associated with an improvement in special frequency processing, while the better scores in the precentral and parietal cortices were due to an advancement in the temporal processing of the illusion. The improvements in the reading speeds were twice as high after 4 months of qEEG z-NF-VT training, with three times fewer omitted words and errors.
1. Introduction
The popularity of neurofeedback (NF) has grown significantly in recent years, making neuroscience more accessible to scientists and engineers as well as for various fields of physiological activity and tasks in pediatric studies. In computational neuroscience in particular, the functional neural network has been used to determine the relation between NF training and EEG connectivity in groups of children [1,2]. Currently, NFs are actively used for medical purposes [1,3] in combination with multi-modal stimuli for children with dyslexia [4,5,6,7,8]. An overview of the possibilities of EEG NF training also described quite favorably the prospects in this area [1,3,4,5,9,10].
One of the limiting factors for the widespread use of NF is the difficulty in reading EEG signals, as they are susceptible to various types of noise (e.g., electromagnetic), motion artifacts [11], and variability in EEG signal features [12]. Due to the non-stationary neuronal activity, the requirements for professional EEG mobile devices are high quality and a high resolution for the applied analog front-ends in them. The guidelines of the American Society of Clinical Neurophysiology recommend that the required features of effective EEG systems be a minimum number of channels to obtain a good spatial resolution (of 32 channels) and application of effective algorithms to detect events, improving the efficiency level of the system [13]. Commonly used EEG acquisition systems are either expensive or difficult to deploy on a large scale, as the system is fixed and difficult to expand, or the performance and usage scenarios are limited [1].
Wireless systems have significant improvements compared with traditional wired EEG systems, such as protection against electromagnetic interference and the flexibility of monitoring the out-of-hospital environment to transmit data in any situation [1,14]. Being lightweight and small enough, these systems are wearable, consume little power for long-term monitoring, and have the computing power to process data for online decision making [1,14]. The limitations that slow the widespread implementation of wireless EEG systems are a short battery life, moderate signal resolution, small number of channels, and wireless bandwidth [1]. Such quality can be better achieved by low-noise programmable analog-to-digital convertors (ADCs) for EEG and ECG signals, such as ADS1298/9 [9,15,16,17,18,19,20,21]. The professional mobile EEG apparatuses on the market are not for outdoor use or extensive NF research [1]. There are no low-cost and compact data acquisition systems available that allow good reconfiguration of scaling, hardware, and up to 32 or more channels spatially for outdoor widespread applications [1]. The EEG systems support streaming and event detection modes that have different power consumption. High sampling rates and a large number of channels are rarely achieved in a single device on modern wireless EEG acquisition platforms [1,9,15,16,17,18,19,20,21,22].
In applications intended for children in outdoor environments, the need for wireless systems capable of autonomous survey and record NF information processing becomes apparent. In outpatient settings of pediatric studies, EEG systems should be small and portable with low power consumption for long-term operation and have a sufficient computing ability for online data transferring and processing during various tasks [14,16].
Low-cost modular board amplifiers were used for EEG acquisition in the current study, maintaining significant cost savings. The proposed design would allow an easily scalable system with adaptive spatial and frequency characteristics for different NF-EEG tasks. Section 2 presents an overview of the real-time EEG acquisition system solutions and state-of-the-art designs. Different views of the architecture and technical decisions are shown in Section 3. The zNF-EEG procedure and results are described in Section 4. An overview of the results is discussed in Section 5. The system limitations and conclusions are presented in Section 6 and Section 7, respectively.
2. Related Work
2.1. Real-Time EEG Acquisition Platforms
There are several commercial electronic components that are used for noninvasive monitoring of brain waves (EEG devices) [20]. The creation of a new high-precision analog front-end design (AFE) for discrediting the analog EEG signal is still under experimentation [18]. Prototype systems for long-term continuous EEG monitoring of epileptic patients are based on wearable modules with battery-powered AFEs (ADS1299) with a sampling rate Fs of 250 ksps (up to 1 kbps), a 1 GHz microprocessor (DM3730) (ARM-cortex-A8), 32 active dry electrodes, and wireless data transmission (802.11 b/g) to a host computer [1,16] (Table 1). The problems of this prototype were the maximum battery life and long cables due to the non-optimal system size [1]. Another portable EEG system [22] used for speller application on locked-in syndrome patients also integrated ADS1299 AFEs to support 16 independent channels (Fs, 250 Hz). This EEGu2 system had a more powerful processing element: BeagleBone Black with a 1 GHz processor (AM3358) (ARM Cortex-A8). The sufficient processing capability of data with high accuracy (25 dB SNR) and long life operation of the battery (up to 12 h) enable rapid embedded deployment of the speller application. This prototype needs its real-time response, total required power, size, and cost improved (Table 1).

Table 1.
Specifications of in-house EEG platforms, mainly built on low-noise, low power, and high-CMRR ADS1298/9 AFE chip. The dash (-) symbol indicates that the information is not available.
In order to protect the system from various AC and other noise sources, the EEG is transmitted to the host computer via a wireless connection. Wireless data transfer replaces long cables to electrodes and limits cable wobble, which introduces signal noise and artifacts [1]. Other systems based on a single ADS1299 have different microcontrollers such as SAM G55 [17] for continuous patient monitoring with schizophrenia, and STM32F4 [9] for different brain–computer applications, sending data over Bluetooth. The Bluetooth transfer of the EEG data due to the low power device consumption has bottlenecks, such as a shorter connection range and low data rates at higher EEG channel numbers or higher sample rates. In the EEG system [15], the bottleneck is changed by higher-bandwidth Wi-Fi 802.11 communication technology [15], but the limiting factor is the speed of the microcontroller (MCU). Other decisions include the use of two communication components: (1) a Bluetooth mini module HM-11 BLE 4.0 and (2) a Wi-Fi module ESP8266-12E through universal asynchronous receiver-transmitter and serial peripheral interfaces (SPIs) [19,21]. A wireless communication protocol based on SPI was also implemented in 16-channel EEG systems with ADS1298 AFEs and a 16 MHz Atmega2560 MCU [19], as well as ADS1299 and an 84 MHz ATSAM3X8E MCU (based on the ARM Cortex-M3 processor) [23]. In these EEG systems, the rejection ratios of the common mode (CMRR) for signals up to 70 Hz were −97 dB for ADS1298 [19] and −110 dB for ADS1299 [23]. Since the high channel number usually implies a low sampling rate under the available transmission bandwidth, these systems can rarely work simultaneously with high channel numbers and high sampling frequencies (Table 1).
2.2. Electrode Sensors and EEG Cap
Both EEG sensors (dry and wet) could be appropriate to EEG data acquisition for systems with 24 bit analog-to-digital convertors (ADCs) because of their high input impedance (1 MΩ) and CMRR (–97/110 dB), with achievable sampling rates up to 1 KHz [1,24]. The advantages of dry sensors were greater than those of wet electrodes in recent studies [24,25]. The application of traditional wet-sensor systems is largely limited by their difficult portability and long preparation time to outdoor settings.
3. System Architecture of the EEG Device
3.1. General Appearance
The functional block of the developed EEG device comprised the transmitting and receiving modules (Figure 1 and Figure A1). The transmission module consists of an analog front-end (AFE), a microcontroller, and a transmitter. Communication between the AFE and the software platform in the microprocessor part occurs with a transceiver via an SPI for program control.
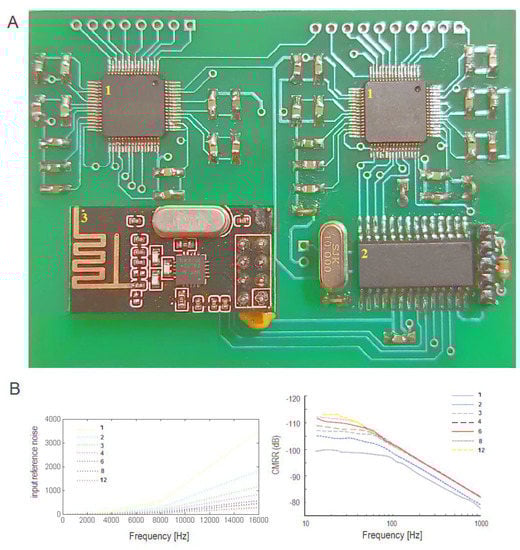
Figure 1.
(A) View of 16 channel device. (B) Average input reference noise μVpp of channel at sampling frequencies Fs of 250–16,000 Hz and gain PGA of 1–12 (common-mode rejection ratio (CMRR)) at said sampling frequencies.
The receiving part of one module included a receiver, a microcontroller, and a USB communication module (Figure 1 and Figure A1). The development of the real-time EEG data acquisition system was based on wearable modules with battery-powered, analog-to-digital, 24 bit resolution preamplifiers with conversion chips (ADS129x) that had a sampling frequency of up to 1 ksps per channel and low-power microcontrollers. They send data via wireless transmission to a host high-performance central processing unit (CPU) from 40 dry electrodes during tasks. The system was validated in a 12-channel EEG neurofeedback study in a school environment through research of typical-reading children and those with DD.
3.2. Transmission Module
3.2.1. Analog-to-Digital Convertor Module
The main focus was on the choice of the analog front-end (AFE), which supports a maximum number of channels with a high resolution for measurements of EEG and electrocardiogram (ECG) signals and good noise reduction capabilities. The AFE design enables the initial acquisition of analog biosignals by electrodes and their digital conversion (Figure 1 and Figure A1).
A conventional board for EEG data acquisition was founded on high-precision modules (ADS1298/9) to convert the data from analog to digital format [26]. The ADS129x enabled the elaboration of size-reduced medical systems with scalable characteristics and low power and total cost. The ADS129x AFEs were used in a multi-channel, battery-powered EEG system with significantly reduced board space compared with alternative EEG AFEs that provided fewer channels [18] and required additional external components such as anti-aliasing RC filters [26] and a high-Q active notch filter [18] for noise reduction. The choice of ADS129x in the EEG scheme implemented in the current study was mainly guided by the requirement of minimum power consumption when collecting weak electrophysiological signals (Figure 1 in [26]). The ADS129x AFEs were ADC chips programmable by configuring their registers. An on-chip internal reference circuit (right-leg-drive (RLD) amplifier) provided reference voltages to the device. The power supply module could be configured to 3.3 V, 0 V, or 5 V. The low-consumption device could be powered by 3.3 V, which was suitable for the battery power. Including more than one Wilson central terminal amplifiers reduced the total noise because of the noise averaging from the passive summing network at the output of these amplifiers. The capabilities of the right-leg-driving (RLD) circuit better reduced the noise and counteracted general interference, such as from power lines, and electromagnetic radiation from various radio transmitters and cells in mobile phones and routers. All in-phase LCD circuits were significantly reduced.
For our development, we chose implementation in the Thin Quad Flat Packages (TQFP) build. The connection to multiple devices was applied as shown in the technical overview of the ADS129x (Figure 45 in [26]). A “daisy chain” configuration was applied to connect the ADS1298 devices (Figure A2). Communication with the microcontroller was conducted via an SPI port (Figure A1). Most functions of ADS129x were implemented through five pins, such as configuration and control through the registers, the transfer of digital data, and leading out to a header for a convenient wireless connection (Figure A1). When multiple devices were used, all devices in the chain operated in the same register setting, and DIN was shared, reducing the SPI communication signals to four regardless of the number of devices (Figure A2). This architecture allowed a faster SCLK rate speed.
3.2.2. Transmitter
In the current study, a 2.4 GHz nRF24L01 transceiver module for low-power applications (1.9–3.6 V) accomplished wireless communication with a laptop (Figure 1 in [27]). This module was configured and controlled via a serial peripheral interface (SPI). Various operating modes of autonomous protocols are supported via a built-in baseband protocol engine, reducing system costs by managing all high-speed link layer operations. Data flow is provided by internal FIFOs between the MCU and the radio front-end with Gaussian frequency-shift keying (GFSK) modulation (Figure 1 and Figure A1). The nRF24L01 supported a configurable air data rate (up to 2 Mbps), frequency channel (2.4–2.4835 GHz), and output power with a programmable range (0, −6, −12, and −18 dBm) and a wide power supply range (1.9–3.6 V; Figure 1 in [27]). Power-saving modes, combined with high air data rates in the nRF24L01 low-power design, were appropriate for the current study. The packet-based data characteristics (enhanced shock burst) of nRF24L01 enabled high-performance communication with cheap host microcontrollers and achieving very low power [27]. The nRF24L01 stayed in TX active mode during transmitting packets. In an urban environment, the power provided a transmitter-receiver distance of several tens of meters. It was possible to operate several transceiver modules simultaneously without them interfering with each other.
3.2.3. Microcontroller
The choice of a high-performance central processing unit (CPU) was inappropriate for the present battery-powered EEG device. The selected CPU should reach an analog front-end sampling speed of 1 ksps to communicate with the device’s wireless modules. A microcontroller PIC18F2420 [28] was chosen for a CPU at 16 MHz. It can operate at a supply voltage of 3.3 V, with the low power consumption in operating mode being up to 40 MHz. The microcontroller can switch to sleep mode (1 MHz). Its hardware SPI port made programming the system very easy. The supply current was passed through the pin of the bypass capacitor and then to the supply pin for a more effective bypass. Potential crosstalk between multiple ADCs on the same printed circuit board (PCB) was minimized by broad power-supply traces. Minimizing the power-supply and reference-return trace couplings involved routing both traces separately on the AVSS pin as a star connection.
Overall, the fine performance of the ADS1298/9 comprised high input impedance and satisfactory temporal accuracy of simultaneous acquisition of multi-channel EEG data.
3.2.4. Receiving Block
The receiving unit was implemented based on a commercial module USB to nRF24L01 [27]. During the active RX mode, the nRF24L01+ radio, as a receiver, presents the demodulated data to the baseband protocol engine. It constantly searches for a valid packet, which can be cut by the protocol engine, when an address and a valid cyclic redundancy check match. The packet payload is presented in a free slot at the RX FIFOs (Figure A1). A received power detector (RPD) signal is available when RF signals >−64 dBm are inside the receiving frequency channel. The state of the RPD is latched upon receiving a valid packet, which then indicates the signal strength from our transmitter.
The module was a complete device that plugged directly into a computer’s USB port. All settings were determined using AT commands to a serial interface for cellular modules (so-called modem instructions). The communication set-up software package called USB nRF24L01 + Config v0.9 through a USB adapter is a free web-based tool. The USB communication was based on the CH340, a widely available chip with an available free driver running on all versions of Windows.
3.2.5. Software
Three ADC boards were plugged together for 40-channel EEG acquisition. The wirelessly transmitted data from the hardware front-end to the host computer made the system portable. This allowed the connection of up to 3 modules of 16 channels to the PC via different receivers connected to the USB ports on the PC. The instructions for the PIC18F2420 were supported by the software tools for the family of devices (MPLAB environment, MPLAB C18 C-compiler, and MPASM assembly language [28]). The main program takes a sequence of ADS129x task-related converted data, standby mode, input common mode, and reading and writing registers, controlling the ADS129x operations including acquisition, translation, and formatting of data. Data transmission to the software platform was performed by the standalone program.
The core functions of the software were data storage and real-time signal visualization (Figure A3). The software package provided reading, visualization, and recording of up to 40 channels. Algorithms for online analysis of the signal were implemented to provide real-time, stimulus-generated feedback, and functioning during neurophysiological tasks to create visual and auditory stimuli. Through temporal synchronization of stimuli events and data recording, the EEG signals and the task conditions can be compared with each other for further analysis. The real-time trace visualization of electrophysiological signals enabled the user to control the program through receive (”Start” and ”Stop”) and record buttons (”Stimulus” and ”NF”) (Figure A3). The generated stimuli, relevant to the external input, elicited EEG responses to certain experimental events synchronized to the EEG time stamps. The system implemented completed hardware and software EEG signal acquisition in various tasks. The stimuli were generated in C/C++ software on an NVIDIA GeForce GTX 1080 graphics card (Dell Alienware). At the same time, the acquisition front-ends for the EEG data recorded the 40 channels and the corresponding timestamps on a laptop (Acer Predator). Each dataset was constructed using EEG time stamps in the signal aligned to the stimulus events. A low-cost expansion of the EEG system for neurofeedback application was adapted for broad public use. The signal processing by the software was an important part, being the hardware component of the NF-EEG system where data collection takes place for high-speed performance in C/C+ and real-time signal processing in MATLAB [1,22].
For validation of the EEG system, a comparison of the data collection of the proposed system with the controlled data of the Nikon Kohden EEG system was performed (Figure 2). Both datasets correlated well, showing good agreement for the data in the time and frequency domains.
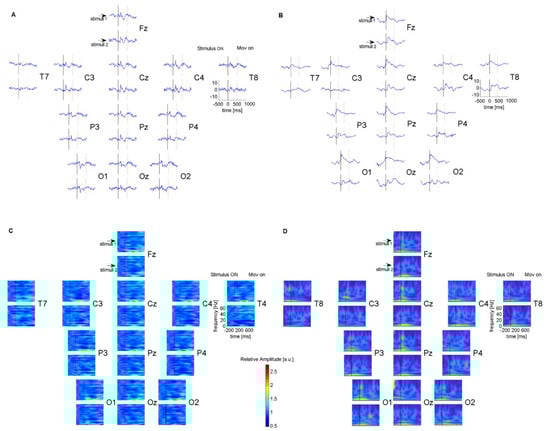
Figure 2.
Comparisons of EEG of two EEG systems for one subject during a visual task with low spatial frequency sinusoidal grating, recorded from the same brain locations with a 12 Ag/AgCl channel Nikon Kohden EEG system (A) and with the proposed Wi–Fi EEG system with 12 dry sensors (B). Comparisons of time–frequency spectrogram of data collected with Nikon Kohden EEG system (C) and with the proposed system (D). Event–related responses and the spectrograms were aligned according to the onset of the stimuli.
The experiments showed an average of a 25 dB SNR over 10 trials (20 μV EEG signal) which contained 250 × 10 samples with a gain of 12 and sampling frequency of 250 Hz (Figure 1B; gains 1–12). The internal noise in the AFE analog circuit was quantified by analyzing the input-referred noise with short positive and negative analog inputs. The experiment showed the peak-to-peak and root mean square input-referred noise (Vpp = 2.29 μV; Vrms = 0.34 μV) under the data reported in the manual of the ADS129x AFE (2.4 μV; 0.4 μV) at a sampling frequency of 250 Hz and bandwidth of 0.01–70 Hz of the signal.
3.2.6. Electrode Sensors and Cap
The wireless system with dry sensors was more applicable in outdoor environments (Figure 3 and Table 2). The time to prepare such a system was less than 5 min without using conductive gel and cleaning the skin. Each dry EEG sensor was configured as a matrix with a stellated geometry of 16 long-length golden and spring-loaded pins that better contacted an irregular scalp [29]. Other foam-based sensors made of a polymer and covered in electrically conductive fabric were used as ground and reference electrodes. Both types of sensors achieved low impedance of the skin–electrode interface (less than 5 kΩ). The dry sensors were built permanently into soft elastic 64-channel configured EEG caps [30] with three sizes (56, 58, and 60 cm), chosen in accordance with the child’s head. The adjustability of the EEG caps is a limitation of most devices, requiring different headsets to collect data for people with scalp size discrepancies that increase the cost of the system.
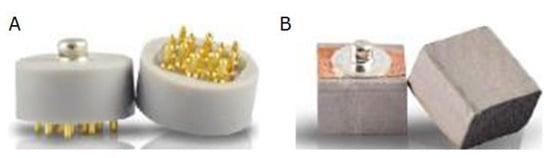
Figure 3.
The dry sensors used in the system: (A) a spring-loaded sensor and (B) a foam sensor applied as the ground and reference electrodes with a clip on each earlobe. The easy-to-handle dry electrodes can be quite helpful in fostering the practical application of EEG in schools while minimizing variances related to measurement errors (e.g., crosstalk between electrodes due to excessive amounts of gel application).
Table 2.
Specifications of the dry sensors in the wireless EEG acquisition system.
4. Materials and Methods
4.1. Participants
A controlled comparison of an experimental group with controls included typical readers (n = 36; 26 boys and 10 girls; mean age: 8–9 years; SD = 0.58) and children with developmental dyslexia (DD, n = 72; 52 boys and 20 girls). Children with disabilities unrelated to reading did not take part in the study (Table S1). The controls were from the same school grade and sociodemographic background without dyslexia and without learning or language difficulties (Table S1). The criteria to include 8–9-year-old children in the experimental group were the following: (1) DD diagnosed by a school logopedist and psychologist under the DD classification (Table S1); (2) several brain regions with abnormal waves; (4) completing 12 qEEG z-NF sessions and visual training; and (5) an intelligence quotient >85 according to the Raven intelligence scale (Table S1). These pretest sessions were conducted to identify children with core (magnocellular) visual deficits and the multi-sensory integration deficits underlying dyslexia. Intervention to be effective must be tailored to defective skills. Children with DD were assigned to a pre-training experimental group (preD) with six qEEG z-NF intervention sessions over a one-week period (for each hemisphere). The control group also had six neurofeedback sessions. Over a period of 4 months, a visual-based training procedure (VT, Supplementary Materials) and six other qEEG z-NF sessions were administered to a treatment group with DD (post-training group (postD)). The behavioral measures of reading included word reading, accuracy, and speed measured at the beginning and end of the four-month period (intervention). The study used a pretest-training-post-test design to assess the training effect of combined programs (12 completed qEEG z-NF sessions and visual training) based on visual tasks, with a specific focus on gains in skill-related brain functioning for reading.
4.2. NF-EEG Brain Locations
The 40-channel EEG placement was according to the standard 10-20 and 10-10 systems [31,32] and separated sensors for the ground, sensors placed on the forehead, and reference sensors in both mastoid processes (Table 3 and Figure 4). The stretch cap held the 40 embedded sensors that were prepositioned in the international montages, which minimized electrode placement errors through measurements (10% and 20% as well as 10% and 5%) of the distances between the skull landmarks along the midline from the nasion (Nz) to the inion (Iz) and from the left to the right pre-auricular points (A1 and A2, respectively) correctly aligned in the horizontal and vertical planes with placement Cz. The EEG sensors (10-20: Fz, Cz, Pz, O1-O2, and Oz; 10-10: FT9-FT10, TP7-TP8, PO7-PO8) for the NF experiment are underlined in Table 3. Their choice was according to the functional connectivity studies [6,7] of the typically developed children. We hypothesized that qEEG z-NF may lead to a functional reorganization in DD children that consists of a reduced interhemispheric low-frequency theta band and an increased alpha band in the regions involved in the reading network in the temporal lobe, occipital cortex, and those which intervene in the articulation and gesticulation of words as frontal and precentral cortices.
Table 3.
Forty sensor locations covering adjacent brain areas. Twelve NF sensors (eight areas) are marked in bold.
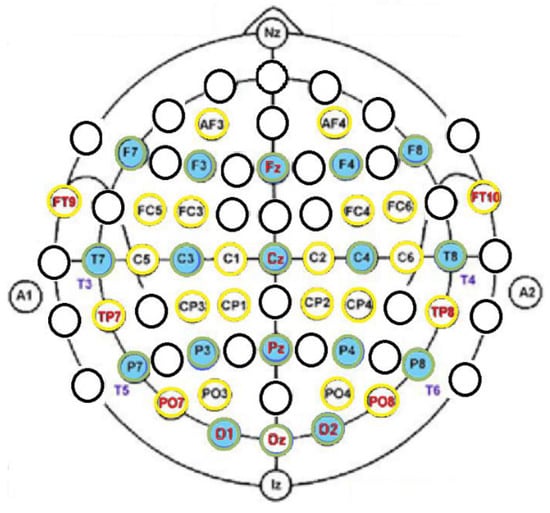
Figure 4.
Forty sensor locations of the EEG system: 10-20 (green circles) and 10-10 systems (yellow circles). The 12 NF sensors are written in red.
4.3. NF-EEG Experiment
The reinforcement technique (neurofeedback) for the magnocellular pathways in DD children consisted of visual stimuli with different contrasts vertically flicking in an external noise field (Figure 5 and Figure A3C).
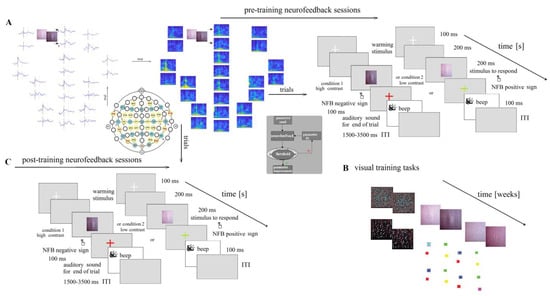
Figure 5.
Scheme of experimental set-up. (A) EEG signals and frequency analysis at the EEG signals. Presentation of pre-training neurofeedback sessions: six sessions (for each hemisphere). (B) Visual training (VT) tasks, described in Supplementary Materials. (C) Post-training neurofeedback.
The discrimination of different contrast Gabor gratings with illusionary doubling motion (LSF illusion: flicker with a 15 Hz counter phase and low spatial frequency 2 cycles per visual angle degree) consisted of the following conditions: a low-contrast level 6% and high-contrast level 12% of the threshold level of 50%, defined in previous psychophysics experiments [33]. The stimuli were presented in the center on a monitor and were arranged in a 40-trial pseudo-randomized series with 1.5–3.5 s intervals between stimuli (20 trials/condition). A fixation white cross appeared for 100 ms at the start of each trial. After 200 ms, the LSF illusion appeared for 200 ms at a viewing distance of 210 cm from the monitor (Figure 5). A colored cross was presented on the monitor for 100 ms in red when the EEG prints were below the set threshold and in a green sign when the EEG stamps were above it. The child determined the illusion with low contrast by pressing a button with the left hand and the illusion with high contrast by pressing a button with the right hand. The trial’s end was marked with a brief beep. A response time period comprised the period of 100–1500 ms from the stimulus onset. The acquisition of the EEG data was synchronized with the stimuli onset. Trial-by-trial neurofeedback was perceived as a different-colored cross.
4.4. NF-EEG Procedure
The developed system was validated via a 12-channel EEG neurofeedback study in a school environment through research on typical-reading children and children with DD (Figure A3). Neurofeedback via evoked EEG oscillations can improve the performance of a child with DD, compensating for their magnocellular deficit during the visual LSF illusion task [2].
The real-time z-score neurofeedback device (qEEG z-NF) provided a 24-bit conversion with a 256 Hz sampling frequency and second-order notch filtering for removing the powerline noise at 50 Hz, as well as an EEG bandwidth of 0.1–70 Hz with a type II Chebyshev filter. The time-locked trials during the presentation of the flicking Gabor gratings (~250 ms) were frequency-decoded via a Morlet wavelet (MATLAB) in δ: 3–4, θ: 4.5–8, α: 8.5–12, β: 13.5–20, 20.5–30, and γ: 30.5–48, 52–70 Hz. The qEEG z-NF α/θ scores were determined from the α and θ frequency peaks assessed in each hemisphere for eight brain regions (Table 3). A mean baseline with a duration of 2.5 min at the first experimental feedback-free session with the eyes opened for each child was applied as a measure to define the z-score’s threshold in the software norm data [34]. The absolute qEEG standardized index (|prior z-score| ≥ 1.0) was used as the target z-score, defined by logarithmic transformation of the qEEG data features to obtain the optimal mean and standard deviation. It minimized the influence of variables affecting the EEG characteristics by tending toward a standard normal distribution with a mean of zero and variance of one. Several brain areas (Table 3) and their abnormal α/θ scores were enrolled as candidates for feedback in studies of dyslexia [6,7]. During the sessions, the z-scores for the seven bands for the selected channels were computed moment by moment during the stimulus duration. Their absolute pre-z-scores ≥1.0 were highlighted as being the targeted z-scores by site and frequency.
The z-α/θ scores were either up- or down-trained to approximate to the normal score. This allowed specific underlying areas of the brain to be targeted for training and could lead to a reduced number of sessions. The NF latency, or the delivery time of the EEG trial to the observed qEEG-z-NF sign on the monitor, determines the schedule of reinforcement so that it significantly affects the outcome of the operant conditioning [35]. The child received positive feedback as a visual cue when the z-scores fell within a “target window” (±1 standard deviation of the normative mean) and the z-score that was outside of the target window moved toward the target window. The visual feedback was marked with a green sign when the z-score was above the threshold, and the mark was a red sign when the z-score was under the threshold. The qEEG z-NF protocol was performed for 10 min (for each brain hemisphere) in 6 sessions twice for the DD group before a visual perceptional training procedure [33] and 4 months after that, and one procedure was carried out for the controls. The mean pre- and post-assessment qEEG z-NF sessions was 12. After preprocessing, the average artifact-free trial number was 772 epochs of data for each group or condition.
The protocol included (1) the left-hemispheric θ decrease and α-wave augmentation at regions adjacent to the reading functional network (left inferior frontal, posterior superior temporal, ventral occipitotemporal, and middle occipital cortex) and (2) the compensated left-hemispheric α/θ score increase and right-hemispheric α/θ decrease in brain laterality for the dyslexic group from reducing the slow θ waves to reach a new learning information level from the brain.
4.5. Statistics
Nonparametric bootstrap tests compared the threshold-selected z-scores for pairs of brain locations of the groups (controls vs. pre-training group with DD, controls vs. post-training group with DD, and pre-training vs. post-training group with dyslexia) and the hemispheres (left vs right side), with subsets of 1000 permutations for each comparison. The waves with |z-scores| higher than the group standard deviation were categorized as outliers, which were excluded from the comparisons. The Bonferroni correction for the multiple comparisons was applied to the significance level in the permutation tests. For behavioral analysis of the task (correct responses, response times, and reading achievements), non-parametric Kruskal–Wallis tests were performed in pre-post conditions.
4.6. Results
4.6.1. Behavioral Results
In both conditions of the LSF illusion task, the pre-training dyslexics had slower responses and fewer correct responses than the other groups (Figure 6). Before training, the children with dyslexia (preD) had more difficulty discriminating the low-contrast illusion than the other groups (Con and postD; Figure 5). The postD group showed higher percentages of correct responses and faster response times in the low-contrast condition after qEEG z-NF-VT training in the within-group comparison (preD vs. postD, p = 8.7 × 10⁻⁷, χ2 = 24.79; Figure 5). The improved discrimination accuracy and reaction time were observed in the post-D group compared with the other groups (p < 0.015, χ2 > 5.94).
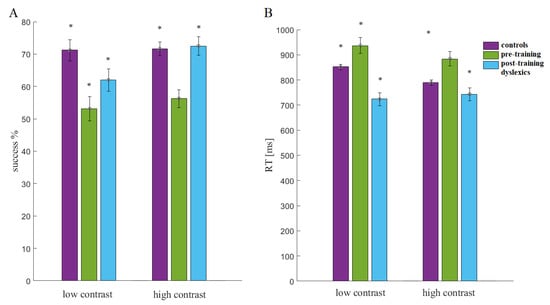
Figure 6.
Statistical comparisons (Kruskal–Wallis test, p < 0.05; marked with stars): (A) success (%) and (B) reaction time (RT).
4.6.2. Reading Results
The improvements in the reading speeds were twice as high after four months of qEEG z-NF-VT training with three times fewer missed words and errors (p = 0.001; Table S2). The word reading span also improved after training (p = 0.001). Before training, the dyslexics showed slower voice response times (1497.96 ± 30.5) during the word reading compared with post training (1266.16 ± 27.9 ms). After training, there was a significant improvement in voice response compared with before training (p < 0.0001, χ2 = 30.4; Table S2). Their performance significantly improved in the visual words and pseudoword discrimination task, reducing reading time and increasing words read correctly (p < 0.03; Table S2). The dyslexic group showed higher success rates and slower reaction times compared with both words and pseudowords after training (p < 0.03, χ2 = 4.51 for words; p = 0.02, χ2 = 5.29 for pseudowords). Their reaction times did not change significantly (Table S2).
4.6.3. z-NF Training Results
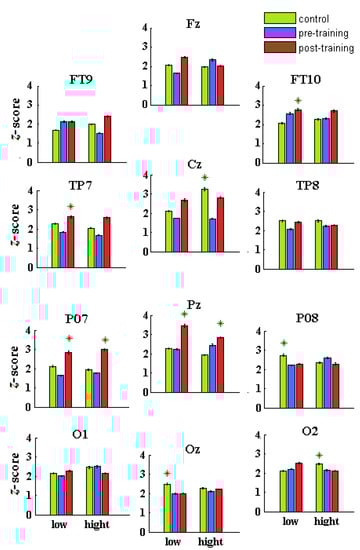
Figure 7.
Averaged α/θ scores for each sensor and group (Con = green; preD = blue; postD = red) and condition (low and high contrast). The stars marked the highest values of α/θ scores across sensors, groups, and conditions.
Table 4.
Statistics of α/θ scores between sensors of the groups for qEEG z-NF trainings (p < 0.05).
In both conditions, the α/θ z-scores of the controls (Con) were significantly higher than those for the children with dyslexia before training (preD) in more brain locations (Con vs. preD: p < 7.2 × 10⁻⁶, χ2 > 20.1; average score of all sensors: mean ± se, Con: 2.27 ± 0.04; preD: 1.98 ± 0.03; Table 4). There were no differences between the Con and preD groups for the z-score of the midline, right-side sensors, (O1-2) at low contrast (p > 0.1045, χ2 < 2.64), or for the z-score of the right-side sensors (Oz, O1) under the high-contrast condition (p > 0.062, χ2 < 3.49). In both contrasts, significantly higher z-scores were found for the left-hemispheric sensors of Con compared with those of the preD group (p < 0.0357, χ2 > 4.41; low contrast: Con = 1.99 ± 0.04; preD = 1.89 ± 0.03; high contrast: Con = 2.03 ± 0.04; preD = 1.63 ± 0.03).
Although the α/θ scores of the preD group were significantly lower than those of the other groups (Table 4), they had significantly higher scores than the Con group at FT9 and at the right-hemispheric FT10 and O2 (low contrast) and Pz, FT10, and PO8 (high contrast) while showing no differences at O1-2 (preD vs. Con, low) and O1-Oz (high contrast).
The α/θ scores of all post-training dyslexic sensors were significantly higher relative to the correspondent sensors of the preD group (postD vs. preD: p < 0.008, χ2 > 7.02; Figure 7 and Table 4). There were no differences at the occipital and temporal cortices between the preD and postD z-scores at O1 and FT9-FT10 (low) and at TP8-O2 (high contrast).
For both conditions, the right-hemispheric α/θ scores of the controls and dyslexic children before training were significantly higher than the left-hemispheric scores (left vs right side: p < 2.3 × 10⁻⁶, χ2 > 31.2; Table 4), whereas a non-significant hemispheric difference in the post-training dyslexic group was found (postD left vs right side: p > 0.131, χ2 < 2.29; Table 4).
In a condition of low-contrast discrimination, the highest α/θ scores were found in the postD group at FT10, TP7, Pz, PO7, which covered the anterior and middle temporal, superior parietal, and middle occipital areas, in the Con group at TP8, PO8, and Oz, and the preD group at FT10, Pz, PO8, and O2 (Table 4) among the sensors in a group. In the high-contrast discrimination, the highest α/θ scores were found for the postD group at PO7, Pz, and Cz, in the Con group at Cz, TP8, and O1-O2, and in the preD group at the PO8 and O1 across the sensors in a group (Table 4).
Lower α/θ z-scores at areas adjacent to the precentral gyrus and bilateral cuneus (Cz and Oz under high contrast) were found in the preD group compared with the Con group, similar to the reading tasks [6]. The preD α/θ scores were elevated at the anterior temporal cortex, related to efforts by compensatory mechanisms for the deficits in visual and motor processing (Figure 7). The postD group improved the α/θ oscillations at the premotor, primary motor, right anterior temporal, right occipitotemporal (TP8), and left middle occipital (PO7) cortices due to their more active involvement in the NF sessions (Figure 7). The Con vs. postD group comparisons showed that the qEEG z-NF also produced better effects in the occipital, middle temporal, and precentral areas of the controls (low contrast: TP8 and Oz; high contrast: O1-2 and Cz; Table 4).
The sensor statistics for the postD group (vs. Con) yielded significantly higher α/θ scores at the SPL, left MOG, the MFG (low contrast: Pz and PO7; high contrast: Fz) and lower α/θ scores at the right middle occipital cortex (high contrast: PO8-O2). The middle temporal, lateral occipitotemporal, dorsal associative visual, and occipital areas in the post-training children with DD contributed to the compensatory α and θ mechanisms, reducing right-hemispheric dominance over the left. The intra-hemispheric α/θ scores significantly increased at the middle temporal and occipital cortices (both conditions: TP7 and PO7) and the middle frontal, precentral, and superior parietal cortices (low contrast: Fz, Cz, and Pz) for the post-training group (vs. Con and preD).
5. Discussion
The proposed EEG system design, which is easily scalable and adaptable to various EEG tasks, explored the α/θ z-NF effects during discrimination of different contrast LSF illusions on children with DD.
Mechanisms compensating parvo- or magnocellular deficits were induced during the qEEG z-NF training. By simultaneously reducing excess θ frequencies and increasing power at the α frequencies, these mechanisms normalized the frequency power spectrum associated with the specific experimental conditions. Specific frequency changes, such as decreased α/θ scores and α oscillations, were found in the posterior areas of the right hemisphere. Other changes under increased α/θ scores (e.g., θ activity decrease and α activity increase) were observed in the anterior areas. The postD group was characterized by emphasized α/θ (α power) increases at the posterior regions in the left brain hemisphere compared with the other groups.
Low pre-D α/θ scores were observed during the first NF sessions from the left MOG to the MFG (low-contrast LSF illusions) and from the left MTG to the ATG (high-contrast LSF illusions). Recent NF training sessions resulted in higher post-D α/θ scores at the left MOG across the SPL to the PRECG (low- and high-contrast conditions). The reading skills were also improved after NF training of children with disabilities in learning (Table S2). Studies of EEG-based NF have shown that the combination of qEEG-zNF and other treatment approaches leads to better outcomes than an NF alone [36]. Combining the training effect of NF on the primary visual deficit of DD with the effects of visual perceptional training on specific visual deficiencies for dyslexia [33,36] improved reading by stimulating the connectivity of weakly connected brain regions in the reading network. The design of the EEG system was convenient to apply in schools. Although the additional visual training for specific DD deficits extended the training period, it still fell short of age-related maturation. Therefore, the NF contribution of the protocol to improving the cognitive and reading skills of children with DD was combined solely with the contributions of the visual training and could not be attributed to age-related maturation or other school learning.
The precentral, left ATC, SPL (precuneus), and lateral occipital cortex showed significant changes as a result of training in the postD group. The changes in the middle occipital cortices and the precuneus were significantly affected by the task features. Under the discrimination conditions, the SMA and the postcentral cortex reduced their activation, as did the bilateral precuneus, revealing the sensorimotor and visual processing deficits in the preD group, respectively. During reading tasks, reduced activation was also found in the SMA and the right IPL in the DD group [6]. The increased activity in the IFG and ATC in the preD group could be explained by more executive efforts and the low automatization of the tasks (LSF illusion and reading). The reduced activity extending posteriorly from the right postcentral cortex to the SPL in children with DD (vs. the controls) could explain the reduced reading speed, occurring due to insufficient sensory feedback. The reduced activity in the right dorsomedial parietooccipital, bilateral preparietal, and superior parietal regions and the MOG of the preD group, compared with the controls, could be related to insufficient processing of visual-spatial information. The effective sensory stimulus processing and selective attention of the post-training dyslexics (for the high-contrast condition) and the controls (for the low-contrast discrimination) could be related to the decreased α frequency power and α/θ activity in the occipital areas [37,38], as well as in the frontoparietal network (high θ frequency activity). The high θ oscillations in the frontal cortex of the pre-training group related to the low-contrast condition could be associated with the requirements for more cognitive resources for the task’s performance. Additionally, the left MTG and left MOG of the preD group showed low α/θ scores (high θ power). The language processing was subserved in both hemispheres by the MST and its right side for visuospatial information storage [39]. Hence, the lower α/θ lateralization of MST may imply a compensatory mechanism in the post-training DD children [39]. During the stimulus, right-hemispheric high α/θ score (high α-band power) was observed in the preD group, while in the postD group, widespread α/θ growth was found in both hemispheres. In general, attention-relevant α activity was not restricted to visual stimulus processing [40,41], whereas pre-stimulus α power was modulated by accuracy and attention to stimulus processing. The low α/θ scores (increased θ-band activity) bilateral at the frontal, temporal, and parietal areas in the pre-training dyslexics could be related to mental fatigue, worse performance [42], and also aberrations in global brain organization of verbal and spatial cognitive skills [43].
The left-lateralized α/θ scores of the post-training dyslexics (α-band power [44]) correlated with focusing on processing local LSF elements [45], while the right-side high α/θ scores (high α activity) in the pre-training group correlated with the worse global attention bias. The selection of attention at the local or global level of information is governed by a cortical attentional mechanism established in the temporoparietal junction and depending on the visual task-related conditions [46]. Global form identification was associated with higher activation of the lingual gyrus in the right hemisphere and the local element identification with that of the inferior occipital gyrus in the left hemisphere [47,48]. The occipital cortex rapidly relays the coarse information about the LSF illusion through the parietal and frontal cortices (dorsal route) before spreading to the inferotemporal cortex, mediating LSF recognition (ventral route [49]).
Better α and θ activity of the postD group in the frontal, temporoparietal, and middle occipital regions was associated with detection from the visual areas of the LSF identification Gabor gratings during the neurofeedback. They recognize coarse LSF information more quickly through projections to the orbitofrontal cortex, which is strongly and reciprocally connected to the temporal cortex [50]. In the right hemisphere, the recognition of the fine LSF illusion elements preferentially occurred from the occipital cortex to the ITG [48], whereas the temporal and orbitofrontal cortices were involved during its coarse recognition, suggesting strong intra-hemispheric functional interactions. Through the top-down connections of the frontal, temporal, and parietal cortices to the visual cortex [47,51], the fine stimulus features were analyzed and selected, whereas the cerebral hemispheres were complementary in the postD group’s stimulus processing.
The better left-hemispheric α/θ scores of the postD group in the temporoparietal and middle occipital regions can be associated with an improvement in spatial frequency processing [52], while the better scores in the precentral and parietal cortices can be associated with an advancement of the temporal processing efficiency of the illusion through the magnocellular pathway in both contrast conditions [53].
6. Limitations
Due to the variable characteristics of the EEG signal, the development of a battery-powered mobile Wi-Fi NF-EEG system is challenging. Some professional EEG-NF devices are available from many vendor companies, but due to the high price, they are not intended for public use. Scaling and reconfiguring the hardware to allow for over 64 channels would reduce many of the technical characteristics of mobile systems. The only limitation of a stand-alone system with a high-performance processor operating at maximum load is the maximum battery life. Charging it complicates the collection of EEG data in these devices. Participant data security may be at risk on account of the sensitivity of wireless connections or due to any movement of cables. Therefore, wireless EEG systems could encrypt data prior to wireless transfer and use shorter sensor-ADC connections or a head mounting. Overall, the price of the system only increases due to the headset adjustability, requiring multiple headset caps for people with different head sizes.
7. Conclusions
The EEG acquisition system maintained significant savings due to its development of the presented low-cost modular board amplifiers. The proposed design allowed easy adaptation to various NF-EEG task applications, being scalable in regard to spatial and temporal resolutions. In this application designed for children in an outdoor environment, the need for an autonomous wireless system, research, and recording capability for NF information processing was evident. In the school-based setting of the children’s study, this system was small and portable with low power consumption for long-term operation. The EEG system had sufficient computing ability for online data transfer, processing, supported streaming, and event detection modes during various complex tasks.
The stimulated qEEG z-NF brain self-regulation of determinative brain regions has also been shown at the behavioral level to be more effective than NF regulation of a single brain area. An outcome of combined qEEG z-NF-VT training was functional brain reorganization and emerging neuroplasticity [2,36,53]. Through specific visual tasks (VTs), the qEEG z-NF alpha-theta network better affected other frequency networks related to the reading and transferred the learned effect to improvements in cognitive and reading abilities by strengthening weakly connected brain areas. Stimulating the dyslexia-unaffected remote brain areas in the ventral route by training can facilitate the affected regions in the dorsal route and hemispheric laterality.
Supplementary Materials
The following supporting information can be downloaded at https://www.mdpi.com/article/10.3390/app13010096/s1, Table S1: Psychological results, “References [54,55,56,57,58,59,60,61] are cited in the Supplementary Materials”. Table S2: Behavioral results. Supplementary Materials: Visual training tasks, “Reference [33] is cited in the Supplementary Materials”.
Author Contributions
Conceptualization, methodology, and supervision, J.D.; device design, T.T. (Tsvetalin Totev); software and visualization, T.T. (Tsvetalin Totev) and T.T. (Tihomir Taskov); validation, T.T. (Tsvetalin Totev), J.D. and T.T. (Tihomir Taskov); formal analysis, T.T. (Tihomir Taskov); investigation and resources, J.D. and T.T. (Tihomir Taskov); writing—preparation, review, and editing, J.D. and T.T. (Tihomir Taskov). All authors have read and agreed to the published version of the manuscript.
Funding
National Science Fund of the Ministry of Education and Science, grant number DN05/14-2016 and Ph.D. grant 2020/2023 funded the research. Ph.D. grant 2022/2023 funded the APC.
Institutional Review Board Statement
This study was conducted in accordance with the Declaration of Helsinki and approved by the Ethics Committee of the Institute of Neurobiology, the Institute for Population and Human Studies, BAS (protocol code N° 02-41/12.07.2019) on 12 July 2019, the State Logopedic Center, and the Ministry of Education and Science (approval N° 09-69/14.03.2017) on 28 March 2017.
Informed Consent Statement
Informed consent was obtained from all subjects in the study.
Data Availability Statement
The data are not publicly available due to the restrictions applied to the availability of the data.
Conflicts of Interest
The authors declare no conflict of interest.
Appendix A

Figure A1.
A scheme of one module of the EEG platform, included: (U1, U2) ADS129x AFEs; (U3) Microcontroller PIC18F2420; (U4) Transmitter-receiver part NRF24L01.
Figure A1.
A scheme of one module of the EEG platform, included: (U1, U2) ADS129x AFEs; (U3) Microcontroller PIC18F2420; (U4) Transmitter-receiver part NRF24L01.

- (1)
- (U1, U2) AFEs: the ADS129x comprised eight programmable gain amplifiers (PGAs) with low noise and analog-to-digital converters (ADCs) with high-resolution, auxiliary single-ended differential input modes, a temperature sensor, an ADC delta-sigma modulator, test signals, built-in right leg drive (RLD) amplifiers, lead-off detection, Wilson central terminal (WCT) amplifiers, and built-in reference voltage;
- (2)
- (U3) Microcontroller PIC18F2420 (on-chip VCO system frequency range 16–40 MHz; F max = 16.36 MHz/V);
- (3)
- (U4) Transmitter-receiver part NRF24L01: the FIFO data stored the transmitted (TX FIFO) or received payloads ready for shutdown (RX FIFO). Both modes (PTX and PRX) allowed the FIFOs access.

Figure A2.
(A) Daisy chain configuration with two devices. In this configuration, SCLK, DIN, and CS are shared across multiple devices. The DOUT pin of device 2 is connected to the DAISY_IN pin of the first device, creating a chain. The DRDY pin of the first AFE is connected with the microcontroller, and the DRDY pins of other boards do not need to be connected. All devices are configured to the same register values because CS is shared and connected to SCLK, MOSI, MISO, and the general-purpose digital outputs (GPOs) of the microcontroller and those of the wireless connection transmitter. The devices in the chain operate in the same register setting. DIN can be shared, thereby reducing the SPI communications. (B) nRF2401. The FIFO data store the transmitted (TX FIFO) or received payloads ready for shutdown (RX FIFO). Both modes (PTX and PRX) allow the FIFOs access. Both FIFOs have a controller and are accessible through the SPI by special serial peripheral interface commands.


Figure A3.
Device assembly: (A) image of the device, (B) 40-sensor headset according to International 10-20 (blue) and 10-10 systems (yellow circles), (C) experimental paradigm, and (D) experimental set-up.
Figure A3.
Device assembly: (A) image of the device, (B) 40-sensor headset according to International 10-20 (blue) and 10-10 systems (yellow circles), (C) experimental paradigm, and (D) experimental set-up.

References
- Soufineyestani, M.; Dowling, D.; Khan, A. Electroencephalography (EEG) Technology, Applications and Available Devices. Appl. Sci. 2020, 10, 7453. [Google Scholar] [CrossRef]
- Taskov, T.; Dushanova, J. Improving functional connectivity in developmental dyslexia through combined neurofeedback and visual training. Symmetry 2022, 14, 369. [Google Scholar] [CrossRef]
- Rakhmatulin, I. Deep learning and machine learning for EEG signal processing on the example of recognizing the disease of alcoholism. medRxiv 2020. [Google Scholar] [CrossRef]
- Coben, R.; Wright, E.K.; Decker, S.L.; Morgan, T. The impact of coherence neurofeedback on reading delays in learning disabled children: A randomized controlled study. NeuroRegulation 2015, 2, 168. [Google Scholar] [CrossRef][Green Version]
- Kumari, P.; Mathew, L.; Syal, P. Increasing trend of wearables and multimodal interface for human activity monitoring: A review. Biosens. Bioelectron. 2017, 90, 298–307. [Google Scholar] [CrossRef]
- Taskov, T.; Dushanova, J. Reading-network in developmental dyslexia before and after visual training. Symmetry 2020, 12, 1842. [Google Scholar] [CrossRef]
- Taskov, T.; Dushanova, J. Functional connectivity in developmental dyslexia during speed discrimination. Symmetry 2021, 13, 749. [Google Scholar] [CrossRef]
- Dushanova, J.; Lalova, Y.; Kalonkina, A.; Tsokov, S. Speech–brain frequency entrainment of dyslexia with and without phonological deficits. Brain Sci. 2020, 10, 920. [Google Scholar] [CrossRef]
- Vo, T.T.; Nguyen, N.P.; Vo Van, T. WEEGEE: Wireless 8-Channel EEG Recording Device. In Proceedings of the BME 2017: 6th International Conference on the Development of Biomedical Engineering in Vietnam (BME6), Ho Chi Minh, Vietnam, 27–29 June 2017; Volume 63, pp. 621–625. Available online: https://link.springer.com/chapter/10.1007/978-981-10-4361-1_106 (accessed on 24 September 2017).
- Vo, H.; Dang, L.; Nguyen, I.; Huynh, V. A Survey of Machine Learning algorithms in EEG. In Proceedings of the 2019 6th NAFOSTED Conference on Information and Computer Science (NICS), Hanoi, Vietnam, 12–13 December 2019; pp. 500–505. [Google Scholar] [CrossRef]
- Mumtaz, W.; Rasheed, S.; Irfan, A. Review of challenges associated with the EEG artifact removal methods. Biomed. Signal Process. Control. 2021, 68, 102741. [Google Scholar] [CrossRef]
- Dushanova, J.; Popivanov, D. Nonlinear prediction as a tool for tracking the dynamics of single-trial readiness potentials. J. Neurosci. Methods 1996, 70, 51–63. [Google Scholar] [CrossRef]
- Brenner, R.P.; Drislane, F.W.; Ebersole, J.S.; Grigg-Damberger, M.; Hallett, M.; Herman, S.T.; Hirsch, L.J.; Husain, A.M.; Kaplan, P.; Legatt, A.D.; et al. Guideline twelve: Guidelines for long-term monitoring for epilepsy. Neurodiagnostic J. 2008, 48, 265–286. [Google Scholar] [CrossRef]
- Casson, A.; Smith, S.; Duncan, J.; Rodriguez-Villegas, E. Wearable EEG: What is it, why is it needed and what does it entail? Annu. Int. Conf. IEEE Eng. Med. Biol. Soc. 2008, 2008, 5867–5870. [Google Scholar] [CrossRef] [PubMed]
- Myung, B.; Yoo, S. Development of 16-channels Compact EEG System Using Real-time High-speed Wireless Transmission. Engineering 2013, 5, 93–97. [Google Scholar] [CrossRef]
- Pinho, F.; Correia, J.H.; Sousa, N.J.; Cerqueira, J.J.; Dias, N.S. Wireless and wearable EEG acquisition platform for ambulatory monitoring. In Proceedings of the IEEE 3nd International Conference on Serious Games and Applications for Health (SeGAH), Rio de Janeiro, Brazil, 14–16 May 2014; pp. 1–7. [Google Scholar] [CrossRef]
- Senevirathna, B.; Berman, L.; Bertoni, N.; Pareschi, F.; Mangia, M.; Rovatti, R.; Setti, G.; Simon, J.; Abshire, P. Low cost mobile EEG for characterization of cortical auditory responses. In Proceedings of the 2016 IEEE International Symposium on Circuits and Systems (ISCAS), Montreal, QC, Canada, 22–25 May 2016; pp. 1102–1105. [Google Scholar] [CrossRef]
- Consul-Pacareu, S.; Mahajan, R.; Abu-Saude, M.J.; Morshed, B.I. NeuroMonitor: A low-power, wireless, wearable EEG device with DRL-less AFE. IET Circuits Devices Syst. 2017, 11, 471–477. [Google Scholar] [CrossRef]
- Uktveris, T.; Jusas, V. Development of a Modular Board for EEG Signal Acquisition. Sensors 2018, 18, 2140. [Google Scholar] [CrossRef] [PubMed]
- Rashid, U.; Niazi, I.; Signal, N.; Taylor, D. An EEG experimental study evaluating the performance of Texas Instruments ADS1299. Sensors 2018, 18, 3721. [Google Scholar] [CrossRef] [PubMed]
- Vargas, J.F.; Brainwear, H.B.; Zhou, B.; Lukowicz, P. Brainwear: Towards multi-modal garment integrated EEG. In 2021 International Symposium on Wearable Computers; Association for Computing Machinery: New York, NY, USA. [CrossRef]
- Feng, S.; Tang, M.; Quivira, F.; Dyson, T.; Cuckov, F.; Schirner, G. EEGu2: An embedded device for brain/body signal acquisition and processing. In Proceedings of the International Symposium on Rapid System Prototyping (RSP), Pittsburgh, PA, USA, 1–7 October 2016; pp. 1–7. [Google Scholar] [CrossRef]
- Toresano, L.O.H.Z.; Wijaya, S.K.; Prawito Sudarmaji, A.; Badri, C. Data acquisition system of 16-channel EEG based on ATSAM3X8E ARM Cortex-M3 32-bit microcontroller and ADS1299. AIP Conf. Proc. 2017, 1862, 030149. [Google Scholar] [CrossRef]
- Uchitel, J.; Vidal-Rosas, E.E.; Cooper, R.J.; Zhao, H. Wearable, Integrated EEG–fNIRS Technologies: A Review. Sensors 2021, 21, 6106. [Google Scholar] [CrossRef]
- Rakhmatulin, I.; Gan, Y. Review Dry and Non-Contact EEG Electrodes for 2010–2021 Years. Preprints 2021, 2021030555. [Google Scholar] [CrossRef]
- Texas Instruments. ADS129x Low-Power, 8-Channel, 24-Bit Analog Front-End for Biopotential Measurements. Available online: https://www.ti.com/document-viewer/ADS1298/datasheet/specifications#SBAS459528 (accessed on 1 January 2015).
- Nordic Semiconductor. NRF24L01+ Single Chip 2.4GHz Transceiver. Available online: https://www.micro-semiconductor.com/datasheet/ce-NRF24L01P-R7.pdf (accessed on 1 April 2010).
- Microchip Technology Inc. PIC18F2420-2520 Microcontrollers. Available online: https://ww1.microchip.com/downloads/aemDocuments/documents/OTH/ProductDocuments/DataSheets/PIC18F2420-2520-4420-4520-28-40-44-Pin-Microcontrollers-with-XLP-Technology-30009613F.pdf (accessed on 1 February 2008).
- Brain Rhythm Inc. Available online: https://www.bri.com.tw (accessed on 10 February 2017).
- Easycap GmbH. Available online: https://www.easycap.de/ (accessed on 14 February 2018).
- Koessler, L.; Maillard, L.; Benhadid, A.; Vignal, J.P.; Felblinger, J.; Vespignani, H.; Braun, M. Automated cortical projection of EEG sensors: Anatomical correlation via the international 10-10 system. NeuroImage 2009, 46, 64–72. [Google Scholar] [CrossRef]
- Giacometti, P.; Perdue, K.L.; Diamond, S.G. Algorithm to find high density EEG scalp coordinates and analysis of their correspondence to structural and functional regions of the brain. J. Neurosci. Methods 2014, 229, 84–96. [Google Scholar] [CrossRef] [PubMed]
- Dushanova, J.; Lalova, Y.; Kalonkina, A. Protocol for Visual Intervention of Developmental Dyslexia. In Advances in Medicine and Biology; Berhardt, L.V., Ed.; Nova Science Pub: New York, NY, USA, 2022; pp. 177–199. ISBN 978-1-68507-654-2. [Google Scholar]
- Wigton, N.L.; Krigbaum, G. Attention, executive function, behavior, and electrocortical function, significantly improved with 19-channel z-score neurofeedback in a clinical setting: A pilot study. J. Atten. Disord. 2015, 23, 398–408. [Google Scholar] [CrossRef]
- Belinskaia, A.; Smetanin, N.; Lebedev, M.; Ossadtchi, A. Short-delay Neurofeedback facilitates training of the parietal alpha rhythm. J. Neural. Eng. 2020, 17, 066012. [Google Scholar] [CrossRef] [PubMed]
- Patil, A.U.; Madathil, D.; Fan, Y.-T.; Tzeng, O.J.L.; Huang, C.-M.; Huang, H.-W. Neurofeedback for the Education of Children with ADHD and Specific Learning Disorders: A Review. Brain Sci. 2022, 12, 1238. [Google Scholar] [CrossRef] [PubMed]
- Van Dijk, H.; Schoffelen, J.M.; Oostenveld, R.; Jensen, O. Prestimulus oscillatory activity in the alpha band predicts visual discrimination ability. J. Neurosci. 2008, 28, 1816–1823. [Google Scholar] [CrossRef] [PubMed]
- Berger, B.; Griesmayr, B.; Minarik, T.; Biel, A.; Pinal, D.; Sterr, A.; Sauseng, P. Dynamic regulation of interregional cortical communication by slow brain oscillations during working memory. Nat. Commun. 2019, 10, 4242. [Google Scholar] [CrossRef]
- Bartha-Doering, L.; Novak, A.; Kollndorfer, K.; Kasprian, G.; Schuler, A.L.; Berl, M.M.; Fischmeister, F.P.S.; Gaillard, W.D.; Alexopoulos, J.; Prayer, D.; et al. When two are better than one: Bilateral mesial temporal lobe contributions are associated with better vocabulary skills in children and adolescents. Brain Lang. 2018, 184, 1–10. [Google Scholar] [CrossRef]
- Bauer, M.; Kennett, S.; Driver, J. Attentional selection of location and modality in vision and touch modulates low-frequency activity in associated sensory cortices. J. Neurophysiol. 2012, 107, 2342–2351. [Google Scholar] [CrossRef]
- Dale, G.; Arnell, K.M. Investigating the stability of and relationships among global/local processing measures. Atten. Percept. Psychophys. 2013, 75, 394–406. [Google Scholar] [CrossRef]
- Maksimenko, V.; Kuc, A.; Frolov, N.S.; Hramov, A.; Pisarchik, A.; Lebedev, M. Neuronal adaptation in the course of the prolonged task improves visual stimuli processing. bioRxiv 2020. [Google Scholar] [CrossRef]
- Mellet, E.; Zago, L.; Jobard, G.; Crivello, F.; Petit, L.; Joliot, M.; Mazoyer, B.; Tzourio-Mazoyer, N. Weak language lateralization affects both verbal and spatial skills: An fMRI study in 297 subjects. Neuropsychologia 2014, 65, 56–62. [Google Scholar] [CrossRef] [PubMed]
- Vossel, S.; Geng, J.J.; Fink, G.R. Dorsal and ventral attention systems: Distinct neural circuits but collaborative roles. Neuroscientist 2014, 20, 150–159. [Google Scholar] [CrossRef] [PubMed]
- Gable, P.A.; Poole, B.D.; Cook, M.S. Asymmetrical hemisphere activation enhances global-local processing. Brain Cogn. 2013, 83, 337–341. [Google Scholar] [CrossRef]
- Fink, R.; Marshall, J.C.; Halligan, P.W.; Dolan, R.J. Neuronal activity in early visual areas during global and local processing: A comment on Heinze, Hinrichs, Scholz, Burchert and Mangun. J. Cogn. Neurosci. 2000, 12, 355–356. [Google Scholar] [CrossRef]
- Kauffmann, L.; Ramanoël, S.; Peyrin, C. The neural bases of spatial frequency processing during scene perception. Front. Integr. Neurosci. 2014, 8, 37. [Google Scholar] [CrossRef] [PubMed]
- Silver, M.A.; Ress, D.; Heeger, D.J.; Michael, A.; Neural, D.J.H. Neural correlates of sustained spatial attention in human early visual cortex. J. Neurophysiol. 2007, 97, 229–237. [Google Scholar] [CrossRef]
- Weissman, D.H.; Woldorff, M.G. Hemispheric asymmetries for different components of global/local attention occur in distinct temporo-parietal loci. Cereb. Cortex 2005, 15, 870–876. [Google Scholar] [CrossRef]
- Zeidman, P.; Mullally, S.L.; Schwarzkopf, D.S.; Maguire, E.A. Exploring the parahippocampal cortex response to high and low spatial frequency spaces. Neuroreport 2012, 23, 503–507. [Google Scholar] [CrossRef]
- Bar, M.; Kassam, K.S.; Ghuman, A.S.; Boshyan, J.; Schmid, A.M.; Dale, A.M.; Hämäläinen, M.S.; Marinkovic, K.; Schacter, D.L.; Rosen, B.R.; et al. Top-down facilitation of visual recognition. Proc. Natl. Acad. Sci. USA 2006, 103, 449–454. [Google Scholar] [CrossRef]
- Peters, J.L.; Bavin, E.L.; Brown, A.; Crewther, D.P.; Crewther, S.G. Flicker fusion thresholds as a clinical identifier of a magnocellular-deficit dyslexic subgroup. Sci. Rep. 2020, 10, 21638. [Google Scholar] [CrossRef]
- Eroğlu, G.; Teber, S.; Ertürk, K.; Kırmızı, M.; Ekici, B.; Arman, F.; Balcisoy, S.; Özcan, Y.Z.; Çetin, M. A mobile app that uses neurofeedback and multi-sensory learning methods improve reading abilities in dyslexia: A pilot study. Appl. Neuropsychol. Child. 2022, 11, 518–528. [Google Scholar] [CrossRef] [PubMed]
- Raichev, P.; Geleva, T.; Valcheva, M.; Rasheva, M.; Raicheva, M. Protocol on neurological and neuropsychological studies of children with specific learning disabilities. Integr. Learn. Resour. Teach. 2005. (In Bulgarian) [Google Scholar]
- Matanova, V.; Todorova, E. DDE-2 Test Battery for Evaluation of Dyslexia of Development - Bulgarian Adaptation; OS Bulgaria Ltd.: Sofia, Bulgaria, 2013; Available online: https://www.giuntipsy.bg/bg/prod-19-testova-bateriq-za-ocenka-nadisleksiq-na-razvitieto.htm (accessed on 1 September 2022).
- Sartori, G.; Remo, J.; Tressoldi, P.E. Updated and revised edition for the evaluation of dyslexia. In DDE-2, Battery for the Developmental Dyslexia and Evolutionary Disorders-2, 1995; Giunti, O.S.: Florence, Italy, 2007. [Google Scholar]
- Kalonkina, A.; Lalova, Y. Normative indicators for the test battery for a written speech assessment. In Logopedical Diagnostics (30-38); Tyubele, S., Iossifova, R., Eds.; Rommel Publishing House: Sofia, Bulgaria, 2016. [Google Scholar]
- Raven, J.; Raven, J.C.; Court, J.H. Manual for Raven’s Progressive Matrices and Vocabulary Scales. Section 2: The Coloured Progressive Matrices; Oxford Psychologists Press: Oxford, UK, 1998. [Google Scholar]
- Girolami-Boulinier, A. Contrôle des Aptitudes à la Lecture et àl’Ecriture (CALE); CALE: Paris, Masson, 1985. (In French) [Google Scholar]
- Yakimova, R. Narusheniya na Pismenata rech. Abnormalities of Written Speech; Rommel Publishing House: Sofia, Bulgaria, 2004. (In Bulgarian) [Google Scholar]
- Annett, A. A classification of hand preference by association analysis. Br. J. Psychol. 1970, 61, 303–321. [Google Scholar] [CrossRef] [PubMed]


Disclaimer/Publisher’s Note: The statements, opinions and data contained in all publications are solely those of the individual author(s) and contributor(s) and not of MDPI and/or the editor(s). MDPI and/or the editor(s) disclaim responsibility for any injury to people or property resulting from any ideas, methods, instructions or products referred to in the content. |
© 2022 by the authors. Licensee MDPI, Basel, Switzerland. This article is an open access article distributed under the terms and conditions of the Creative Commons Attribution (CC BY) license (https://creativecommons.org/licenses/by/4.0/).