1. Introduction
Ports and surrounding areas of the coast are zones in which a multitude of human activities are concentrated in a limited space with usually low water renewal rates. In consequence, ports and adjacent waters are very sensitive to pollution and accumulation of solid waste and their impact on the aquatic environment and, in turn, socioeconomic impact [
1]. A relevant mechanism of water pollution in port areas is waste discharge and accumulation caused by non-continuous discharge events either intentionally or accidentally. This means solid or liquid pollutant waste is discharged into the water instantaneously or during a short period of time. These events constitute one of the most significant aspects to be considered in port and coastal environmental management; thus, economic and robust monitoring techniques are paramount to achieve adequate port water quality [
2,
3]. This issue is especially sensitive in city ports where there is a close relation between port operation and city activity, and where city waste and pollution can easily get into port water [
4]. Currently, the most common approach for marine pollution monitoring in ports relies on conventional methods of collecting in situ water and waste samples for subsequent analysis in a laboratory. Such methods are time-consuming, expensive and do not provide a real-time picture of water quality in port waters. Thus, in practice they tend to be implemented at minimum levels in order to comply with regulations, especially in ports with scarce resources. The consequences of this limited monitoring at environmental management level are in many cases significant [
5,
6]. Additionally, real-time or near real-time measurement and monitoring methods for marine pollutants and waste are necessary for managing their environmental impacts and understanding the processes governing their spatial distribution [
7]. These techniques offer a complementary perspective on marine pollution to hydrodynamics-based environmental management techniques [
8,
9,
10]. Thus, real-time pollution monitoring techniques can be linked with hydrodynamic models to obtain improved environmental management systems [
11].
Given the nature and frequency of these discharges, management systems will usually consider the statistical parameters of the spatial and temporal distribution of the frequency of discharges instead of individual events. Therefore, these systems do not require very high levels of accuracy in monitoring as opposed to critical systems like biomedical applications, but rather enough to offer statistically significant distributions. Monitoring systems that offer 80% or higher accuracy are considered admissible based on the usual values required in these types of applications [
12].
In this context, it is important to note that pollution discharge events in ports are, in most cases, visually perceivable. Consequently, it seems feasible to investigate the possibility of establishing automated monitoring systems for these discharges using cameras installed at strategic points in the port. Associated with automatic image analysis systems, computer vision techniques seem an excellent complement according to previous experiences in other fields for detecting and recognition [
12,
13,
14]. Computer vision techniques have recently experienced a quick evolution, being implemented in a wide range of different applications with high efficiency and performance [
15,
16,
17]. Deep learning on convolutional neural networks is proven to achieve very high performance on computer vision tasks [
18]. In fact, remote sensing technology is proven to provide spatially synoptic and near real-time measurements that can be effectively used to detect and manage pollutants such as suspended sediments, oil and chemical spills, algal blooms and high suspended solids [
7,
19]. Additionally, recent contributions in waste and pollutant detection used Image Classification based on deep convolutional networks [
20,
21]. Such approaches have been successful at addressing pollution detection in large surface areas. In the case of port waters, satellite images cannot be used due to poor image resolution, and a monitoring system tailored to smaller scales has to be generated. Specifically, a computer vision system, supported by “in situ” mounted camera images would be a robust alternative for water pollution monitoring at ports. This system would allow continuous and low-cost monitoring of surface water pollution, addressing the limitations of traditional observational techniques. In addition, it would constitute a leap forward in the digitalization of ports through the practical application of artificial intelligence technology in coastal infrastructures at limited cost. It is important to note that the aim of this novel monitoring system is not only to give warnings for each discharge so that immediate action can be taken, especially in particularly relevant episodes that generate a significant risk for health or navigation, but also to obtain knowledge about the discharges that threaten the port waters where and when they happen or if they are related to specific operations. In consequence, computer vision, combined with traditional or Artificial Intelligence based analysis, may provide operational knowledge in specific port areas and facilities, thus allowing development of adequate environmental management strategies.
Computer vision techniques can be classified according to the problem considered [
22]. There are several classifications and the set of problems considered has grown in recent times, but Image Classification is one of the most common applications and, in consequence, is very promising in port environmental management [
23]. Image Classification involves assigning a label to an entire image; the labels (i.e., the categories in which images were classified) that should be considered in the context of port environmental management systems are three: clean water, pollution (spill) or floating waste (waste). One of the most important requirements for the implementation of computer vision systems is the generation of a database of tagged images that can be used to train the algorithm. In this respect, it is important to take into account that gathering a significant database of images of spills can be time consuming, as they can only be achieved by installing cameras in the port to record images of eventual spills. Thus, images will be incorporated to the database progressively, and the question arises in terms of how many images—and image types—are required to train the algorithm to achieve an adequate level of confidence on the system. Specifically, it is important to determine whether it is preferable to train the algorithm with all images available even when the number of images in each category is different, or whether optimal results will be obtained only when there is an equal number of images in each category. In the first scenario, the least common class will be underrepresented, potentially affecting proper system performance, and in the second, the number of images to be gathered increases, and consequently so does the time required to achieve a working system.
In addition to image requirements, computer vision systems are evaluated according to specific performance metrics. Four of the most common metrics are Accuracy, Precision, Recall and F1-score [
24,
25]. However, the Accuracy metric does not provide a relevant metric for a port environmental management system because clean water images will be significantly more abundant than waste and spill ones; here Accuracy will provide mostly a measure of how many times clean water is correctly predicted. However, preliminary designs of computer vision systems for port environmental management suggest the need to generate correct alarms on spill and waste instances. Thus, an alternative metric needs to be put forward in order to compare trained algorithms with a set of images that are not evenly distributed between categories, as will be the case in the current application.
The present paper evaluates the results of a set of experiments on surface spills and floating marine waste identification based on random images as an initial stage of the development of a system for port water quality monitoring. After the methodological process (i.e., post-process) has been implemented, image sets have been obtained and analyzed to determine the amount and proportion of each image class that is required. In this sense, several computer vision techniques have been assessed, including Image Classification as the most promising one identified preliminarily. In order to evaluate the performance of the algorithm specifically for port environmental management applications, a novel performance index (the error index) has been proposed. The set of images has been conducted in the port of Palma de Majorca, which suffers important events of water quality degradation.
The paper is organized as follows.
Section 2 introduces the study area, the computer vision technique used, the spill and waste classification, the system layout, the images used, the algorithm training and the statistical reliability of the algorithms.
Section 3 shows the results of the training processes and a comparison for different amounts of data available in terms of image set sizes and distribution.
Section 4 presents a discussion on the design criteria for the system set-up and its further development. Finally, in
Section 5, the conclusions of the study are summarized.
2. Materials and Methods
2.1. Study Area
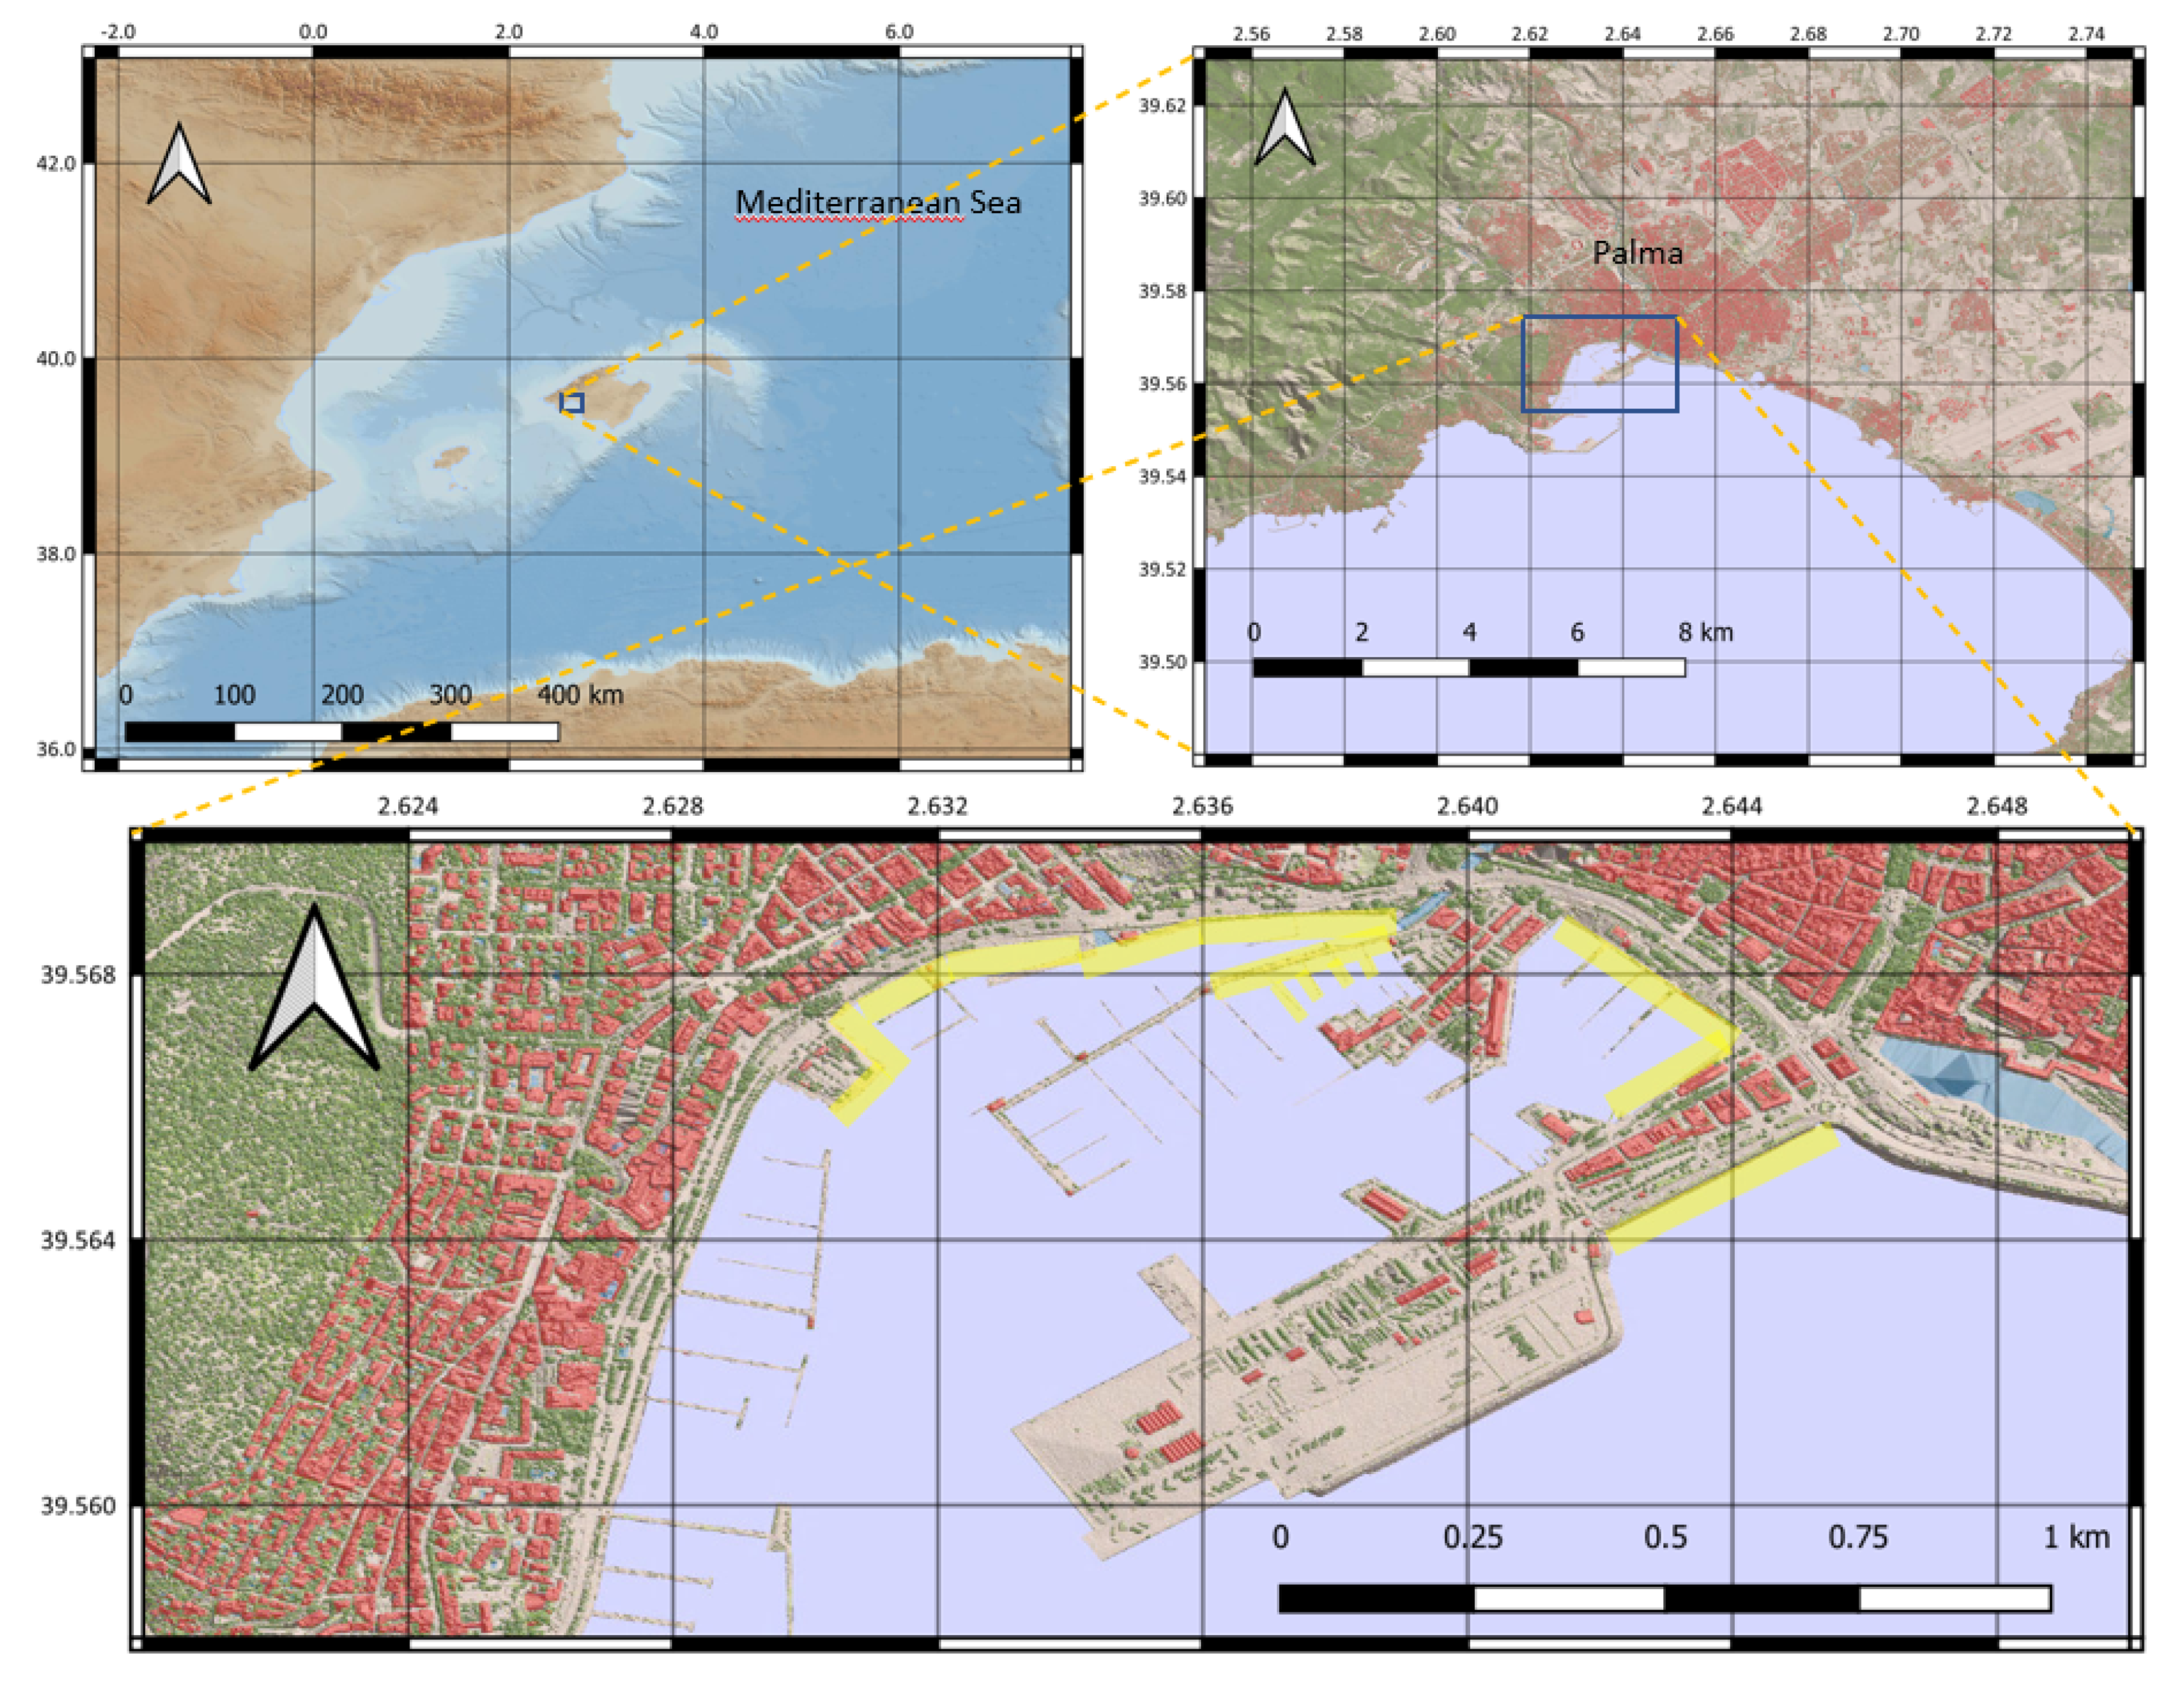
The port of Palma de Mallorca is located in the city of Palma, on the island of Majorca (Balearic Islands, Spain; see location in
Figure 1) in the Western Mediterranean Sea, with approximate coordinates of: 2°38.4′ E, 39°33.7′ N. The management resides at the Port Authority of the Balearic Islands in a landlord governance model. From the impact on water quality degradation and environmental management, the port has the following characteristics: (i) Strong Port–City relation. (ii) Development of several different port activities (i.e., recreational boating, transport of passengers and goods, fishing, repair and maintenance of boats and restoration and services on land). (iii) Sporadic discharges of rainwater through four gullies and several collectors of stormwater drainage networks, in some cases with risk of discharge of mixed rainwater and wastewater.
2.2. Computer Vision Technique and Application to Pollution in Port Waters
Computer vision is a field where applications are developed using convolutional neural networks that are trained using deep learning techniques. Specifically, it can be defined as a set of techniques to automatically obtain descriptions or significant parameters from the images of physical objects; these descriptions can be useful for decision making. This is the case of the current investigation included in the field of marine waste and litter detection. Due to the numerous potential applications of Computer vision, it has experienced an important development in the recent years.
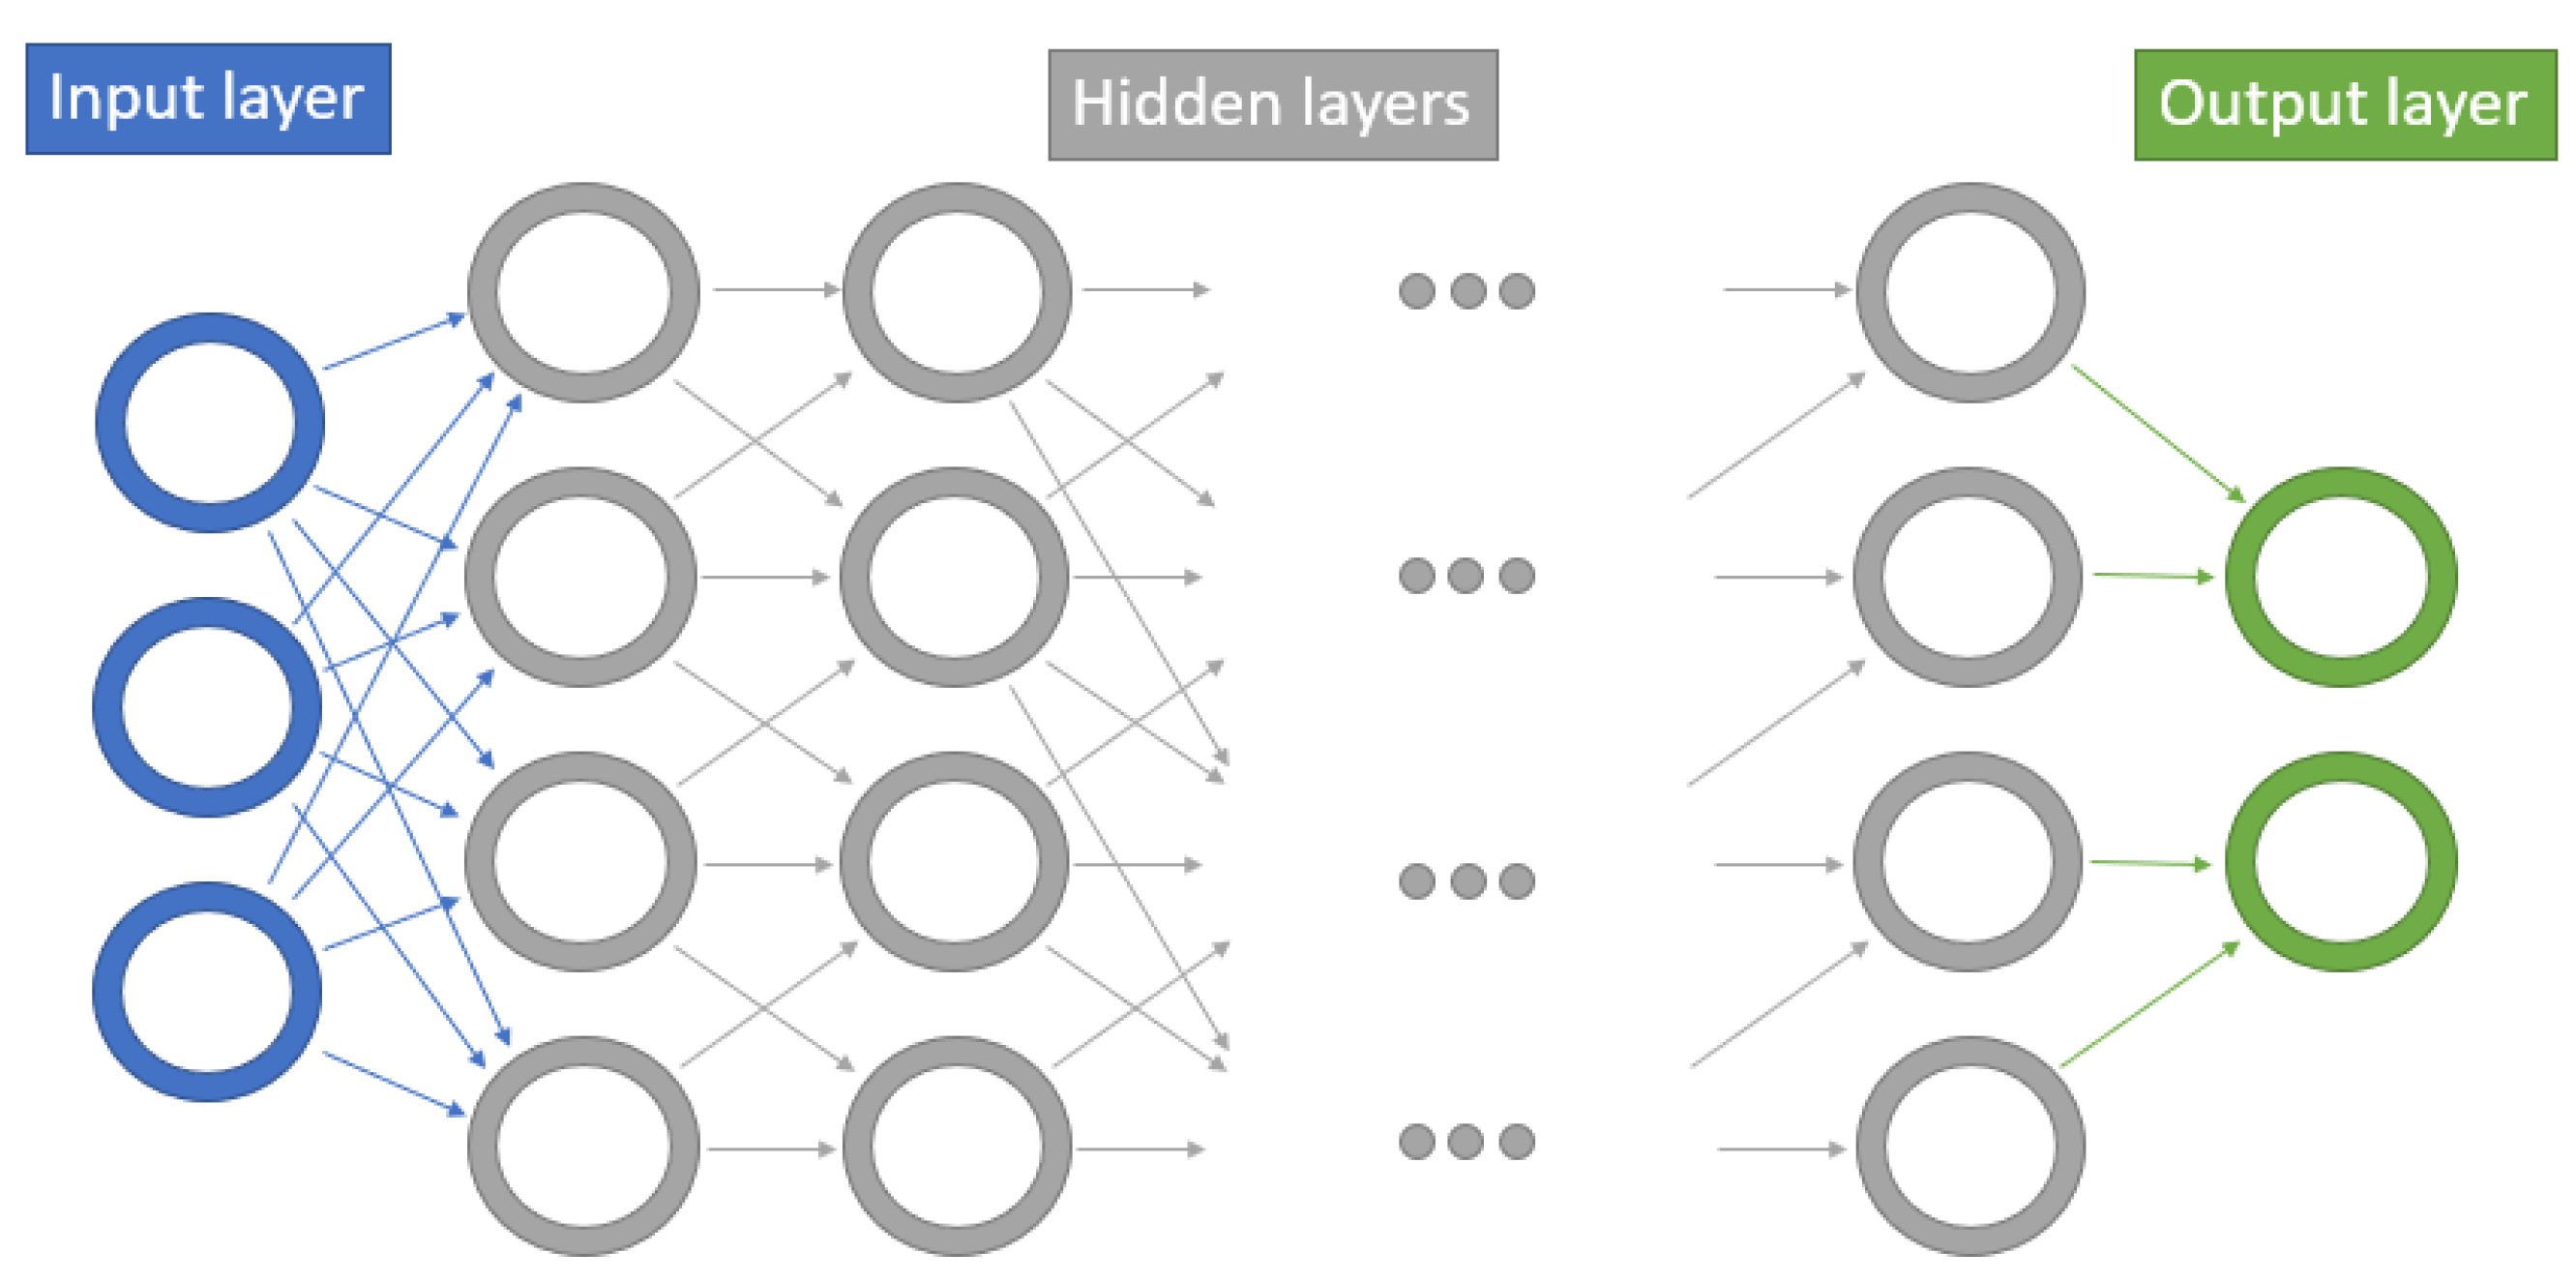
An artificial neural network is a collection of connected nodes which loosely model the neurons in a biological brain [
26]. Each connection, like the synapses in a biological brain, can transmit a signal to other neurons. When an artificial neuron receives a signal, it processes it and, as a result, sends outputs (real numbers) to neurons connected to it. In turn, the output signals of each neuron are computed by some non-linear function of the sum of its inputs. Typically, neurons are aggregated into layers; different layers may perform different transformations on their inputs coming from the one before. Signals travel from the first layer (or input layer) to the last one (or output layer).
Figure 2 depicts schematically how neurons in different layers interact to provide meaningful results.
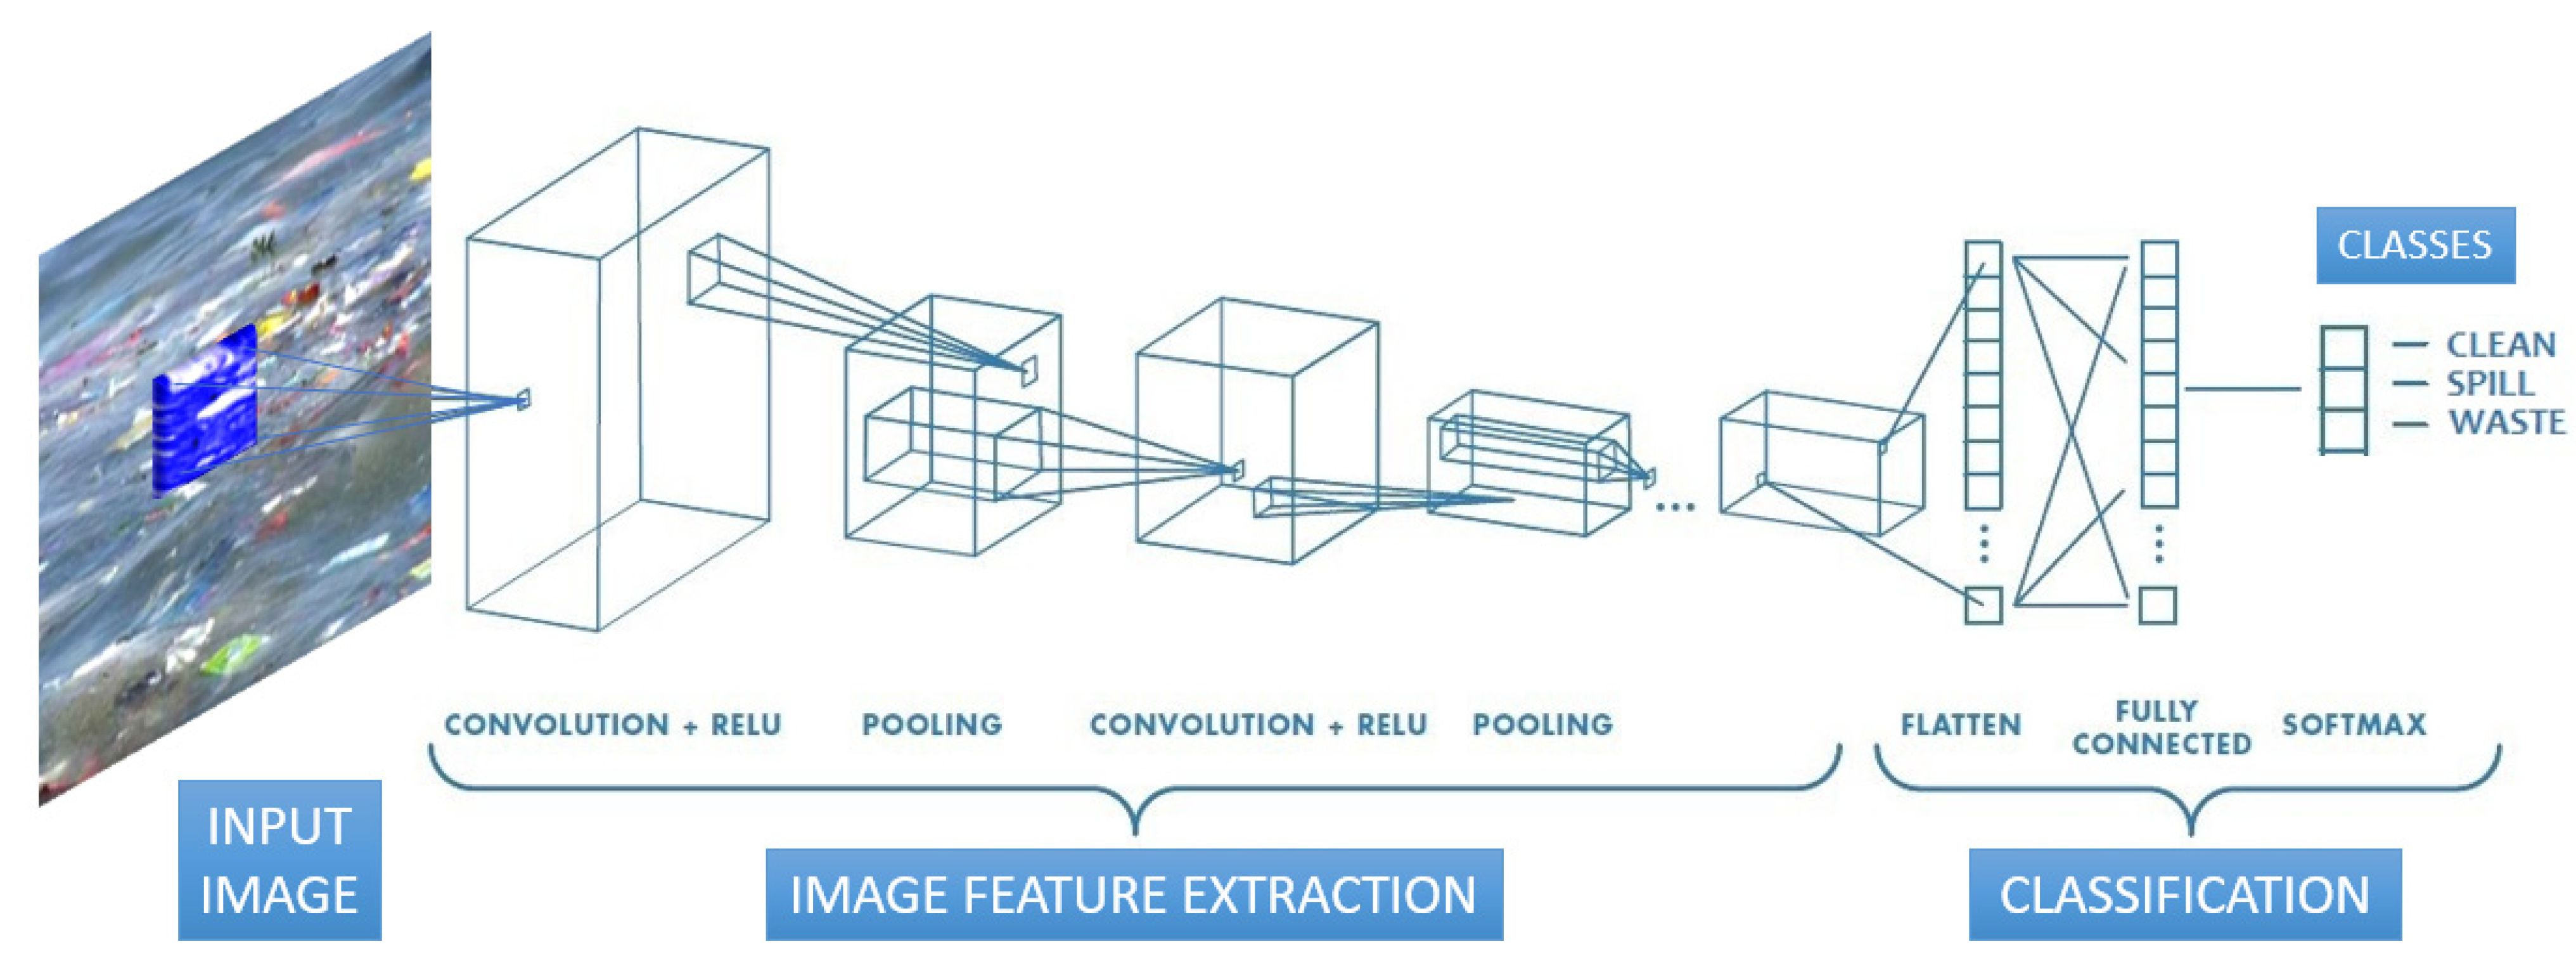
A Convolutional Neural Network (CNN) is a type of artificial neural network most commonly applied to analyze visual imagery because they are shift invariant (or space invariant), meaning that the position of a feature in an image is not important. This is due to the CNN having a shared-weight architecture of the convolution kernels or filters that slide along input features and provide translation equivariant responses known as feature maps.
Figure 3 shows how the CNN architecture works towards generating relevant information from an input image.
The most important computer vision techniques are Image Classification, Object detection, Object tracking, Semantic segmentation and Semantic instance segmentation. Although all these techniques have a potential application in port water quality monitoring, the most appropriate technique according to the input–output information desired is Image Classification. This is due to the fact that the amount of information needed to train the system is lower compared to other techniques, and it allows the classification of images into simple classes that can be used to build temporal and spatial distributions of pollution events [
27].
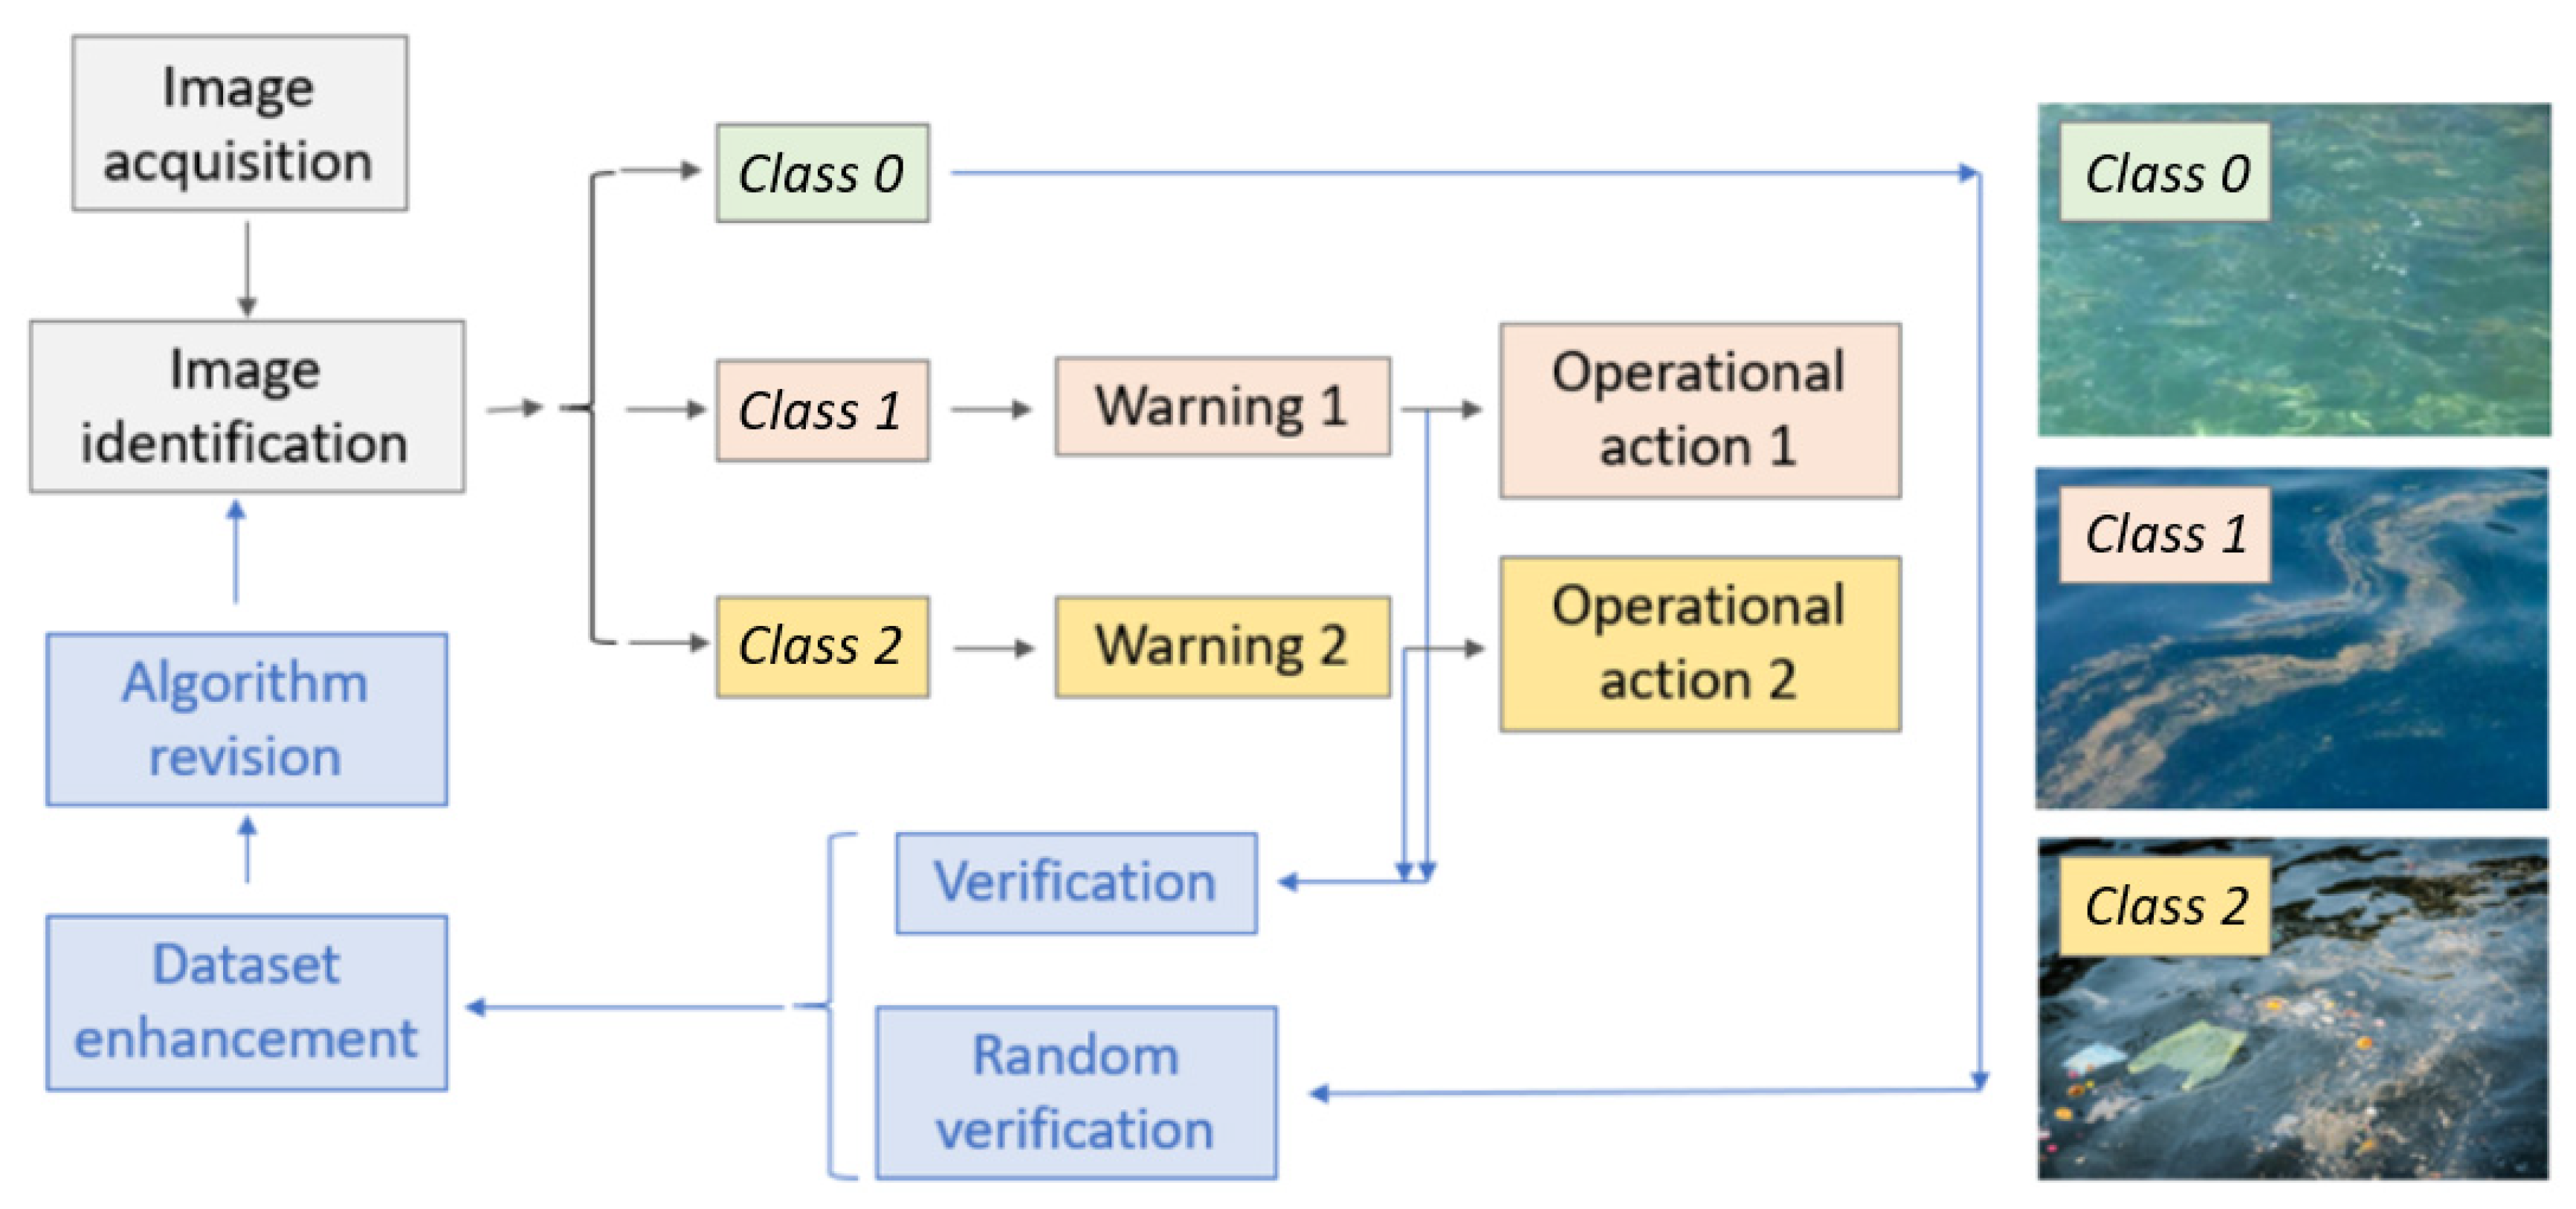
Thus, the aim of this investigation is to evaluate the efficiency of training Image Classification algorithms that, when taking as input the images of port water provided by a camera monitoring system and operating in real-time, provide as output the class to which each image belongs with the highest probability, according to a classification that is relevant for proper environmental management of port water.
2.3. Computer Vision Classes Considered
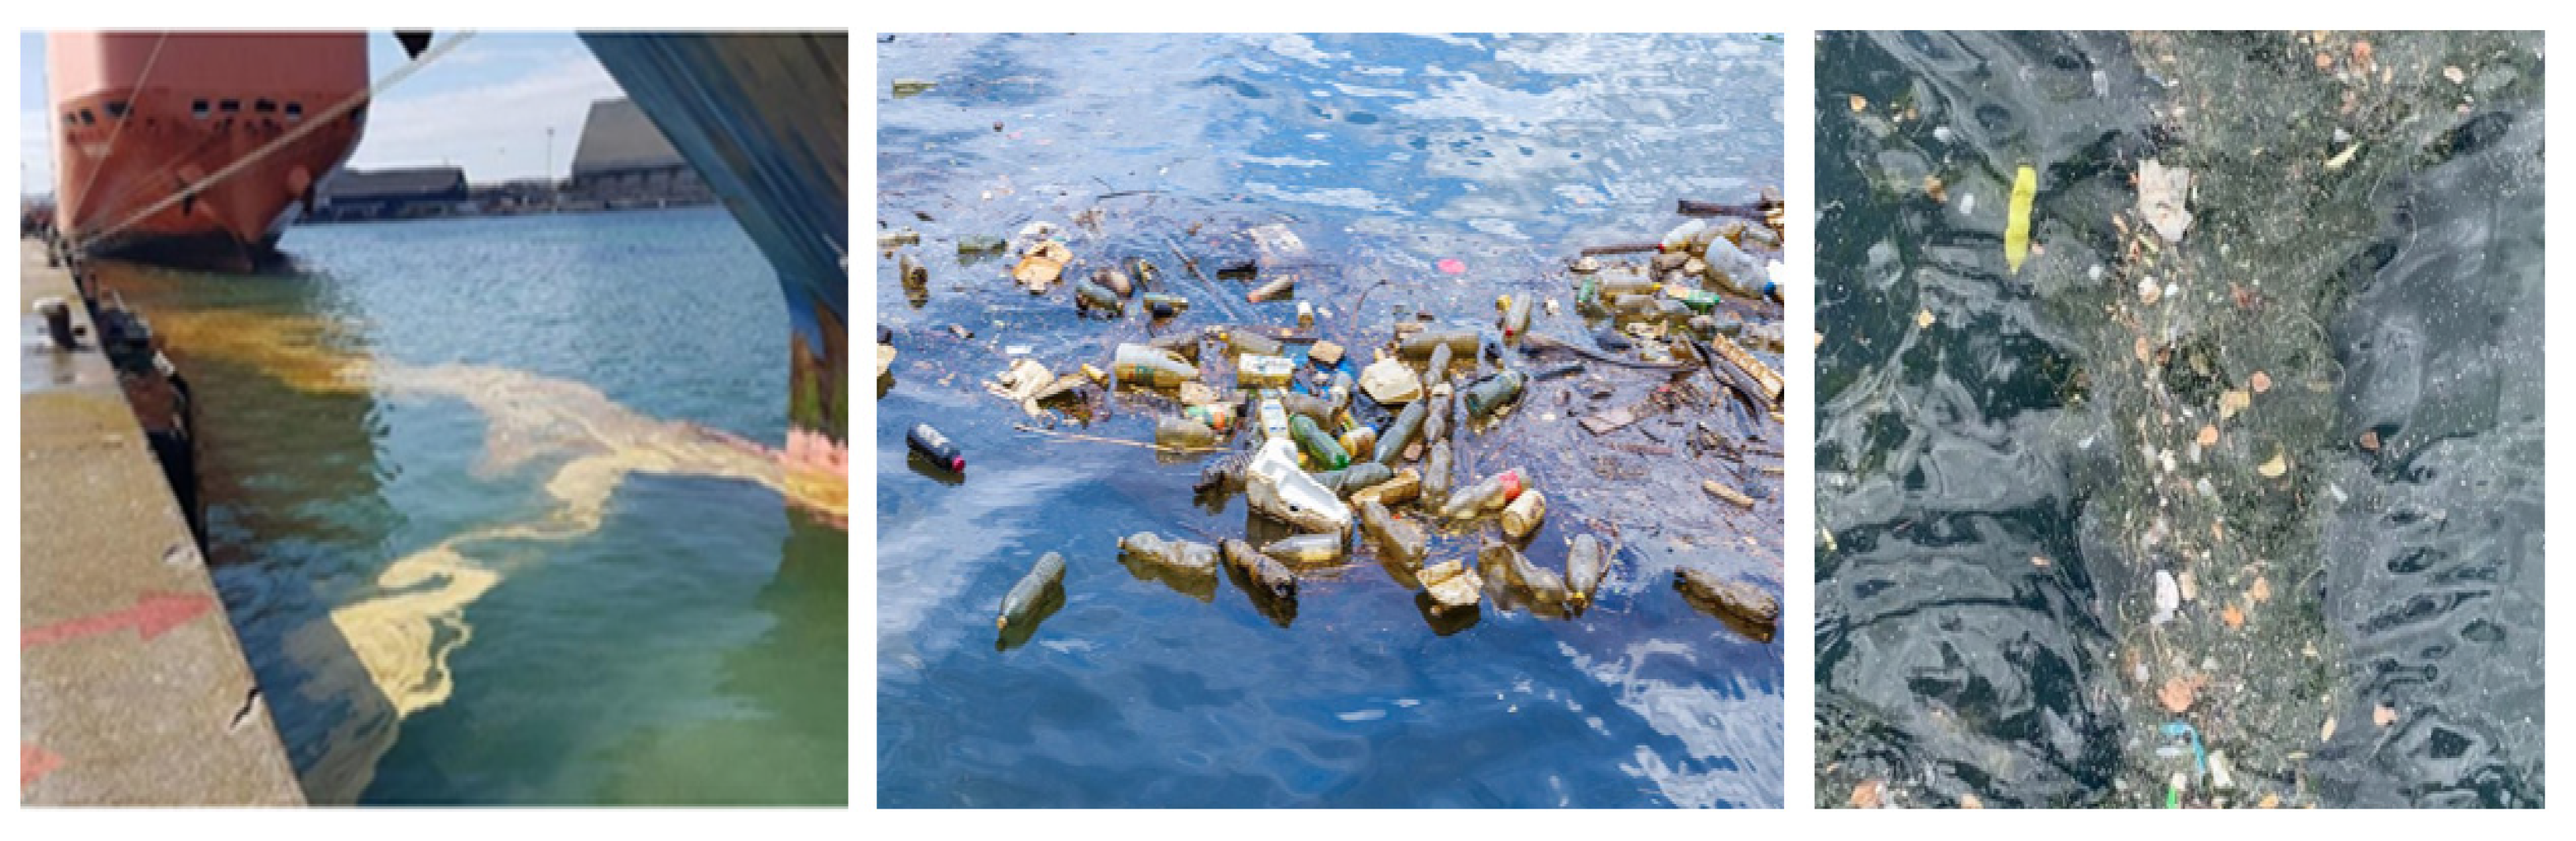
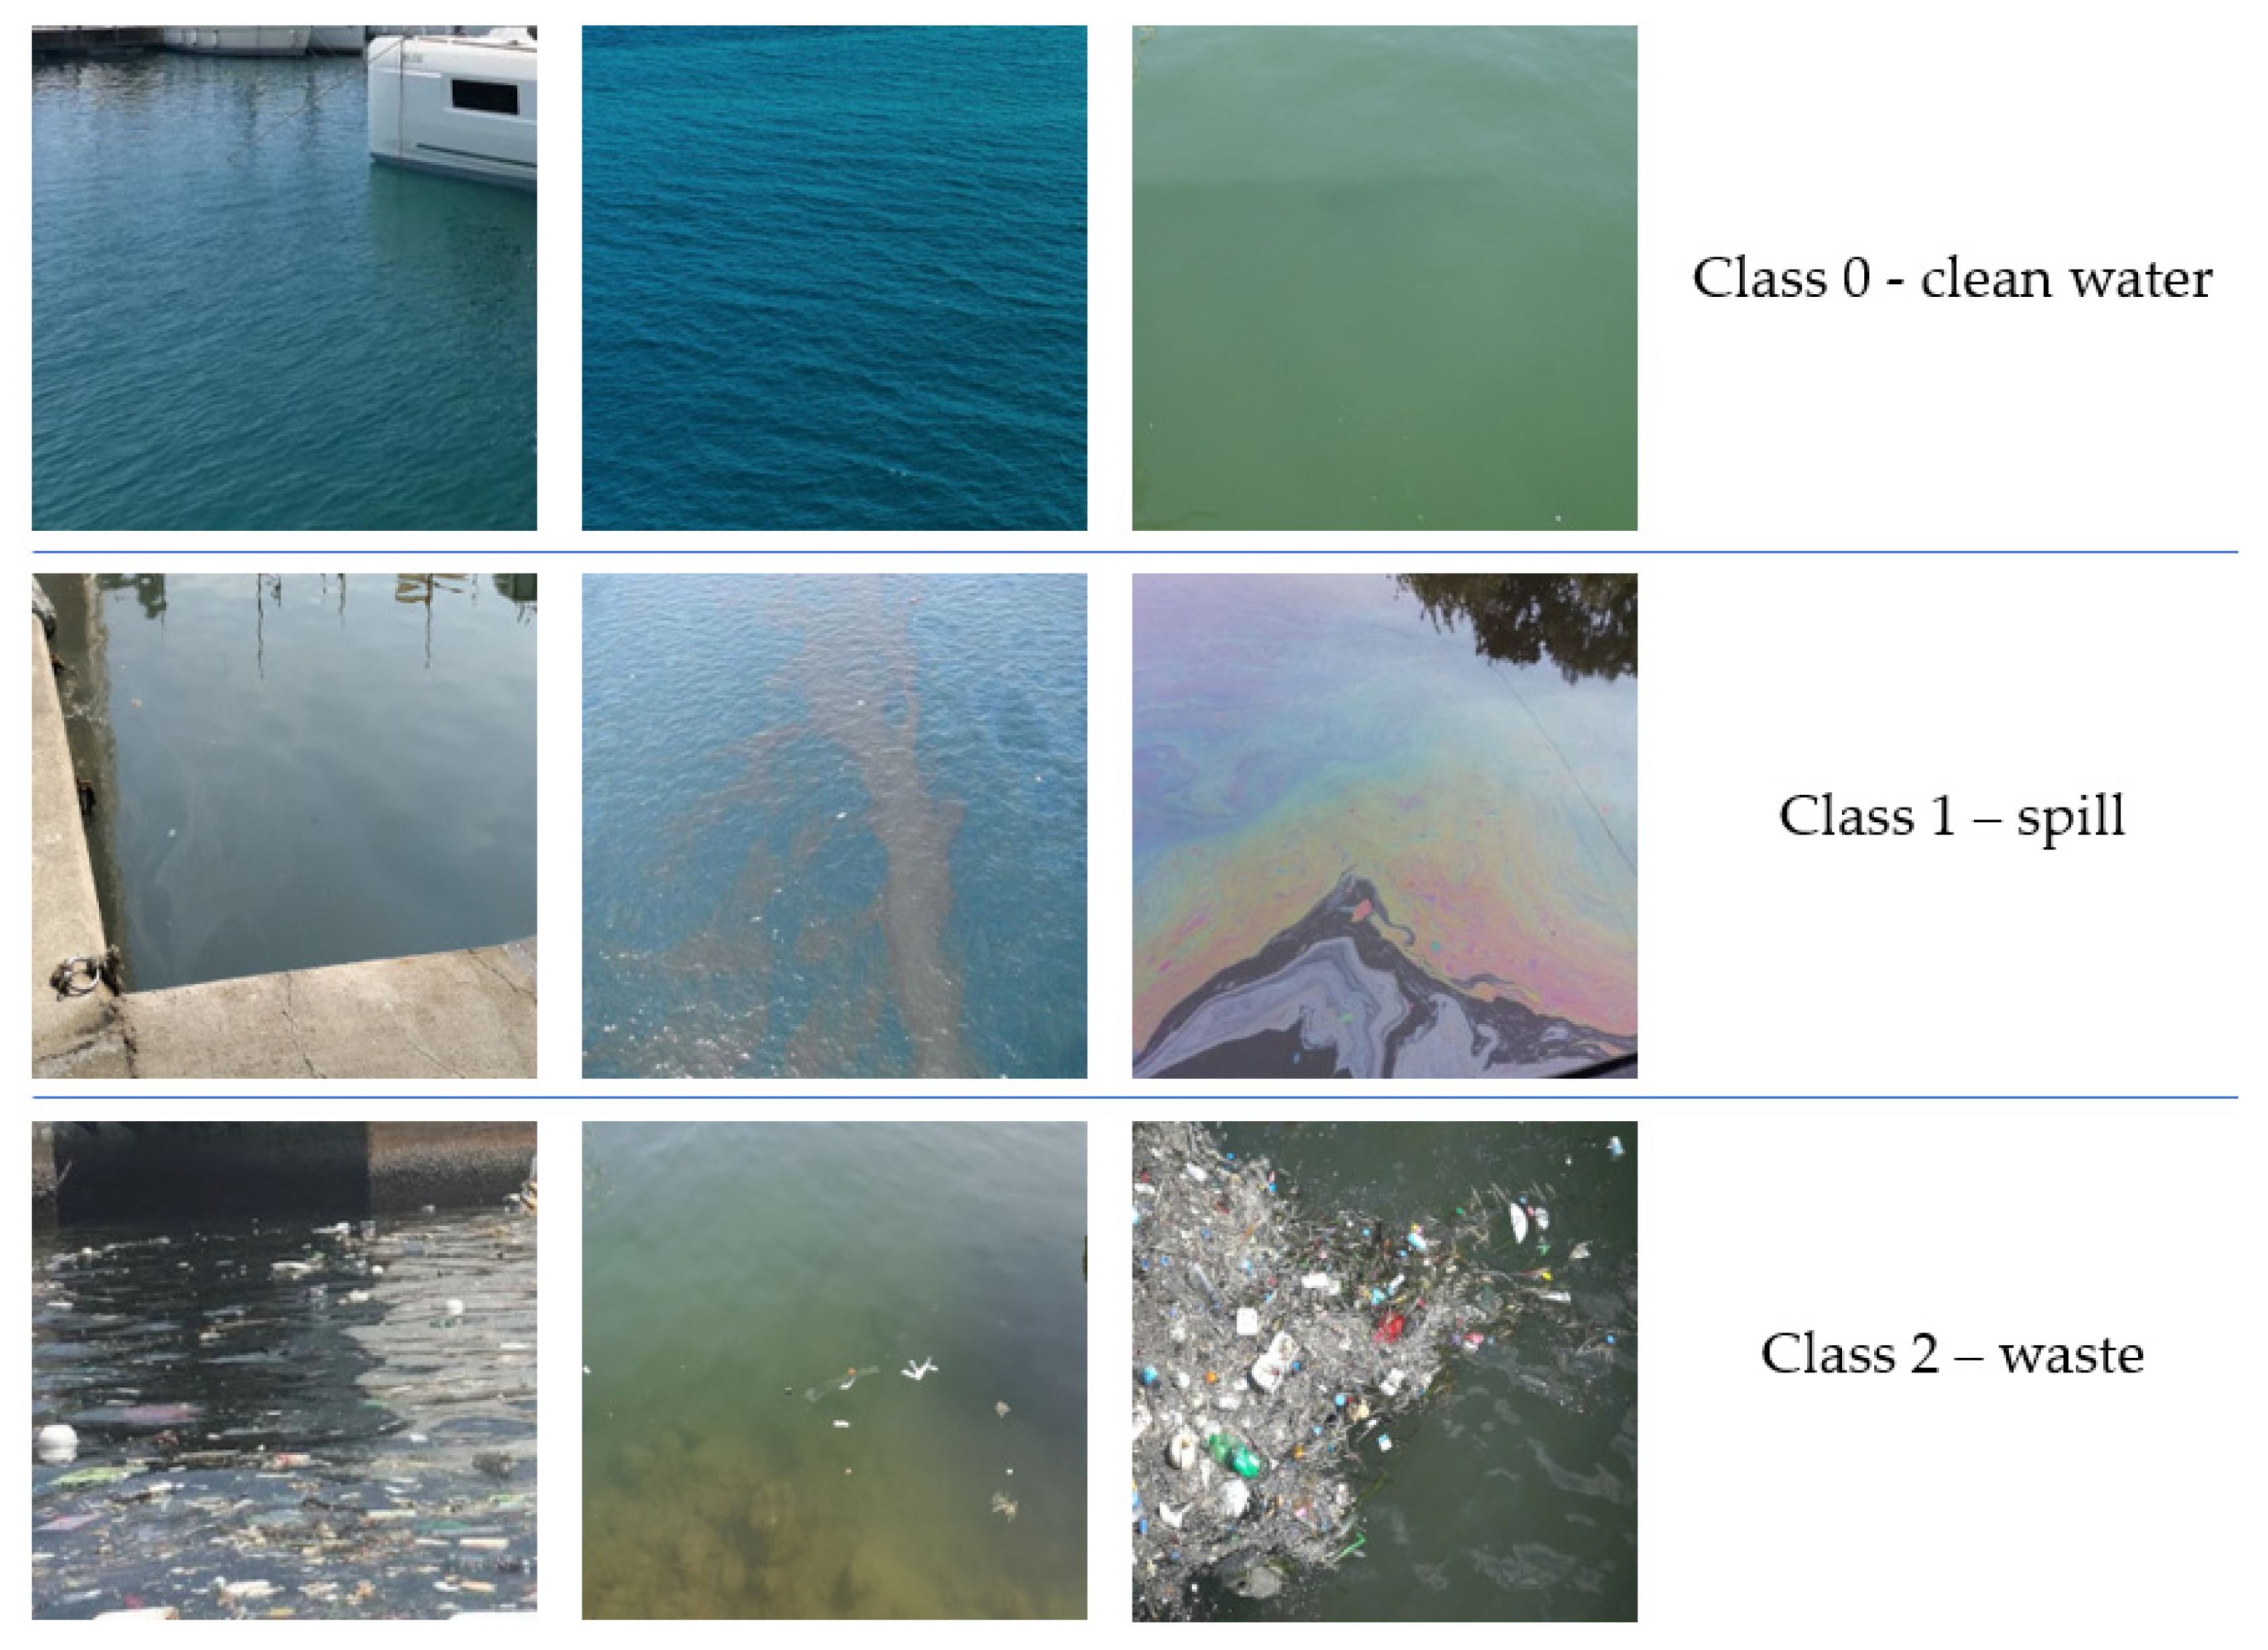
The selection of the clean, spill and waste classes has been carried out after careful consideration of the nature of pollution in ports as well as the level of detail that is useful in port environmental management activities. Specifically, spills in ports have four main origins (although in specific ports or terminals there may be others): users on land, users on boats, discharges of mixed drainage networks and port operations. Considering their physical and chemical nature, there is an enormous variety in waste and contaminants that can reach port waters, including suspended matter, hydrocarbons or eutrophication (not a spill in itself, but a consequence of a nutrient spill) (see
Figure 4). Identification of both the origins and chemical nature of spills could be pursued, but the applicability of such information is very limited; all these contamination events are managed in a similar fashion and thus their identification would not provide any relevant input in port environmental management. In contrast, a type of pollution that follows a different type of action from a port environmental management perspective is floating waste (see
Figure 4). Consequently, for the computer vision system designed, two categories of pollution have been considered, namely spill and waste. The spill class (class 1 in this study) refers to liquids mixing and/or diluting in the water, or to clouds of suspended solids. The waste class refers to large individual solids floating on the water or near the surface (class 2 in this study). Finally, clean water has been labelled as class 0. These three classes provide sufficient information for a port environmental management system to take relevant decisions on time and cost.
The Image Classification technique does not consider the possibility of one image belonging to two or more classes; it simply returns the most likely class. This may constitute a limitation of the method since spill and waste could theoretically appear simultaneously in an image. To overcome this limitation, an additional class should be defined including images with the presence of both (see
Figure 4). However, this situation is very infrequent in ports, and, in fact, it did not occur in any of the images obtained in this investigation. The most common cases in which we could theoretically find spill and waste together are: (i) pollution originating from two or more independent incidents ending up in an accumulation zone due to the hydrodynamic characteristics of the port; or (ii) mixed pollution released by rivers or collector systems that discharge into the port. In the context of the system proposed in this work, the first case is irrelevant because the main objective is to monitor discharge episodes rather than the persistence of discharges within the port. The second case is limited to specific areas and its processing constitutes a particularity that is to be faced in future research. Therefore, although this limitation exists, it does not seem to be an import limitation at this stage due to the infrequency of the combined (i.e., spill and waste) event. The segregated monitoring system proposed represents the reality of most existing ports and thus is easily scalable to other infrastructures.
2.4. Dataset Used
The dataset used in the current study consists of images obtained through manual sampling in several different locations in the Port of Palma. About 3400 images were obtained, of which only 1379 were actually used; 660 were selected as instances of clean water class, 389 of spill class and 330 of waste class. Discarded images were too similar to other images that were used or constituted excess clean water class and spill class images. The number of images obtained in spill and waste classes were the main limitation as actual pollution events are required to happen in the port during the fieldwork visit in order to obtain them.
In this study, different amounts of spill/waste and water images have been used, as detailed in
Section 2.5, in order to investigate the practical applicability of the developed system. The images were gathered using different digital cameras, in 4:3 format and different image resolutions (1 Megapixel and higher). Nevertheless, when using the images for the training and validation of algorithms, they were transformed into square pictures and their resolution was reduced (see
Section 2.5).
Figure 5 shows three images from each class with square shape and reduced resolution.
2.5. Experiments Description: Algorithm Training and Validation
In order to evaluate the feasibility of implementing a computer vision water quality monitoring system in ports, three experiments have been carried out in the present study using a CNN type system. The experiments intend to evaluate the feasibility of a computer vision system in port environmental management and the performance impact of the results on image set size and distribution. The main characteristics of each experiment are shown in
Table 1, including the research objectives.
Keras open-source software library for Python (version: 2.4.3) on Tensorflow Google developed open-source software library (version: 2.3.0) backend framework based on the Anaconda3 platform was used in these experiments. Python 3.8.10 programming language was used for training and validation process programming. The computer used was equipped with an Intel Core i7-6700HQ CPU with 16 GB RAM and a NVIDIA GeForce GTX 960M graphics card. The computer operating system was the 64-bit Windows 10 home edition. In the three experiments, a neural network InceptionV3, with “imagenet” weights and a 3-channel resolution was deployed. InceptionV3 was chosen between Keras available models, after discarding models designed for mobile devices considering the compromise between accuracy and speed according to Keras documentation [
28] and CNN research [
29,
30]. An additional GlobalAveragePooling2D layer was added with 1024 additional neurons with ReLU activation (0.2 dropout), as well as another layer with 3 neurons with softmax activation. The latter layer is the one bearing the spill/waste/clean water class information. In order to feed the neural network, two image generators were used. For the training images, a series of transformations were applied (rotation, horizontal and vertical shifts, crop, zoom and horizontal reflex) including a standard normalization. In addition, data augmentation techniques were used on the image set [
31]. For image validation purposes, only normalization was applied. Data ingestion was carried out in batches of 8 images. The training set images consisted of 80% of the set and the remaining 20% were used for validation purposes. Firstly, a training of additional layers was conducted and subsequently a fine-tuning was simultaneously carried out of both final inception blocks and additional layers. The cost function used was CategoricalCrossentropy (logit) and Adam was deployed as the optimization algorithm (learning rate of 0.001 and 0.00001 was each of the training phases described previously).
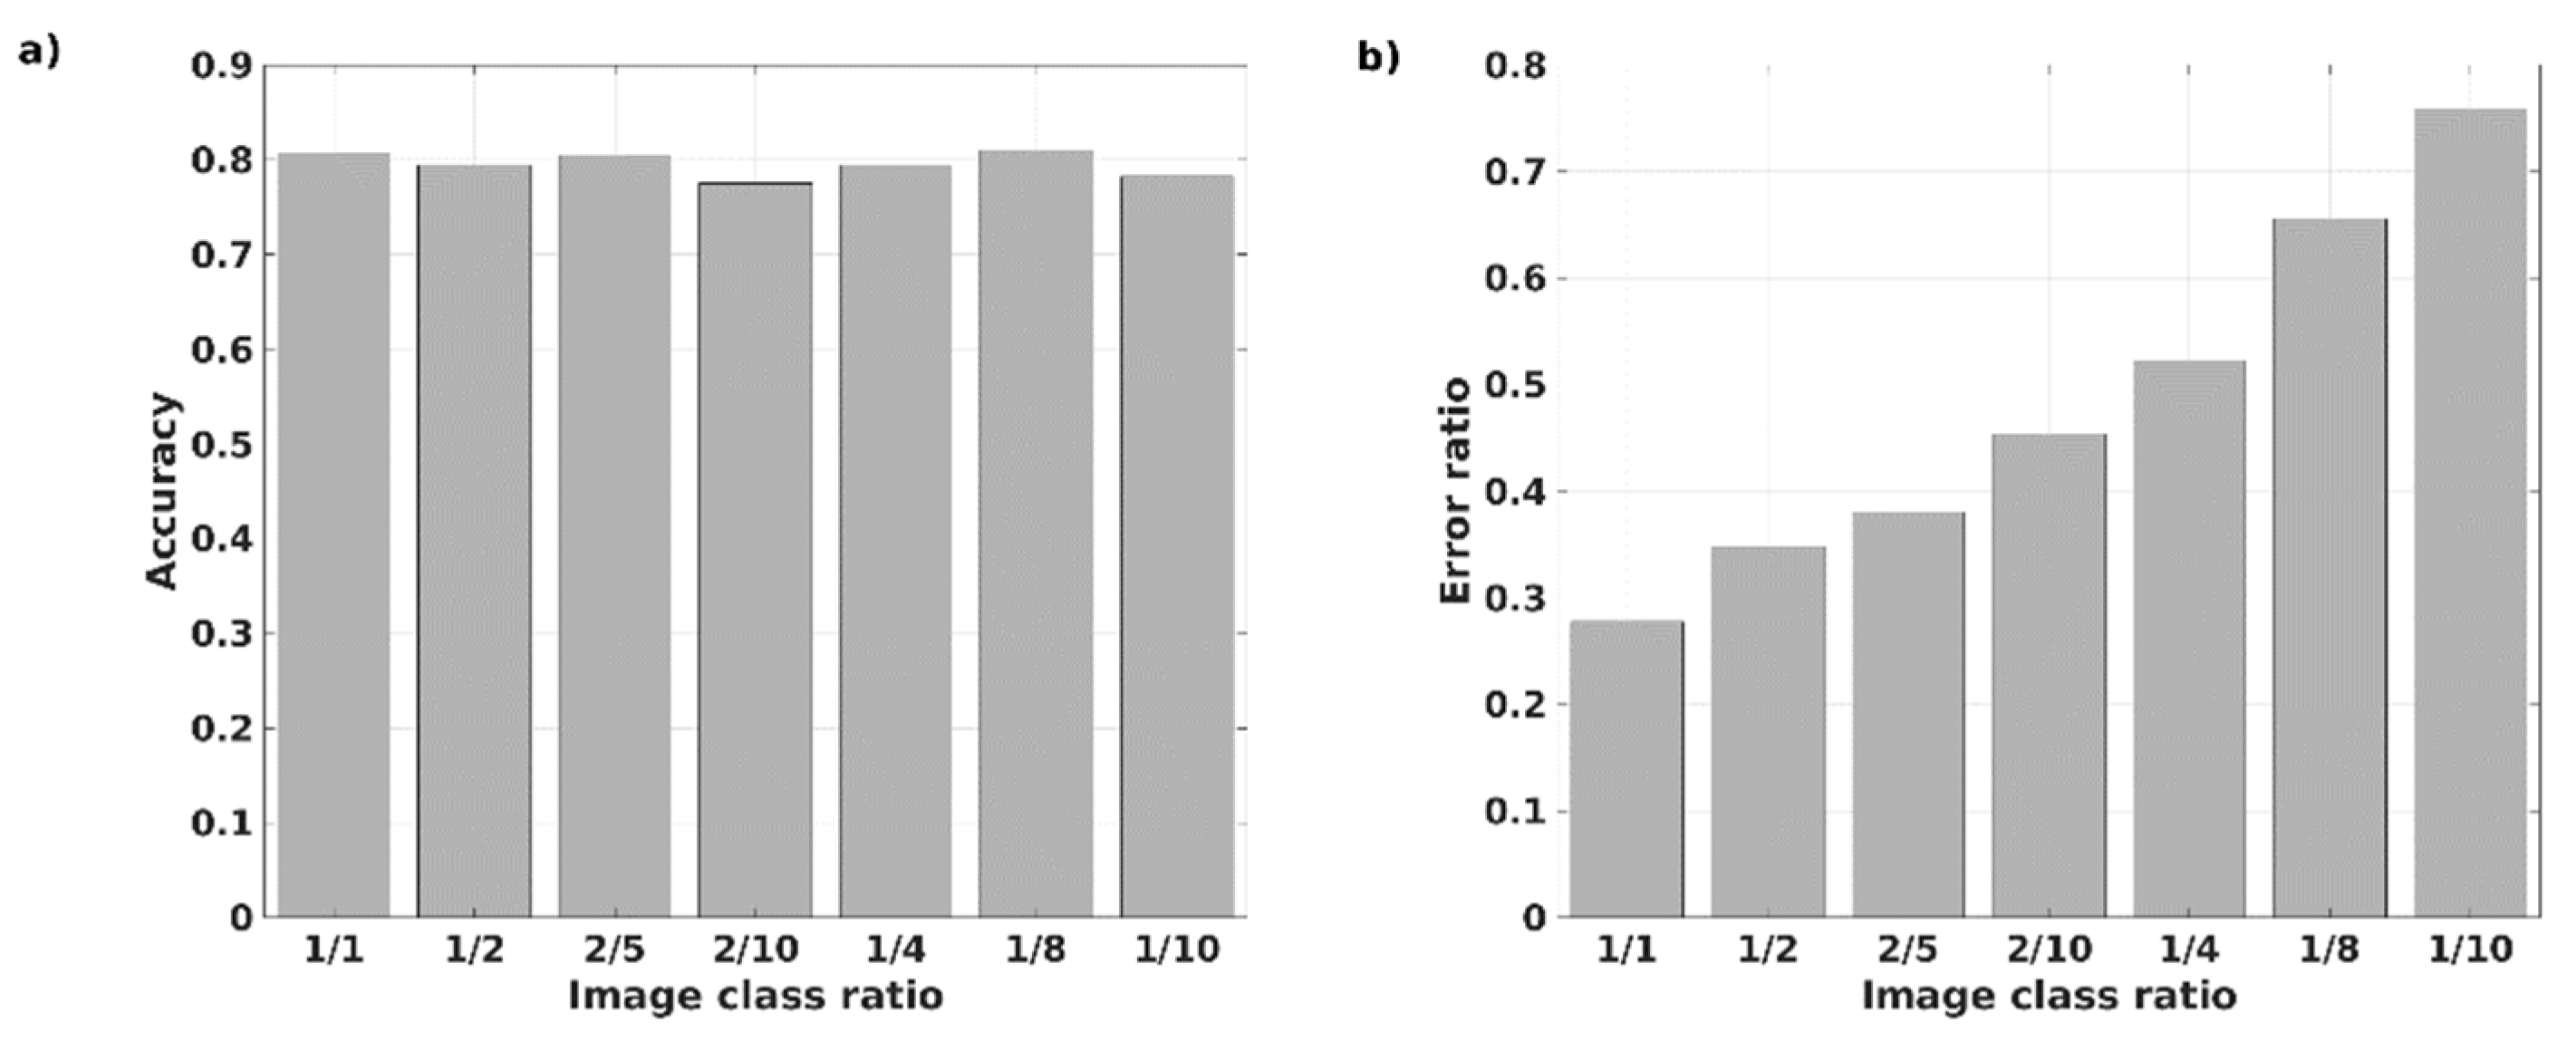
For Experiment 2, 14 algorithms were trained, two for each image set distribution tested. The distributions of images considered in these experiments are the ones shown in
Table 2.
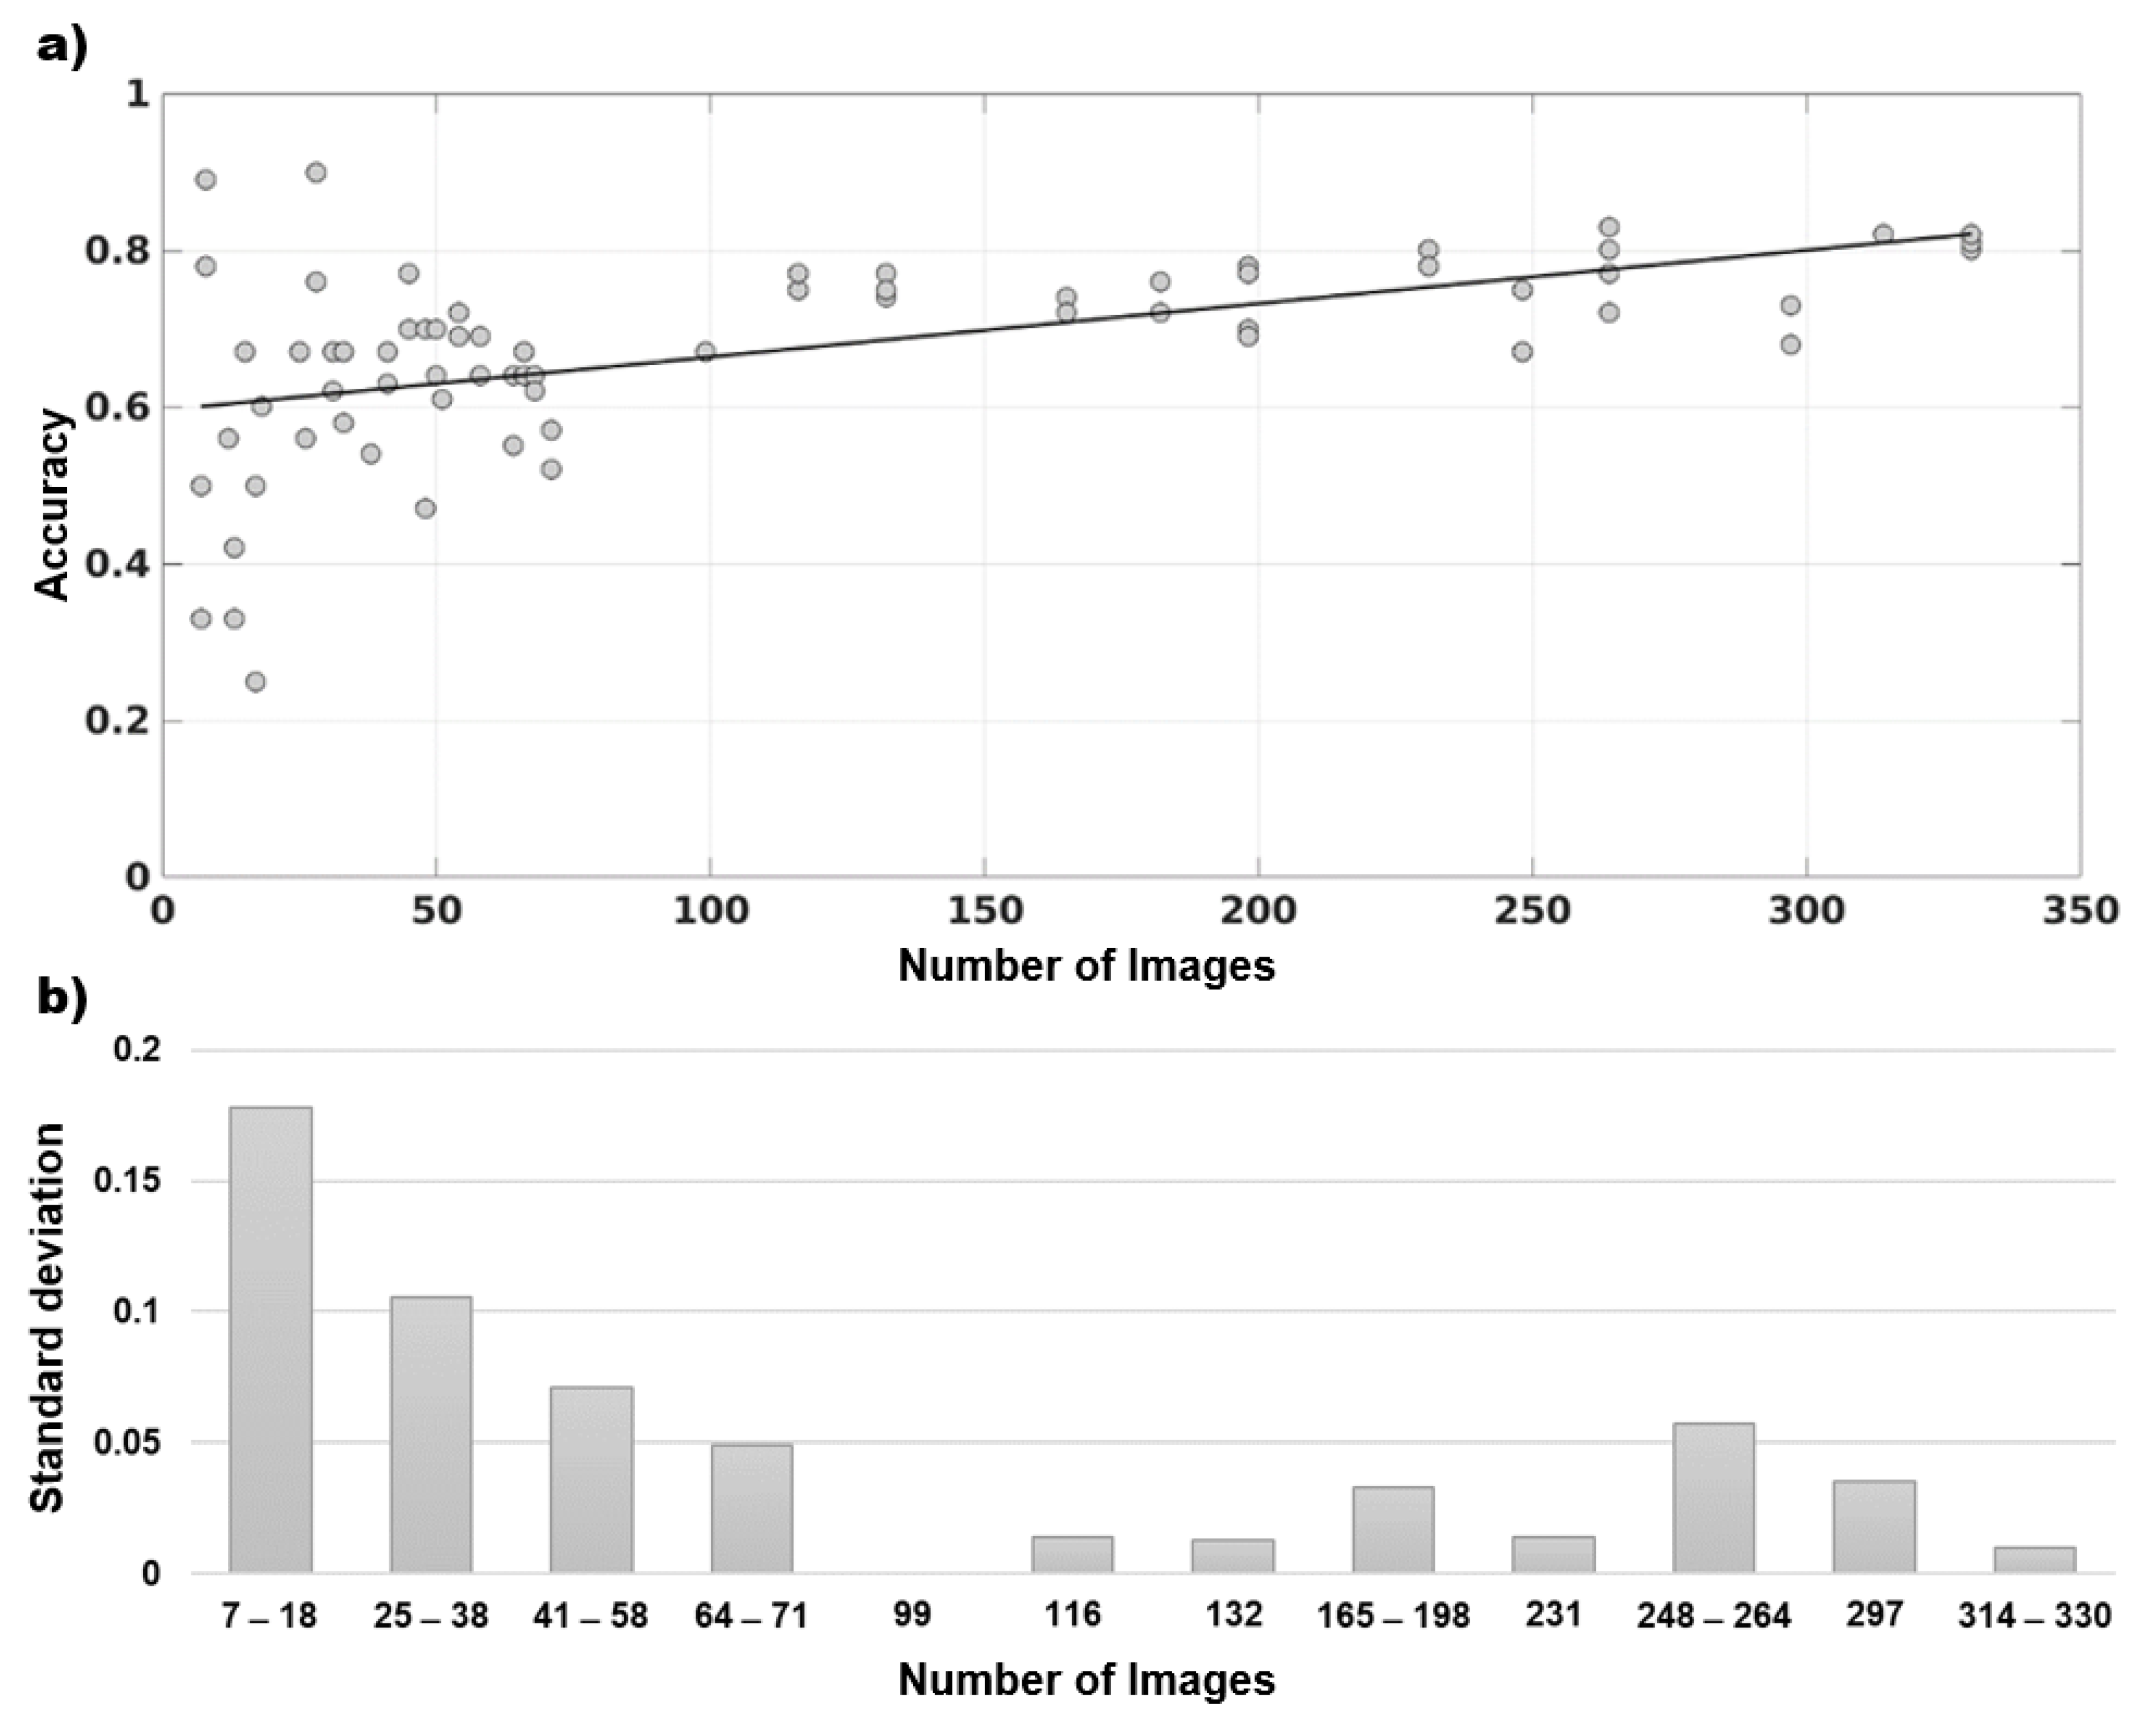
For Experiment 3, 82 trainings based on image sets formed randomly of different sizes (ranging between 18 and 990 total images). Here, one third of the total number of images corresponds to each class.
In experiments 2 and 3, each algorithm training was started from the initial model and not from the previously trained algorithm in order to prevent the propagation of errors or beneficial traits from one algorithm to the next.
2.6. Algorithm Performance Evaluation
Some of the metrics used in this study are the ones commonly reported in the literature and applied investigations when evaluating the performance of computer vision systems (8). These are the following:
Accuracy: Commonly defined as the ratio of true positives and true negatives to all positive and negative observations. That is, how often we can expect the computer vision system to correctly predict an outcome out of the total number of times it made predictions. Mathematically, it is formulated as the ratio of the sum of true positives and true negatives out of all the predictions, namely:
where
TP = true positives;
TN = true negatives;
FN = false negatives; and
FP = false positives.
Precision: It represents the proportion of labels that were correctly predicted to be positive. That is, it is a performance metric that is most useful when trying to control false positives. As well as for Accuracy, Precision is also affected by class distribution; if there are more images for a class that does not happen frequently, precision becomes lower.
Mathematically, it is formulated as the ratio of true positive to the sum of true positives and false positives, namely:
Recall: It represents the system’s capacity to correctly predict the positives from the set of actual positives.
Recall is most useful when identifying positives as critical. Mathematically, it represents the ratio of true positive to the sum of true positives and false negatives.
F1 score: It is obtained as a harmonic mean of the Precision and Recall scores, giving each of them an equal weight. It is often used as a single value that provides high-level information about the model’s output quality and Precision/Recall balance.
Mathematically, it is formulated as a harmonic mean of the
Precision and
Recall scores.
In the case of experiment 1, where the objective is to validate the algorithm generated for its application in port environmental management, the prior metrics are relevant and sufficient. However, in experiment 2, as well as in realistic system application, we would need an additional index that evaluates the performance of the system as an alternative to the common
Accuracy metric. This is due to the fact that the
Accuracy metric is not the most reliable in computer vision models trained on datasets where one event (in this case clean water) is much more frequent than the rest of the events (in this case spill or waste). In this case,
Accuracy will mostly determine that clean water is detected correctly most of the time but will not provide decisive information on the spill and waste detection performance. As the latter are the actual events (alarms) to be detected by a computer vision system applied in a port setting,
Accuracy is not a parameter that becomes useful in the present study or in real-life applications of the system.
Precision,
Recall and
F1-
Score indexes are also not suitable for experiment 2 because they are class specific and for comparison purposes an all-class synthetic index is needed. Consequently, a novel index has been defined for the purpose of this application (as well as others that might face similar issues as the one presented): the
Error index. This index is defined as the ratio of the sum of errors made in providing warnings (either false alarms or alarms that are incorrectly not provided) to the sum of total alarms provided by the system. Adapting for the current application with three classes (i.e., 1, 2 and 3), the
Error index is defined as:
where
TPi = true positives for class,
i;
TNi = true negatives for class,
i;
FNi = false negatives for class
i and
FPi = false positives.
The definition corresponds to a parameter that is more meaningful than Accuracy for port water quality monitoring applications, as it eliminates the issue of the unequal distribution of images during the application of the system. However, two limitations have been detected: (i) Error index is not a normalized parameter and (ii) it overestimates the errors made overall by the system because it eliminates a set of prediction successes. Nevertheless, it is a conservative and meaningful index useful for port managers because of its comprehensiveness.


 ,
, 


