1. Introduction
Technological advances in the field of aerospace have led to the excessive use of UAVs (drones) in a wide range of domains. UAVs are able to operate manually, autonomously [
1], or semi-autonomously [
2], alone or in a swarm, providing a high degree of flexibility in the assigned mission. The market for UAVs has been steadily growing [
3], from the delivery of goods/services and precision agriculture to surveillance and military operations. The effective modeling and analysis of UAVs’ trajectories enable decision makers to acquire meaningful and enriched information/knowledge about the current situation in the field of operations, eventually supporting tool-based automated or semi-automated simulations for making predictions of high-level critical events.
A semantic trajectory of a swarm of drones [
4] is a synthesis of semantic trajectories [
5] of multiple units moving (flying) in a specified formation, sharing common origin–destination points, having a common mission, enriched with semantic annotations at different levels of detail, and having one or more complementary segmentations, where each segmentation consists of a list of annotated episodes.
A drone’s trajectory is a sequence of points (traces) that specify the position of the moving entity in space and time. A segment is a part of the trajectory that contains a list of episodes. Each episode has a starting and ending timestamp, a segmentation criterion (annotation type), and an episode annotation. For example, an annotation type can be the “weather conditions”, and an episode annotation can be “a storm”, “heavy rain”, “extremely high waves”, etc.
The utilization of drones in the cultural heritage and archaeology domain has increased and plays an increasingly important role [
6,
7], since drones allow for an easy, quick, and low-cost solution for documentation by collecting aerial images and videos at different levels of altitude and angles. This is highly important, especially concerning the mapping, documentation, and detection of subsurface archeological sites [
8,
9,
10,
11]. The effectiveness of UAV operations requires an efficient representation of their movement data, along with additional information about the context of the mission [
5]. A semantic trajectory of a swarm of drones requires the recording of raw movement data, such as the latitude, longitude, and timestamp collected from each unit, along with external heterogenous data, such as mission details, points/regions of interest (POIs/ROIs), and weather data. However, unpredicted events (e.g., unit malfunction, weather conditions, security violations) and known operational restrictions of drones can cause incorrect, invalid, or even missing movement data. Thus, there is a real need for the reconstruction of trajectories using other data recorded during a mission. In the present work, the utilization of geo-tagged photos taken by drones’ carrying documentation equipment during their flights (or obtained from other sources) is proposed, since these provide exploitable metadata for the process of trajectory reconstruction.
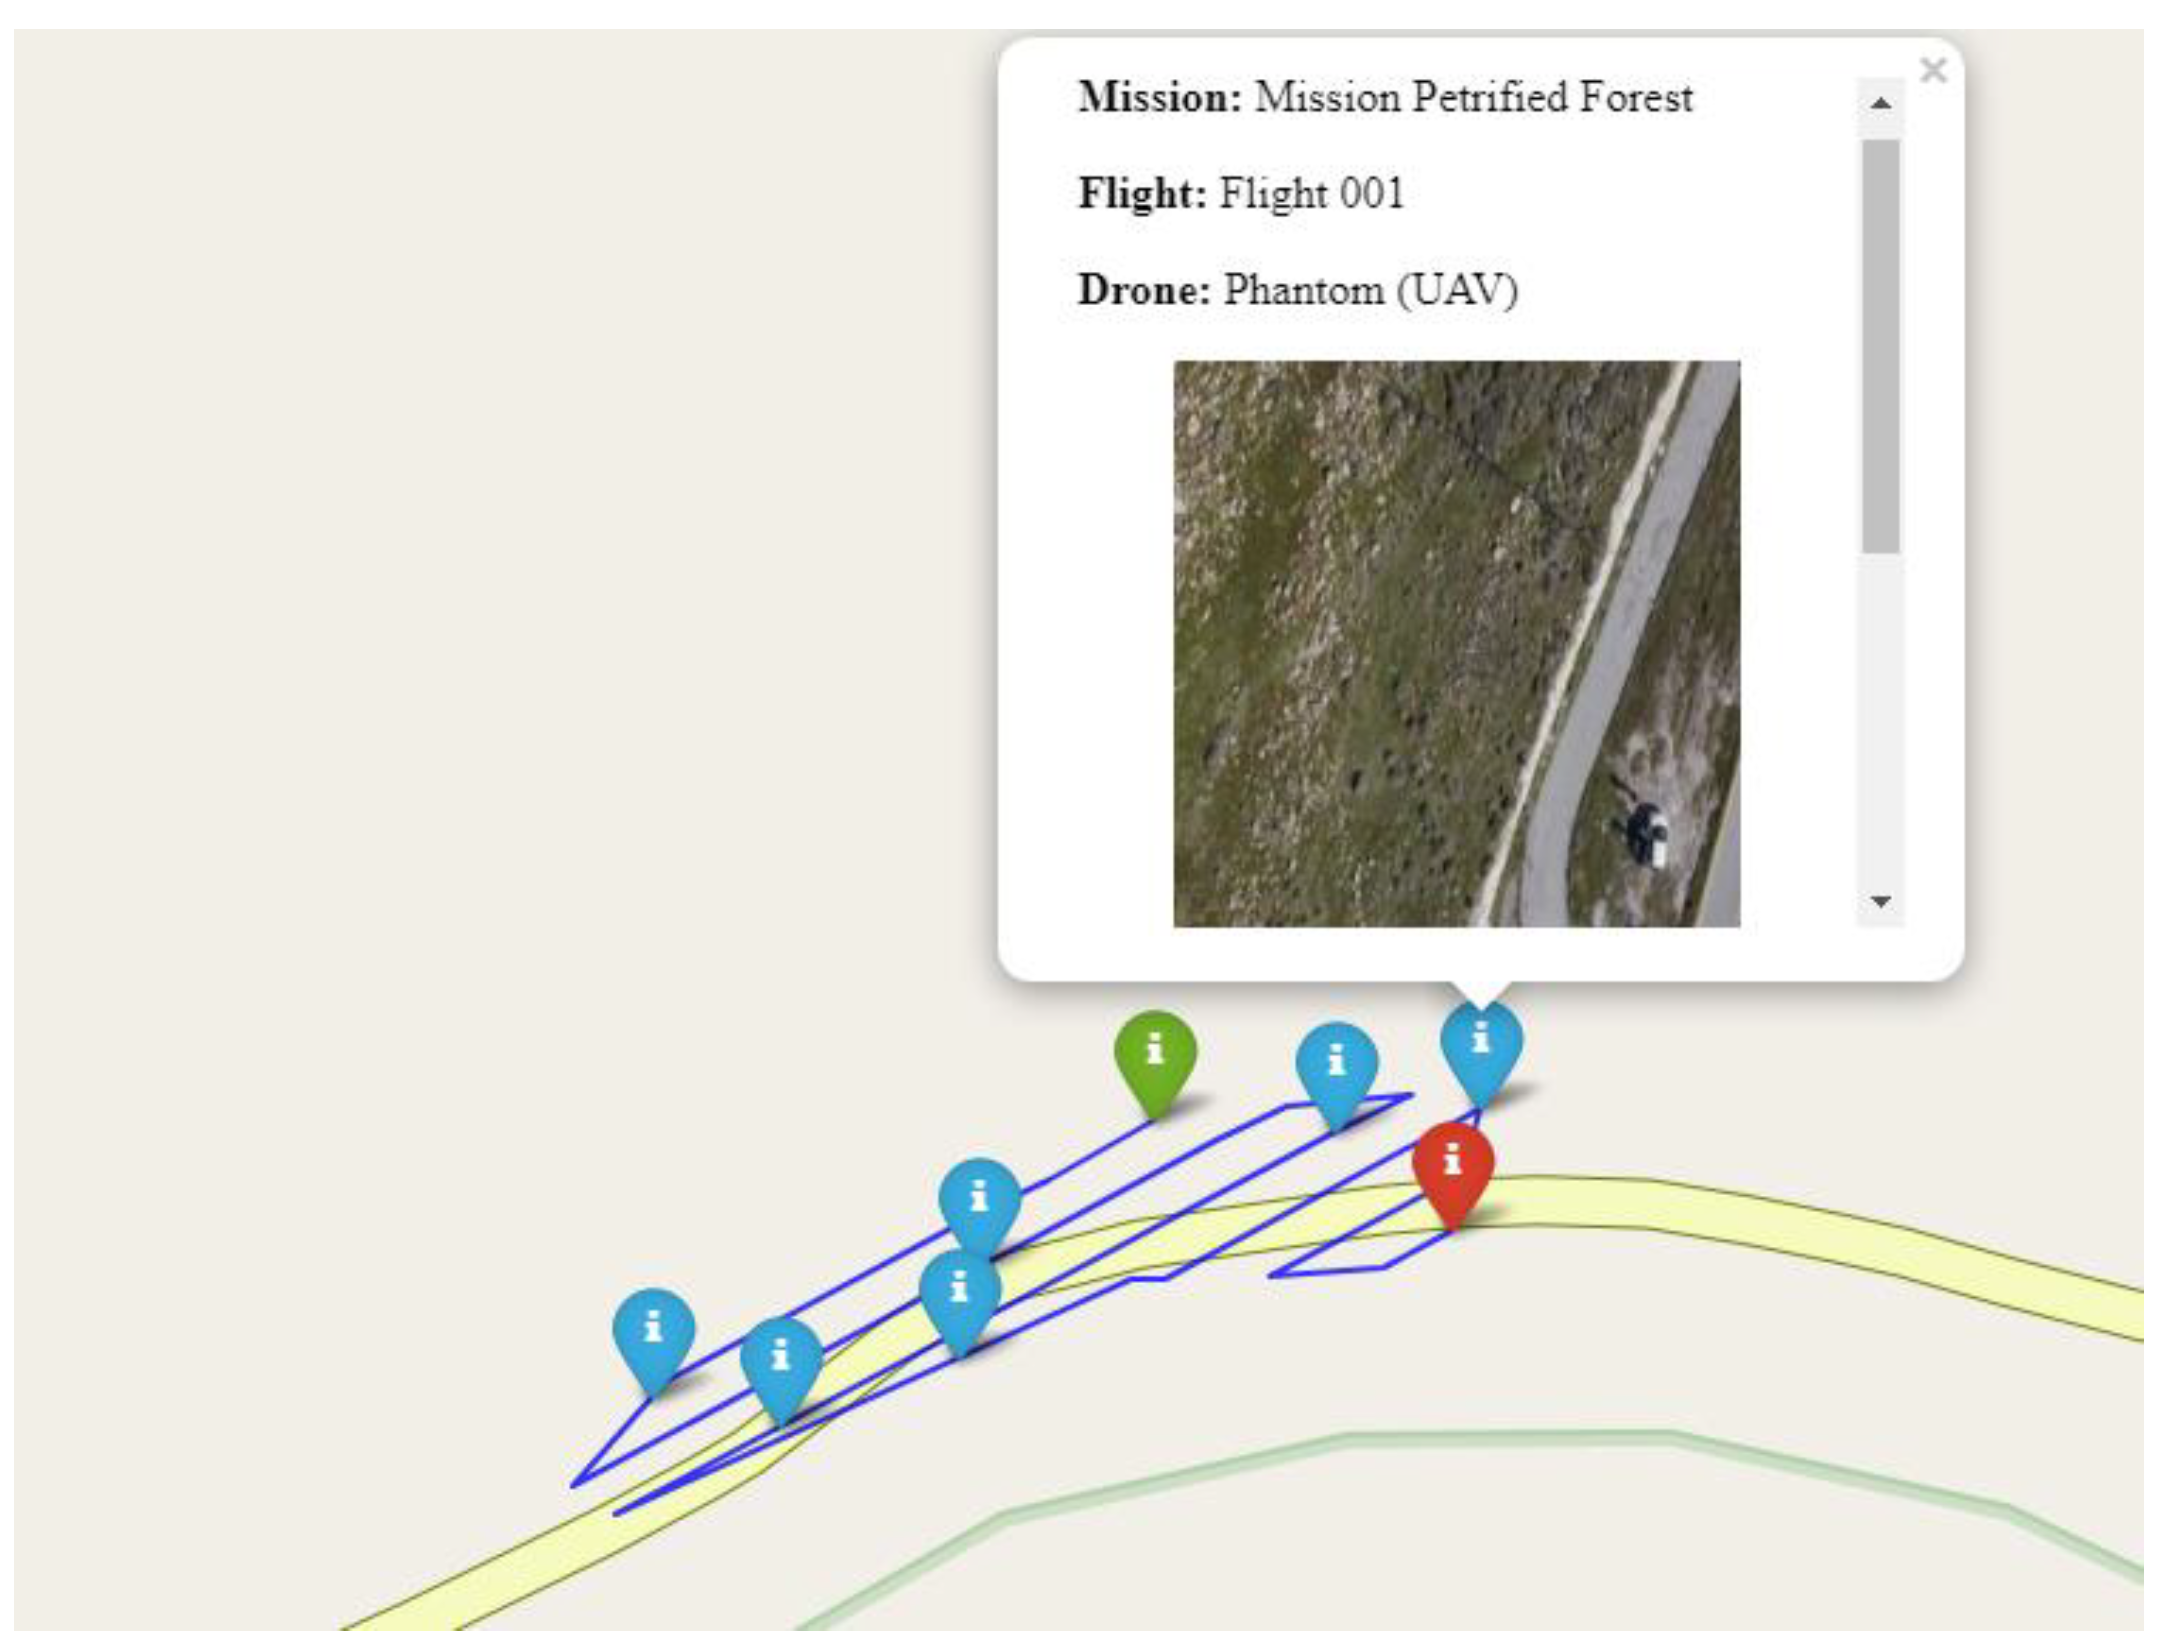
For instance, in a potential scenario, a group of archeologists and geologists are interested in taking aerial photos of a petrified forest to document and obtain an initial mapping about the morphology of a geopark. Because the forest extends over a large and steep area, they decide to use a properly equipped drone to take photos of the landscape. The research team plan and upload the mission path in the drone’s pilot software. Following the predefined path, the drone approaches the area of interest, taking photos during the planned mission (
Figure 1). After landing, the research team analyzes the mission’s photos and pilot data to acquire the trajectory followed by the drone, to validate the initial (planned) path. These data, along with data regarding weather conditions (ground temperature, humidity, etc.) from nearby weather stations, are necessary for the research team tο obtain a general view of the area of interest. The team realizes that the pilot data for a specific part of the flight are missing due to a unit malfunction. Thus, it is not possible to reconstruct the whole trajectory of the drone to cross-validate flight details, nor to create its semantic trajectory to acquire a more comprehensive view about the area of interest and its context.
The evolution of systems for the real-time processing of UAV data for wireless networking and other related technologies, such as GPS and high-resolution cameras, allows for the constant and remote sharing of the movement of swarms of UAVs. These raw spatiotemporal data are the basis for the construction of UAVs’ trajectories. However, analyses of these trajectories often produce poor and restricted results. To achieve a more efficient analysis of trajectories, contextual information e.g., on the environment, weather, and mission details, are required [
12]. Most times, such data are heterogeneous, gathered from disparate sources, making their semantic enrichment and integration a difficult task. Ontologies have been adopted in various domains, offering a powerful tool for the semantic representation and integration of data, reducing the structural and semantic heterogeneity among the various data sources, specifying semantics in a clear, explicit, and formal way [
13].
The aim of this paper is to present our latest efforts (a) to implement an ontology-based, tool-supported framework for the reconstruction of drones’ trajectories using geo-tagged photos; (b) to enrich the reconstructed trajectories with external data; (c) to semantically annotate the enriched trajectories using an ontological approach; and (d) to utilize semantic queries in SPARQL to support simple analytics tasks. The goal is to implement the above modules as extensions on the well-known and widely used MovingPandas platform, delivering a novel framework, namely, the ReconTraj4Drones framework. We have evaluated the implemented solution using real datasets (photosets) collected during cultural heritage documentation missions, as well as open datasets.
ReconTraj4Drones is currently the only free and open-source trajectory management tool that supports (a) trajectory reconstruction using geo-tagged photos and (b) the annotation and analytics of the reconstructed and semantically enriched trajectories. By reviewing related works, it is concluded that these emphasize the trajectory reconstruction process based on (i) photos found in sources such as Flickr, (ii) videos, and (iii) users’ posts on social media. These approaches do not provide a freely available and open-source tool for testing and evaluation. In this paper, we compare ReconTraj4Drones with two related tools, and we evaluate its performance against several criteria using four different datasets.
This paper is an extension of our recently published work [
4]. This extension (more than 50%) mainly concerns (a) the implementation of the proposed framework, namely, ReconTraj4Drones, as an extension of the MovingPandas platform and (b) an evaluation of the implemented framework by conducting experiments with real datasets (inhouse and open ones).
The structure of the paper is as follows.
Section 2 presents related work regarding semantic trajectories, trajectory reconstruction from geo-tagged photos, and trajectory analytics and visualization tools.
Section 3 presents the implemented framework that extends the functionality of MovingPandas.
Section 4 presents the datasets used for the evaluation of our solution and the produced results.
Section 5 critically discusses related work and the developed solutions, comparing these based on specific requirements, the present experimental results, and future work. Finally,
Section 6 concludes the paper.
2. Related Work
Santipantakis et al. [
14] proposed the datAcron ontology to represent semantic trajectories at varying levels of spatiotemporal analysis and to demonstrate the procedure of data transformation via enhanced queries in SPARQL to support analytics tasks. Mobility analytics tasks are based on the volume and variety of data/information sources that need to be integrated. The proposed ontology, as a generic conceptual framework, tackles this challenging problem. The experimental results (
http://www.datacron-project.eu/, accessed 27 December 2022) in the domain of Air Traffic Management (ATM) demonstrate that the proposed ontology supports the representation of trajectories at multiple and interlinked levels of analysis.
Cai et al. [
15] focused on extracting semantic trajectory patterns from geo-tagged data. They proposed a semantic trajectory pattern mining the framework from geo-tagged data taken from social media to create raw geographic trajectories. These raw trajectories are enriched with contextual/semantic annotations, using a ROI as stop to illustrate places of interest. The authors further enriched these places with multiple semantic annotations. Thus, each semantic trajectory is a sequence of ROIs with a set of multiple additional semantics. The algorithm returns basic and multi-dimensional semantic trajectory patterns.
To successfully carry out a mission, high-precision tracking of a drone’s trajectory is vital. Even if a quadrotor drone has great advantages, such as a lightweight structure, vertical takeoff, and landing capability, etc., it is also vulnerable to disturbance factors, such as aerodynamic effects, gyroscopic moments, wind gusts, etc. Thus, the implementation of an efficient controller for a quadrotor UAV is a challenging task. Towards this end, various approaches have been developed based on observer techniques [
16], sliding mode control (SMC) [
17,
18], neural networks (NN) [
19], etc. However, these approaches are beyond the scope of this paper.
Concerning trajectory analytics and visualization tools, Grasier proposed a general-purpose Python library for the analysis and visualization of trajectory data called MovingPandas [
20]. The proposed library composes a combination of Pandas [
21] and GeoPandas [
22]. In MovingPandas, the trajectory is the core object, which is modeled as a time-ordered series of geometries, stored as GeoDataFrame, and integrated with coordinate reference system information. Depending on the domain and the purpose of the analysis, a trajectory object in MovingPandas can represent its data either as point-based or as line-based. Meanwhile, the analysis process and the visualization are executed in two-dimensional space. The proposed library can be used as a stand-alone Python script, as well as within the desktop GIS application QGIS as a plugin called Trajetools.
Reyes et al. [
23] proposed a software library called Yupi. The main goals of the proposed library were (a) to be abstract enough to be used across several domains and (b) to be simple enough for research with limited programming or computer vision knowledge. Yupi’s modules contain special tools that allow for the creation of trajectories from video sources, artificial trajectory creation, visualization, and the statistical analysis of trajectories. To provide compatibility between the existing tools, the proposed software enables a two-way data convention among Yupi and third-party software through the Yupiwrap package. The authors validated their software and reproduced the results in selected research papers (with a few lines of code), demonstrating the effectiveness of the proposed software.
Pappalardo et al. [
24] proposed a Python library called scikit-mobility to provide a unified environment for the generation, analysis, visualization, and privacy risk assessment of human mobility data. Even if the proposed library is oriented to human mobility analysis, its features can be applied to other types of mobility data. Scikit-mobility extends Pandas’ library of Python for data analysis. There are two main data structures: the TrajDataFrame and FlowDataFrame, for the representation of trajectories and flows, respectively. A flow is the objects’ aggregated movements between a set of locations. Both structures inherit the functionality from the DataFrame structure of Pandas, allowing for compatibility with other Python libraries and machine learning tools. The proposed library is characterized for its efficiency and ease of use.
The presented related work (tools) is discussed and compared to our presented approach in
Section 4.
3. Materials and Methods
3.1. Framework and System Architecture
In the previous sections, the importance of UAV trajectory reconstruction using geo-tagged photos taken during missions (flights) was discussed. To the best of our knowledge, a free and open-source framework that implements the reconstruction, semantic modeling, and enrichment of UAV trajectories does not exist. To fill this gap, we have extended the functionality of MovingPandas, a free, open-source, and widely used trajectory analytics and visualization tool, developing a new framework called ReconTraj4Drones. Our framework extends MovingPandas with additional modules regarding trajectory reconstruction using geo-tagged photos, trajectory enrichment with weather and POI data, trajectory segmentation based on specific criteria (altitude variations, time intervals, distance), trajectory interactive visualization using OpenStreetMap, trajectory semantic annotation using our Onto4drone ontology (
https://github.com/KotisK/onto4drone, accessed on 30 December 2022), and finally, trajectory semantic analytics using SPARQL queries.
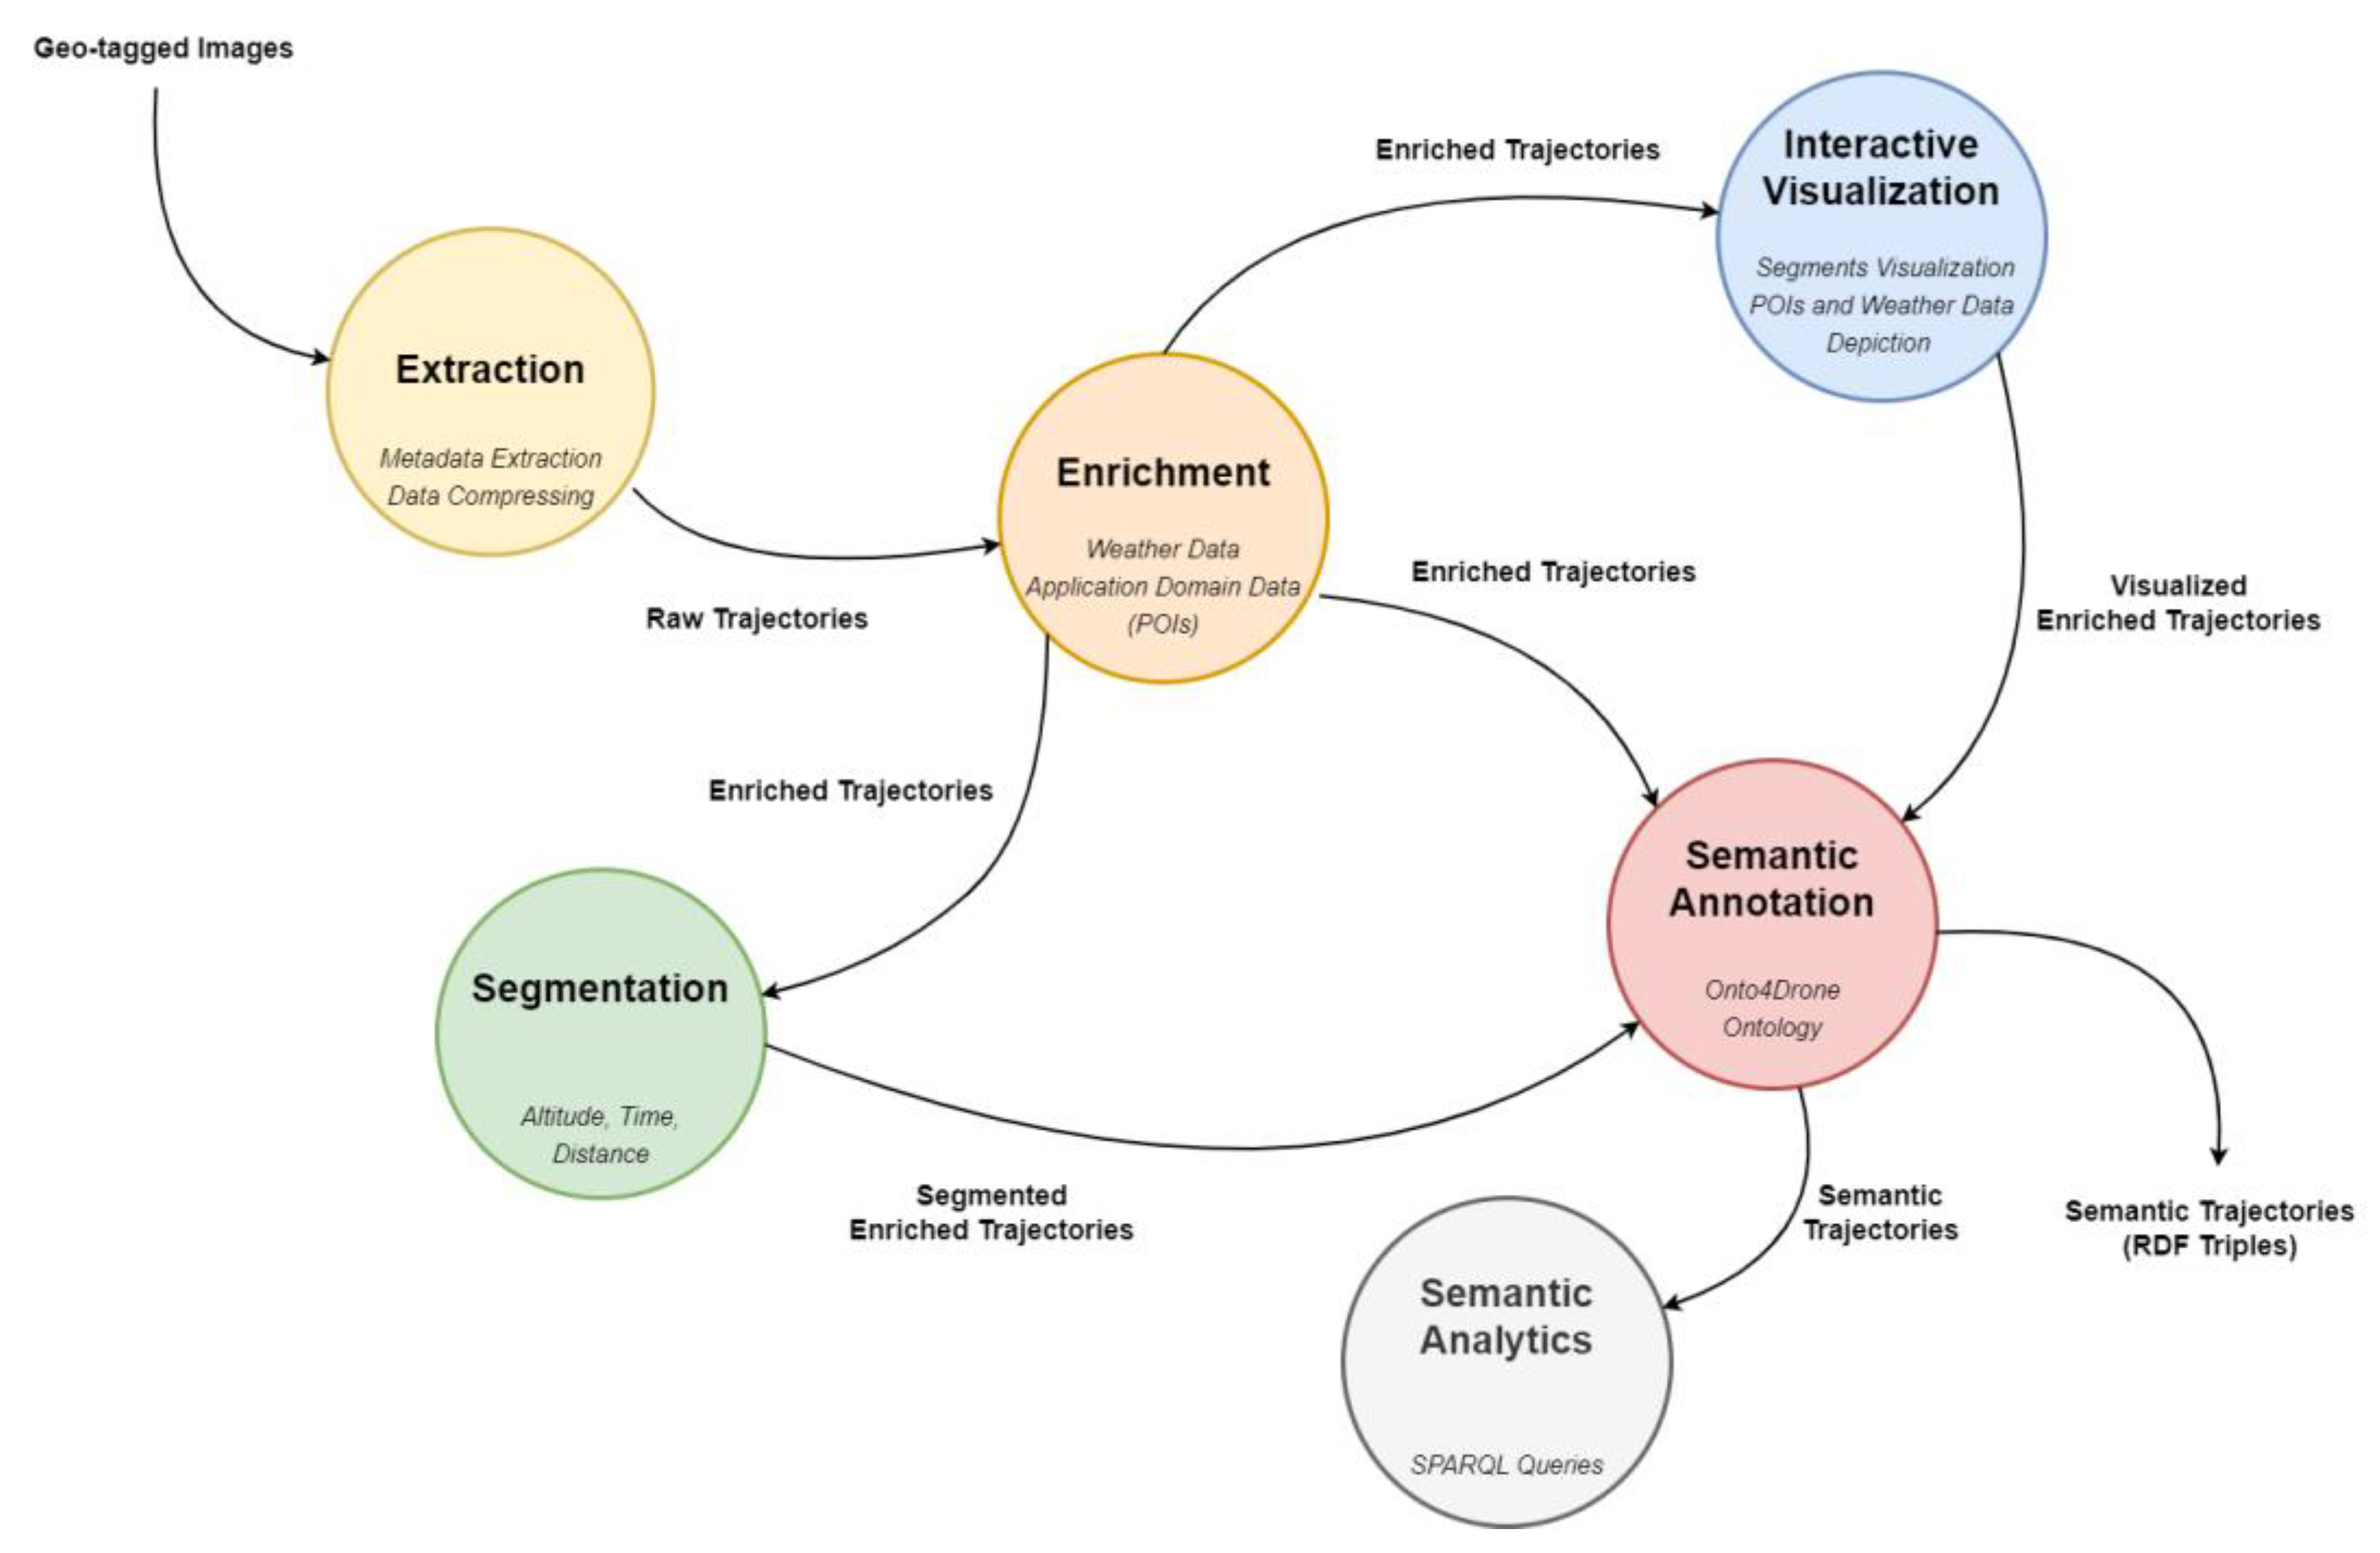
The workflow of the proposed processes (
Figure 2), from geo-tagged images to semantic trajectories, does not follow a predefined sequence of modules’ execution. Starting from the reconstruction of the raw trajectory from geo-tagged images and their enrichment with external data, the enriched trajectory can be segmented based on specific criteria, visualized, or semantically annotated using the Onto4drone ontology. The latter can also be executed after the Interactive Visualization and Segmentation modules. Moreover, after the Enrichment process, the stops of the UAV can be detected in the trajectory using the corresponding functionality of MovingPandas. Finally, after the Semantic Annotation module, the drone’s semantic trajectory is created (in RDF), and the Semantic Analytics can be executed using SPARQL queries.
Figure 2 depicts the overall workflow.
The extracted metadata from geo-tagged photos are used as input in the trajectory construction module of MovingPandas to create the raw trajectory. The provided functionality of the original framework, such as visualization, stop detection, trajectory smoothing, trajectory splitting, and trajectory generalization, can be applied in the reconstructed trajectory. Then, the reconstructed raw trajectory can be enriched with external data (weather data, POIs) using the Trajectory Enrichment module. The Trajectory Segmentation module segments the enriched trajectory based on a flight’s altitude variations, time intervals, or the distance between two consecutive recording points (geo-tagged images). The Trajectory Stop Detection module extends the corresponding functionality of MovingPandas, not only to detect stops in a trajectory, but also to detect the number of recording points (geo-tagged photos) included in each stop. The Interactive Trajectory Visualization module is used to interactively visualize not only the drone’s trajectory in a simple line, but also to depict additional information that the trajectory contains. Such information includes starting and ending points, segments, stops, weather, and POI data. The Semantic Annotation module is used for the annotation of the enriched trajectories using the Onto4drone ontology to ensure a high-level abstraction of the represented data, creating the drone’s semantic trajectory, which can eventually be exported in RDF. The Semantic Trajectory Analytics module is used for the analytics of the reconstructed semantic trajectories using SPARQL queries.
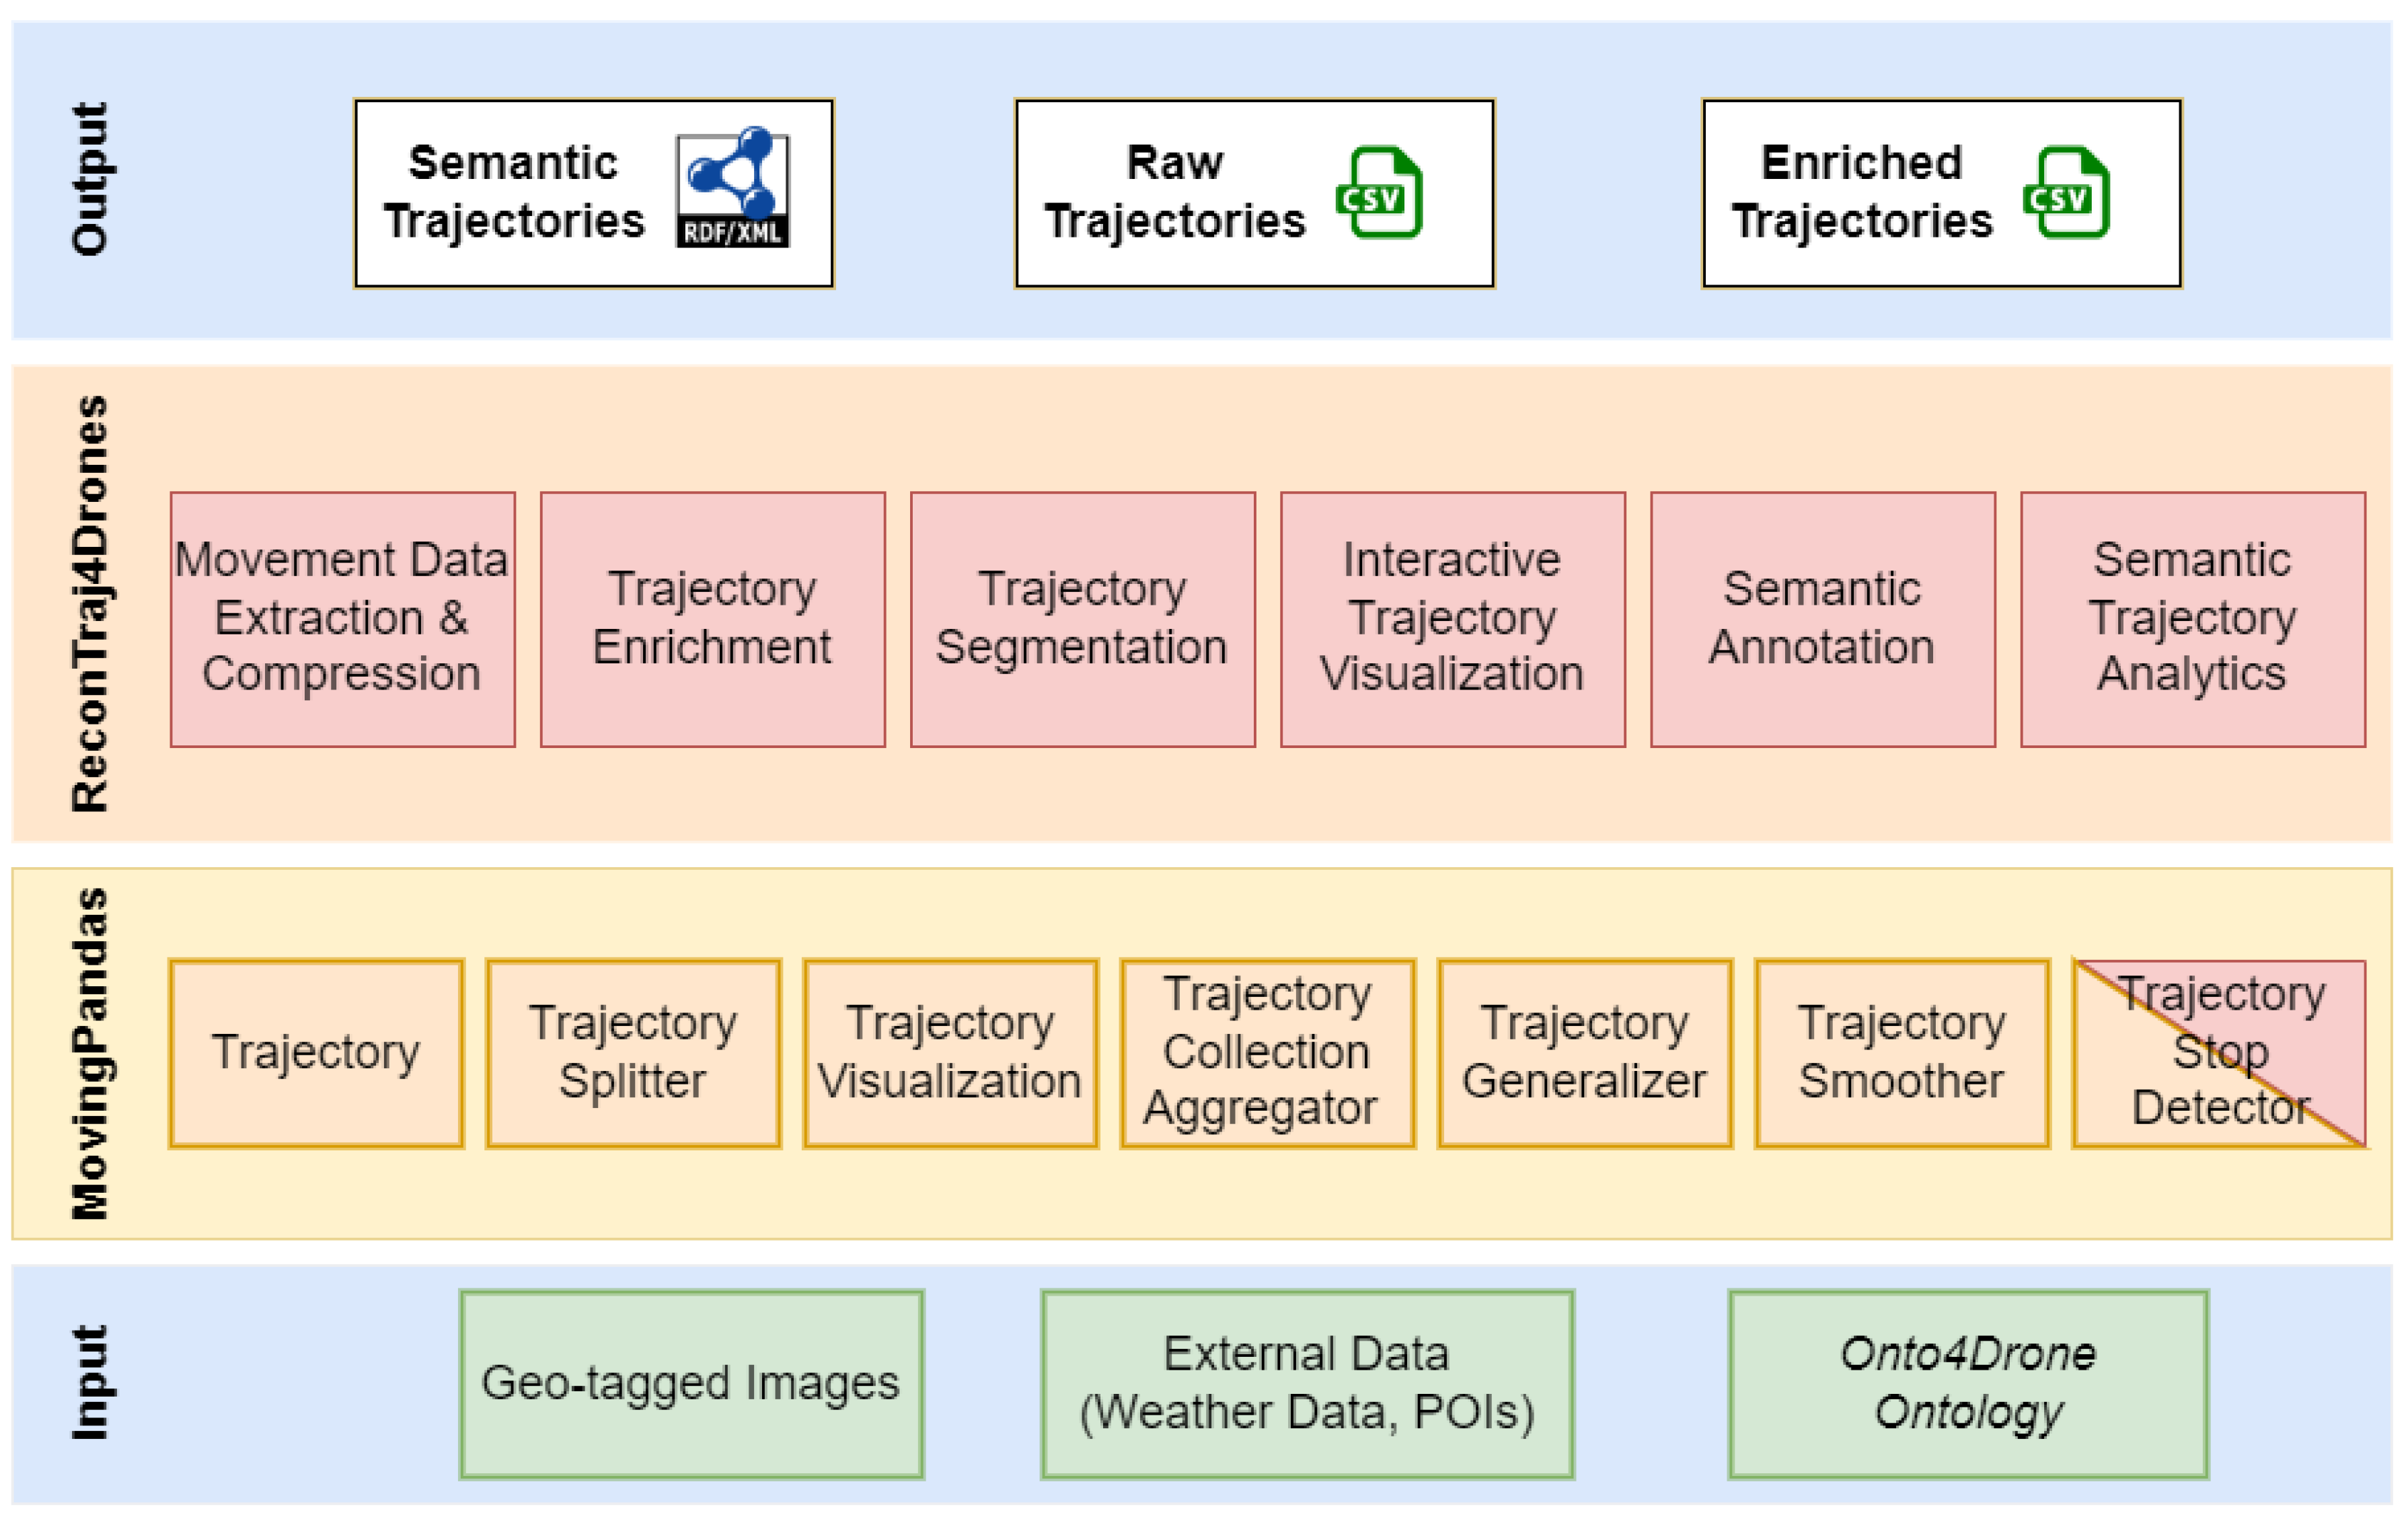
Figure 3 depicts the high-level architectural design of the modules of ReconTraj4Drones, integrated in MovingPandas. Geo-tagged photos, external data (weather data, POIs), and the Onto4drone ontology constitute the input data of the framework. On the other hand, CSV files, both for raw and enriched movement data, RDF triples of the reconstructed semantic trajectory, along with interactive visualization, trajectory segmentation, trajectory stops, and trajectory analytics results, constitute the output data of the extended framework.
3.2. Trajectory Reconstruction
To create the trajectory of a moving object, it is necessary to have access to the movement data of that object. Typically, the movement data is related to GPS points that are recorded during the movement of the object. In our solution, we reconstructed raw trajectories using geo-tagged photos taken by drones during their mission (flight), as they provide us with suitable data/metadata for the reconstruction process. The trajectory reconstruction process consists of two parts. In the first part, the related metadata is extracted from geo-tagged photos, and in the second part, the photos are resized to make them easier to manage in later stages of analysis and visualization.
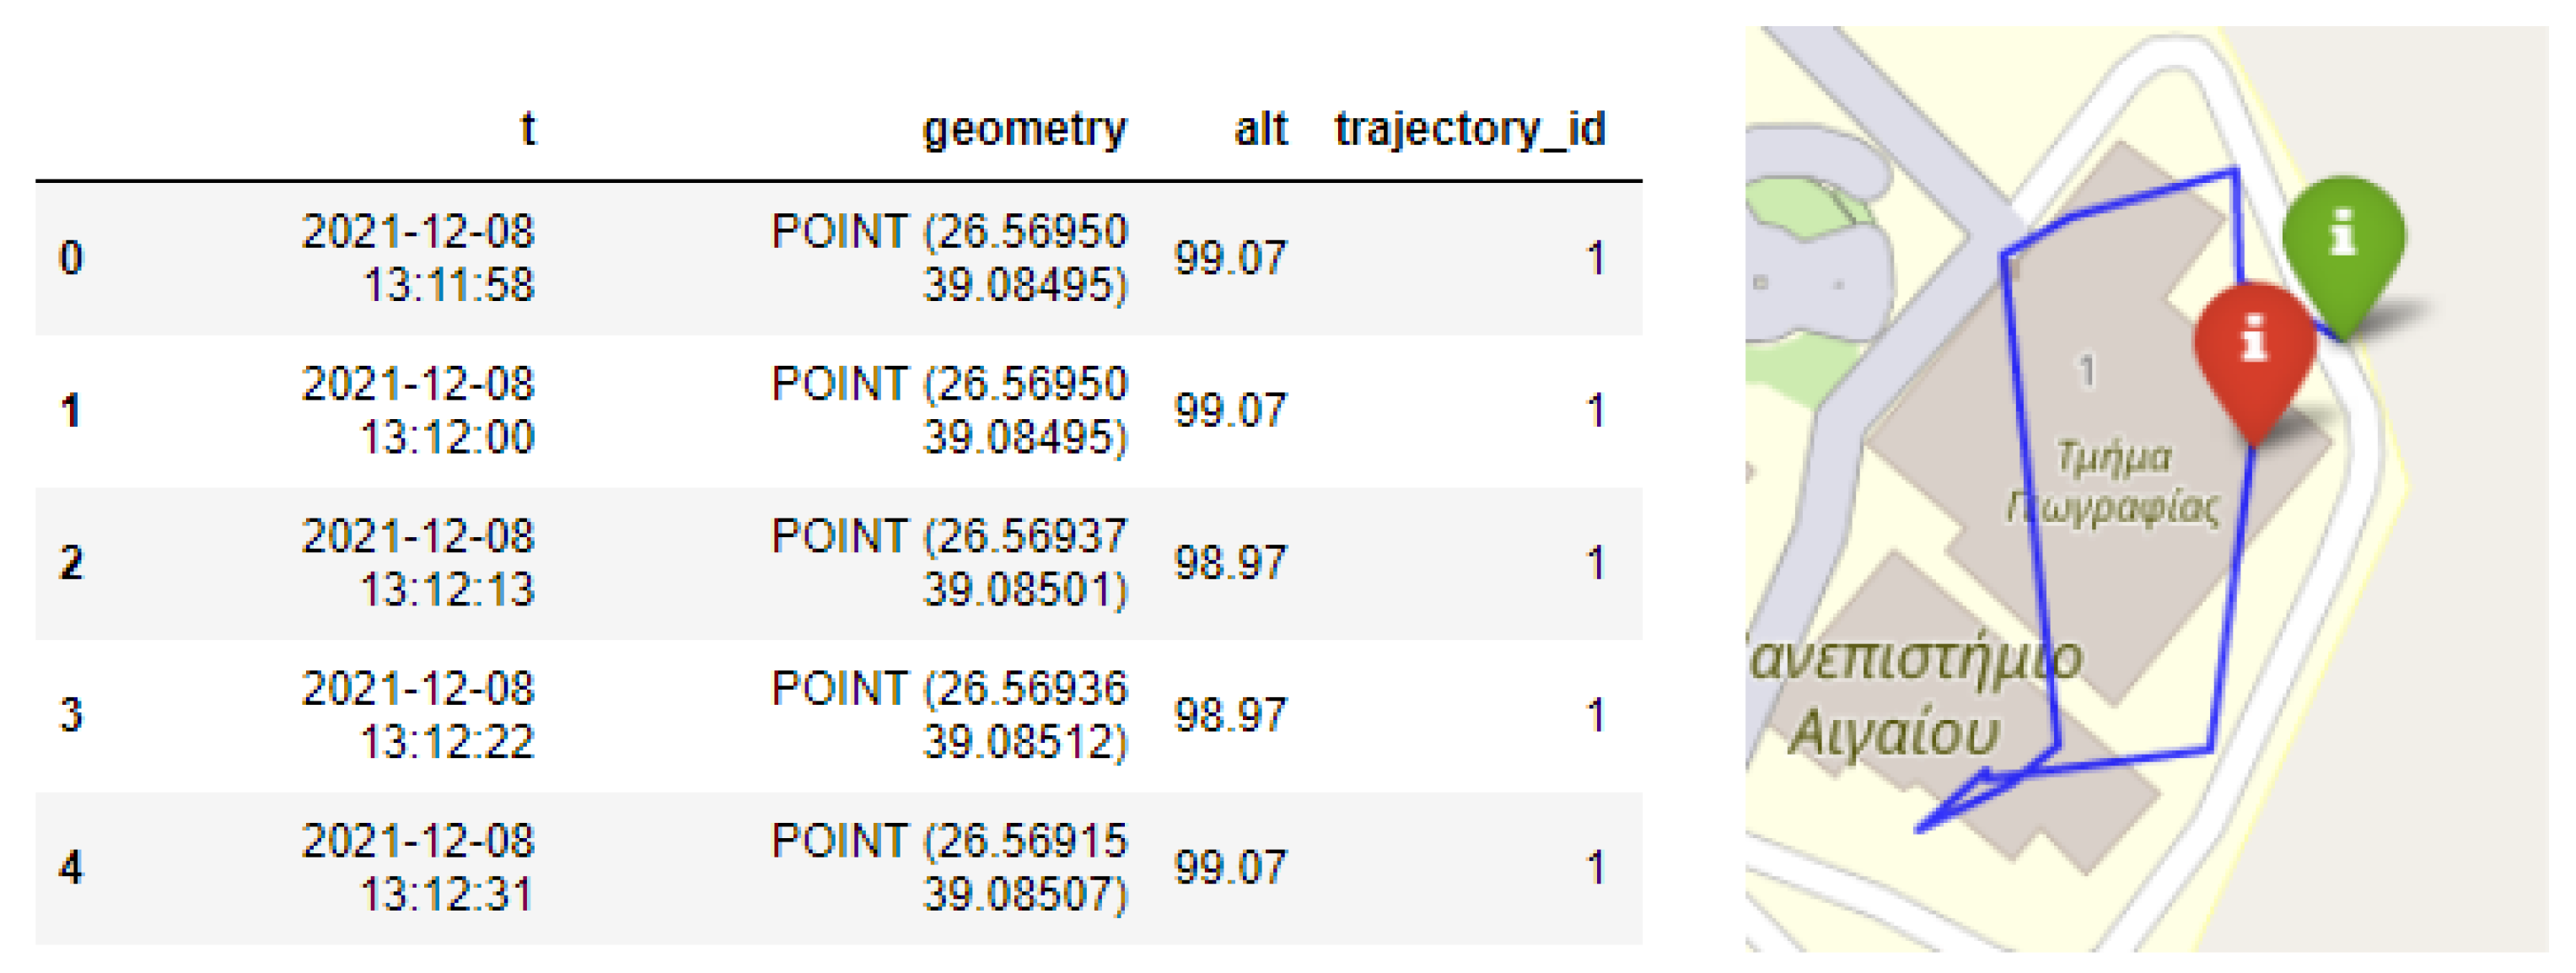
The ReconTraj4Drones framework uses a set of geo-tagged photos as input. Each photo is characterized as a (recording) point of the trajectory, providing information about the latitude, longitude, and timestamp of that point (position). Subsequently, putting these photos in chronological order, the drone’s trajectory can be reconstructed. The number and the time interval between these photos define the accuracy of the reconstructed trajectory. Typically, a geo-tagged photo not only provides spatiotemporal data (latitude, longitude, timestamp), but may also provide further valuable information about the altitude of the drone, the maker and the model of the carried camera, its focal length, etc. To acquire the drone’s movement data, we extracted the spatiotemporal data that are necessary for the reconstruction of raw trajectories. We also extracted data about the altitude at each point (photo), the file itself, such as its title, storage path, size, and format, and finally, the data about the drone’s camera, such as the maker and the model. The latter gave us more information about the flight and were used in the next stages of trajectory analytics and visualization. Because MovingPandas handles trajectories as DataFrames, these were stored as a DataFrame as well.
Figure 4 depicts the form of a DataFrame.
Part of the reconstruction phase concerns the compression of the input data (photos). Typically, drones are equipped with high-resolution cameras that take high-quality photos during their flights. As a result, the size of the photos is quite large, making them difficult to use in the trajectory visualization phase. Moreover, the use of such large photos makes the visualization unreadable for the end users. To solve this problem, we resized the input photos to dimensions equal to 250 px × 250 px. Algorithm 1 outlines the logic of the trajectory reconstruction module.
Having extracted the necessary movement data from the photos, it is possible to create the raw trajectory using the functionality provided by MovingPandas. Then, it is possible to use the additional functionalities of MovingPandas, such as visualization, stop detection, trajectory smoother, etc. Last, but not least, it is possible to export the extracted metadata in the form of a CSV file. Thus, taking advantage of the corresponding functionality of MovingPandas, in the future, we can create the same trajectory using the CSV file without repeating the whole reconstruction process.
| Algorithm 1: Trajectory Reconstruction |
Input: a set (folder) of geo-tagged images and a selection of data exported to csv
Output: a (raw) trajectory and a csv file
1: traj_data = []
2: images = get_images(folder_name)
3: for each image ∈ images do
4: point = extract the metadata of the image
5: transform the coordinates in decimal degree format
6: append the point into traj_data;
7: end for
8: resize_images(images)
9: if extract_to_csv == True then
10: create_csv(traj_data)
11: end if
12: df = create a DataFrame(traj_data) using Pandas
13: geo_df = create a GeoDataFrame(df) using geoPandas
14: trajectory = create a Trajectory(geo_df, 1) using MovingPandas
15: return trajectory |
3.3. Trajectory Enrichment
A raw trajectory cannot provide detailed information about the field of operation the drone has flown. In contrast, an enriched trajectory can provide further (contextual) information about the mission and the visited ROI/POIs. A trajectory can be enriched with external (to flight) data, beyond the latitude, longitude, and timestamp. This data depends on the mission and on the domain. In the ReconTraj4Drones framework, a module for the enrichment of the reconstructed trajectory is developed, acquiring data about the weather conditions and POIs of a particular flight. Thus, for each point (latitude, longitude, timestamp) of the reconstructed trajectory, the aim is to retrieve the weather conditions (temperature, humidity, pressure, etc.) present at the specified time (timestamp). Moreover, the geographic region (boundaries) in which the drone has flown is computed. Towards this aim, data about the particular area that include POIs, roads, buildings, etc. are retrieved. Finally, the data extracted from the geo-tagged images beyond the latitude, longitude, and timestamp are used to further enrich the reconstructed trajectories. Such data include altitude and camera details.
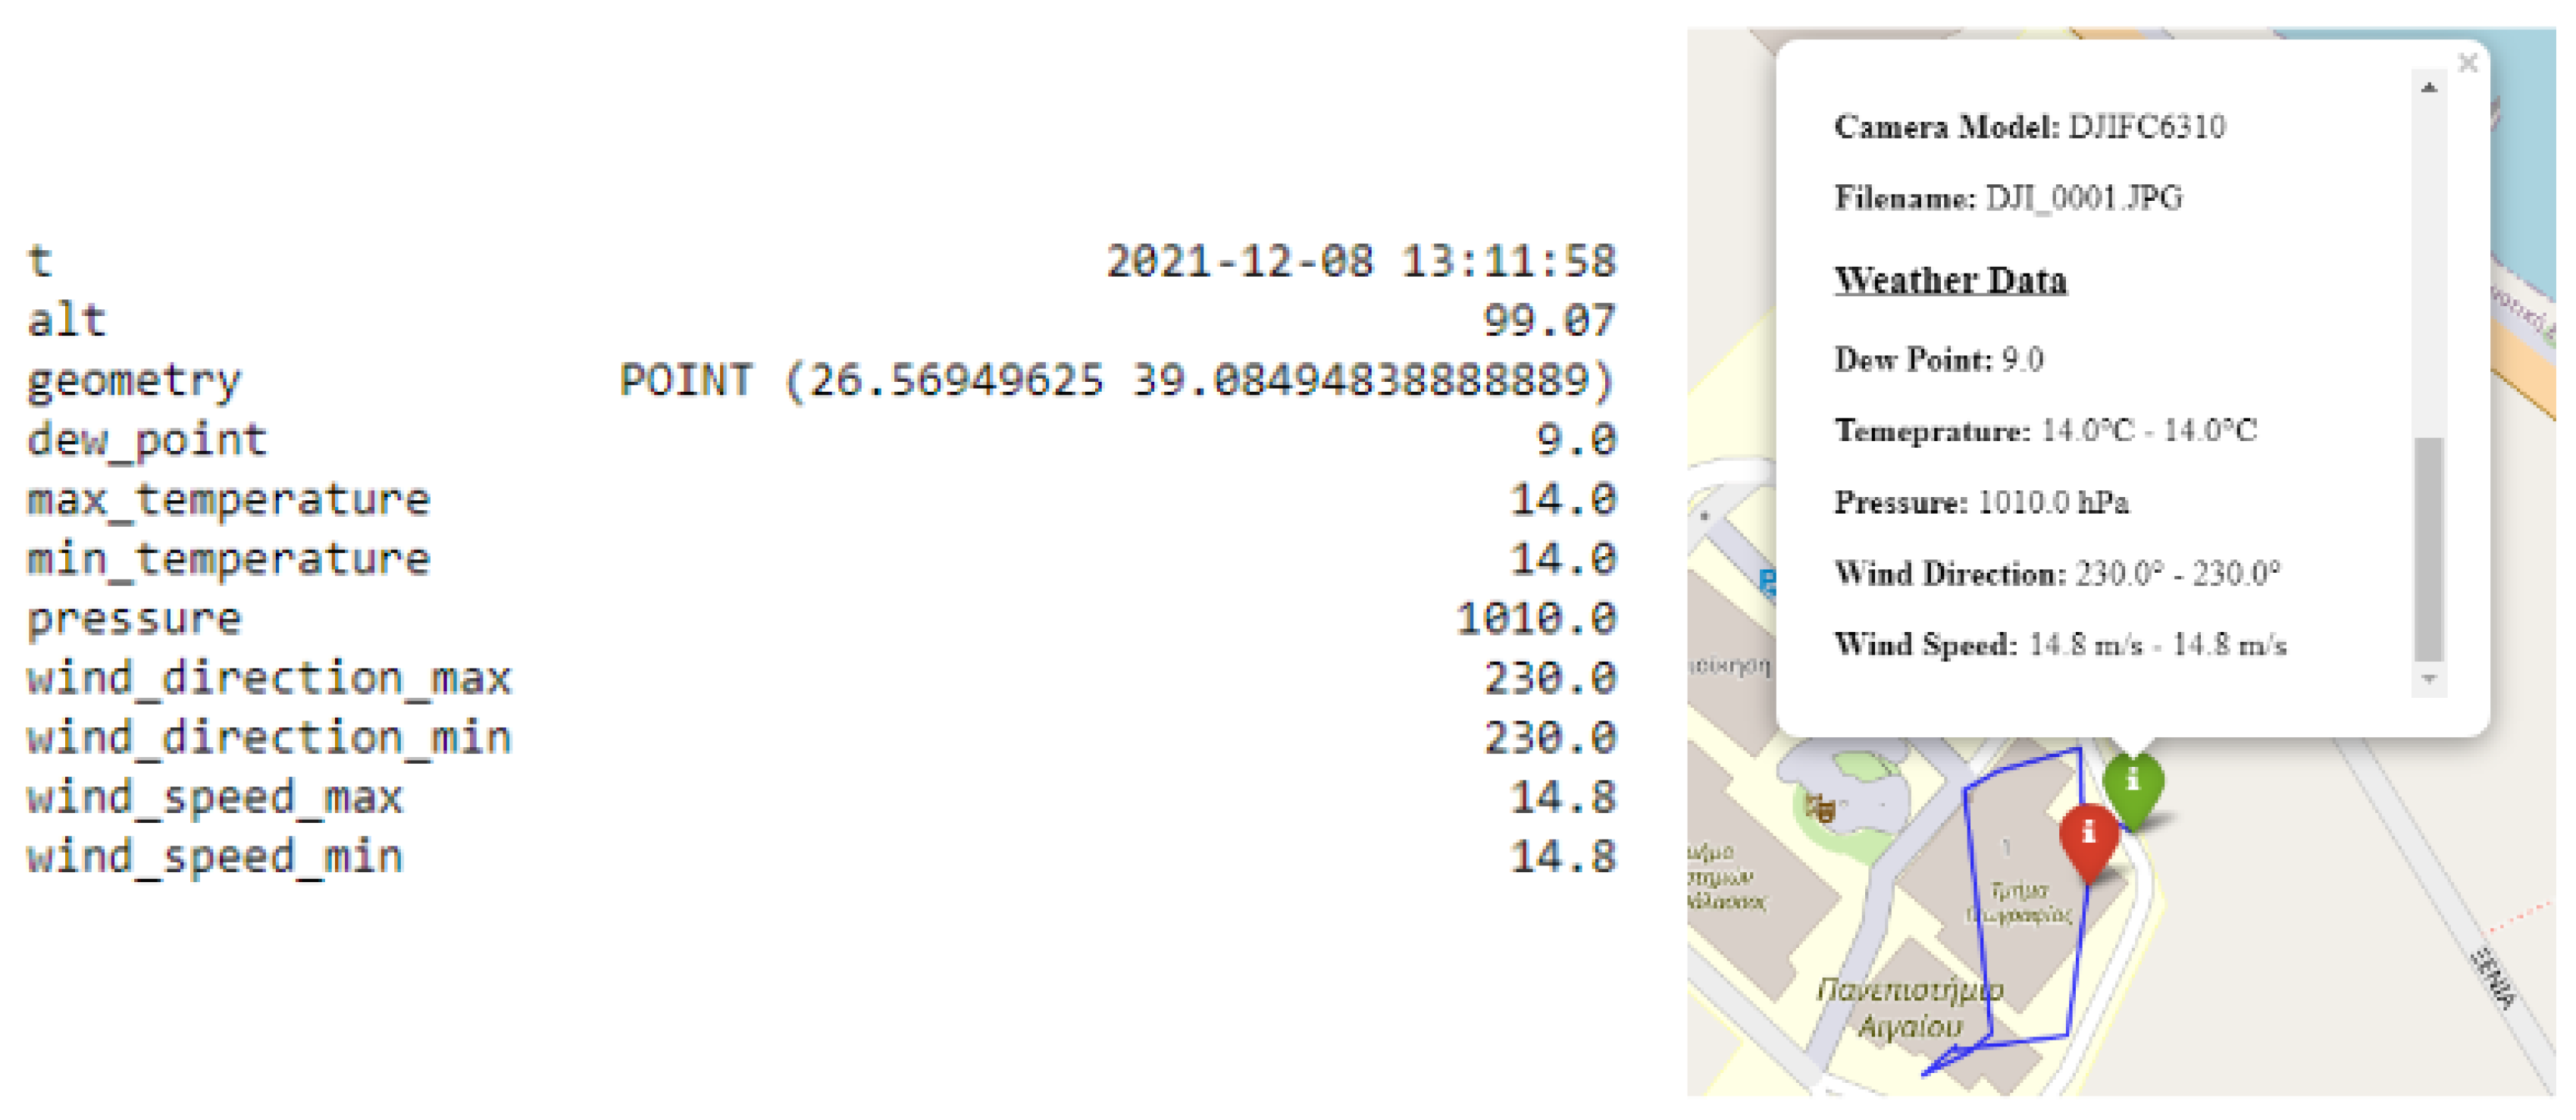
In the trajectory enrichment module, the main goal is to interrelate each point of the reconstructed trajectory with the weather conditions present at that point. Weather conditions concern data such as the dew point, temperature, pressure, wind direction, and wind speed. In our approach, since the reconstruction of a drone’s trajectory does not take place in real time (i.e., during a flight), the approach utilizes historical weather data. The acquisition of this data is carried out using suitable Web services, namely, the OpenWeather (
https://openweathermap.org/api, accessed on 30 December 2022) and the Meteostat (
https://meteostat.net/en/, accessed on 30 December 2022) services. The developed framework fetches the historical weather data by implementing the corresponding application programming interfaces (APIs). OpenWeather provides historical weather data for a given latitude, longitude, and timestamp. For each point of the reconstructed drone’s trajectory (the latitude, longitude, and timestamp), the historical weather data are fetched. The data are returned in the JSON format in the following form:
{
’lat’: 39.2256,
’lon’: 25.8815,
’timezone’: ’Europe/Athens’,
’timezone_offset’: 7200,
’data’: [
{
’dt’: 1643632920,
’sunrise’: 1643606671,
’sunset’: 1643643307,
’temp’: 12.16,
’feels_like’: 10.68,
’pressure’: 1012,
’humidity’: 48,
’dew_point’: 1.49,
’clouds’: 50,
’wind_speed’: 2.69,
’wind_deg’: 218,
’weather’: [
{
’id’: 802,
’main’: ’Clouds’,
’description’: scattered clouds’,
’icon’: ’03d’
}
]
}
]
} |
The Meteostat Web service provides historical weather data for a given point as well. However, unlike OpenWeather, it takes the altitude as input (in addition to latitude, longitude, timestamp) and returns the historical weather data in a pandas DataFrame form. Consequently, the framework can acquire historic weather data for a trajectory regarding either the ground or the drone’s flight altitude. In the latter case, if there are no historic weather data available for the given altitude, the historical weather data of the ground are returned.
Figure 5 depicts the returned data from the Meteostat Web service for a given latitude, longitude, timestamp, and altitude.
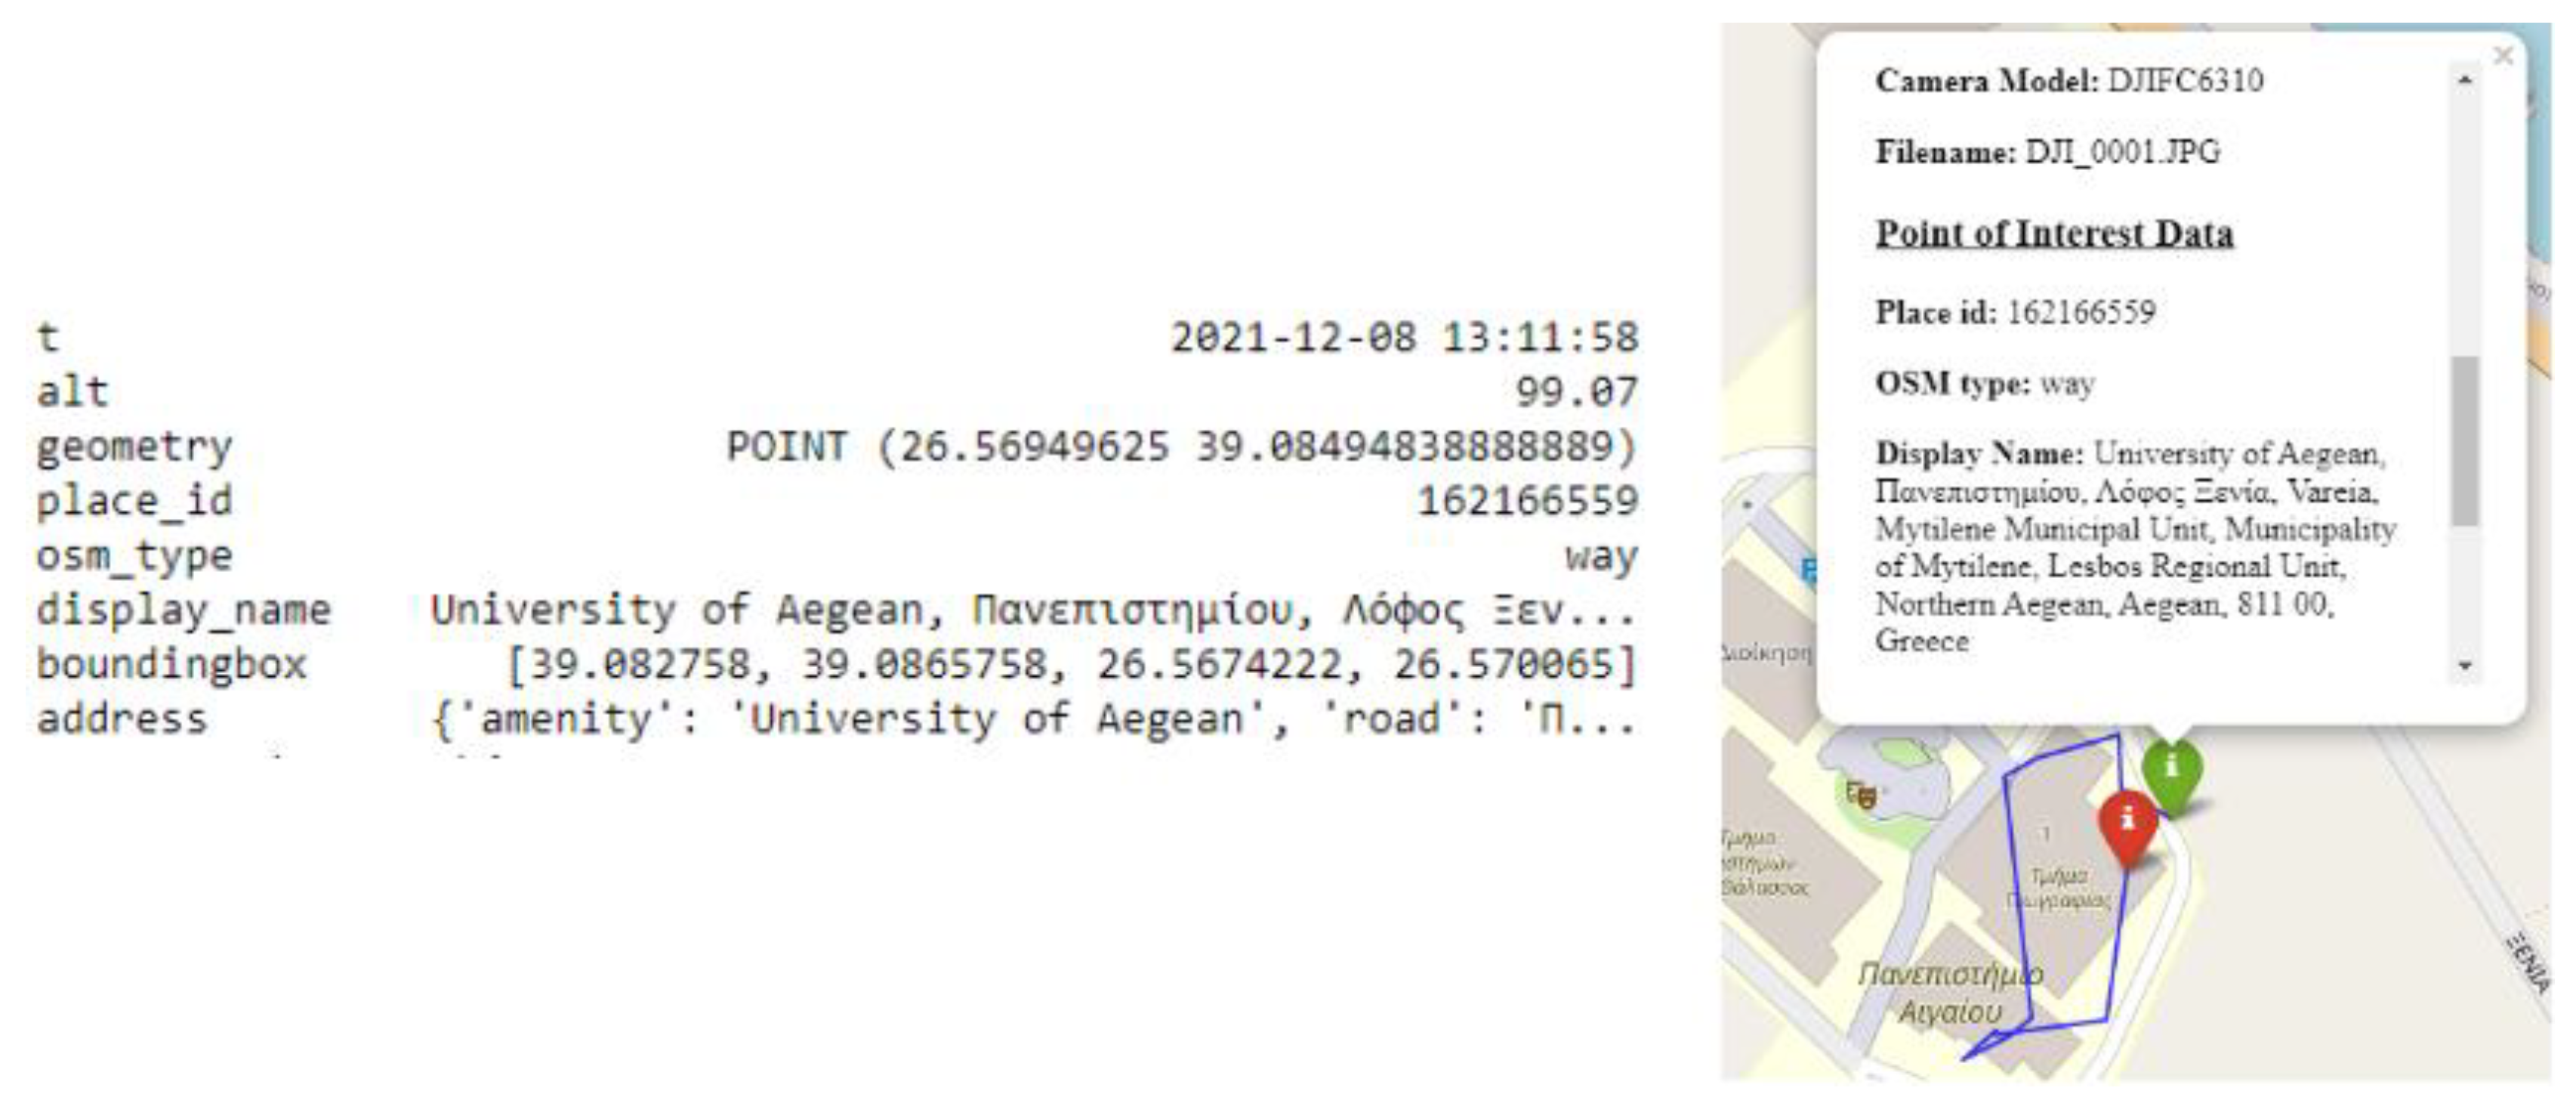
To further enrich the trajectories with information related to a ROI/POI, the OpenStreetMap (
https://www.openstreetmap.org/, accessed on 30 December 2022) was used. More specifically, ReconTraj4Drones acquires information about the name, address, type, place id, and the bounding box. Thus, for each point of the reconstructed trajectory, the spatial data (latitude, longitude) are provided as input, and the abovementioned information is retrieved as output. The choice of OpenStreetMap is based on the fact that it is a free open-source Web service that meets the requirements of the ReconTraj4Drones framework. Moreover, the returned data are provided in JSON format, facilitating easy management and reuse. The following is an example of the returned data for a given point.
{
"place_id": 188523385,
"licence": "Data © OpenStreetMap contributors, ODbL 1.0. https://osm.org/copyright",
"osm_type": "way",
"osm_id": 366465550,
"lat": "39.22527421360034",
"lon": "25.88153577687583",
"display_name": "ΕΠ19, Municipality of Western Lesvos, Lesbos Regional Unit, Northern Aegean, Aegean, 81103, Greece",
"address":
{
"road": "ΕΠ19",
"municipality": "Municipality of Western Lesvos",
"county": "Lesbos Regional Unit",
"state_district": "Northern Aegean",
"state": "Aegean",
"postcode": "81103",
"country": "Greece",
"country_code": "gr"
},
"boundingbox": ["39.218668", "39.2343256", "25.8715699", "25.9620231"]
} |
3.4. Trajectory Segmentation
Trajectory segmentation is the process of dividing the trajectory into a number of parts (segments), such that each part satisfies a given criterion (discussed below). In ReconTraj4Drones, we provide three different ways to segment a trajectory into parts. As the reconstructed trajectory consists of a set of recording points, where each of these is a geo-tagged photo, the trajectory is split/segmented based on the time interval between two consecutive geo-tagged photos. The time interval is defined by the user, and the module splits the reconstructed trajectory into parts whenever the time interval between two consecutive photos (recording points) exceeds a given threshold.
Similarly, the module also considers, as an additional splitting criterion, the distance between two consecutive geo-tagged photos. The haversine distance between every two consecutive points is calculated. Whenever this distance is greater than a given threshold, the trajectory is segmented. As in the first case, the threshold is defined by the users according to the domain and their specific needs.
In addition to the time interval and haversine distance segmentation criteria, a third case is the segmentation of the reconstructed trajectory based on the criterion of altitude variations of a drone during its flight. The drone’s flight altitude is recorded in geo-tagged photos, and this information is extracted during the trajectory reconstruction phase. Thus, the altitude variations are computed between every two consecutive photos. Whenever these variations exceed the threshold (provided by users), the trajectory is segmented.
In all three above cases (segmentation criteria), the produced trajectory parts are returned as a set of (i, j), where i is the i-th (recording) point defining the beginning of that segment, and j is the j-th (recording) point defining the end of that segment. In cases in which the segmentation criterion is not satisfied for any point on the trajectory, the framework returns the entire trajectory as one segment, and the points (i, j) correspond to the start and end points of the trajectory. Finally, if the trajectory segmentation process is executed before the interactive visualization process, then the visualization of these segments is available.
3.5. Trajectory Stop Detection
Stop detection constitutes one of the basic functionalities in a trajectory analysis pipeline. Taking advantage of the corresponding functionality provided by MovingPandas, ReconTraj4Drones can efficiently detect stops in a given enriched trajectory. A stop is detected if a drone stays within a specific area for a specific time duration. Both parameters (area and time) are set by users (duration in seconds and max diameter in meters). Based on this functionality, ReconTraj4Drones computes the number of recording points included in each stop. Finally, the framework returns details about each detected stop, such as its ID and coordinates, the start and end time, the duration in seconds, and the number of recording points within it. The generated data can be visualized if the stop detector module is executed before the visualization process.
3.6. Trajectory Visualization
Visualization is of high importance in the management of trajectories. Even though MovingPandas provides a functionality for trajectory visualization, ReconTraj4Drones implements an additional, self-contained module for this purpose. The aim is to visualize the reconstructed trajectory with all the additional information that is used for its enrichment and its segmentation. As already stated, the additional information concerns data beyond latitude, longitude, and timestamp that uniquely define each point of the trajectory. Such data concern the drone’s mission and flight details, the type of drone, the flight altitude, the camera model and maker, and finally, the geo-tagged image itself that is related to a particular point. Moreover, if the enrichment of a trajectory has been carried out using weather and/or POI data, then this data can also be visualized. Subsequently, the aim is to visualize not only the raw trajectory, but also all the external integrated information that is obtained for each point of this trajectory.
To implement the abovementioned requirement, ReconTraj4Drones uses the Folium library (
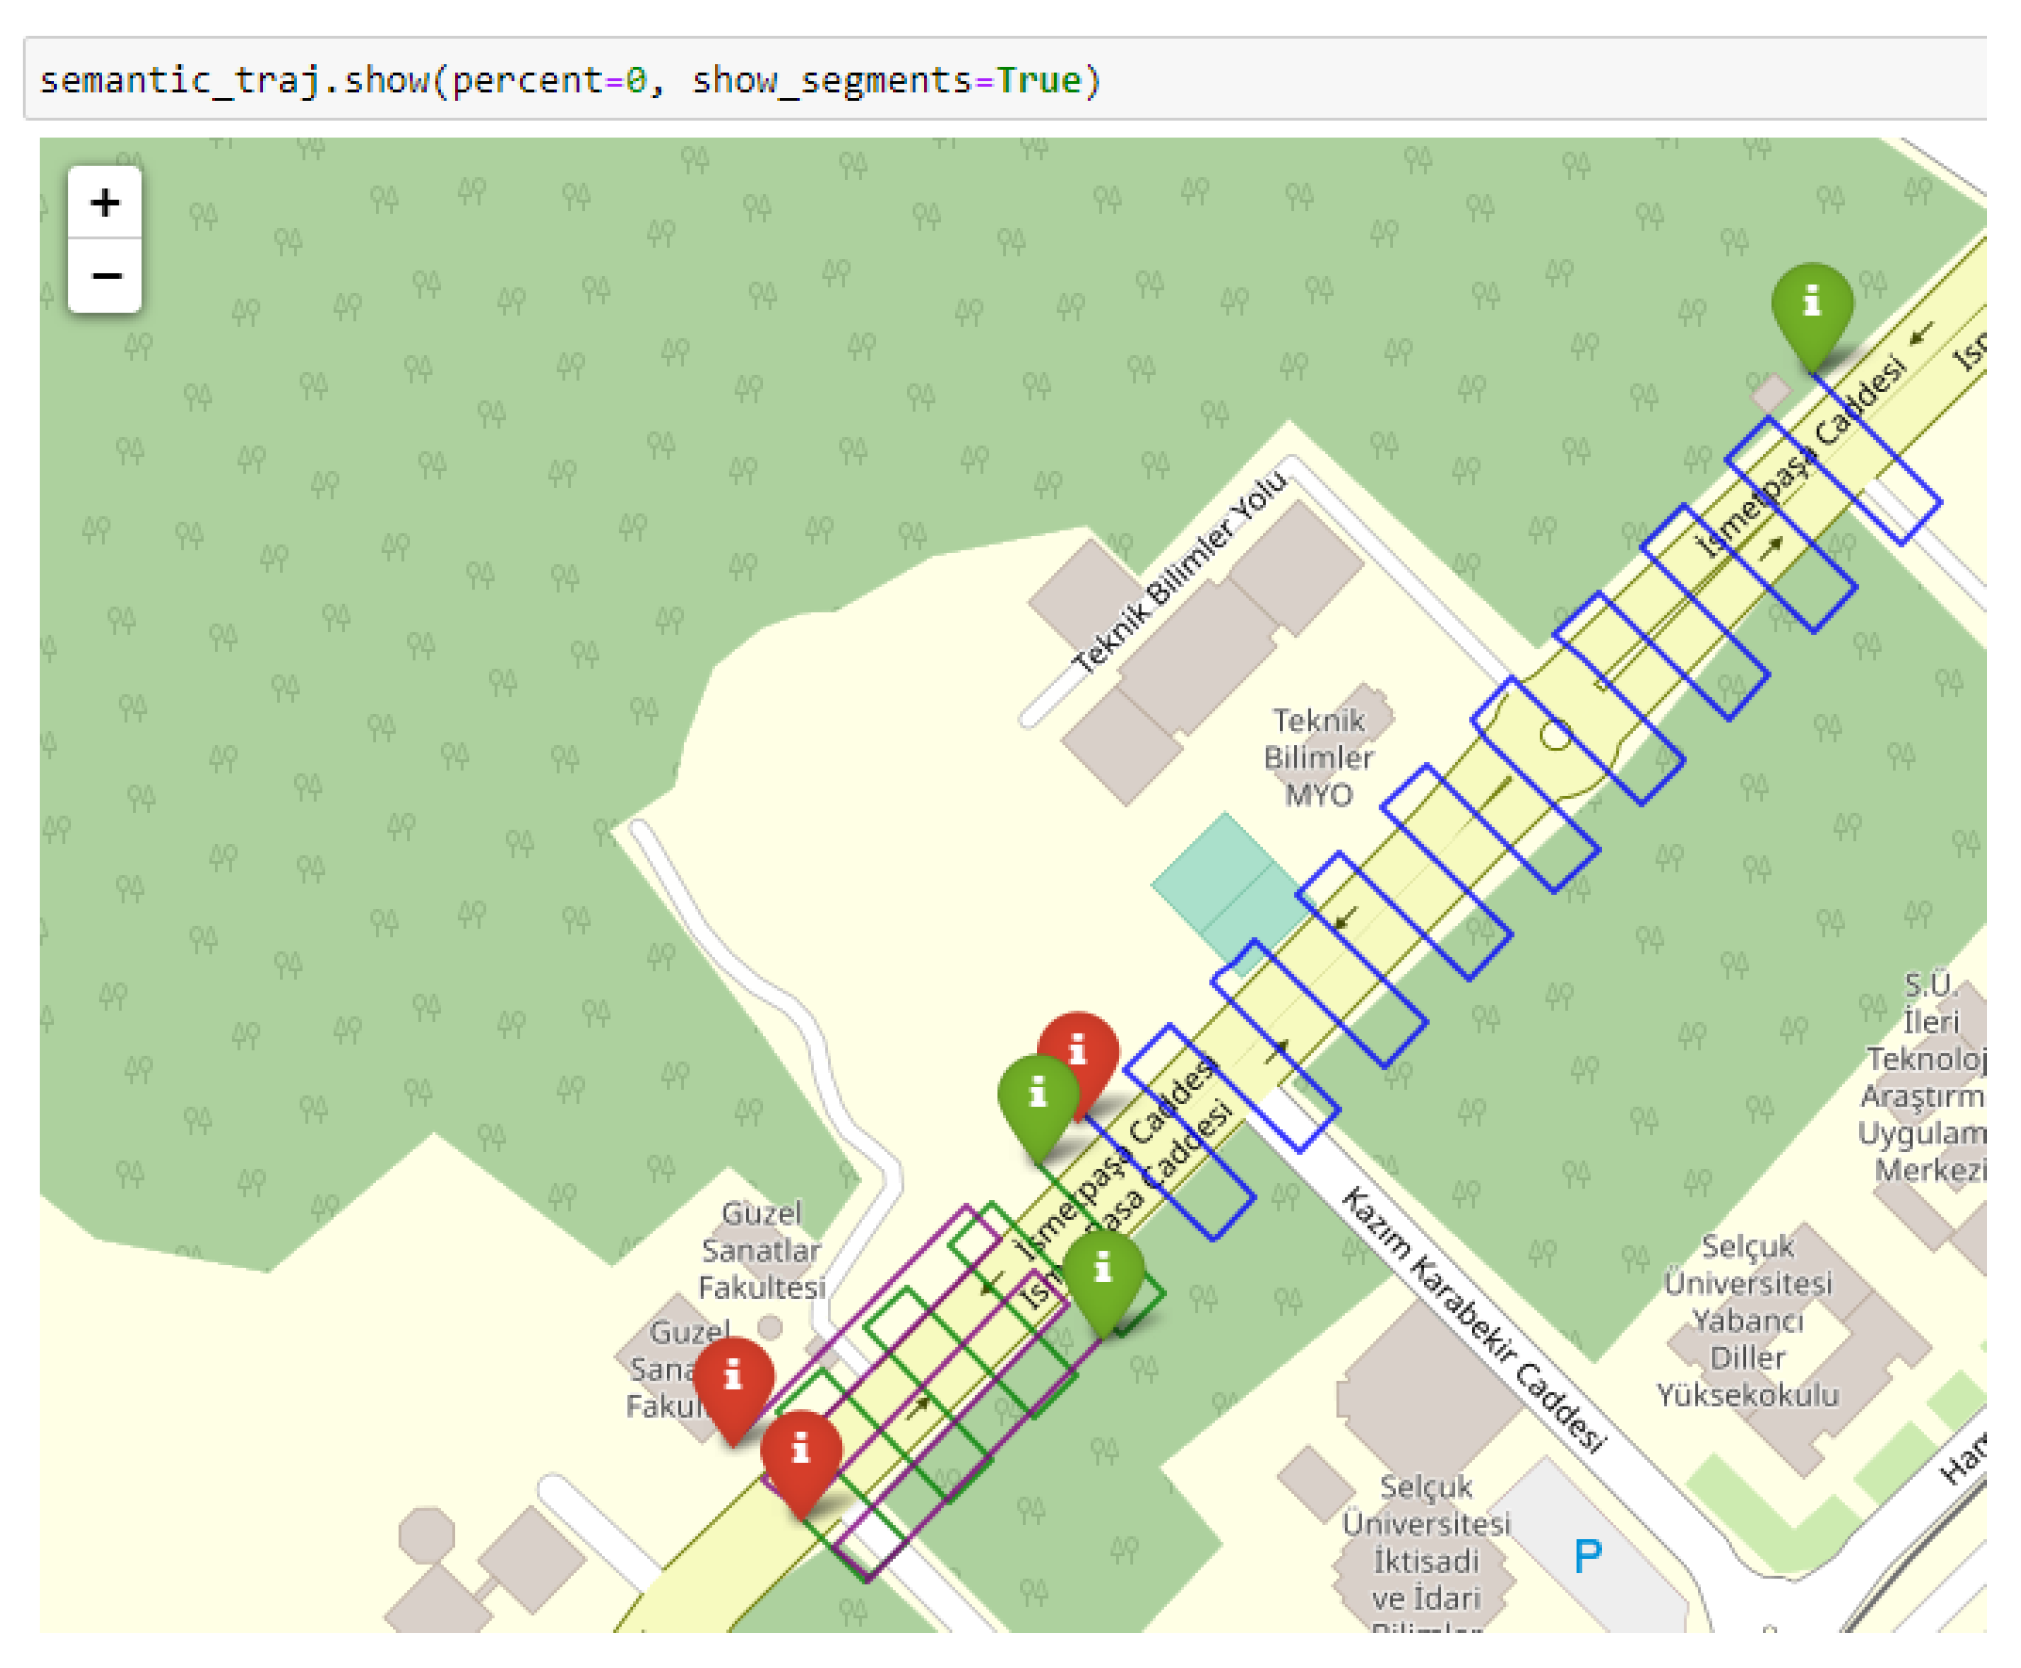
https://python-visualization.github.io/folium/, accessed on 30 December 2022), an open-source and free library that utilizes the OpenStreetMap to visualize trajectories. This library also enables the creation of interactive visualization maps. Interactive in this context means that not only is each point of the trajectory displayed with a special symbol (pin), but also that these symbols are clickable, hiding all the information available for that point. In addition, the starting and ending point of the trajectory are assigned with special symbols of different colors, i.e., green for the starting point and red for the ending point.
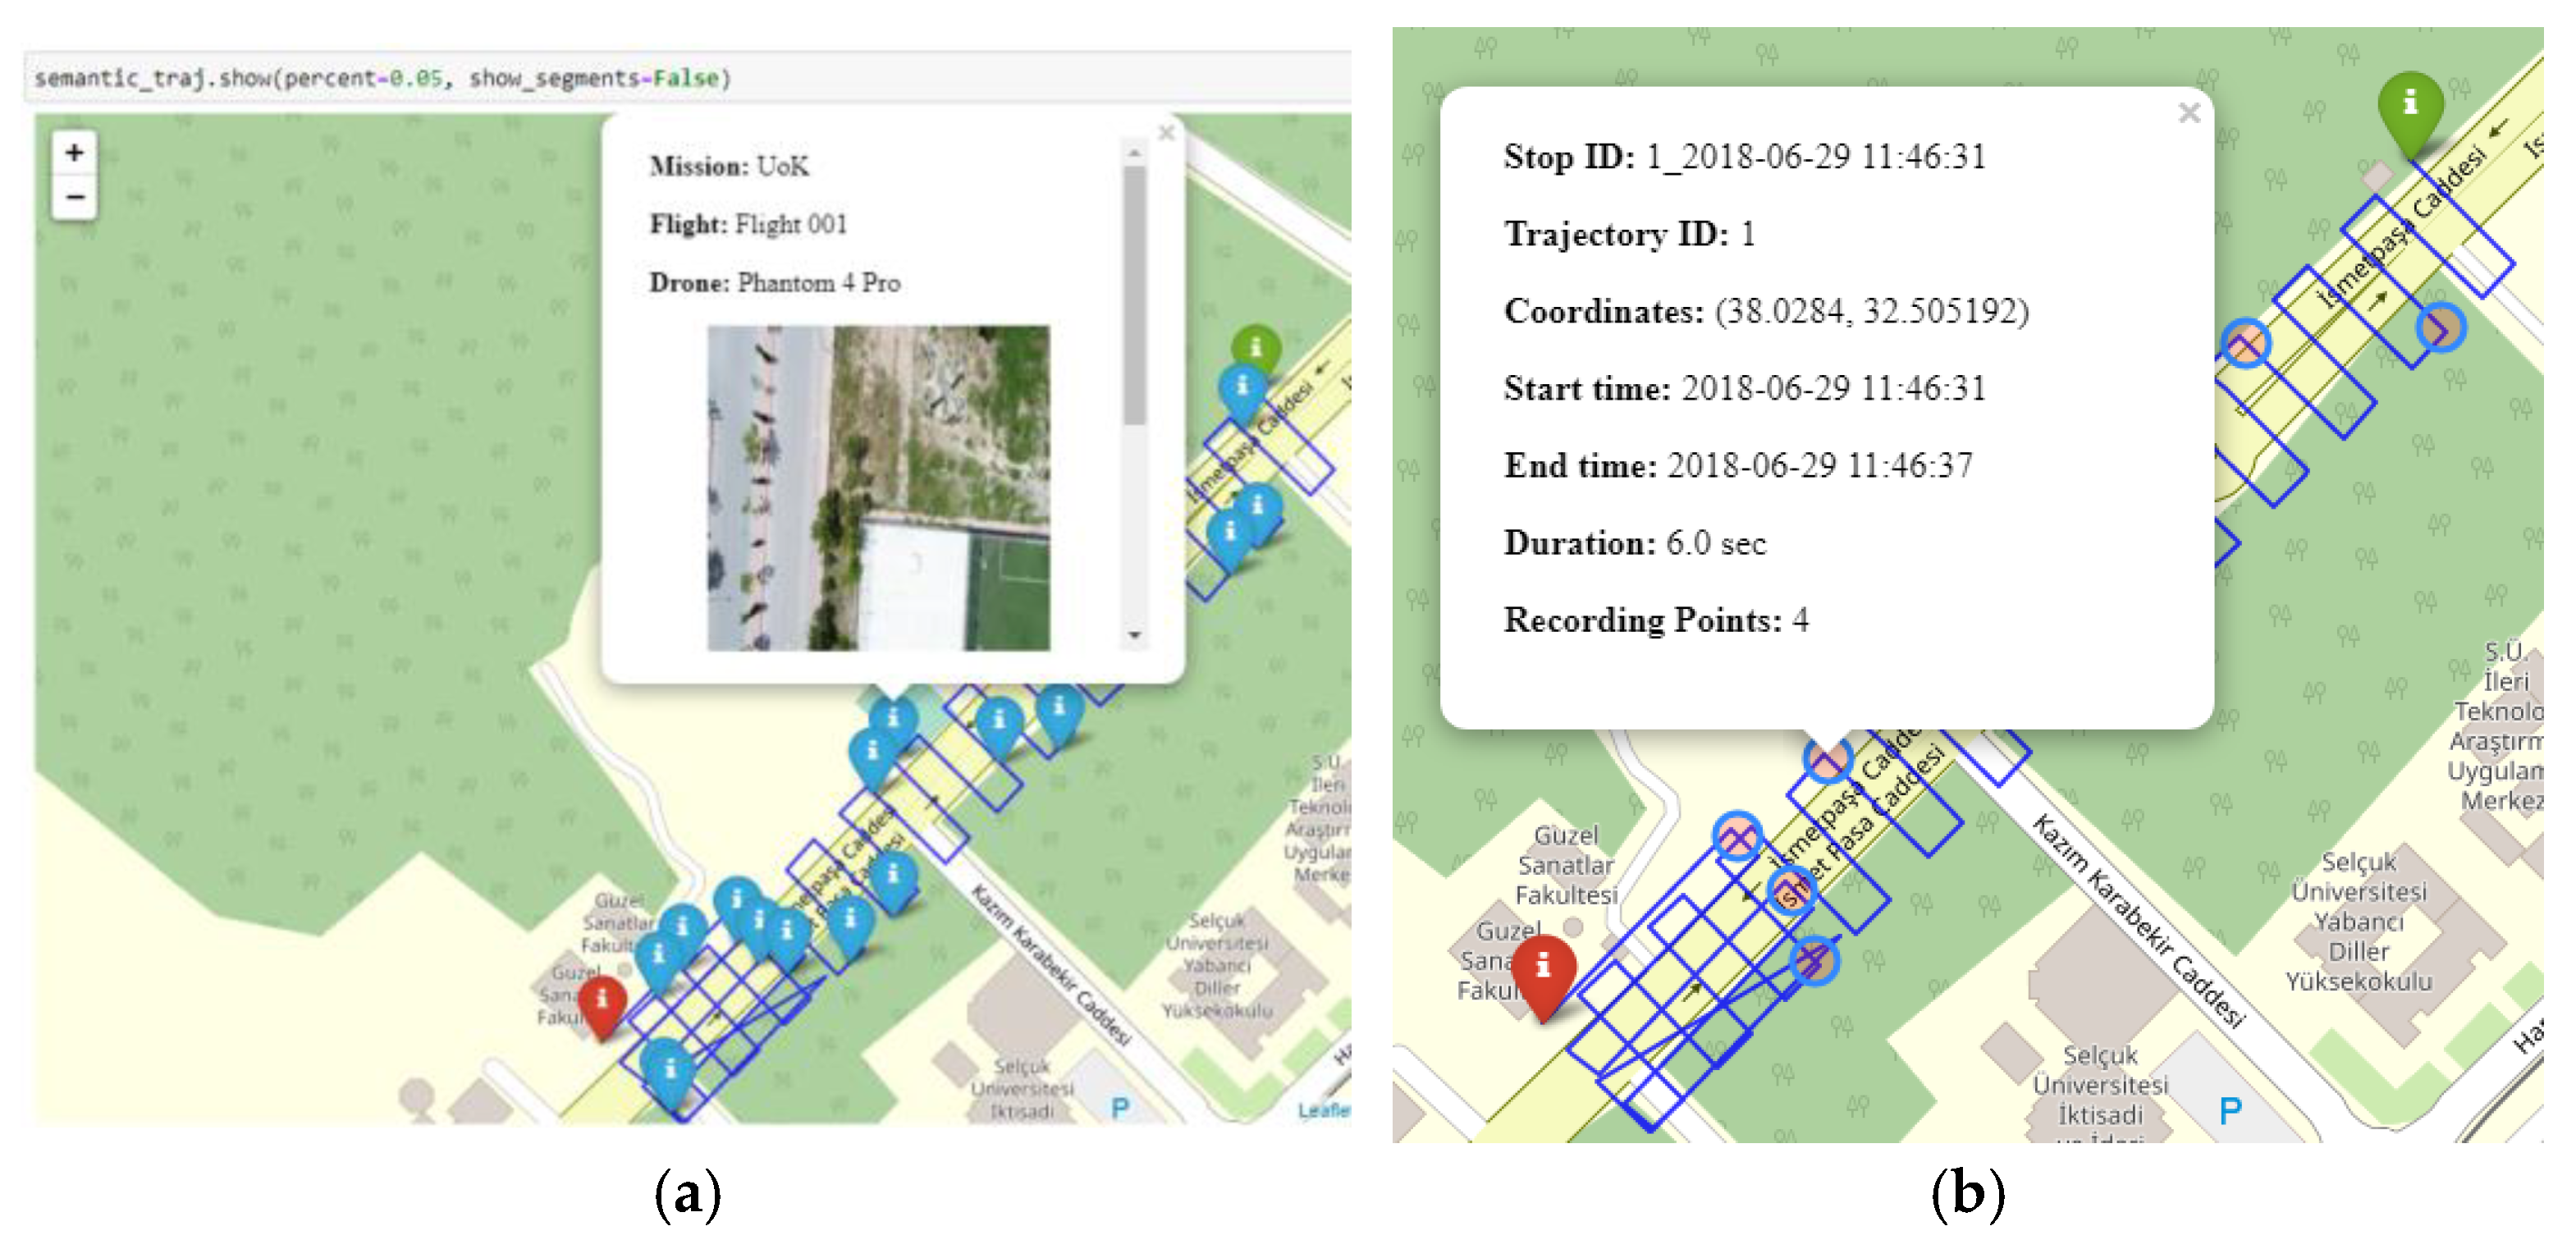
Having said that, because the reconstruction of the trajectory is based on the number of geo-tagged photos and the time interval between them, it is observed that, in cases of short time intervals between geo-tagged photos, the number of points is very large. Consequently, visually capturing all these points makes the trajectory unreadable (
Figure 6a). To solve this problem, a percentage of the total amount of points is visualized only. This percentage is defined by the user (
Figure 6b).
Last, but not least, in ReconTraj4Drones, it is possible to visualize the different trajectory segments, as well as the detected stops, if the trajectory segmentation and/or trajectory stop detector modules have already been executed. In the first case, each trajectory segment is visualized with a unique color to distinguish between them. In addition, the starting and the ending point of each segment are indicated with green and red color pins, respectively. On the other hand, if the segmentation process has not been executed, then the entire trajectory is defined as one segment and is visualized with the same color. Regarding stops’ visualization, each trajectory stop is visualized as a red circle. Each circle is a clickable item displaying all the information about that stop. The user determines whether segments and/or stops will be displayed, even if both modules have already been executed.
3.7. Trajectory Semantic Annotation
After the execution of the reconstruction and the enrichment modules, the resulting trajectory integrates external heterogenous information beyond latitude, longitude, and timestamp. Thus, the need arises for a high-level abstract formalism that will semantically annotate the seamlessly integrated data and expose it as linked data (for third-party services’ consumption). Having said that, the use of the developed ontology is proposed for the actual semantic data integration, i.e., for seamlessly mapping the heterogeneous internal and external data to shared, explicit, and formal semantics.
Towards this aim, ReconTraj4Drones integrates a drone-related ontology, namely, Onto4drone, which was recently developed in our laboratory in the context of related research.
Figure 7 depicts a high-level design of the core semantics of the developed ontology. Currently, the ontology version is 1.0.2, and it is available online in OWL (
https://github.com/KotisK/onto4drone, accessed on 30 December 2022). The Onto4drone ontology is based directly on datAcron [
25] ontology and indirectly on DUL [
26], SKOS [
27], SOSA/SSN [
28], SF [
29], GML [
30], and GeoSparql [
31] ontologies. The ontological approach ensures the utilization of a high-level abstract formalism for the representation of semantic trajectories, as various disparate and heterogenous data are seamlessly integrated to semantically enrich the reconstructed trajectory. A detailed description of the ontology is out of the scope of this paper.
To incorporate ontologies and work with RDF models [
32] in MovingPandas, the Owlready2 library [
33] was used to allow for transparent access to OWL ontologies. Owlready2 is a software package for ontology-oriented programming in Python. It allows for the use of ontologies as Python objects, modifying and saving them, performing reasoning via the HermiT reasoner [
34], and executing queries in the SPARQL language [
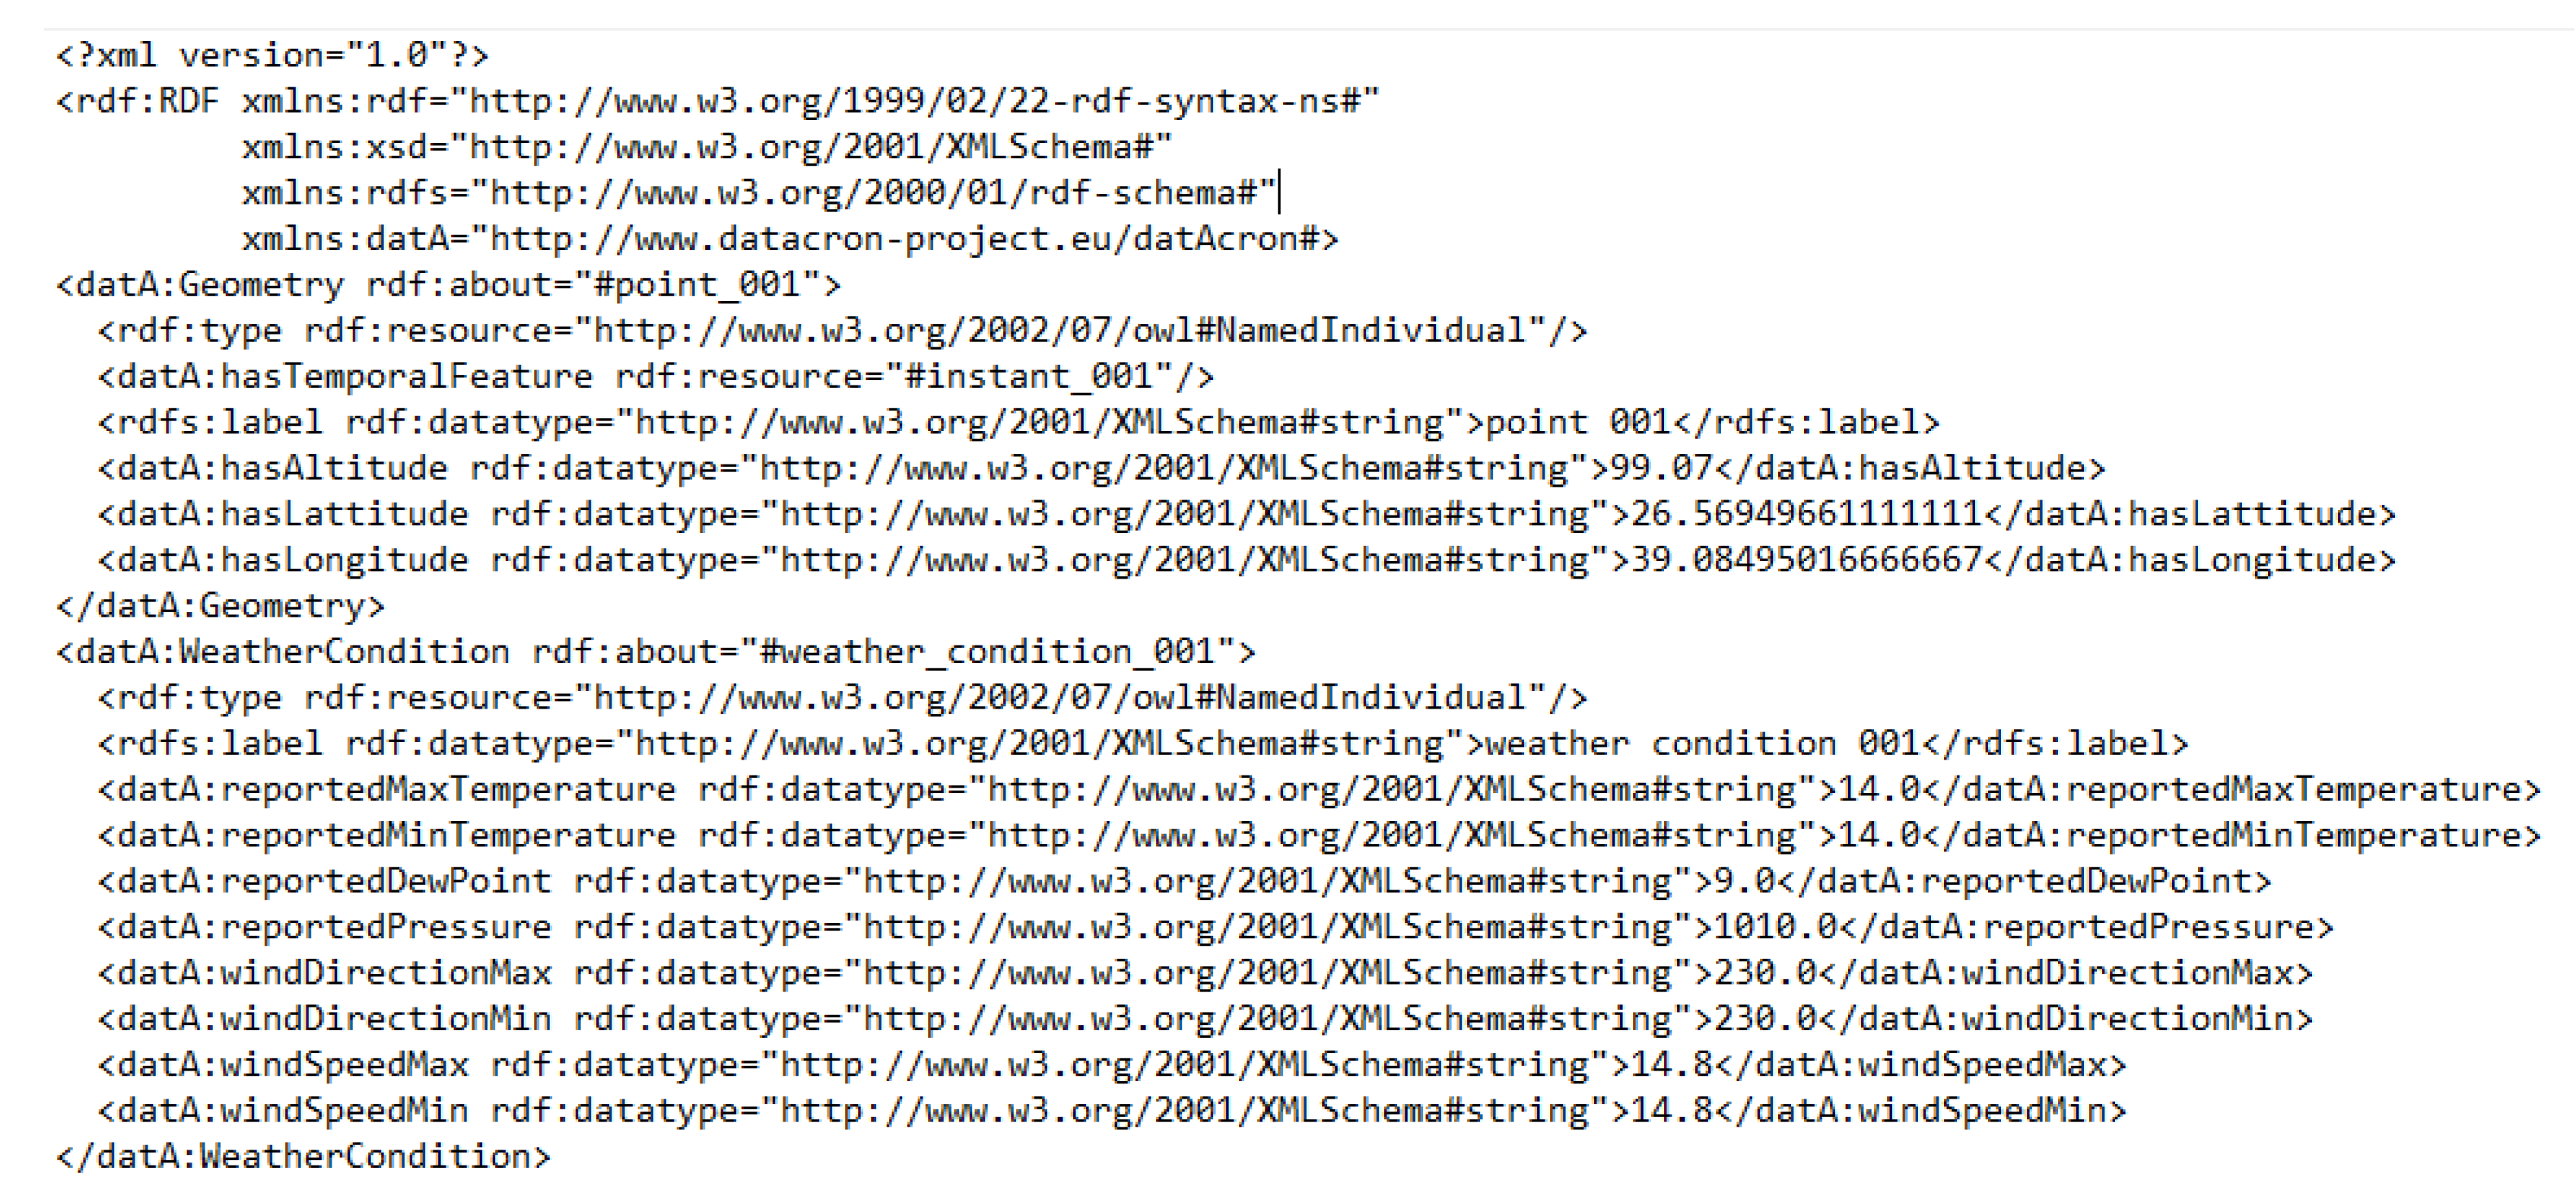
35]. In the semantic annotation phase, the aim is to use the ontology for the semantic annotation of the heterogenous data that the trajectory integrates, allowing (eventually) for the analysis of the reconstructed semantic trajectories via reasoning and queries in SPARQL. Finally, Owlready2 is used to export semantically annotated data in RDF for further semantic analysis in third-party semantic applications that are able to consume semantically annotated spatiotemporal movement data.
The first step is to load the Onto4drone ontology into the ReconTraj4Drones. The framework is expected to import all the referenced ontologies. The current version of Owlready2 can load ontologies in RDF/XML, OWL/XML, and N-triples syntax/encoding. After importing Onto4drone and the associated ontologies (e.g., datAcron), the individual entities (instances of ontological classes) are created from the data that represent the trajectory. As already stated, such data are either obtained from the external Web services, such as the weather conditions and POIs; or they are extracted from the geo-tagged photos, such as the camera model and maker; or they are inserted by the user, such as the drone type, mission, and/or flight details; or they are even created during the segmentation process (different segments). For each entity, the corresponding individual is created by specifying its label, its resource identifier (IRI), and a set of data/object properties, according to the data collected and the available ontology. The user can then proceed to the semantic analysis of the semantically enriched trajectory. Finally, the data of the semantically annotated trajectory can be exported either in RDF/XML or in N-triples encoding.
3.8. Semantic Trajectory Analytics
The Semantic Trajectory analytics module provides an analysis of the trajectories resulting from the Semantic Annotation module. To support this functionality in ReconTraj4Drones, the Owlready2 library was used. ReconTraj4Drones integrates the native SPARQL engine instead of the RDFlib (
https://rdflib.readthedocs.io/en/stable/, accessed on 30 December 2022). The first is used since it is 60 times faster than the latter. Moreover, it automatically creates prefixes from the last part of the ontology’s IRI. For example, the ontology (
http://myontology.org/onto.owl) will be automatically associated with the “onto:” prefix. The following prefixes are automatically pre-defined, so there is no need for them to be defined by the user:
The execution of SPARQL queries is feasible only after the execution of the semantic annotation process. Indicative examples of SPARQL queries concern the number of recording points and the number of POIs in a single trajectory. The corresponding queries are the following:
Query 1:
list(default_world.sparql("""
SELECT (COUNT(?recording_points) AS ?rp) WHERE {
?tr Onto4drone_v1.0.1:encloses ?rs .
?rs TopDatAcronOnto_SSN_FM:comprises ?recording_points .
}"""))[0][0].
Query 2:
list(default_world.sparql("""
SELECT ?point_of_interest WHERE {
?tr Onto4drone_v1.0.1:encloses ?rs .
?rs TopDatAcronOnto_SSN_FM:comprises ?rp .
?rp Onto4drone_v1.0.1:hasOccurredEvent ?pse .
?pse Onto4drone_v1.0.1:records ?point_of_interest .
} """)).
|
The sparql() method is used to execute a SPARQL query and obtain the returned results. Because this method returns a generator, the list() function is used to present the results. Finally, even if the implemented framework contains a couple of predefined SPARQL queries, users can execute their own in the Jupyter notebook interface.
5. Discussion
To the best of our knowledge, ReconTraj4Drones is currently the only free and open-source trajectory management tool that implements trajectory reconstruction using geo-tagged photos, semantic annotation, and analytics in reconstructed and enriched semantic trajectories. In
Table 1, an evaluation of related works based on specific criteria is presented. More specifically, the evaluation concerns the capability of related works with respect to trajectory reconstruction using other data sources beyond GPS data, the support of tasks such as segmentation and stop detection, the enrichment of trajectories with external data, their interactive visualization, and finally, the semantic annotation and analytics of the reconstructed semantic trajectories. The columns correspond to the functionalities/tasks, and the rows correspond to the related studies.
By reviewing the related works concerning the reconstruction of trajectories, it can be concluded that they emphasize the trajectory reconstruction process based on (i) geo-tagged photos in sources such as Flickr, (ii) videos, and (iii) users’ posts on social media. However, these approaches do not provide a freely available tool for testing and evaluation. Our aim was to compare the ReconTraj4Drones framework with other implemented frameworks related to trajectory reconstruction using geo-tagged images and to measure its efficiency in terms of time, space complexity, and scalability; however, this was not possible due to the aforementioned reason.
We have evaluated the performance of ReconTraj4Drones using the datasets described in
Section 3.1. The experiments were conducted using a laptop computer with an Intel Core(TM) i7-2670QM 2.2 GHz CPU with 8 GB RAM and a 50 Mbps internet connection. The framework’s evaluation (
Table 2) was based on the following criteria:
Memory used for the reconstruction of raw trajectory (MB).
Memory used for the enrichment process (MB).
Execution time for the reconstruction of raw trajectory (seconds).
Execution time for the enrichment process (seconds).
CPU usage for the reconstruction of raw trajectory (percentage).
CPU usage for the enrichment of raw trajectory (percentage).
RDFization capacity (number of RDF triples).
Despite the successful reconstruction, enrichment, and semantic annotation of drones’ trajectories using ReconTraj4Drones, some limitations and restrictions were identified. A restriction concerns the integration of historic weather data. Particularly, the accuracy of the weather data is at the level of hours (not in minutes). As a result, all the points recorded during the same hour correspond to the same weather data. Regarding the Meteostat Web service, the returned weather data based on altitude were null in most of the cases. Thus, the weather data of the ground were mostly used. Finally, regarding the semantic annotation process, although the Owlready2 library provides an easy and efficient way to load and manipulate ontologies, annotating and semantically analyzing the reconstructed semantic trajectories, the library’s maintenance has been discontinued since 2019.
Concerning the ReconTraj4Drones framework, although the initial requirements were implemented and successfully evaluated, the following limitations are identified and left for future work. First, the framework is able to manage only one trajectory at a time, making it incomplete in terms of the reconstruction of trajectories in a swarm of drones. Second, the implemented framework does not cover advanced trajectory analytics, such as trajectory clustering and prediction of the drone’s movement.
6. Conclusions
The market for UAV applications has been steadily growing, pointing to UAVs’ great potential in a variety of domains, such as the military, precision agriculture, documentation, surveillance, and the delivery of goods/products/services. The management and analysis of drones’ movement data are becoming more and more popular, especially in the era of emerging technologies (IoT, robotics, AI, and big data analytics). Moreover, to derive meaningful information from these data, their semantic annotation and enrichment with external heterogenous data is required. Factors such as unexpected UAV malfunction, extreme weather conditions, or hostile actions (e.g., hacking) can cause incorrect, invalid, or even lost movement/trajectory data, making the trajectory reconstruction from other data (e.g., images, video) a demanding task. To respond to this problem, we have implemented a novel framework that reconstructs semantic trajectories of drones from geo-tagged photos collected during their flights. Moreover, the proposed framework integrates tasks that support the enrichment, segmentation, visualization, semantic annotation, and analysis of the reconstructed (semantic) trajectories. Such functionality has been implemented as an extension to the well-known and widely used MovingPandas platform, as a free and open-source analytic and visualization system of drone’s semantic trajectories called ReconTraj4Drones. The evaluation of the implemented system with real datasets demonstrates that the reconstruction and modeling of drones’ semantic trajectories using geo-tagged images can be efficiently supported by the proposed framework.
