Article

Pavement Structure Characteristics and Behaviour Analysis with Digital Image Correlation

by
Ivana Barišić
*,
Tihomir Dokšanović
and
Matija Zvonarić
Faculty of Civil Engineering and Architecture Osijek, Josip Juraj Strossmayer University of Osijek, Vladimira Preloga 3, 31000 Osijek, Croatia
*
Author to whom correspondence should be addressed.
Appl. Sci. 2023, 13(1), 664; https://doi.org/10.3390/app13010664
Submission received: 15 December 2022 / Revised: 28 December 2022 / Accepted: 31 December 2022 / Published: 3 January 2023
(This article belongs to the Special Issue New Trends in Sustainable Geotechnics—Volume II)

Abstract

:
Digital image correlation (DIC) is a method of point displacement measurement by an optical system. If two cameras are used for capturing the same point displacement, three-dimensional data are obtained using the 3D-DIC method. The areas of application of this method in pavement construction are diverse, but it is mainly used for displacement monitoring during standard tests of the failure of specimens due to load application. Furthermore, DIC technology was used only for testing particular material characteristics and assuming their influence on the overall pavement system. Within this research, DIC was applied in two areas: defining material mechanical characteristics and analyses of pavement structure behaviour under cyclic loading. The scope of this research was to gain more insights into DIC’s potential application within pavement behaviour analyses, specifically on cement-bound granular material (CBGM) characterisation. Results from this study confirm the suitability of 3D-DIC technology for pavement material characterisation. Furthermore, it is shown that certain trends of material behaviour defined on the simple material level of each independent pavement layer will significantly differ when it is placed in the system, and this kind of complex analysis is possible by using 3D-DIC technology.

1. Introduction

The development of technology, apart from being especially useful in improving the quality of our lives and making everyday life easier, also leads to progress in scientific processes and research. One such technology is digital image correlation (DIC), which has been used in various civil engineering research areas in the last few years. This modern and innovative research method also shows its potential in geotechnical engineering and pavement structure testing. DIC is the method for measuring in-plane displacements by using an optical system composed of digital cameras, a light source, and a computer for data acquisition [1]. This method can also be used for the observation of out-of-plane deformation by using an additional camera. The two cameras then capture the same point, giving three-dimensional data, and the method is called 3D-DIC. Within geotechnical engineering, DIC is mainly used for a very precise measurement during material characterisation. It was used for the basic size parameters of geo-material particles’ measurement [2], for its microstructure characteristics [3], and for its physical and micromorphological characterisation [4]. The areas of application of this method in pavement construction are diverse, considering that most tests of road construction materials entail the failure of specimens due to load application, while the displacement is monitored. DIC serves precisely the monitoring of these displacements. The application of the DIC method in the research of asphalt and concrete pavements has increased during the last few years. Yi-Qiu et al. [5] pointed out the usefulness of the information obtained by the DIC technology during asphalt testing. Behnke et al. [6] used DIC for measuring the displacement of asphalt cylindrical specimens exposed to uniaxial compressive tests. Jiang–San et al. [7] used the DIC method for the analysis of fatigue cracks in asphalt pavement exposed to freeze–thaw cycles. Furthermore, the DIC method was used for monitoring crack development due to the indirect tensile strength of RAP asphalt specimens [8]. In their review paper, Du et al. [9] emphasised the advantages of DIC over linear variable differential transformers due to the unpredictability of the local damage location.
As a result of the application of DIC during the semi-circular bending (SCB) test, Wu et al. [10] were able to identify three phases of the crack development process. The reinforcement effect of different fibres on the asphalt mixture was employed by using the fracture curve of the SCB test and DIC method by Yang et al. [11]. Radeef et al. [12] used DIC to quantify the impact of different asphalt modifiers (crumb rubber and plastic waste) on the size of the plastic zone of the material by monitoring crack development by the SCB test. The definition of the load rate at which it is possible to observe the mechanism of fracture and creep deformation for the evaluation of the low-temperature performance of an asphalt mixture was obtained by this method [13]. The DIC technology was applied in the analysis of ageing and modifiers’ effect based on SCB test samples in [14]. The use of the 3D-DIC technology over the 2D-DIC technology due to SCB testing was emphasised by Yuan et al. [15]. Due to significant out-of-plane displacements, the 2D-DIC technology proved to be unsuitable due to only in-plane measurements being possible.
The DIC method has been shown to be as appropriate for thermal expansion measurement as the grid method, but DIC requires more computational resources [16].
This method can also be used on larger samples, such as asphalt slabs, not only on standard cylindrical and semi-circular specimens, which expands its application field [17,18,19]. The slabs provide us with results more similar to real conditions. The usefulness of this method was highlighted in the work of Freire et al. [18], where the development of cracks on the asphalt slab reinforced by various geogrids was monitored. The visual method enabled the definition of the crack progression path, which was detected along the length of the geosynthetics used for reinforcement, and classified it as a weak zone in the structure [19].
Besides asphalt pavements, the DIC technology can also be used in concrete pavement analysis. Several research projects have dealt with monitoring the fracture mechanism of concretes by DIC [20,21,22,23,24,25,26]. Golewski [20,21] precisely traced the development of intra-material cracks in concrete made of quaternary binders exposed to fracture toughness tests. Additionally, the same author developed a new method for the determination of the actual crack path length during a shear test conducted on concrete specimens and monitored by DIC [22], proving the suitability of the method for the determination of the fracture toughness of concrete specimens [23]. Li et al. [24] determined a critical opening displacement of a concrete specimen by the Bažant Crack Band Model, which was followed by the use of the DIC method for defining the displacement fields on the concrete specimen surface. Lian et al. [25] used DIC methods for the analysis of the fracture mechanisms and fracture characteristic parameters during three-point bending tests. Vaghela and Vesmawala [26] categorised the DIC method as effective for monitoring displacement and crack length due to fracture testing. The DIC technology was also used in evaluating the sensitivity of concrete to elevated and low temperatures. Thus, this method was used in [27] to monitor the propagation of cracks in concrete exposed to elevated temperatures and, in [28], in concrete exposed to low temperatures. It should be pointed out that in the research presented in [28], the 3D-DIC technology was used, and the satisfactory matching of the crack propagation paths detected by the 3D-DIC method with the actual situation was highlighted; in the research presented in [27], 2D-DIC was used, and as such, it was assessed as suitable for monitoring crack propagation. Abbassi and Ahmad [29] emphasised the potential of 3D–DIC as a replacement for conventional tools for strain determination due to it providing rich data for analysis. Furthermore, the suitability of the method for establishing the stress and strain curve during the compression test was highlighted [27,30]. The DIC technology has also proven to be useful in this area in combination with the strain gauge measurement system. The advantage of this procedure means the possibility of monitoring the crack development caused by the expansion of the reinforcing element due to corrosion [31]. Due to the lack of a standard procedure for the optimisation of the 2D-DIC parameters, Lie et al. [32] established parameters for concrete structures at three accuracy levels, which can be used as a source of reference in concrete testing.
Besides laboratory testing, the DIC technology can be used even on structural members. Thus, Zhou et al. [33] used the DIC technology in combination with the Daubechies wavelet when testing concrete beams. The suitability of this approach was highlighted; as disadvantages, they cited the impossibility of conducting such a test on very large structures such as bridges and dams, and they also pointed out the problem of the impossibility of using artificial light on such structures. The DIC technology found its place, also, in pervious concrete testing for pavement application. In their work, Meng et al. [34] used DIC for crack generation and propagation detection in geogrid-reinforced pervious concrete. Furthermore, this technique was used to monitor crack development based on a cylindrical specimen of cement-stabilised material with steel fibres during indirect tensile loading. As a result, the CAD tool captured pictures to estimate the crack lengths [35]. The possible combination of the DIC with a scanning electron microscope (SEM) was also encouraged in [36].
From the presented literature overview, it can be concluded that the DIC technology has no boundaries to its usefulness in the detection, observation, and evaluation of cracks in various pavement materials or in the microstructure and micromorphological characterisation of various geotechnical and pavement materials. However, within pavement structure analyses, the DIC technology has been used only for testing particular material characteristics and assuming their influence on the overall pavement system. Within this research, DIC is applied in two areas: defining material mechanical characteristics (modulus of elasticity) and analyses of pavement structure behaviour under cyclic loading. The scope of this research is to gain more insight into DIC’s potential application within pavement behaviour analyses as a modern and incredibly useful tool. Specifically, DIC applied on cement-bound granular material (CBGM) characterisation was aimed at gaining more information on its characteristics and understanding its behaviour and influence on the pavement structure. The specific aim of this research was to introduce a novel approach to pavement structure analyses looking at the behaviour of the system, as opposed to the current trend of researching individual system materials. The core purpose of this research was to introduce a novel approach to pavement and geotechnical materials’ characterisation. This paper presents an innovative approach to pavement structure testing and distinguishes itself in addressing pavement material characteristics through comprehensive pavement behaviour analyses. The innovative approach is introduced by moving from simple material characterisation to comprehensive pavement system analyses considering the characteristics of individual layers and their interaction under load.

2. Materials and Methods

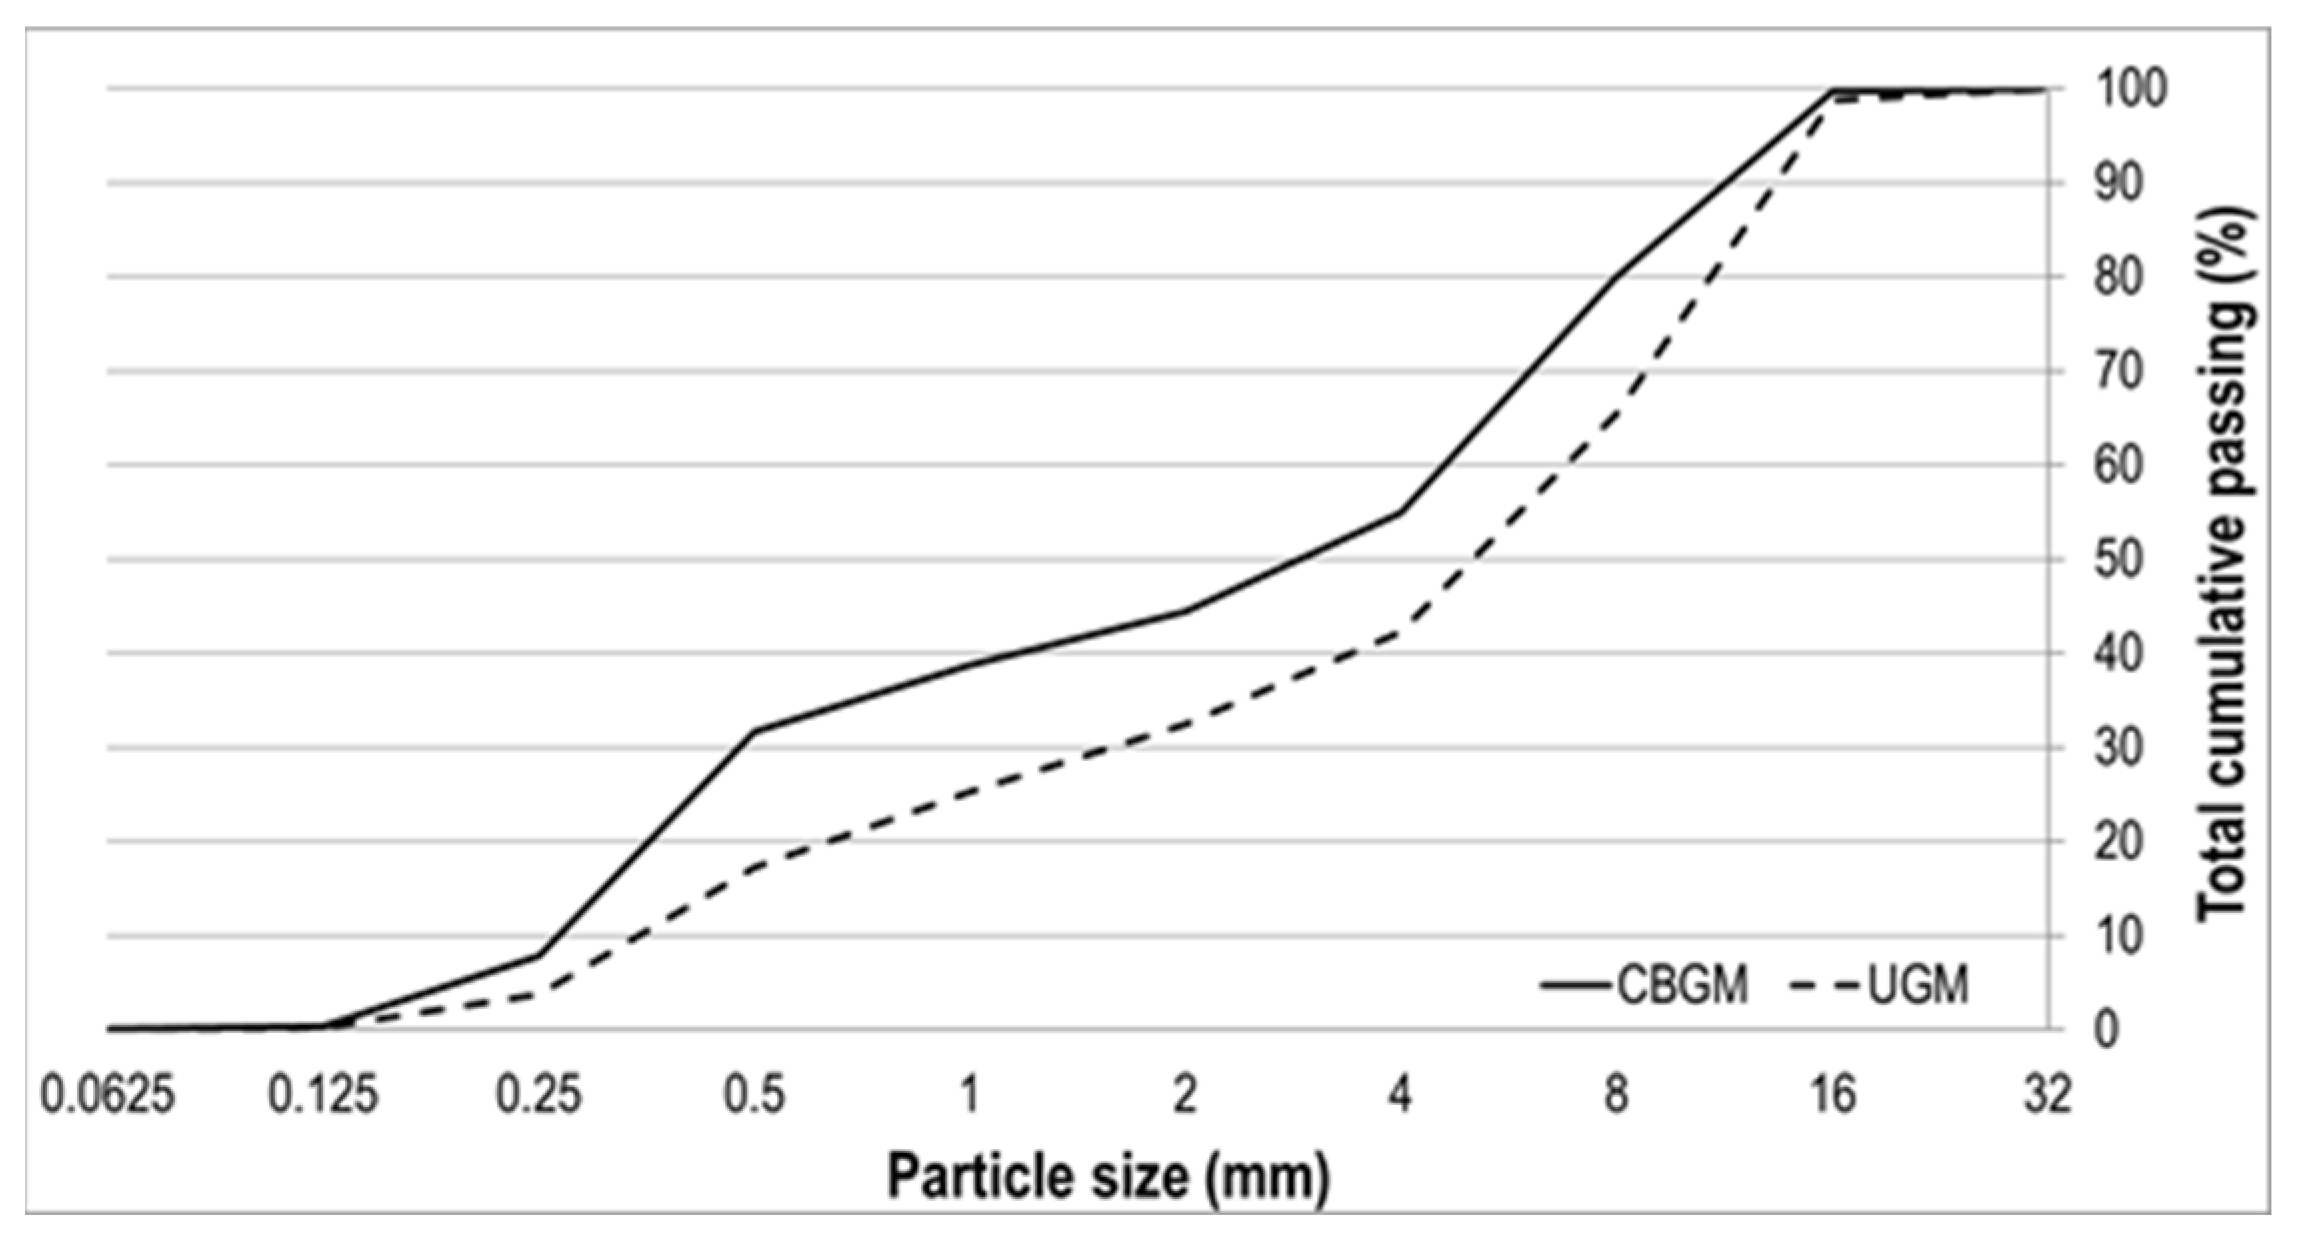
2.1. Materials and Samples

For CBGM characterisation, natural river gravel (Figure 1) was used with cement CEM II/B-M (P-S) 32.5R as a binder in 3%, 5%, and 7% of aggregate dry mass. Optimal water content (OWC) and maximum dry density (MDD) were defined by EN 13286-4 [37]. For 3%, 5%, and 7% cement content, OWC was 4.91%, 5.35%, and 5.53%, respectively, while MDD was 2.08 g/cm3, 2.12 g/cm3, and 2.15 g/cm3, respectively. For compressive strength and the elastic modulus of elasticity, cylindrical samples (diameter of 10 cm and height of 12 cm) were made according to the standard EN 13286-51 [38]. Three samples of each kind were made and cured for 28 days in a temperature- and humidity-controlled chamber (20 °C and 90% relative humidity) for a compressive strength test conducted according to EN 13286-41 [39]. During the compressive strength test, 3D-DIC was used for displacement measurement and the modulus of elasticity calculation following the guidelines from EN 13286-43 [40].
For the testing behaviour of a three-layer pavement structure, 3D-DIC was applied for pavement system monitoring. For this test, the pavement structure setup was comprised of unbound granular material (UGM), CBGM, and an asphalt-wearing course (Figure 2). The UGM course was made of a natural river gravel with the grain size distribution presented in Figure 1. The optimal moisture content and maximum dry density determined according to EN 13286-4 [37] were 4.79% and 2.01 g/cm3. The UGM was inbuilt by a vibrating hammer in mould with dimensions of 50 × 50 × 10 cm covered with geotextile, controlling the mass and geometry of the inbuilt material and calculating the water content and density of the unbound base layer after compaction. The UBM courses were made in such a way that their humidity deviated up to 1% from the optimum and with a degree of compaction up to a minimum of 98%. For each mixture, one sample of the UGM was made to reduce the influence of variations in the quality of this layer on the test results, but also to rationalise the amount of material and the time required for making the samples. As for the mechanical characteristics’ test presented earlier in the text, the CBGM course was made with the same materials. The CBGM was inbuilt in mould dimensions of 45 × 35 × 10 cm, in one layer by vibrating hammer compaction for 10 min. After compaction, the samples were left in the mould for 24 h and, then, unmoulded and cured for 27 days by covering them with wet cloth at room temperature. The wearing course was simulated by AC 11 surf slab dimensions of 40 × 35 × 4 cm, and it was made according to EN 12697–33 [41]. As an aggregate for the asphalt mixture, eruptive stone was used according to standard EN 13043 [42]. Before the test, the surface of the asphalt slab samples was painted white to increase the contrast between the points on the surface that were monitored by the 3D-DIC system, so as to make it easier to recognise the stochastic pattern. For each cement content, three pavement structure setups were made.

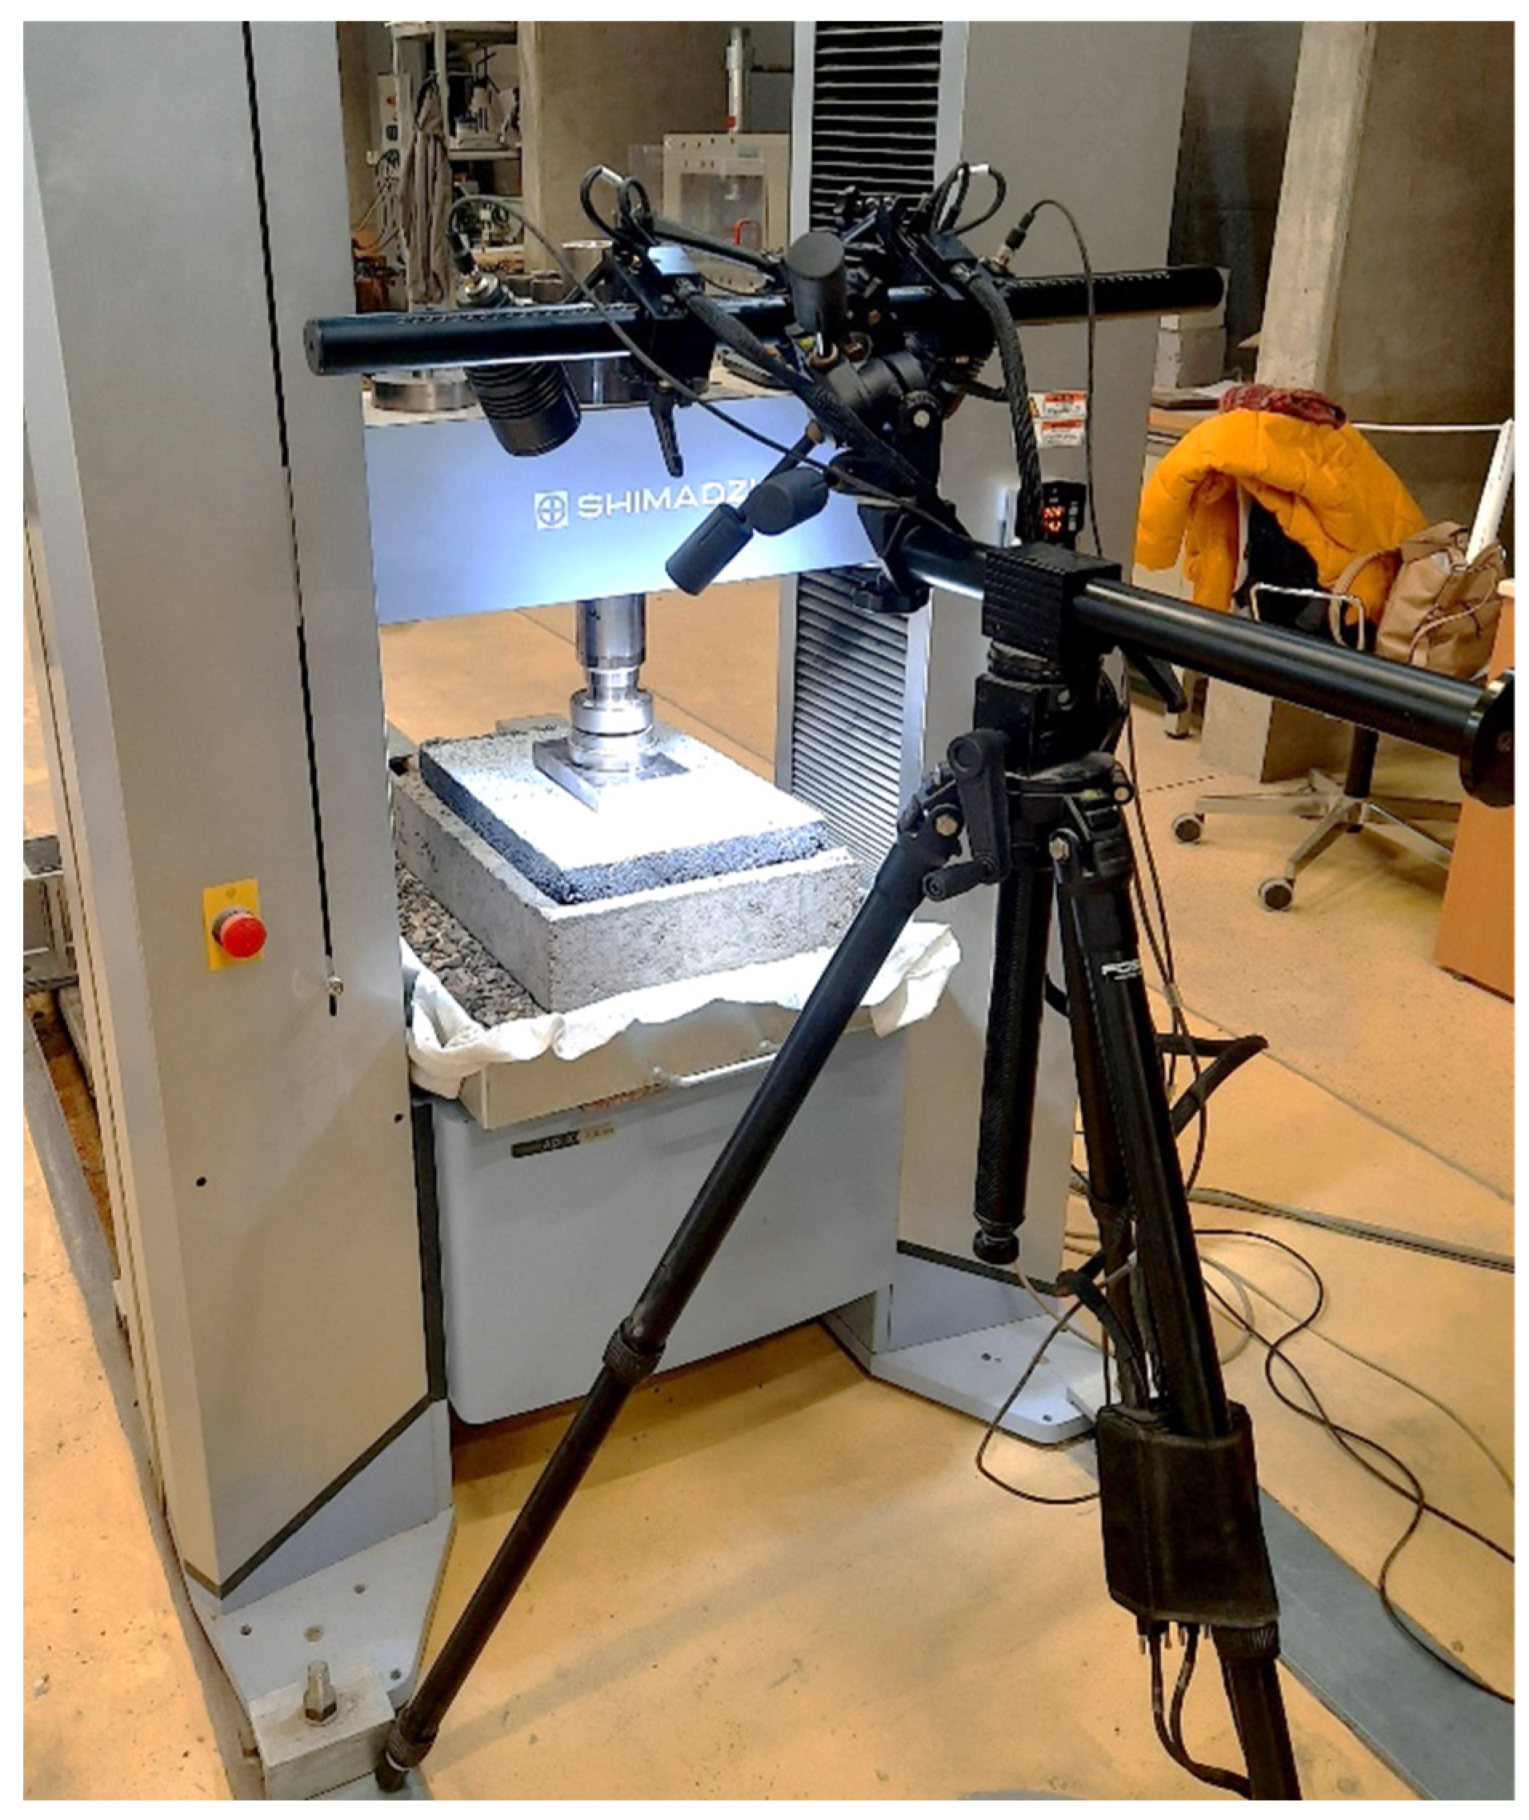
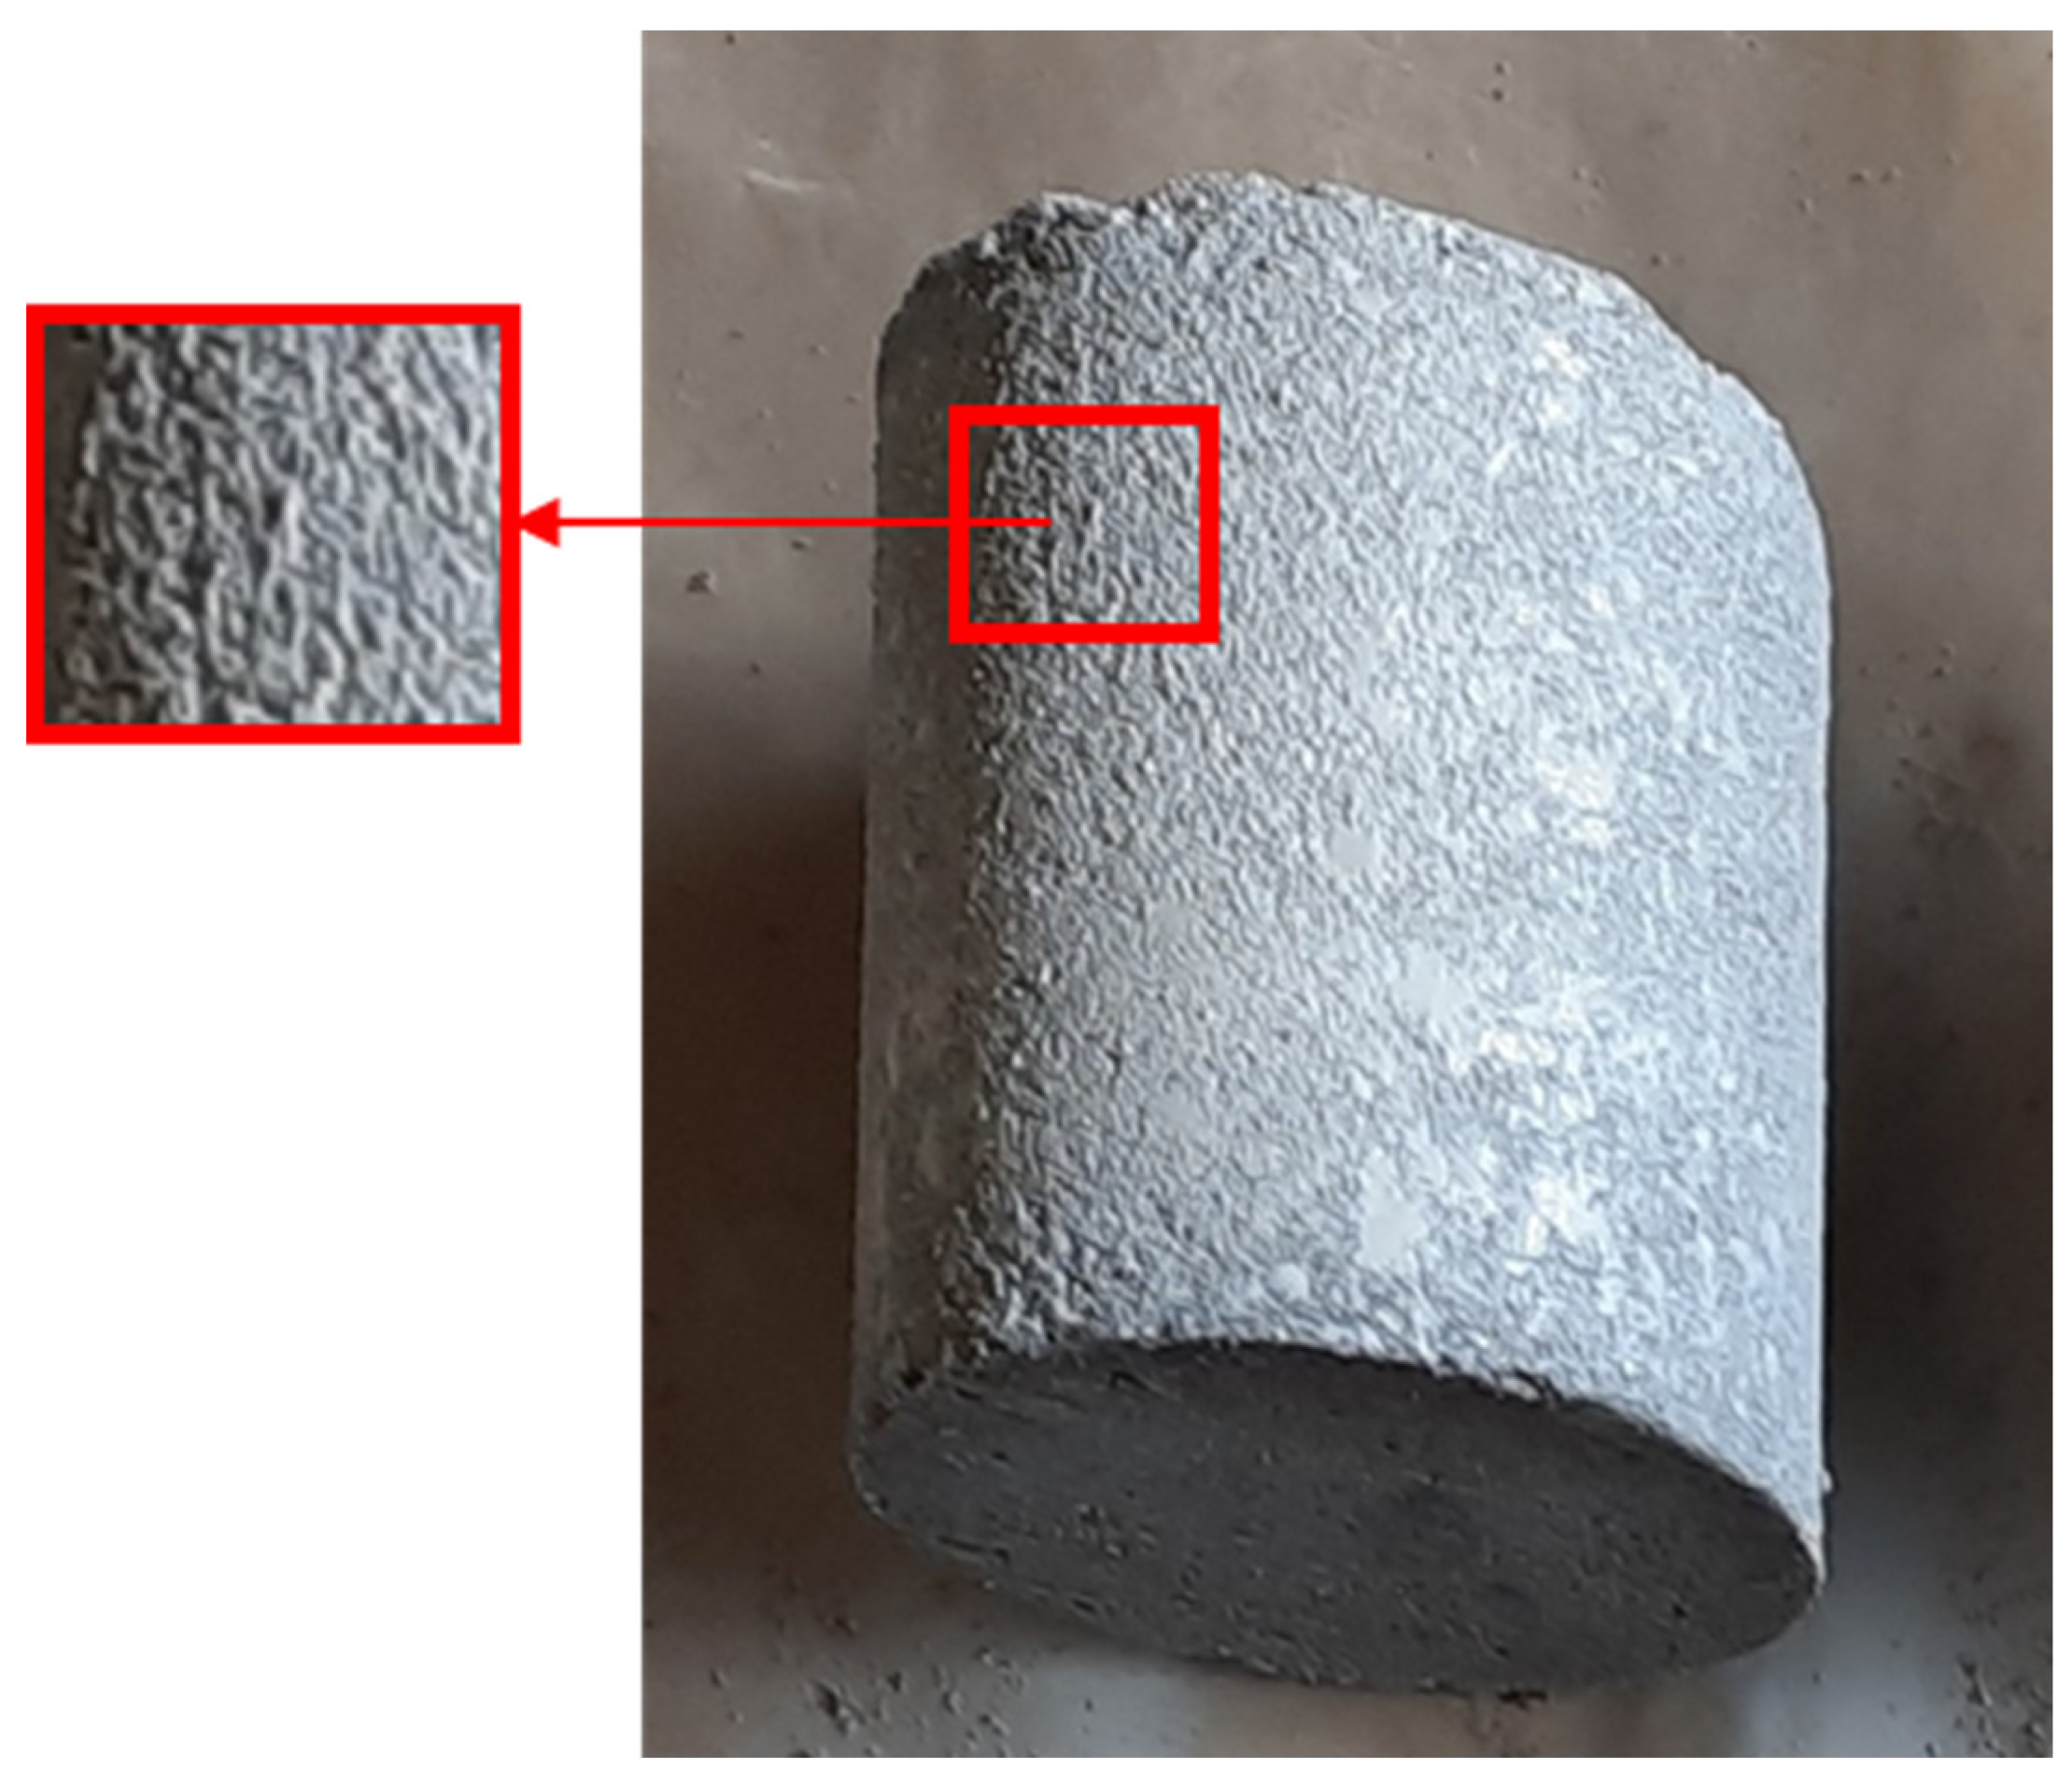
2.2. Spatial Digital Image Correlation (3D-DIC System)

Digital image correlation is an optical system for measuring displacement and determining the surface deformations of the observed object, regardless of the type of material. Generally, it is a system composed of equipment for measuring and collecting data and a software package for their analysis and processing. Within this research, the Aramis 3D optical deformation analysis system, developed by Gesellschaft für optische Messtechnik (GOM) was used. The basic units of the system are a sensor with two cameras (for 3D measurements), a stand for cameras with LED lighting, a camera controller and power supply, and a computer with a software package (Figure 3). Using Aramis, it is possible to monitor the experiment with high temporal and spatial resolution, thus replacing many common measuring devices (extensometer, LVDT, strain gauge measuring tapes, etc.), and it is easy to integrate with existing equipment using analogue or digital inputs and outputs, which significantly speeds up the instrumentation and testing process. After processing the measurement results, the program package provides the possibility of a graphical display of the desired data, which enables a better understanding of the behaviour of the measured object. The main advantage of this system compared to classic testing methods is that it is contactless. This prevents the contact between an extensometer and the specimen to be compromised during loading due to the roughness of the surface and slight movements, which makes it particularly suitable for pavement material testing.
The digital cameras used in this research support a resolution of 2448 × 2050 pixels and are equipped with a CCD chip. The lenses have a focal length of 12 mm, and they are set at an angle relation of 25°. To ensure a full view of the specimen volume during all loading stages, the cameras were mounted at 280 mm from the cylinder face and were set to form 86 mm between each other. For this camera alignment, 0.005 mm2 on the specimen surface represents a pixel on the image. With the given hardware components, a strain accuracy of up to 0.01% was established, which was at all times controlled by the unit software monitoring of the mean points’ intersection deviation, which was kept lower than 0.1 pixels [43]. The testing preparation included volume determination, system calibration, and specimen treatment. The calibration of the cameras was performed using a certified, coded calibration panel. Specimen treatment was performed by applying a white-colour spray stochastic pattern, since the specimen surface lacks contrast in its natural state.
The standardised method EN 13286-43 [40] defines testing the CBGM modulus of elasticity. The guidance in this standard suggests that the modulus can be determined from compressive strength tests, direct tensile tests, or indirect tensile tests. Although these static test methods are usually used to characterise the CBGM, there are numerous difficulties and problems in the very procedure of testing and measuring the modulus of elasticity. The biggest challenge is the correct measurement of the displacement given the rough, uneven, and, at times, loose surface of the samples (Figure 4). As pointed out in [44], test results can be inconsistent, varying greatly among samples within the same mixture, making this method difficult and time-consuming. Therefore, in this research, the 3D-DIC method was applied for the non-contact measurement of sample displacements and deformations with the calculation of the modulus of elasticity according to the specified norm.
For the pavement structure test, the contact surface between the tire and pavement was adopted as an equivalent rectangular surface, while its actual shape depends on the axle load and inflation pressure (tire air pressure). The tire pressure of heavy goods vehicles is usually taken to be around 700 kPa and ranges from 500 to 1000 kPa. For traffic load simulation, stress values on the road surface of 750 kPa were adopted, and that value was increased in increments of 250 kPa until the value of 1500 kPa, so as to cause significant system damage. In that way, the CBGM can be characterised according to the cement content and influence on the pavement system. On the other hand, a gradual increase in stress provides insight into the gradual change in the stiffness of the layers concerning the disturbance of their properties. Since it is known that the opening and propagation of open cracks can occur at unchanged stress, but at its repetition, for each of the amounts of stress, 50 cycles of unloading and loading were repeated. Each of the 50 cycles at 4 set stresses was controlled in the same way: the stress was increased in increments of 250 kPa/s to the set value, and then, this value was maintained for 5 s, followed by unloading in increments of 250 kPa/s. Thus, a total of 200 load–unload cycles were made for each of the samples. The simulation of the contact surface of the tire and the pavement was performed with a rectangular steel plate measuring 114 × 166 mm. For each of the samples during the test, the response was recorded in the form of force and vertical displacement from the loading machine, as well as a recording of the surface by the DIC system.

3. Results and Discussion

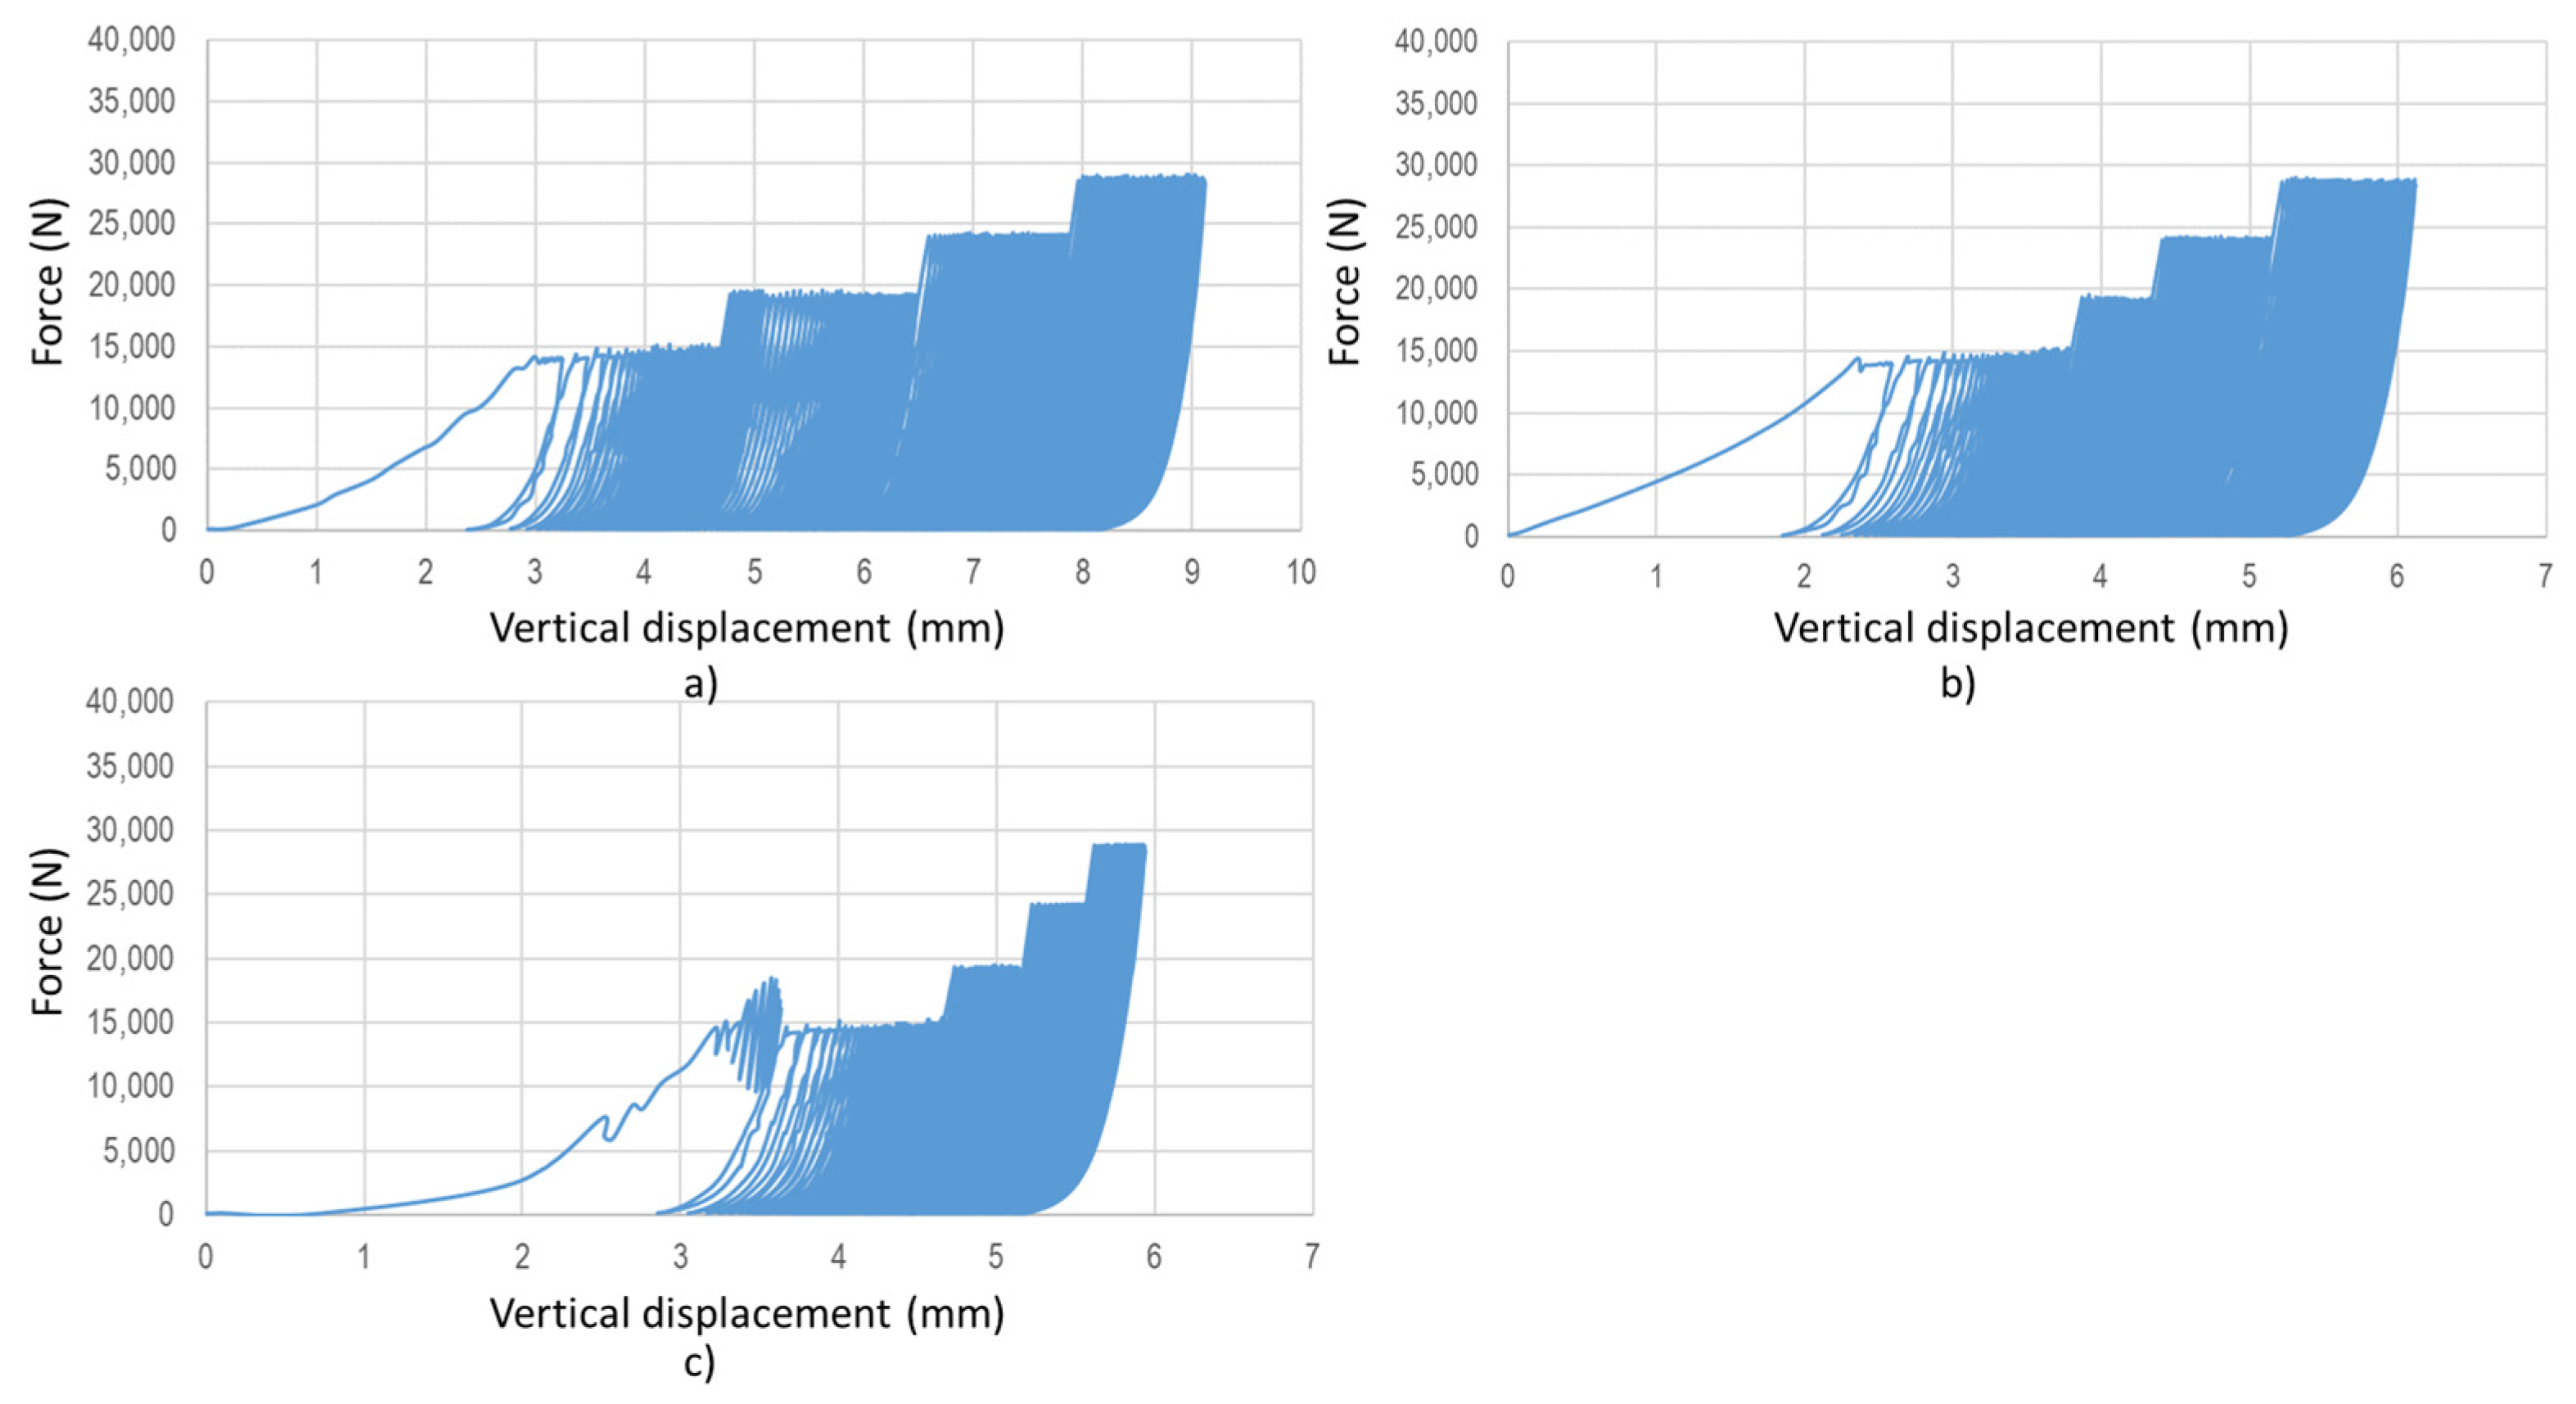
3.1. Compressive Strength and Elastic Modulus of Elasticity

The objective of this research was to gain more insight into potential 3D-DIC applications on pavement materials and structure characterisation. For that, well-known materials are used, with known and expected values of mechanical characteristics (28-day compressive strength and modulus of elasticity). Therefore, the presentation and discussion of the results are oriented toward discussing the techniques used and the evaluation of their suitability and applicability within pavement structure characterisation.
The results of the 28-day compressive strength (fc) and modulus of elasticity determined by 3D-DIC (E) are presented in Table 1. The results represent the average value of three samples of each kind with a variation coefficient of less than 10%.
From the results presented in Table 1, an increase in fc and the modulus of elasticity is recorded with the increase in cement content. For most pavement purposes, a 28-day compressive strength of 2.5–6.5 MPa is required, depending on the expected traffic load. As expected, the mixture with the 7% cement content reached strength values higher than 6.5 MPa, and it was used within this research as an extremely rigid layer within the pavement structure for the 3D-DIC analyses. The modulus of elasticity determined by 3D-DIC ranged from 3.4 GPa to 12 MPa, which is in accordance with the expected values. For compressive strength ranging from 3.8 to 12 MPa, the modulus of elasticity was recorded to be 7–14 GPa [45], while in [46], values of 1–20 GPa, depending on the material properties and the testing conditions, were recorded. As confirmed by the relevant data, the results presented in Table 1 were used for the pavement structure’s 3D-DIC discussion and verification.

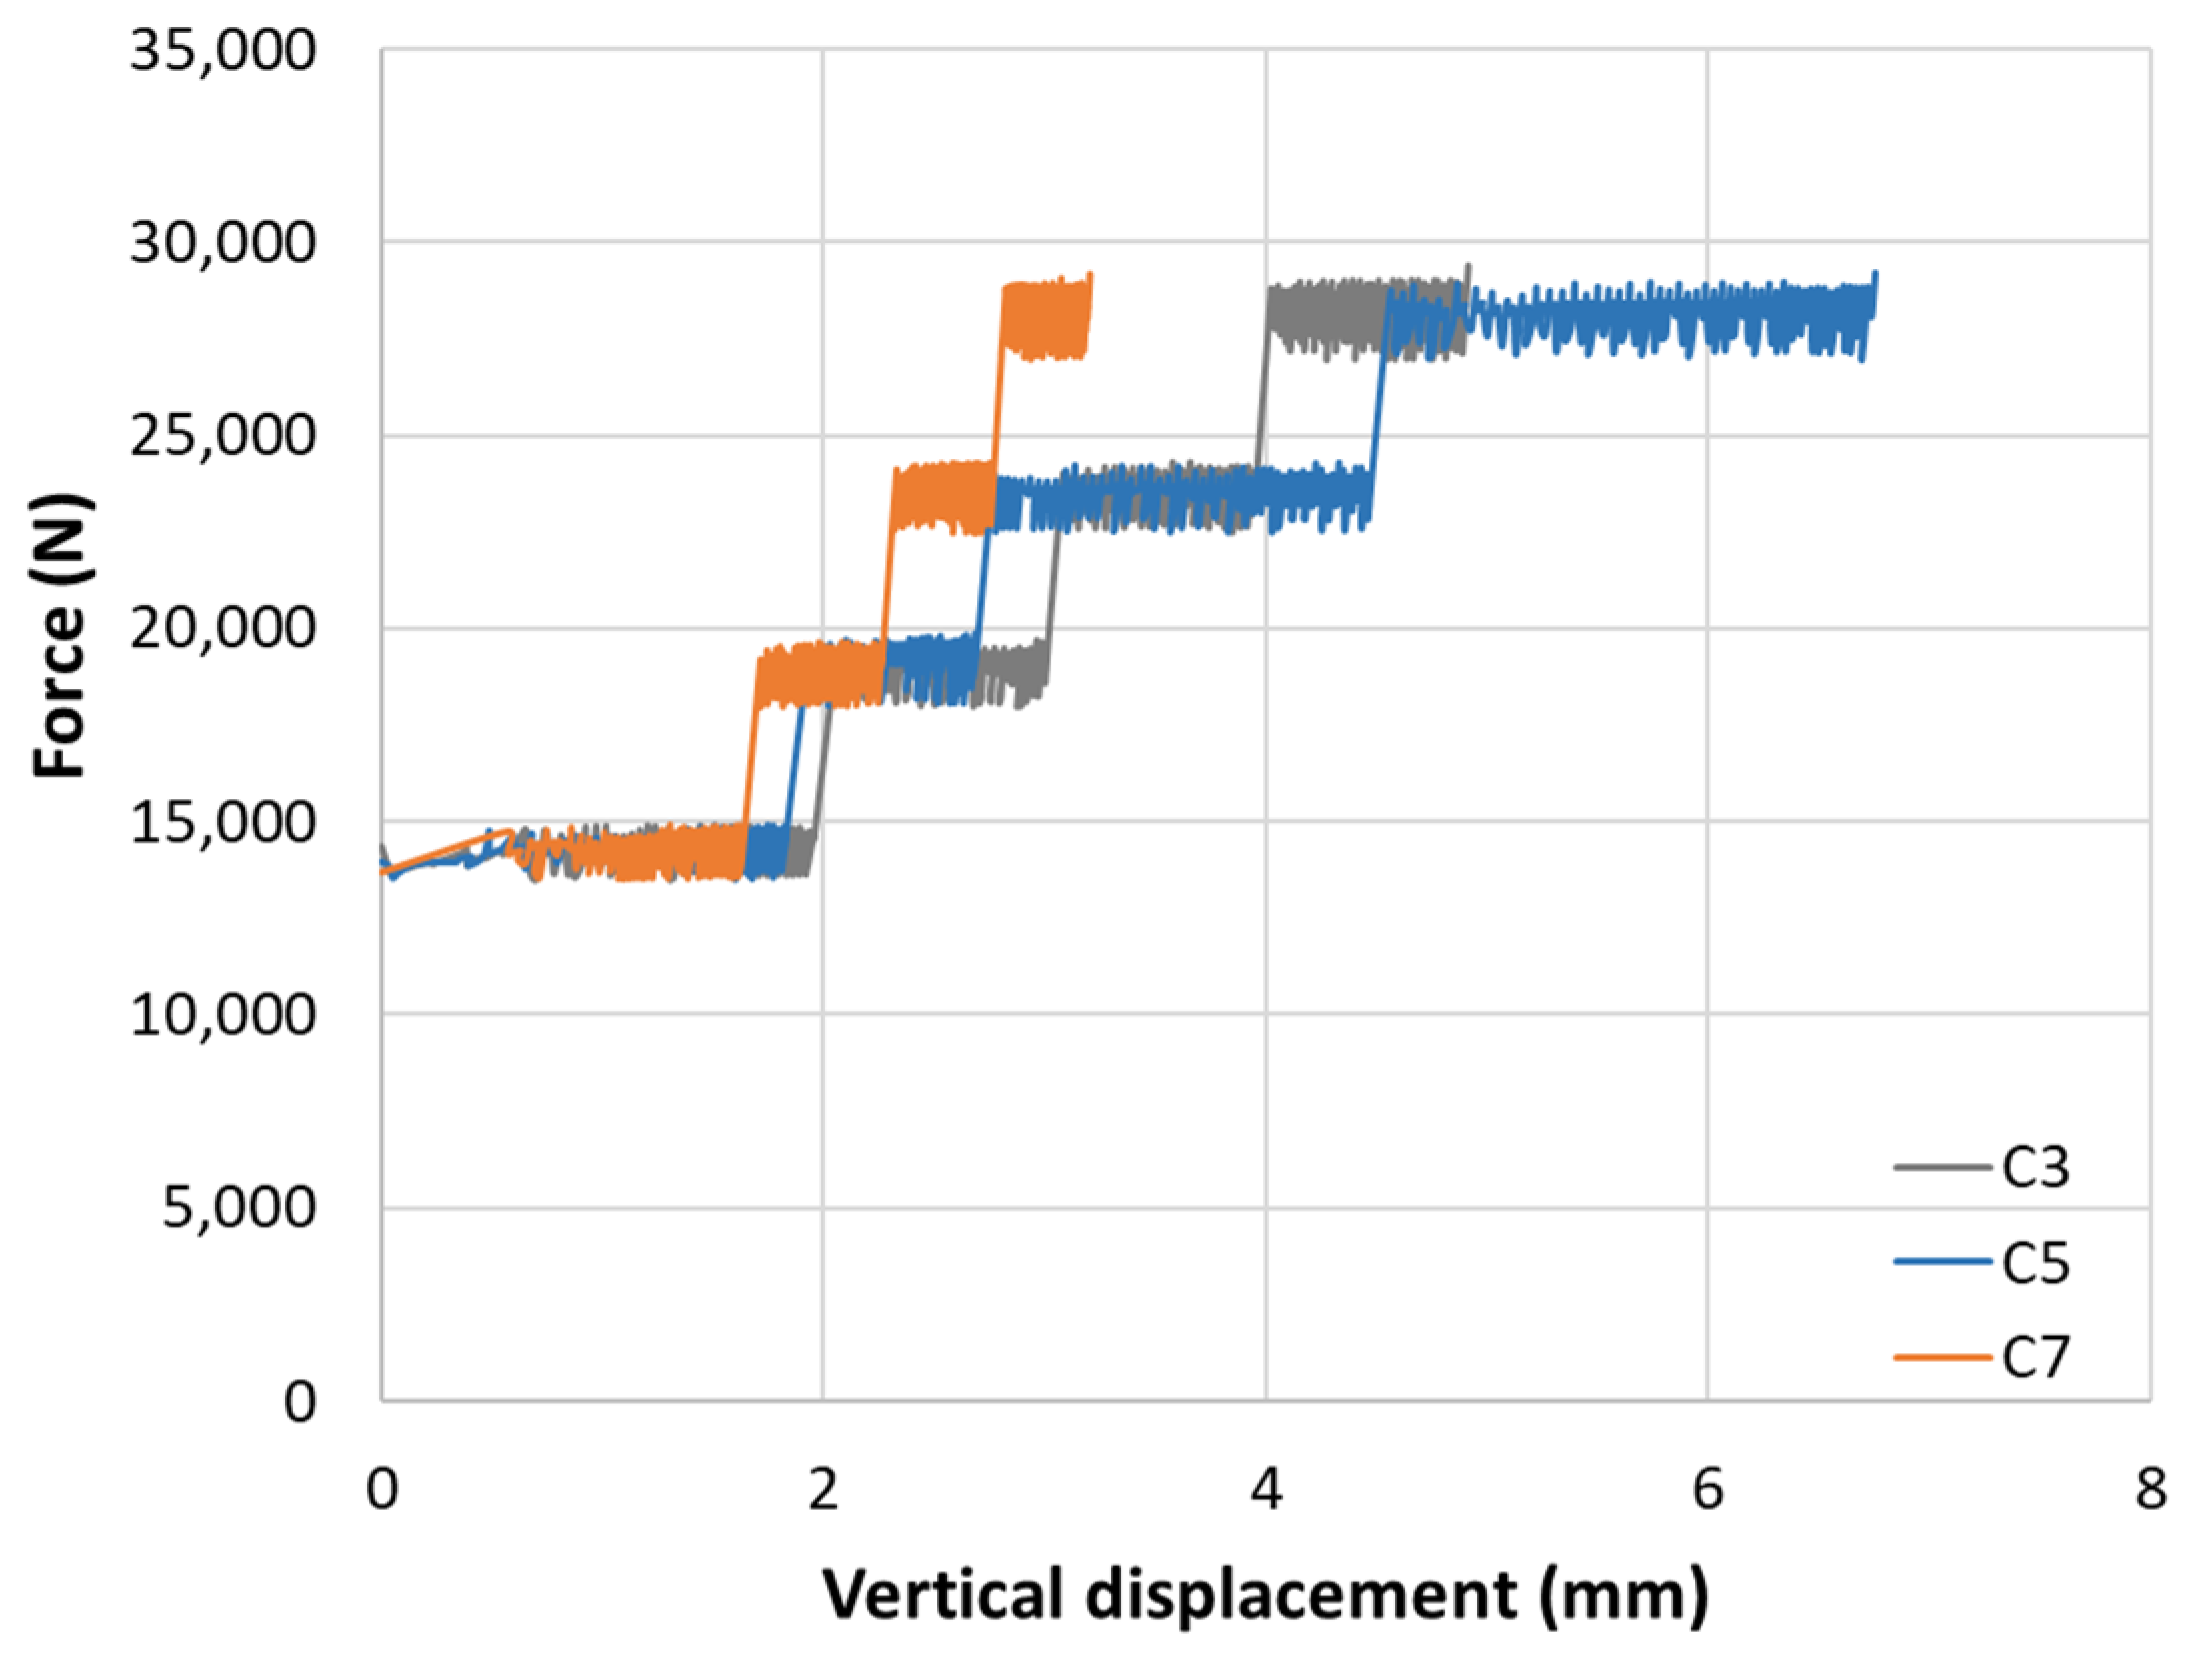
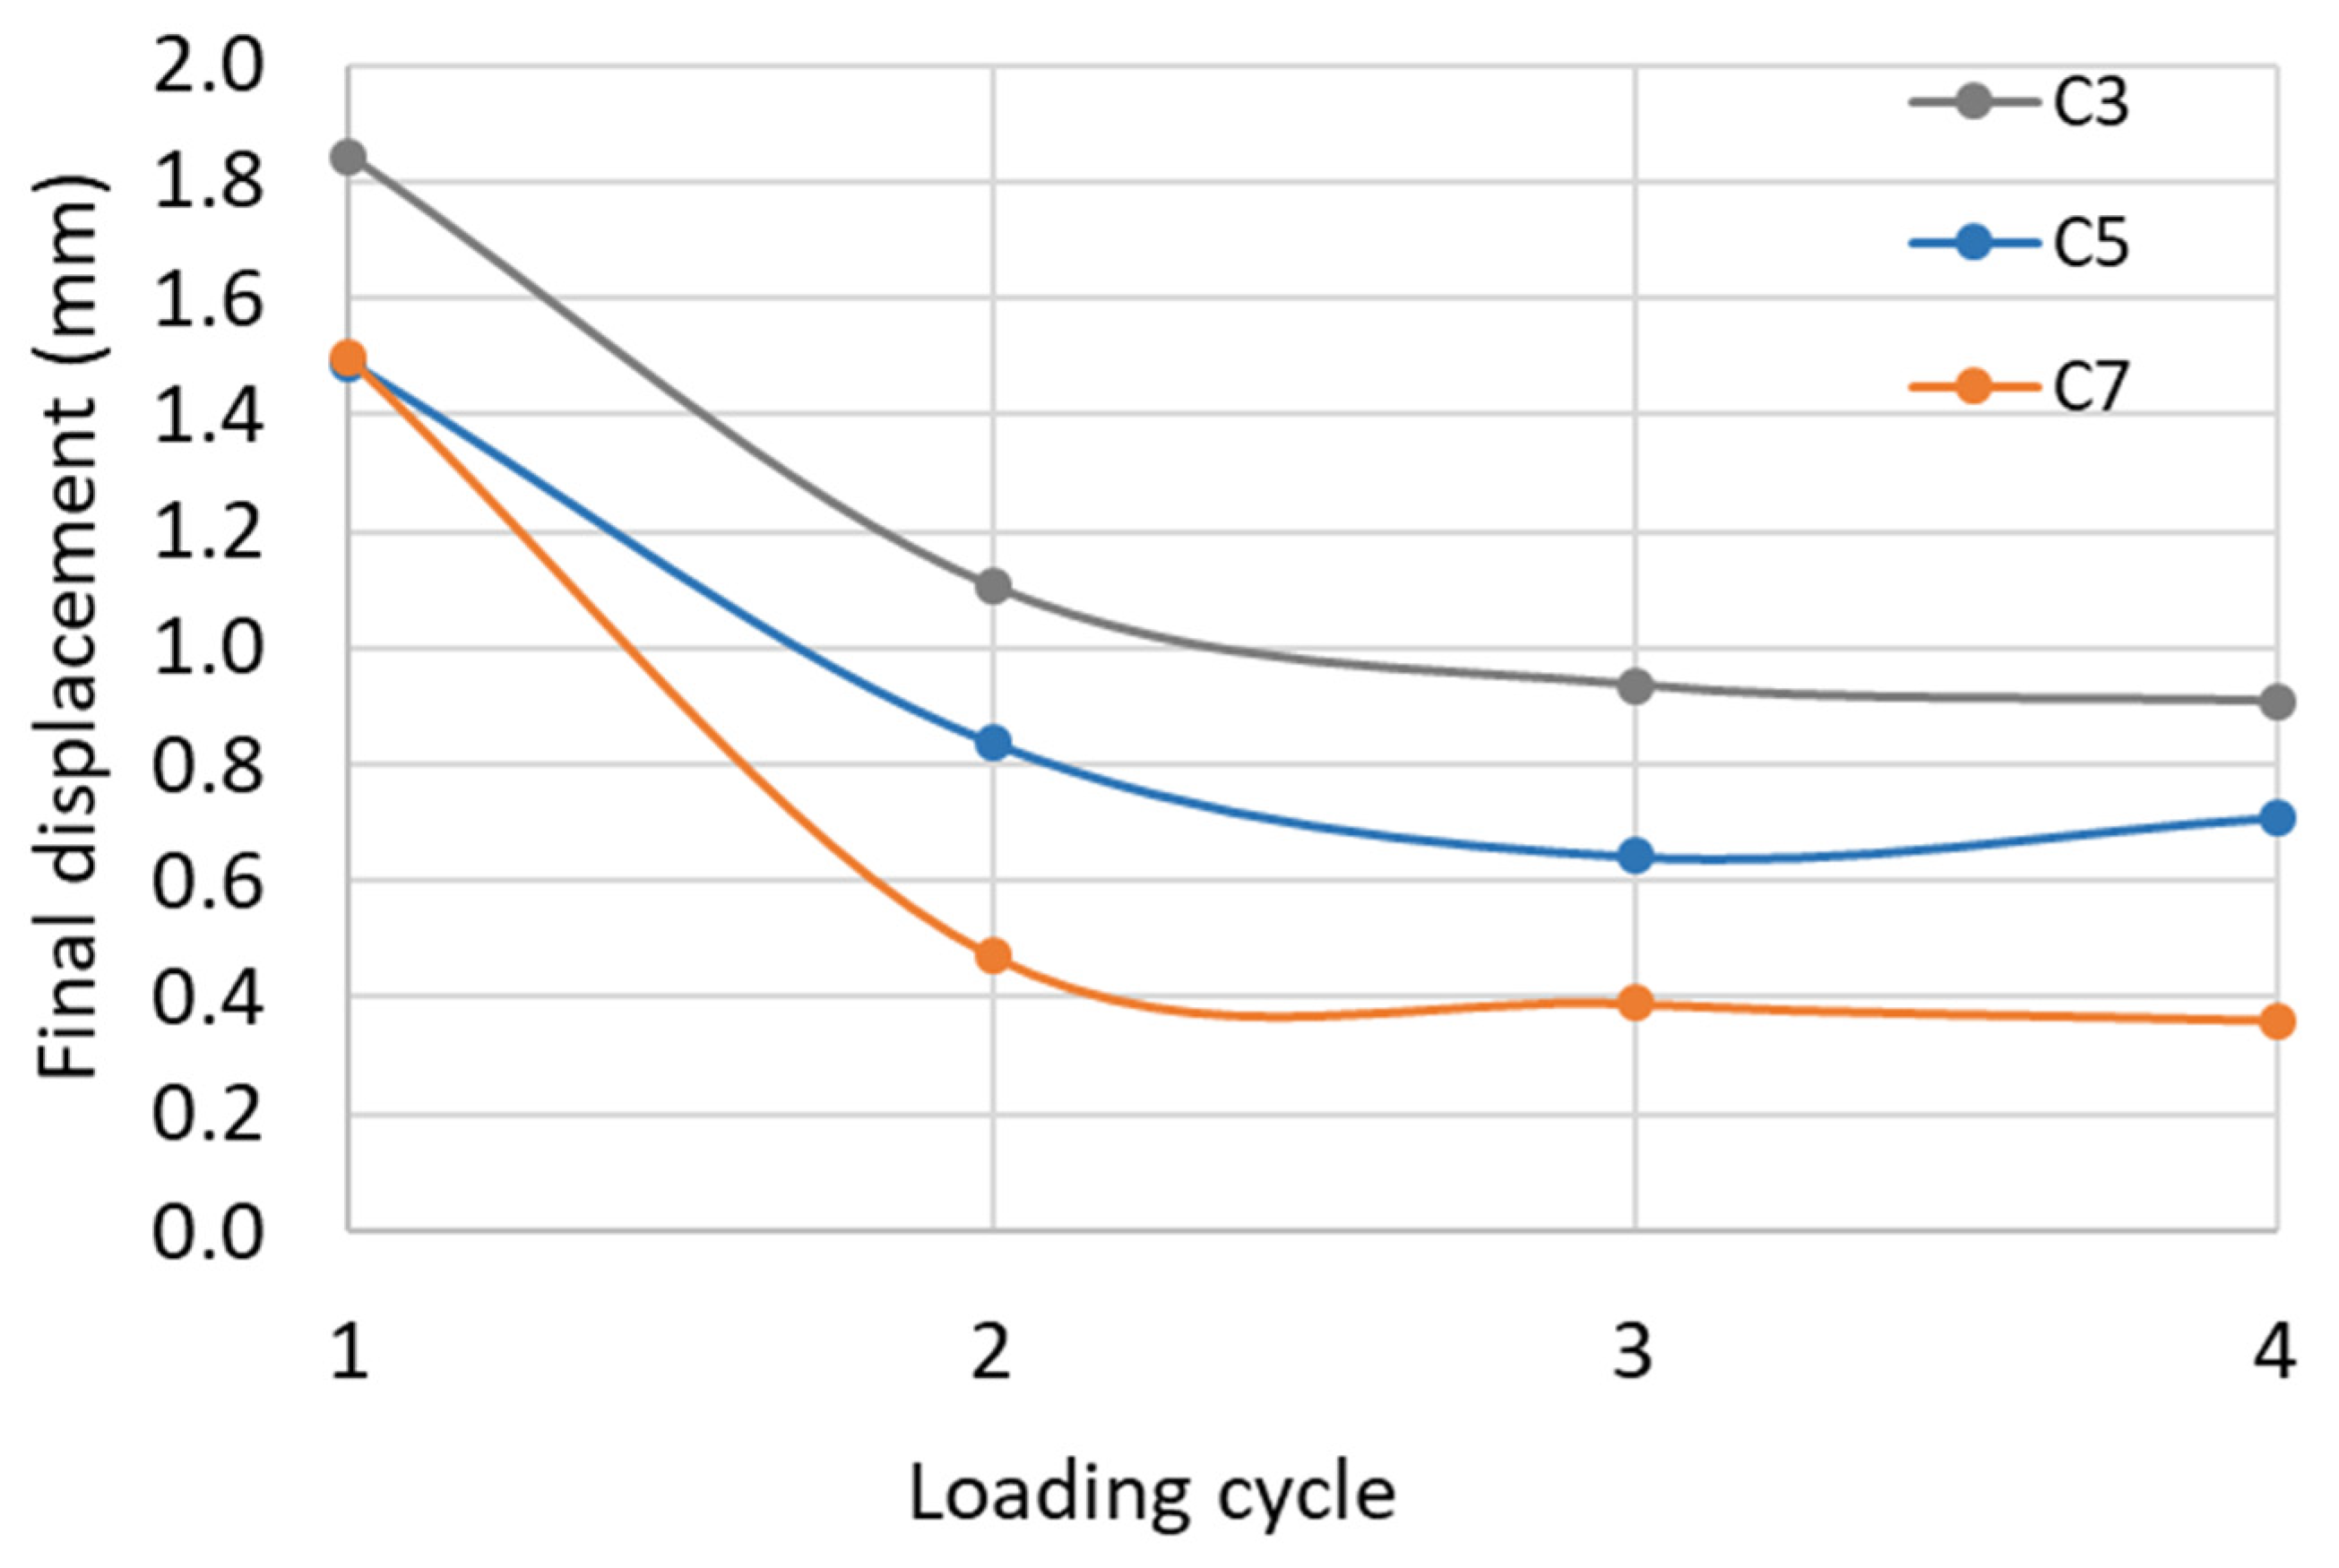
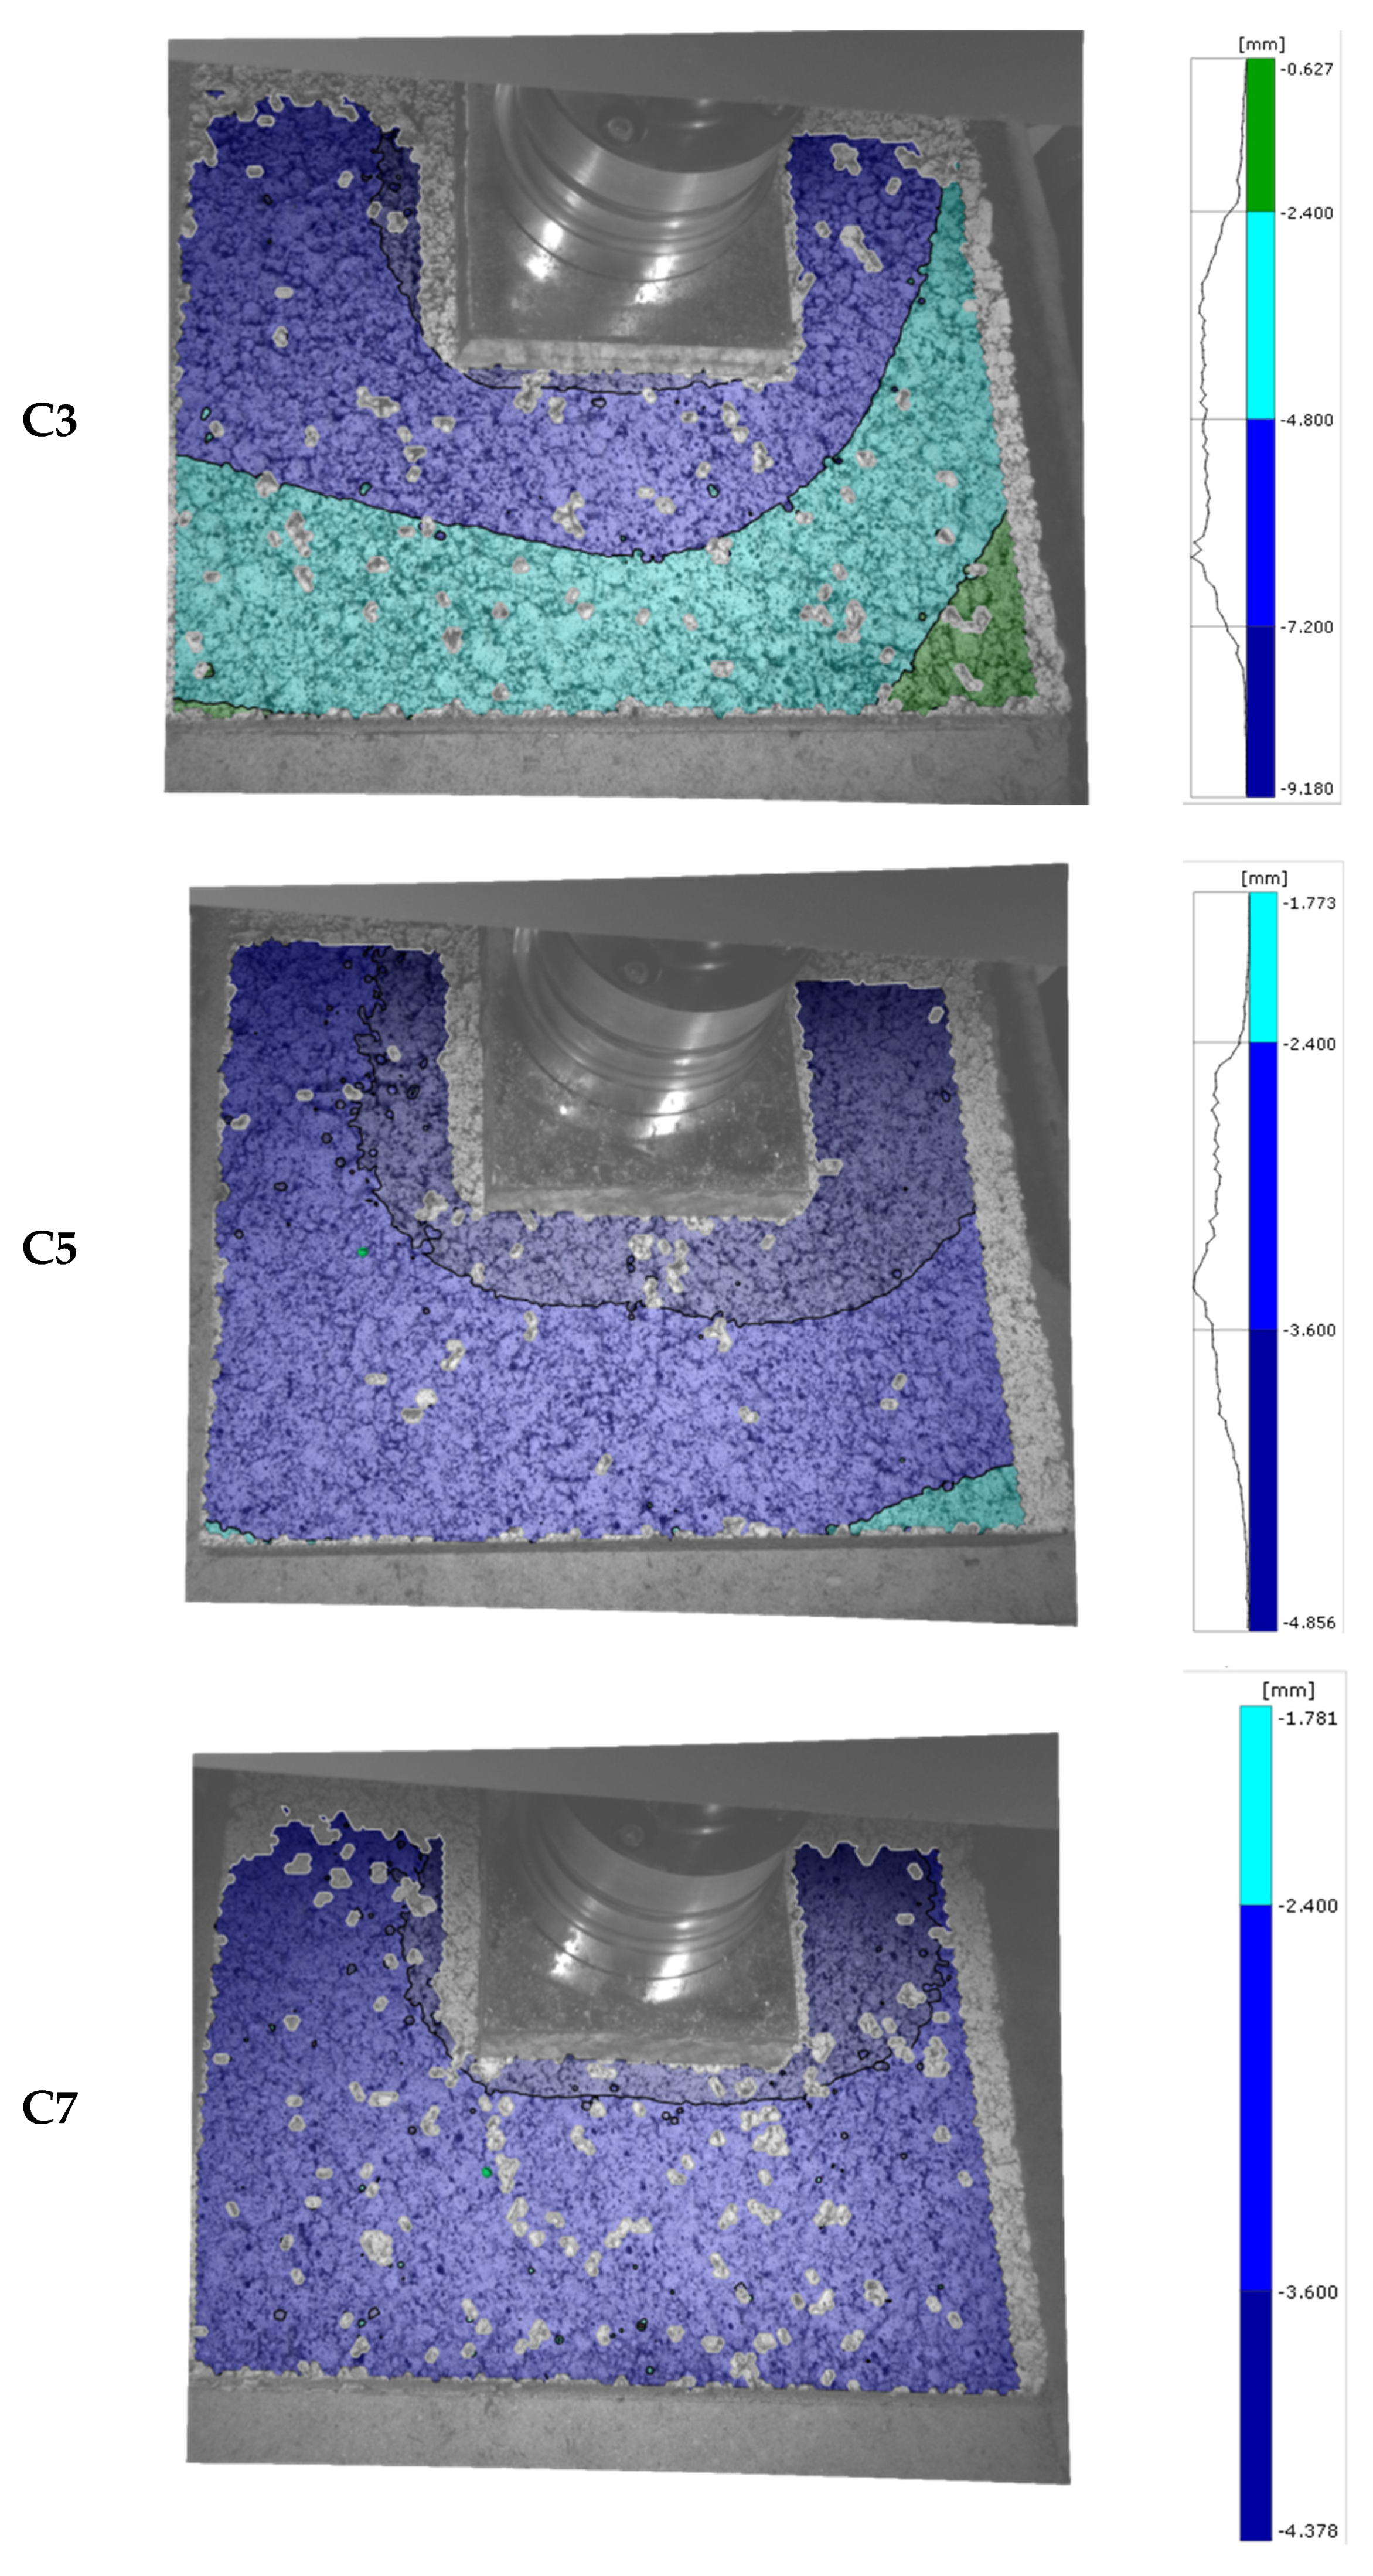
3.2. The 3D-DIC for Pavement Structure Analyses

The pavement structure was simulated by a test setup consisting of three layers differing only in the CBGM. For the CBGM, three different cement contents were used (3%, 5%, and 7%) to simulate the change in layer rigidity and its influence on pavement behaviour. Three samples of each kind of CBGM/pavement structures were tested, and the average results are presented. For every sample, the force and vertical displacement were recorded (Figure 5).
Introducing the first loading cycle, characteristic system “adjustment” was recorded for each tested sample. Namely, during sample preparation, it was not possible to achieve ideally flat surfaces of each layer, and full contact between the layers was achieved at different values of vertical displacement. This is particularly linked to the condition of the inbuilt UGM layer. System adjustment refers to the closing of the space between the layers and the initial settlement of the UGM layer. However, after the initial stress value was reached, all subsequent steps had a consistent curve slope during loading and unloading, which indicates a uniform stiffness distribution and the absence of further minor adjustments. Furthermore, in all samples, a gradual displacement increase within the same loading cycle was recorded, for example during a certain stress level repetition. This suggests creep occurrence in all samples, meaning slight decreases in stiffness and the occurrence of residual (irreversible) displacements. Within the first loading cycles, no significant changes occurred, so this property can be attributed to the curvature of the stress–strain curve of the individual pavement system layers within the elastic state.
To obtain clearer and more precise information on the pavement system behaviour, from the individual force–displacement curves, the initial state of system “adjustment” was removed, and the envelopes of individual cycles are presented in Figure 6. For a 7% cement content CBGM pavement system, a very small total displacement was recorded, while those for a 5% and 3% cement content were relatively similar, but with different displacements levels achieved at different loading cycles. Such a pattern of behaviour points to the conclusion that, in the case of the system with 7% cement content, cracks do not open at all, and therefore, no significant displacements occur. On the other hand, the behaviour of pavement systems with CBGM of 3% and 5 % cement content points to cracks in the lower layers having opened, but at different loading stages, which are then manifested in different ways in the force–displacement record.
Analysing only irreversible displacements within a particular loading cycle for each of the samples, earlier indicators were confirmed, and additional behavioural indicators were revealed. Namely, the sample with 7% cement content achieved the largest residual displacement in the first stage of loading, and the displacement decreased with each following loading cycle, indicating that no cracks had formed. The reduction of the residual displacement by each following loading cycle was exclusively related to the decreasing space for free deformations between the layers and the gradual load bearing through the deformation of the materials themselves. Figure 7 shows the achieved displacement at the end of each loading cycle for each cement content.
Based on the field of deformation data for each of the series, some insight can be gained. As the load cycles progressed, from first to fourth, and stresses increased, the trends of deformation for each mixture type were amplified, meaning that the end of the last cycle can offer much information regarding broader behaviour, such as non-localised behaviour. Figure 8 enables such an insight with an overlay of the vertical displacement fields on the asphalt’s surface. Firstly, it is visible that the mixture with 3% cement content was the most flexible, in terms of the range of vertical deformation being around 9 mm. Additionally, there was visible localised behaviour without the possibility of a proper stress distribution in an area wider than the input load. This suggests a failure of the lower layers beneath the load and a lack of stiffness to enable a wider distribution of stresses. With an increase of cement content to 5% and 7%, the behaviour significantly changed, showing clear signs of greater stiffness, which was most visible for the lower range of deformation within the entire surface. It should be noted that the differences in behaviour between 5% and 7% cement content on the system level were evidently smaller than on the material level. Namely, the total range of deformation was within 0.5 mm (around 10%), and there was a gradual decrease in deformation away from the load introduction area. The 7% cement content system showed greater stiffness as there was a smaller area within the 2.4 to 3.6 mm range, which was to be expected due to the higher modulus value of the supporting layer. Nevertheless, the use of 7% did not seem to offer large enough benefits in comparison to the 5% cement content structure.
Furthermore, it can be concluded that increasing the percentage of cement resulted in a stiffer system with fewer total vertical displacements. The moduli of elasticity, as well as the compressive strength, as shown in Table 1, varied significantly depending on the amount of cement. With an increase in cement content from 3% to 5%, there was an increase in the compressive strength and modulus of elasticity by 140% and 190%, respectively. With an increase in cement content from 5% to 7%, there was an increase in the strength and modulus of elasticity by 38% and 19%, respectively. On the other hand, the 3D-DIC pavement system analyses showed an increase in vertical displacement for the last three loading cycles with an average of 26% and 44% for increasing cement content from 3% to 5% and from 5% to 7%, respectively. The increased strength that came with the increased cement content from 5% to 7% is not fully expressed because it was not fully utilised within the pavement system. This means that increasing the cement content did not provide obvious benefits to the pavement system such as those recorded during the “pure” material testing. Part of the differences in the stiffness and the strength of the CBGM itself were “lost” within the pavement system. Namely, the pavement structure is a system made of materials differing in strengths, stiffness, and ductility, which assume non-linear weights in defining the system’s response. It is shown that certain trends of the material behaviour defined at the simple material level of each independent pavement layer will significantly differ when it is placed in the system, depending on the ratios of different properties. Therefore, it can be concluded that this approach of observing the pavement structure is more suitable and provides more realistic data for predicting the behaviour of the pavement structure in real conditions instead of analysing the pavement layers individually. In the future, the potential of defining coefficients that should take this effect into account should be explored when defining the characteristics of each pavement layer that is used to calculate the stresses and strain state and to predict the behaviour and service life of the pavement structure itself. It is a complex analysis of the materials´ characteristics and behaviours with non-linear relations demanding extensive future research. This approach to pavement structure research is possible almost exclusively with the application of modern research methods such as the 3D-DIC technology used within the presented research.

4. Conclusions

The objective of this research was to obtain more information on the CBGM’s influence on the pavement structure by applying the 3D-DIC technology as a modern and innovative research technique. The specific aim was to introduce an innovative approach to pavement structure analyses by looking at the behaviour of the system, as opposed to the current trend of researching individual system materials. The results presented in this research lead to the following conclusions:
  • The 3D-DIC method is an appropriate technique for determining the modulus of elasticity of pavement materials with a textured and rough surface;
  • Observing the pavement system’s behaviour in the presented test setup is more suitable and provides more realistic data for predicting the behaviour of the pavement structure in real conditions instead of analysing the pavement layers individually;
  • The complex analysis of materials’ characteristics and behaviours with non-linear relations, as they are present within the structure of the pavement, is possible almost exclusively with the application of modern research methods such as 3D-DIC.

Author Contributions

Conceptualisation, I.B. and T.D.; methodology, I.B. and T.D.; software, T.D.; investigation, M.Z.; laboratory; M.Z., I.B. and T.D.; writing—original draft preparation, I.B., T.D. and M.Z.; writing—review and editing, I.B., T.D. and M.Z. All authors have read and agreed to the published version of the manuscript.

Funding

This research was funded by the Croatian Science Foundation under the project: UIP-2019-04-8195 Cement stabilized base courses with waste rubber for sustainable pavements.

Institutional Review Board Statement

Not applicable.

Informed Consent Statement

Not applicable.

Data Availability Statement

Not applicable.

Acknowledgments

The authors gratefully acknowledge the help and support of the RAMTECH d.o.o. and Iztok Ramljak for kindly providing asphalt slab specimens and sharing his knowledge and experience.

Conflicts of Interest

The authors declare no conflict of interest.

References

  1. Petit, C.; Chabot, A.; Destrée, A.; Raab, C. Mechanisms of Cracking and Debonding in Asphalt and Composite Pavements; Buttlar, W.G., Chabot, A., Dave, E.V., Petit, C., Tebaldi, G., Eds.; Springer International Publishing: Cham, Switzerland, 2018; pp. 103–153. [Google Scholar] [CrossRef]
  2. Wang, X.; Wu, Y.; Cui, J.; Zhu, C.-Q.; Wang, X.-Z. Shape characteristics of coral sand from the south China sea. J. Mar. Sci. Eng. 2020, 8, 803. [Google Scholar] [CrossRef]
  3. Cui, M.; Hong, B.; Fang, Q. Application of digital image processing technology in geotechnical engineering. In Proceedings of the 2011 International Conference on Transportation, Mechanical and Electrical Engineering (TMEE), Changchun, China, 16–18 December 2011. [Google Scholar] [CrossRef]
  4. Cherian, C.; Arnepalli, D.N. Material characterisation by digital image analysis: A review. Environ. Geotech. 2018, 5, 249–262. [Google Scholar] [CrossRef]
  5. Tan, Y.-Q.; Zhang, L.; Guo, M.; Shan, L.-Y. Investigation of the deformation properties of asphalt mixtures with DIC technique. Constr. Build. Mater. 2012, 37, 581–590. [Google Scholar] [CrossRef]
  6. Behnke, R.; Falla, G.C.; Leischner, S.; Händel, T.; Wellner, F.; Kaliske, M. A continuum mechanical model for asphalt based on the particle size distribution: Numerical formulation for large deformations and experimental validation. Mech. Mater. 2021, 153, 103703. [Google Scholar] [CrossRef]
  7. Hu, J.-S.; Wang, L.; Luo, X. Anti-fatigue performance of warm-mixed rubber powder modified asphalt mixture based on the DIC technique. Constr. Build. Mater. 2022, 335, 127489. [Google Scholar] [CrossRef]
  8. Hu, G.; Yang, Q.; Qiu, X.; Zhang, D.; Zhang, W.; Xiao, S.; Xu, J. Use of DIC and AE for investigating fracture behaviors of cold recycled asphalt emulsion mixtures with 100% RAP. Constr. Build. Mater. 2022, 344, 128278. [Google Scholar] [CrossRef]
  9. Du, Z.; Yuan, J.; Zhou, Q.; Hettiarachchi, C.; Xiao, F. Laboratory application of imaging technology on pavement material analysis in multiple scales: A review. Constr. Build. Mater. 2021, 304, 124619. [Google Scholar] [CrossRef]
  10. Wu, B.; Pei, Z.; Xiao, P.; Lou, K.; Wu, X. Influence of fiber-asphalt interface property on crack resistance of asphalt mixture. Case Stud. Constr. Mater. 2022, 17, e01703. [Google Scholar] [CrossRef]
  11. Yang, H.; Ouyang, J.; Jiang, Z.; Ou, J. Effect of fiber reinforcement on self-healing ability of asphalt mixture induced by microwave heating. Constr. Build. Mater. 2023, 362, 129701. [Google Scholar] [CrossRef]
  12. Radeef, H.R.; Hassan, N.A.; Mahmud, M.Z.H.; Abidin, A.R.Z.; Ismail, C.R.; Abbas, H.F.; Al-Saffar, Z.H. Characterisation of cracking resistance in modified hot mix asphalt under repeated loading using digital image analysis. Theor. Appl. Fract. Mech. 2021, 116, 103130. [Google Scholar] [CrossRef]
  13. Yang, S.; Jiang, J.; Leng, Z.; Ni, F. Feasibility and performance of the Semi-circular Bending test in evaluating the low-temperature performance of asphalt mortar. Constr. Build. Mater. 2021, 269, 121305. [Google Scholar] [CrossRef]
  14. Wang, L.; Shan, M.; Li, C. The cracking characteristics of the polymer-modified asphalt mixture before and after aging based on the digital image correlation technology. Constr. Build. Mater. 2020, 260, 119802. [Google Scholar] [CrossRef]
  15. Yuan, F.; Cheng, L.; Shao, X.; Dong, Z.; Zhang, L.; Wu, G.; He, X. Full-field measurement and fracture and fatigue characterizations of asphalt concrete based on the SCB test and stereo-DIC. Eng. Fract. Mech. 2020, 235, 107127. [Google Scholar] [CrossRef]
  16. Teguedi, M.C.; Toussaint, E.; Blaysat, B.; Moreira, S.; Liandrat, S.; Grédiac, M. Towards the local expansion and contraction measurement of asphalt exposed to freeze-thaw cycles. Constr. Build. Mater. 2017, 154, 438–450. [Google Scholar] [CrossRef]
  17. Romeo, E.; Montepara, A. Characterization of reinforced asphalt pavement cracking behavior using flexural analysis. In SIIV—5th International Congress—Sustainability of Road Infrastructures; Elsevier Ltd.: Amsterdam, The Netherlands, 2012; Volume 53, pp. 356–365. [Google Scholar] [CrossRef] [Green Version]
  18. Freire, R.A.; Di Benedetto, H.; Sauzéat, C.; Pouget, S.; Lesueur, D. Crack propagation analysis in bituminous mixtures reinforced by different types of geogrids using digital image correlation. Constr. Build. Mater. 2021, 303, 124522. [Google Scholar] [CrossRef]
  19. Kumar, V.V.; Saride, S. Evaluation of cracking resistance potential of geosynthetic reinforced asphalt overlays using direct tensile strength test. Constr. Build. Mater. 2018, 162, 37–47. [Google Scholar] [CrossRef]
  20. Golewski, G.L. An extensive investigations on fracture parameters of concretes based on quaternary binders (QBC) by means of the DIC technique. Constr. Build. Mater. 2022, 351, 128823. [Google Scholar] [CrossRef]
  21. Golewski, G. Comparative measurements of fracture toughgness combined with visual analysis of cracks propagation using the DIC technique of concretes based on cement matrix with a highly diversified composition. Theor. Appl. Fract. Mech. 2022, 121, 103553. [Google Scholar] [CrossRef]
  22. Golewski, G.L. Evaluation of fracture processes under shear with the use of DIC technique in fly ash concrete and accurate measurement of crack path lengths with the use of a new crack tip tracking method. Measurement 2021, 181, 109632. [Google Scholar] [CrossRef]
  23. Golewski, G.L. Measurement of fracture mechanics parameters of concrete containing fly ash thanks to use of Digital Image Correlation (DIC) method. Measurement 2019, 135, 96–105. [Google Scholar] [CrossRef]
  24. Li, D.; Huang, P.; Chen, Z.; Yao, G.; Guo, X.; Zheng, X.; Yang, Y. Experimental study on fracture and fatigue crack propagation processes in concrete based on DIC technology. Eng. Fract. Mech. 2020, 235, 107166. [Google Scholar] [CrossRef]
  25. Lian, H.; Sun, X.; Yu, Z.; Lian, Y.; Xie, L.; Long, A.; Guan, Z. Study on the dynamic fracture properties and size effect of concrete based on DIC technology. Eng. Fract. Mech. 2022, 274, 108789. [Google Scholar] [CrossRef]
  26. Vaghela, A.; Vesmawala, G. DIC analysis of nano concrete using functionalized and dispersed carbon nanotubes. Mater. Today Proc. 2022, 57, 812–817. [Google Scholar] [CrossRef]
  27. Liu, Y.; Zeng, L.; Xiang, S.; Mo, J.; Zhang, J.; Chen, J.; Cheng, G. Compressive performance evaluation of concrete confined by stirrups at elevated temperature using DIC technology. Constr. Build. Mater. 2020, 260, 119883. [Google Scholar] [CrossRef]
  28. Fan, B.; Qiao, Y.; Hu, S. An experimental investigation on FPZ evolution of concrete at different low temperatures by means of 3D-DIC. Theor. Appl. Fract. Mech. 2020, 108, 102575. [Google Scholar] [CrossRef]
  29. Abbassi, F.; Ahmad, F. Behavior analysis of concrete with recycled tire rubber as aggregate using 3D-digital image correlation. J. Clean. Prod. 2020, 274, 123074. [Google Scholar] [CrossRef]
  30. Miura, T.; Sato, K.; Nakamura, H. The role of microcracking on the compressive strength and stiffness of cracked concrete with different crack widths and angles evaluated by DIC. Cem. Concr. Compos. 2020, 114, 103768. [Google Scholar] [CrossRef]
  31. Wang, X.; Liu, J.; Jin, Z.; Chen, F.; Zhong, P.; Zhang, L. Real-time strain monitoring of reinforced concrete under the attacks of sulphate and chloride ions based on XCT and DIC methods. Cem. Concr. Compos. 2021, 125, 104314. [Google Scholar] [CrossRef]
  32. Liu, Q.; Looi, D.T.-W.; Chen, H.H.; Tang, C.; Su, R.K.L. Framework to optimise two-dimensional DIC measurements at different orders of accuracy for concrete structures. Structures 2020, 28, 93–105. [Google Scholar] [CrossRef]
  33. Zhou, K.; Lei, D.; He, J.; Zhang, P.; Bai, P.; Zhu, F. Real-time localization of micro-damage in concrete beams using DIC technology and wavelet packet analysis. Cem. Concr. Compos. 2021, 123, 104198. [Google Scholar] [CrossRef]
  34. Meng, X.; Chi, Y.; Jiang, Q.; Liu, R.; Wu, K.; Li, S. Experimental investigation on the flexural behavior of pervious concrete beams reinforced with geogrids. Constr. Build. Mater. 2019, 215, 275–284. [Google Scholar] [CrossRef]
  35. Farhan, A.H.; Dawson, A.R.; Thom, N.H. Damage propagation rate and mechanical properties of recycled steel fiber-reinforced and cement-bound granular materials used in pavement structure. Constr. Build. Mater. 2018, 172, 112–124. [Google Scholar] [CrossRef]
  36. He, J.; Lei, D.; Xu, W. In-situ measurement of nominal compressive elastic modulus of interfacial transition zone in concrete by SEM-DIC coupled method. Cem. Concr. Compos. 2020, 114, 103779. [Google Scholar] [CrossRef]
  37. EN 13286-4; 2021 Unbound and Hydraulically Bound Mixtures—Part 4: Test Methods for Laboratory Reference Density and Water Content—Vibrating Hammer. European Committee for Standardization: Brussels, Belgium, 2021.
  38. EN 13286-51; 2004 Unbound and Hydraulically Bound Mixtures—Part 51: Methods for the Manufacture of Test Specimens of Hydraulically Bound Mixtures Using Vibrating Hammer Compaction. European Committee for Standardization: Brussels, Belgium, 2004.
  39. EN 13286-41; 2021 Unbound and Hydraulically Bound Mixtures—Pari 41: Test Method for the Determination of the Compressive Strenght of Hydraulically Bound Mixtures. European Committee for Standardization: Brussels, Belgium, 2021.
  40. EN 13286-43; 2003 Unbound and Hydraulically Bound Mixtures—Part 43: Test Method for the Determination of the Modulus of Elasticity of Hydraulically Bound Mixtures. European Committee for Standardization: Brussels, Belgium, 2003.
  41. EN 12697-33; 2019 Bituminous Mixtures—Test Methods—Part 3: Specimen Prepared by Roller Compactor. European Committee for Standardization: Brussels, Belgium, 2019.
  42. EN 13043; 2002 Aggregated for Bituminous Mixtures and Surface Treatmants for Roads, Airfields and Other Trafficked Areas. European Committee for Standardization: Brussels, Belgium, 2003.
  43. ARAMIS User Manual—Hardware; GOMmbH: Braunschweig, Germany, 2007.
  44. Barišić, I.; Dokšanović, T.; Draganić, H. Characterization of hydraulically bound base materials through digital image correlation. Constr. Build. Mater. 2015, 83, 299–307. [Google Scholar] [CrossRef]
  45. Lim, S.; Zollinger, D.G. Estimation of the compressive strength and modulus of elasticity of cement-treated aggregate base materials. Transp. Res. Rec. J. Transp. Res. Board 2003, 1837, 30–38. [Google Scholar] [CrossRef]
  46. Xuan, D.; Houben, L.; Molenaar, A.; Shui, Z. Mechanical properties of cement-treated aggregate material—A review. Mater. Des. 2012, 33, 496–502. [Google Scholar] [CrossRef]
Figure 1. Grain size distribution of used natural aggregates.
Applsci 13 00664 g001
Figure 2. Pavement structure test setup.
Applsci 13 00664 g002
Figure 3. The 3D-DIC testing setup.
Applsci 13 00664 g003
Figure 4. CBGM specimen surface.
Applsci 13 00664 g004
Figure 5. Force–vertical displacement curves for selected samples of the CBGM with (a) 3%, (b) 5%, and (c) 7% cement content.
Applsci 13 00664 g005
Figure 6. Force–displacement envelopes for the pavement system with different CBGM layers.
Applsci 13 00664 g006
Figure 7. Vertical displacement at the end of each loading cycle.
Applsci 13 00664 g007
Figure 8. Displacement fields at the end of the 4th loading cycle for samples with various levels of cement.
Applsci 13 00664 g008
Table 1. Mechanical characteristics of the CBGM.
Cement Contentfc (MPa)E (MPa)
3%2.693.46
5%6.4510.03
7%8.8911.96
Disclaimer/Publisher’s Note: The statements, opinions and data contained in all publications are solely those of the individual author(s) and contributor(s) and not of MDPI and/or the editor(s). MDPI and/or the editor(s) disclaim responsibility for any injury to people or property resulting from any ideas, methods, instructions or products referred to in the content.

