Article

Online SOPDT Model Identification Method Using a Relay

by
Krzysztof S. Kula
Faculty of Electrical Engineering, Gdynia Maritime University, 81-225 Gdynia, Poland
Appl. Sci. 2023, 13(1), 632; https://doi.org/10.3390/app13010632
Submission received: 16 December 2022 / Revised: 29 December 2022 / Accepted: 29 December 2022 / Published: 3 January 2023
(This article belongs to the Section Robotics and Automation)

Abstract

:
This paper describes a novel method for the online identification of an analog second-order plus dead time (SOPDT) model. It requires the measurement of four physical quantities, for which a relay is used. Based on these measurements, the parameters of the model or the regulator settings can be directly determined and used to autotune PI/PID controllers. The steps required to take the necessary measurements and the computational algorithms used to determine the model parameters are presented. The results of the simulation studies, including the measurements and calculations of the obtained models, are presented to demonstrate the effectiveness of the proposed method. Comparisons were made between the developed SOPDT model and the critically damped SOPDT model that is often used for high-order inertial plants.

1. Introduction

Models play a very important role in automation. A model should reflect the static and dynamic properties of a plant as closely as possible. They can be directly used in many control structures, such as internal model control (IMC), model following control (MFC), Smith’s predictor, or other time delay compensators. In the process of PI/PID controller tuning, a model can provide a simplified representation of the plant.
In time-varying systems, model identification carried out online allows controller parameters to be adapted according to changes in process dynamics. New models of programmable logic controllers (PLCs) have an “autotuning” mode, which allows the controller settings to be adjusted to provide a sufficiently large margin of stability in the control system. However, a much greater opportunity in the adaptation process is provided by model-based identification of the control process.
Certain tuning methods are based on model parameters of a predetermined class. Due to the needs of PI/PID controller tuning, the assumed class is often reduced to first- or second-order models [1]. Many industrial time-delayed plants are modeled in terms of the following:
(a)
First-order inertia plus dead time (FOPDT);
(b)
An integrating model with time delay;
(c)
Second-order inertia plus dead time.
For many years, inertial systems were estimated using a first-order model with time delay, but in many cases, these models were not adequate for the properties of the plant, which could lead to lower performance of the control system. For some PI and PID designs and other more sophisticated model-based controllers, an SOPDT model may be more appropriate [2]. SOPDT models, which can be described by the transfer function
G m s = K e θ s T 2 s 2 + 2 ξ T s + 1
can include underdamped, critically damped, and oerdamped dynamics. If the damping factor ξ is less than one, the model is an underdamped model; if ξ = 1, then it is a critically damped model; and if the coefficient ξ is greater than one, it is an overdamped SOPDT model. In this work, we limited our considerations to overdamped systems and, in particular, to those for which the transfer function can also be represented as
G m s = K e θ s 1 + T 1 s 1 + T 2 s
where K is the steady-state gain, T1 and T2 are time constants, and θ is the time delay.
Controller tuning can be carried out by staff, but the process can also be automated. To represent the properties of the control process in a more simple manner, several identification methods were developed. A very useful tool for such controller tuning based on models of the processes is the relay method formulated by Åstrom and Hägglund [3], which consists of exciting ultimate oscillations of limited amplitude in a closed system by means of a relay. It can be used online without having to disconnect the control system. The parameters of a predetermined model transfer function can be obtained on the basis of the limit cycle parameters using the describing function method. If the steady-state gain is known, one identification test that determines the coordinates of a critical point of the Nyquist diagram allows for further model parameters to be obtained, although Srinivasan and Chidambaram [4] presented a method in which an FOPDT model was determined using a system of three equations. Majhi derived complex analytical expressions from the half-cycle analysis of the relay response curve [5].
However, the determination of an overdamped SOPDT model is much more difficult, as it requires the determination of four parameters: steady-state gain K, delay time, and time constants T1 and T2. The algorithms used to determine overdamped models are much more complicated for this reason. Such a model can be constructed via various methods, such as the one invented by Wang and Zhang [6] on the basis of the step response analysis. A modified identification method based on step characteristics using a real-coded genetic algorithm is presented in [7]. However, these methods are not suitable for online use, in contrast to the relay feedback approach, which was shown to be very useful for system identification.
Several articles were also published in recent years that describe methods for determining the parameters of plant models with an assumed model class, including second-order time-delayed models [8,9,10]. Majhi and Atherton [11,12] proposed state-space-based exact analytical expressions for the identification of second-order plus dead time models via asymmetrical relay tests. The use of the relay method to determine the model parameters (2) is presented in the work of Ramakrishnani and Chidambaram [13]. The test described in this paper was performed with an asymmetric relay, and the output and input signal transforms were calculated using integration. Wang and co-authors [14,15] developed a method to use the process input and output transients that result from relay feedback for transfer function modeling with the help of a fast Fourier transform. To estimate the parameters of the SOPDT model, Kaya and Atherton [16] used a complex A-locus function. Li and coworkers [17] carried out two identification tests and additionally used the least-squares method to determine the unknown parameters. Sanchez et al. [18] used online measurements of the control signal and the output process to determine the harmonics needed to solve linear equations. Kasi and coworkers [19] presented an identification method for stable and unstable SOPDT processes using a state space approach. A relatively simple method for determining different models using an equivalent gain of the relay was presented by Ghorai et al. [20]. Santos and Baros used a combined identification technique to recover a model that matches the time response while capturing the true dynamics of the system around the frequencies of interest [21]. The abovementioned identification techniques require the use of more advanced mathematical tools.
The motivation for this work was the need to develop a simple online identification method that can be used without taking the control system out of operation for a time-varying plant, which is known to be best achieved by the SOPDT model. Using this method, a second-order inertial model with a time delay was determined in order to autotune a PID controller according to the rules based on the parameters of this model.
In addition to carrying out the necessary calculations without the use of complex and time-consuming computational methods, such as numerical methods, the objectives set for this work included several further expectations. These included achieving a model accuracy such that, with appropriately set model parameters, the behavior of the process would be fully reproduced. This applies, of course, only if there is no model uncertainty. In order for the proposed method to be used effectively in real control systems, where this condition will not be met, it should be robust so that measurement errors of the input variable, which are unavoidable, do not lead to an instability of the closed-loop system as long as they do not exceed acceptable levels, but at most lead to a certain decrease of the control performance.

2. Description of the Method

Various adaptive techniques have been used in automation for many years, with the common concerns of reliability under industrial conditions and simplicity of operation and understanding by staff. The proposed identification method for the SOPDT model was based on an occasional identification experiment that used a relay in a closed-loop control system. Thanks to this, it was possible to obtain a momentary feedback decoupling as a response to the change in the control signal and the sustained harmonic oscillations of the controlled variable. This enabled all four parameters of the model to be determined (1). The knowledge of the coordinates of two points of the frequency characteristics, along with the assumed model class, made it possible to calculate the values of both the inertial time constants. The autotuning process, including the identification of the model, was carried out by the supervisory controller. The structure of the system is shown in Figure 1.

2.1. Identification Experiment

The proposed method for creating a second-order inertial model with dead time during system operation included the following steps:
Determination of the steady-state gain of the plant K;
Measurement of the dead time;
Conducting a relay test leading to the generation of sustained oscillations;
Measurement of the magnitude and the ultimate frequency ω1 = ωu;
Introduction of an ideal integrator into the feedback loop;
Measurement of the new critical frequency of the generated oscillations ω2;
Calculation of the parameters of the mathematical model to be determined.

2.2. Determination of the Steady-State Gain

With the help of the relay, not only are the ultimate oscillations generated but the steady-state gain K and the dead time θ can also be determined. At the start of the identification test, the relay is connected in parallel to the controller so that the control signal from this moment will be the sum of both outputs. It should be noted that the controller output will be “frozen” at the level of the start of the test. To ensure that the relay does not switch after the change of the error sign, the hysteresis zone ε should have a value higher than an increase of the controlled variable in reaction to a signal from the relay, i.e.,
ε > Ke·B
where Ke is the static gain, which can be estimated from Keyst/ust; yst and ust are, respectively, the controlled variable and control signals in the steady state.
After switching the relay from level 0 to B, the control signal will increase to the value u(tt) + B, leading to an increment in the controlled variable equal to Δy:
Δy = K·B
The measurement of this steady-state increment allows for the static gain of the plant to be determined:
K = ∆y/B
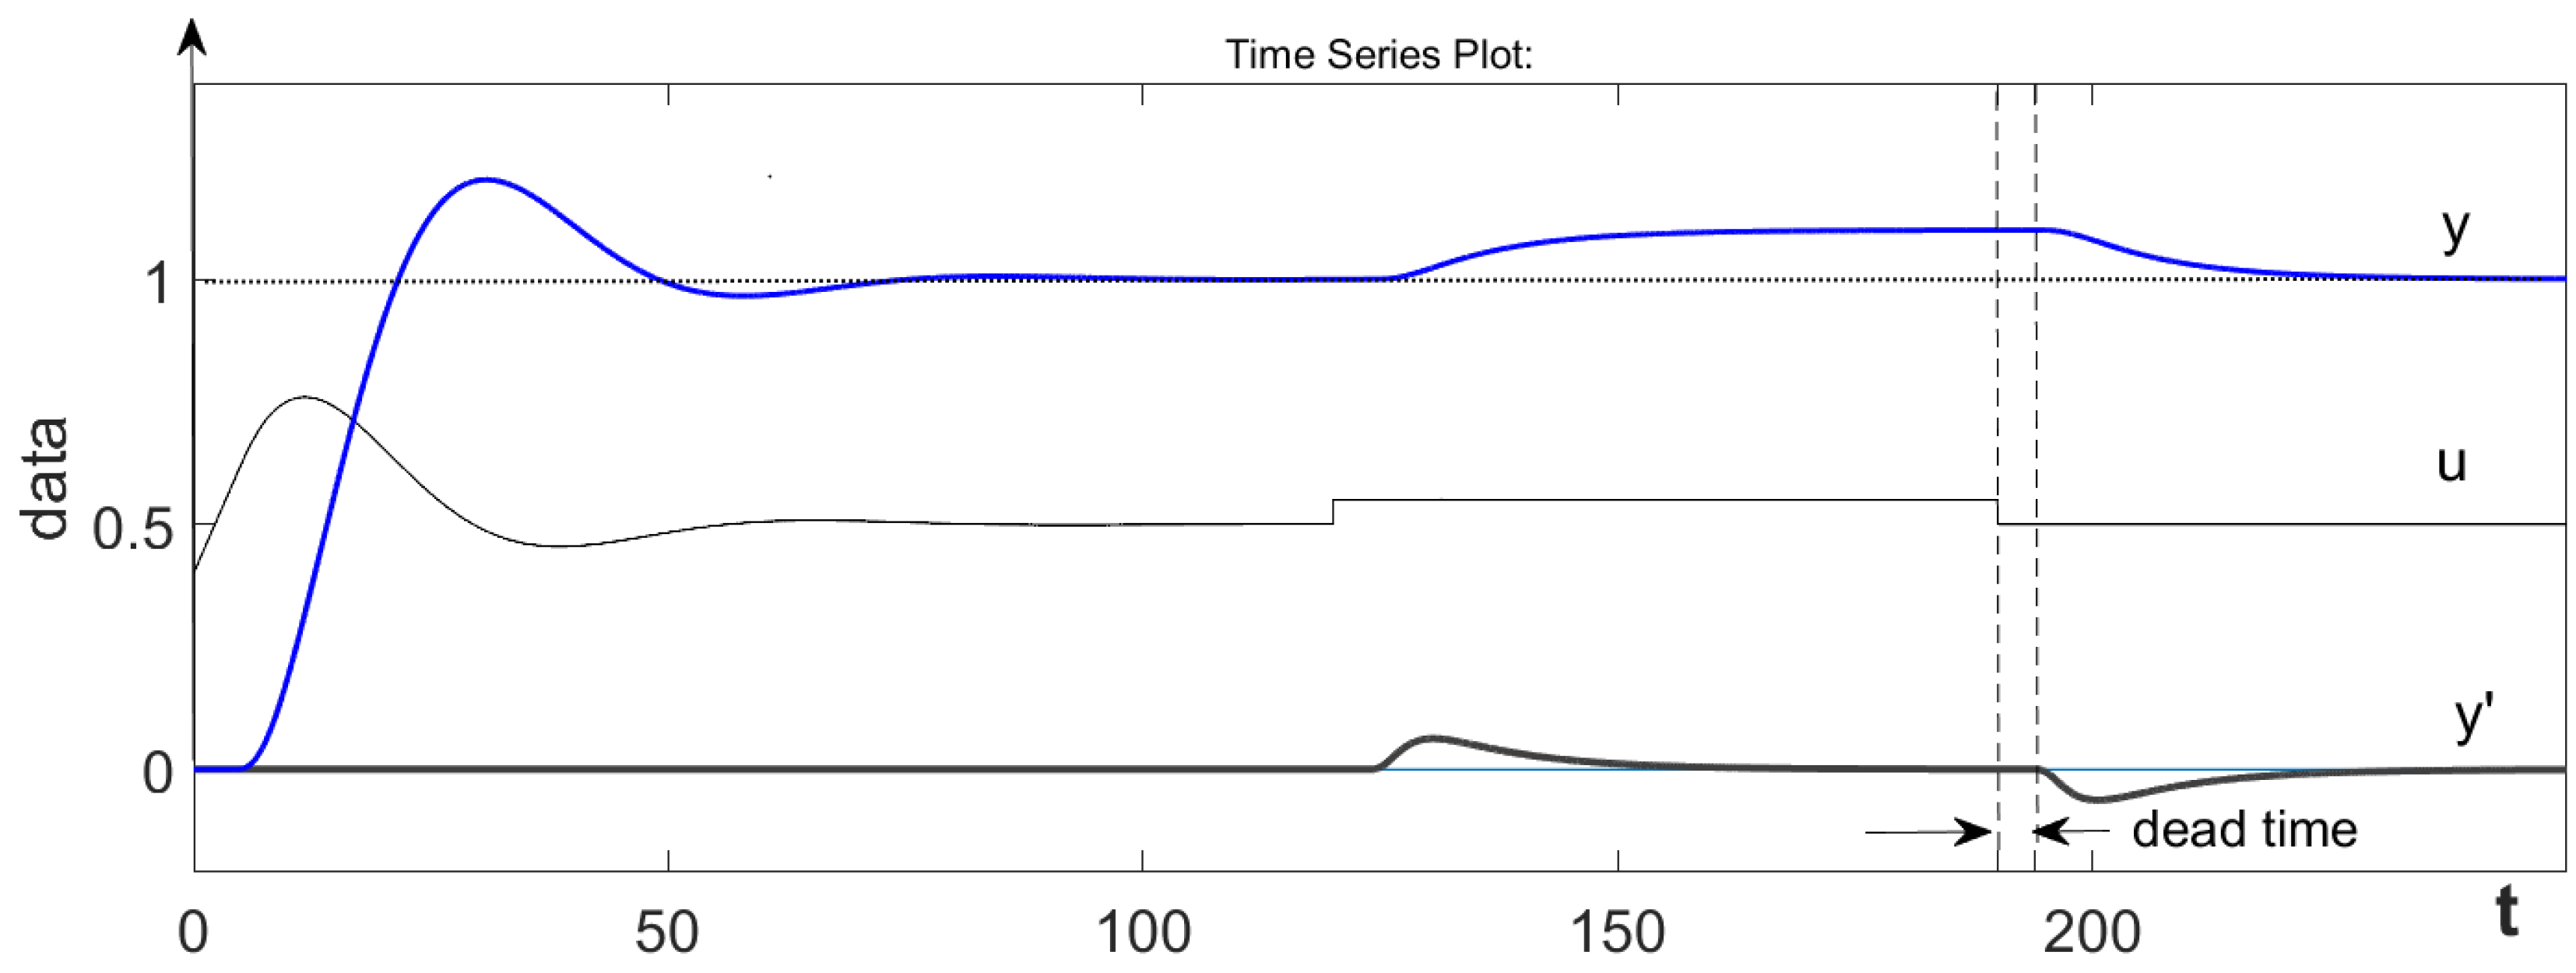
After the steady-state gain is determined, the hysteresis is reduced, thus changing the state of the relay output from B to 0. This allows for the measurement of the dead time, which is equal to the time from switching the relay from the high to low state to the process response to this change. This is illustrated in Figure 1.
During the identification, the output signal from the PID controller remains unchanged and does not react to any changes in the error signal.
The method presented in this section for determining the steady-state gain is not the only possible one. Using an asymmetric relay, the gain can be determined as the ratio of the integral from the input signal to the integral from the plant’s input signal [13].

2.3. Measurement of the Time-Delay Constant

In most online identification methods for SOPDT models, the dead time is calculated computationally on the basis of the measurements of other physical variables. If the model parameter θ is treated as pure dead time, its measurement can be performed with high accuracy. After determining the steady-state gain, the hysteresis must be reduced, thus changing the state of the relay output from B to 0. This allows for the measurement of the dead time, which is equal to the time from switching the relay from the high to low state to the process response to this change. After returning to the steady state for a given operating point, the time that elapses from the negative edge of the control signal to the plant’s response to this change is measured. This is illustrated in Figure 2. However, under industrial conditions, technical difficulties might appear during such measurements due to disturbances and measurement noise.
On the other hand, the determination of the dominant time constants of inertia requires the phase lag resulting from the remaining terms of the plant dynamics to be obtained. If we are indeed dealing with a second-order plant with pure dead time only, or the model uncertainty is very small, its precise measurement will make it possible to obtain an accurate model.
In real systems, the distinction between the time in which the plant’s response is faint and the pure dead time depends on the adopted criterion. It can be difficult to make any generalizations about this distinction, but in the case of high-order plants, it is necessary. The determination of the time delay is made by zero-crossing detectors, except that this procedure is carried out during the measurement of the limit cycle parameters, leading to results that differ from those obtained during the step response. This is because the measurement of the time delay continues until the output derivative y′(t) crosses zero. If the value measured in this way is at least 30% greater than the dead time, it means that we are dealing with high-order inertia and this should be taken as the parameter θ.

2.4. Determination of Limit Cycle Parameters

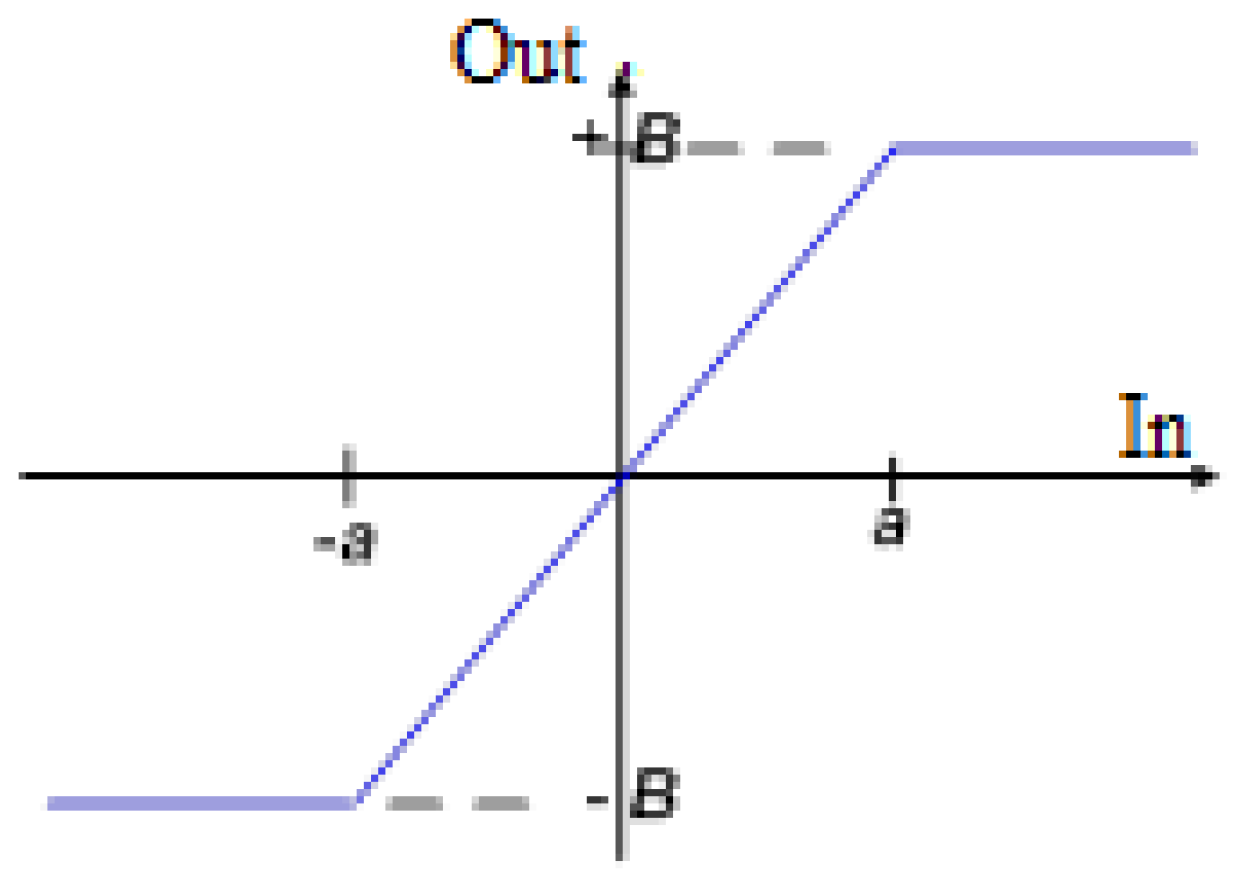
In order to determine the coordinates of two points of a Nyquist plot, it is necessary to generate a sustained oscillation in the closed system. Its implementation requires the addition of an output signal from relay B, which is connected in parallel with the controller output, to the control signal providing a steady state in the system. This allows the approximate value of the ultimate gain Ku1 to be determined. In the next step, a saturation relay is used to generate oscillations, with static characteristics, as shown in Figure 3 with a slope k = B/a = 1.15·Ku1.

2.5. Calculation of the Time Constants

In the proposed method, unlike the classical relay method [3], only the value of the ultimate frequency ωu obtained from this measurement is used for the calculations of time constants. This makes it robust to errors in the measurement of the amplitude. After the measurement of the period of oscillations generated at the critical point in a closed loop system with the identified plant, it is repeated in a loop with an additionally introduced integrator.
Let us represent the Fourier transfer function of a model (2) as the product of the minimum-phase term G m f j ω and the delay term G d j ω :
G m j ω = G m f j ω · G d j ω
The argument of this function can be expressed as a sum of arguments of both the inertia and the delay:
A r g G m j ω = φ m ω = a r c t g ω T 1 a r c t g ω T 2 ω θ
Without decomposing into two inertias, this relationship for ω = ωu can also be written in another form:
φ m ω = θ ω u a r c t g T 1 + T 2 ω u       1 T 1 T 2 · ω u 2
Due to the ultimate frequency ωu, the argument of the Fourier transfer function Gm(jωu) is the phase lag φm equal to −π and the relation (8) will take the form
a r c t g T 1 + T 2 ω u       1 T 1 T 2 · ω u 2 = θ ω u + π
The tangent functions of both sides of the Equation (9) are equal to
T 1 + T 2 ω u       1 T 1 T 2 · ω u 2 = t g θ ω u + π = t g θ ω u
The expression θ·ωu represents the phase shift φdt, which the dead time introduces into the open system at the ultimate frequency. Taking this into account, after simplification, Equation (10) can be written as
t g φ d t ( 1 T 1 T 2 · ω u 2 ) =   T 1 + T 2 ω u
To be able to determine the values of the time constants, it is necessary to determine one more point of the frequency characteristic. This can be done in several ways, for example, by introducing into the feedback loop any linear corrector of the known transfer function for the duration of the test, preferably one that does not influence the magnitude.
Let us assume that with the inclusion of a relay in the feedback loop, an ideal integral member will be added, causing the phase shift of the open system to increase by φ( ω 2 ) = −90°. In the closed system, non-extinguishing oscillations will be induced. The measurement of their frequency will allow for the determination of the value ω2.
For a signal of this frequency, the phase lag of an open system (without the integrating element added) will be equal to φ(ω2) = −90°. Taking this into account, the relation (9) will take the following form:
φ m ω 2 + π = a r c t g T 1 + T 2 ω 2       1 T 1 T 2 · ω 2 2 θ ω 2 0.5 π
Simplifying (12) we obtain
t g θ ω 2 + 0.5 π = T 1 + T 2 ω 2       T 1 T 2 · ω 2 2 1
Let us substitute the expression θ ω 2 + 0.5 π with the new variable φ 2 :
t g θ ω 2 + 0.5 π = t g φ 2
Let us assume that the frequency of the oscillations generated during the first relay test without the participation of the ideal integrating element is equal to the critical frequency, which we denote by ω1; then
t g θ ω 1 = t g φ 1
We can then form the following system of two equations:
t g φ 1 T 1 T 2 · ω 1 2 1 = T 1 + T 2 ω 1
t g φ 2 T 1 T 2 · ω 2 2 1 = T 1 + T 2 ω 2
to solve for the time constant of the delay that needs to be known. By transforming Equations (16) and (17), we can determine the sum and product of the time constants T1 and T2.
T 1 + T 2 = t g φ 1 ·   t g φ 2 ω 1 2 ω 2 2   ω 1   ω 2   t g φ 2 · ω 2 t g φ 1 · ω 1
T 1 T 2 = t g φ 2 · ω 1 t g φ 1 · ω 2   ω 1   ω 2   t g φ 2 · ω 2 t g φ 1 · ω 1
If in order to determine the PID controller settings, it would be necessary to know both time constants of the model, then by denoting their sum as α and their product as β and then transforming the Equations (18) and (19), we obtain the quadratic equation
T 1 2 α T 1 + β = 0
whose roots are the time constants of the model (2):
T 1 = 0.5 α + α 2 4 β                 T 2 = 0.5 α α 2 4 β  
When the SOPDT transfer function is to be expressed in the form of (1), their parameters can be determined using the following dependencies:
ξ = α     2   β ξ = α     2   β
T = β

3. Simulation Results and Discussion

All of the research presented in this section was carried out using the Matlab Simulink software.

3.1. Identification of the Second-Order Time-Delayed Plant

Example 1. Assume that the plant is described by the following transfer function
G o b 1 s = 2   e 3 s 10 s + 1 2 s + 1
This plant was identified in accordance with the procedure presented in Section 2.1. The preliminary relay test allowed for determining the steady-state gain and the dead time. The following results were obtained: the response to an increase in the controlled signal equal to the output from the relay B = 0.1 was 1.942 after 40 s and 1.995 after 60 s, and the time delay was measured to be 3.01 s.
The limit cycle parameters of the closed loop conducting this plant were equal to ω1 = 0.387815 and Ku1 = 2.5341. After introducing an ideal integral term and changing the dynamics of the loop, we obtained ω2 = 0.13132 rad/s and Ku2 = 0.1121. Oscillations induced with the relay will have parameters different from those derived from the calculations. The accuracy of these measurements will depend on the type of relay used. The identification experiment conducted with the ideal relay at B = 1 allowed for the measurement of the amplitude of the controlled variable A = 0.5369 and the period Tosc = 16.22 s. Usually, for online identification, a relay with hysteresis is used, which deforms the oscillations the most and the determined limit cycle parameters deviate more from the real ones. Using such a relay, which avoids chattering by changing the sign of the control error, with a width of ε = 0.02, the oscillation amplitude A = 0.5544 and the period Tosc = 16.60 s were measured. On the basis of the measured values, the sum α and product β of the time constants were calculated, which were equal to α = 12.8608 and β = 20.8841. On the basis of (21), both time constants of model (2) were determined as T1 = 1.9065 s and T2 = 10.954 s. The transfer function of this model is thus equal to
G m 22 s = 1.995   e 3.01 s 10.954 s + 1 1.907 s + 1
If a more time-consuming two-step procedure using a relay with saturation is used (Section 2.4), the accuracy of the measurement will depend on the slope of the linear part of the relay k. For values slightly higher than the ultimate gain, the error can be less than 0.02%. For the second stage of the more accurate measurement of limit cycle parameters, a saturation relay was used [22]. The slope of the linear part of this relay was assumed to be k = 1.15·Kue, which allowed the system to generate sustained oscillations with the magnitude A = 0.424 and the period Tosc = 16.20 s. After the introduction of an ideal integral term into the system, the period increased to the value Tosc2 = 47.817 s. The identification test carried out by the proposed method made it possible to determine the transfer function of the tested plant with high accuracy:
G m 22 s = 1.995   e 3.01 s 10.002 s + 1 1.982 s + 1
A simpler critically damped SOPDT model can also be used to represent the dynamics of a second-order time–delayed plant [23]. Its transfer function is given as
G 2 s = k e θ c s T m s + 1 2
To compare it with the obtained overdamped SOPDT model, the parameters of the model of this class were determined on the basis of the previously made measurements, except that the time delay was calculated rather than measured. Based on the following relationships [24]:
T m = k K u 1     ω u  
θ c = π 2 a r c t g K · k u 1     ω u  
the parameters of the second-order model using the ideal relay without hysteresis were calculated as being θ = 2.467 s and Tm = 4.986 s.
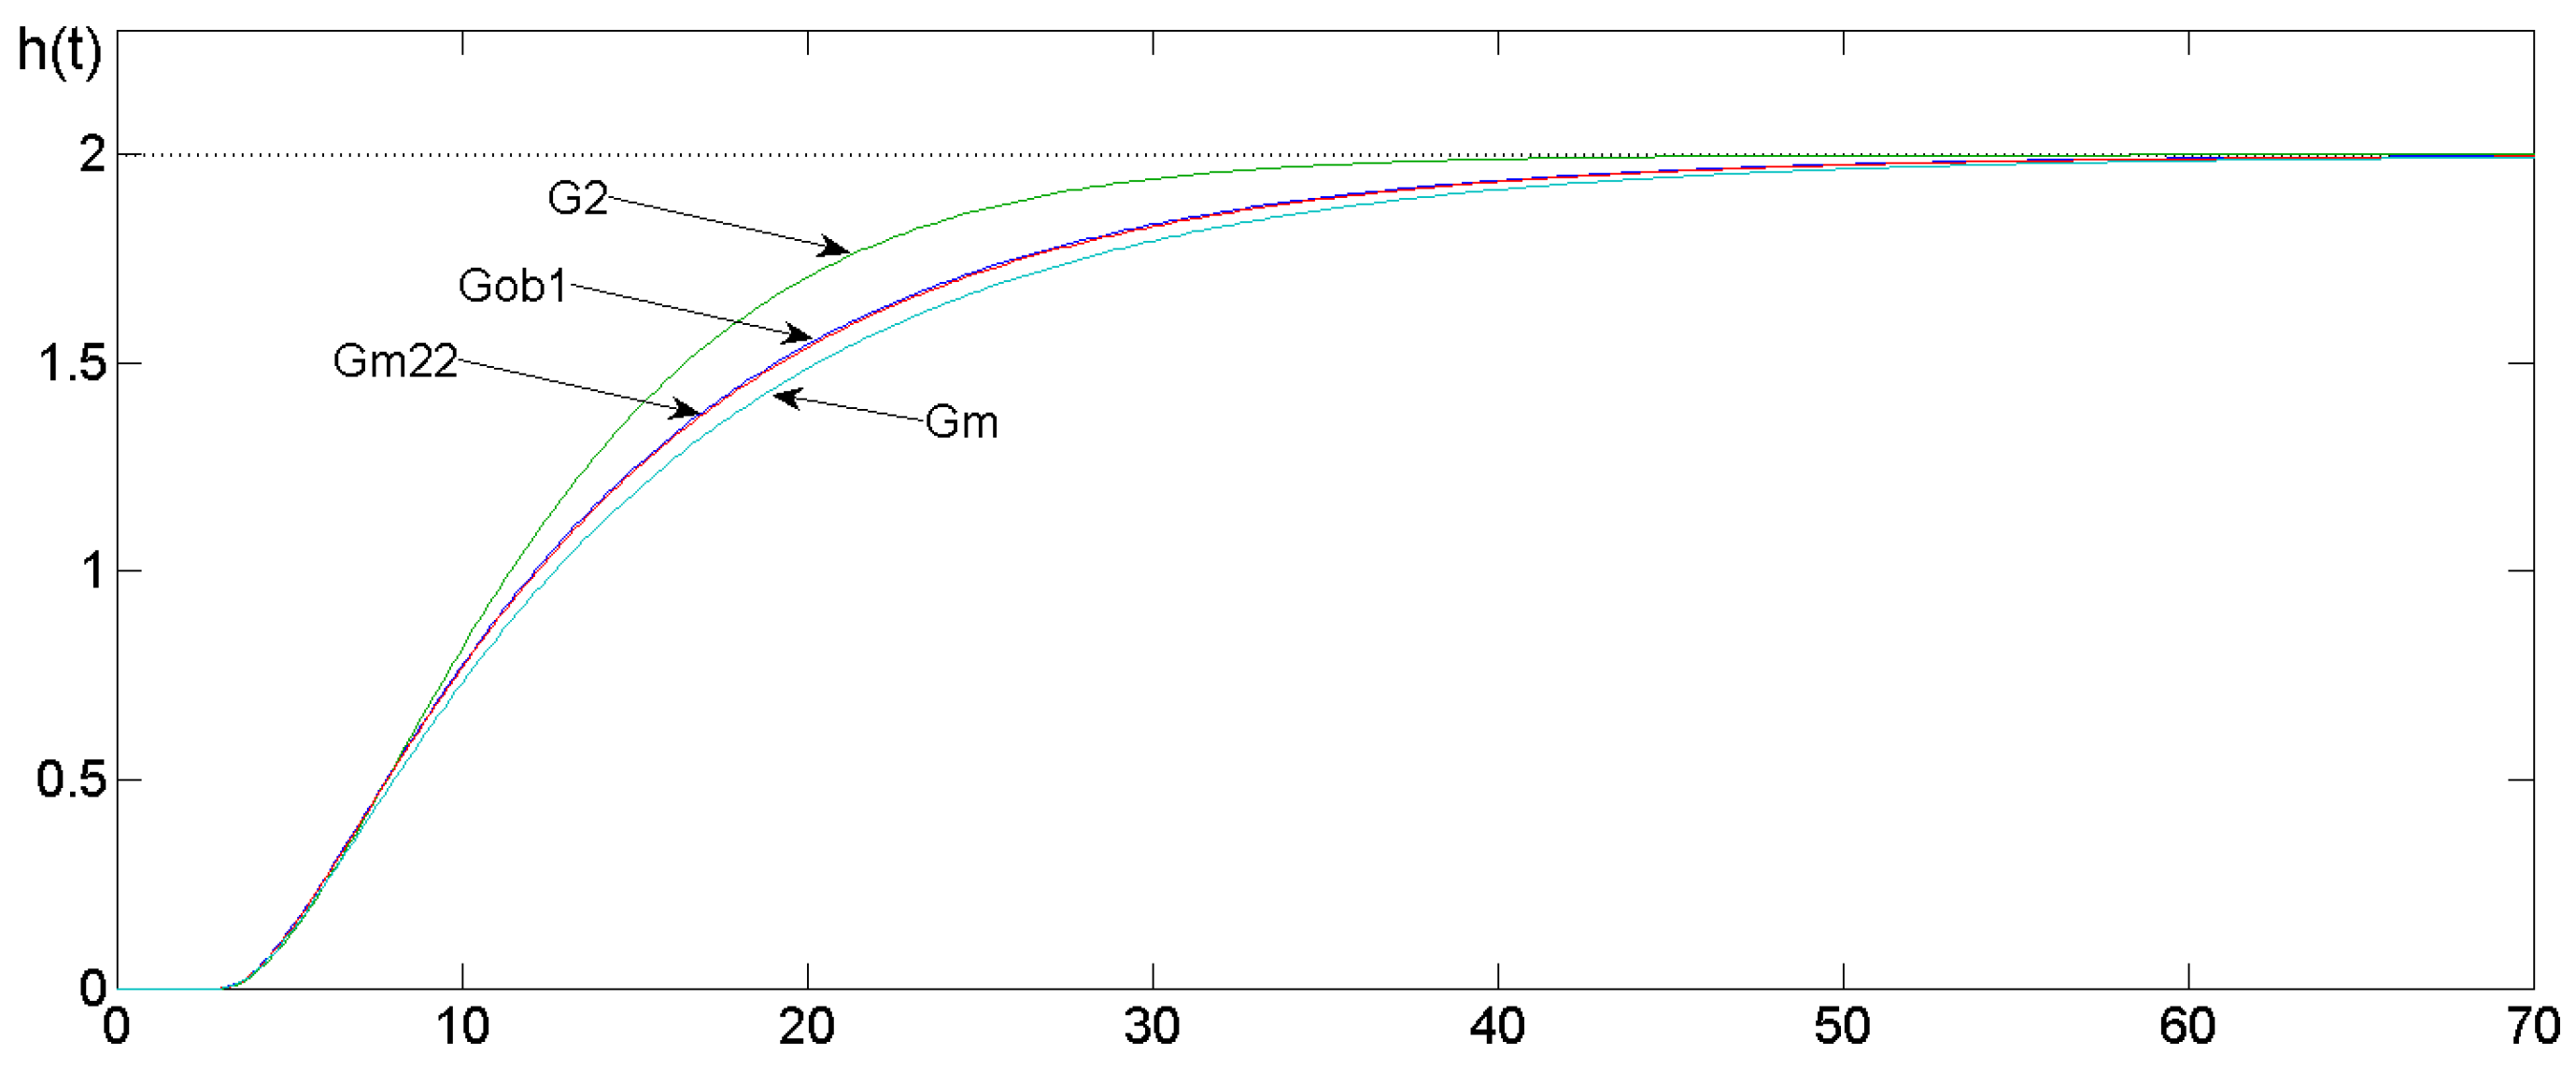
Figure 4 shows the step characteristics of the plant, the models created by the proposed method, and the critically damped SOPDT, which was constructed using the above formulae.
In the considered example, the model obtained only on the basis of the values measured using only the standard identification tests also better reflected the properties of the plant than the critically damped SOPDT.
It should be emphasized that the value of θc is a limiting value for the time delay, i.e., when the measured value of the delay was greater than θc, we assumed that θ = θc for the model, as determined using the described method.
Example 2
The transfer function of the plant subjected to the identification test was
G 2 s =   e 2 s 10 s + 1 s + 1
The steady-state gain of the model was measured in the pretest as 0.996 and the delay time as equal to 2.01 s. When the ultimate gain Ku = 7.07275 was reached, the ultimate frequency ωu = ω1 = 0.5985, and, after the introduction of the ideal integral term, the frequency of the sustained oscillation changed the value to ω2 = 0.1742. From the measurement of the limit cycle using a saturation relay with a gain of k = 1.16·Kue, the critical frequencies ω1 = 0.599 and ω2 = 0.176 were obtained, which made it possible to determine the time constants T1 = 0.992 s and T2 = 9.775 s.
Example 3: SOPDT model with uncertainty
The examples presented above concern the creation of second-order models of objects of the same order, where the quality of the model is only related to the accuracy with which its parameters are determined. The next examples deal with higher-order plants, where the problem of modeling the influence of poles further from the imaginary axis arises.
Now let us consider a high-order inertial plant, where a second-order model is not able to fully represent its properties. Its transfer function is given as
G 3 s = 10   e 4 s 2 s + 1 4 s + 1   s + 3 3
From the measurement of the limit cycle using a saturation relay with a gain of k = 1.16·Kue, the critical frequencies were ω1 = 0.327 rad/s and ω2 = 0.148 rad/s.
G m 3 s = 0.37 e 4.48 s   11.4 s 2 + 6.42 s + 1
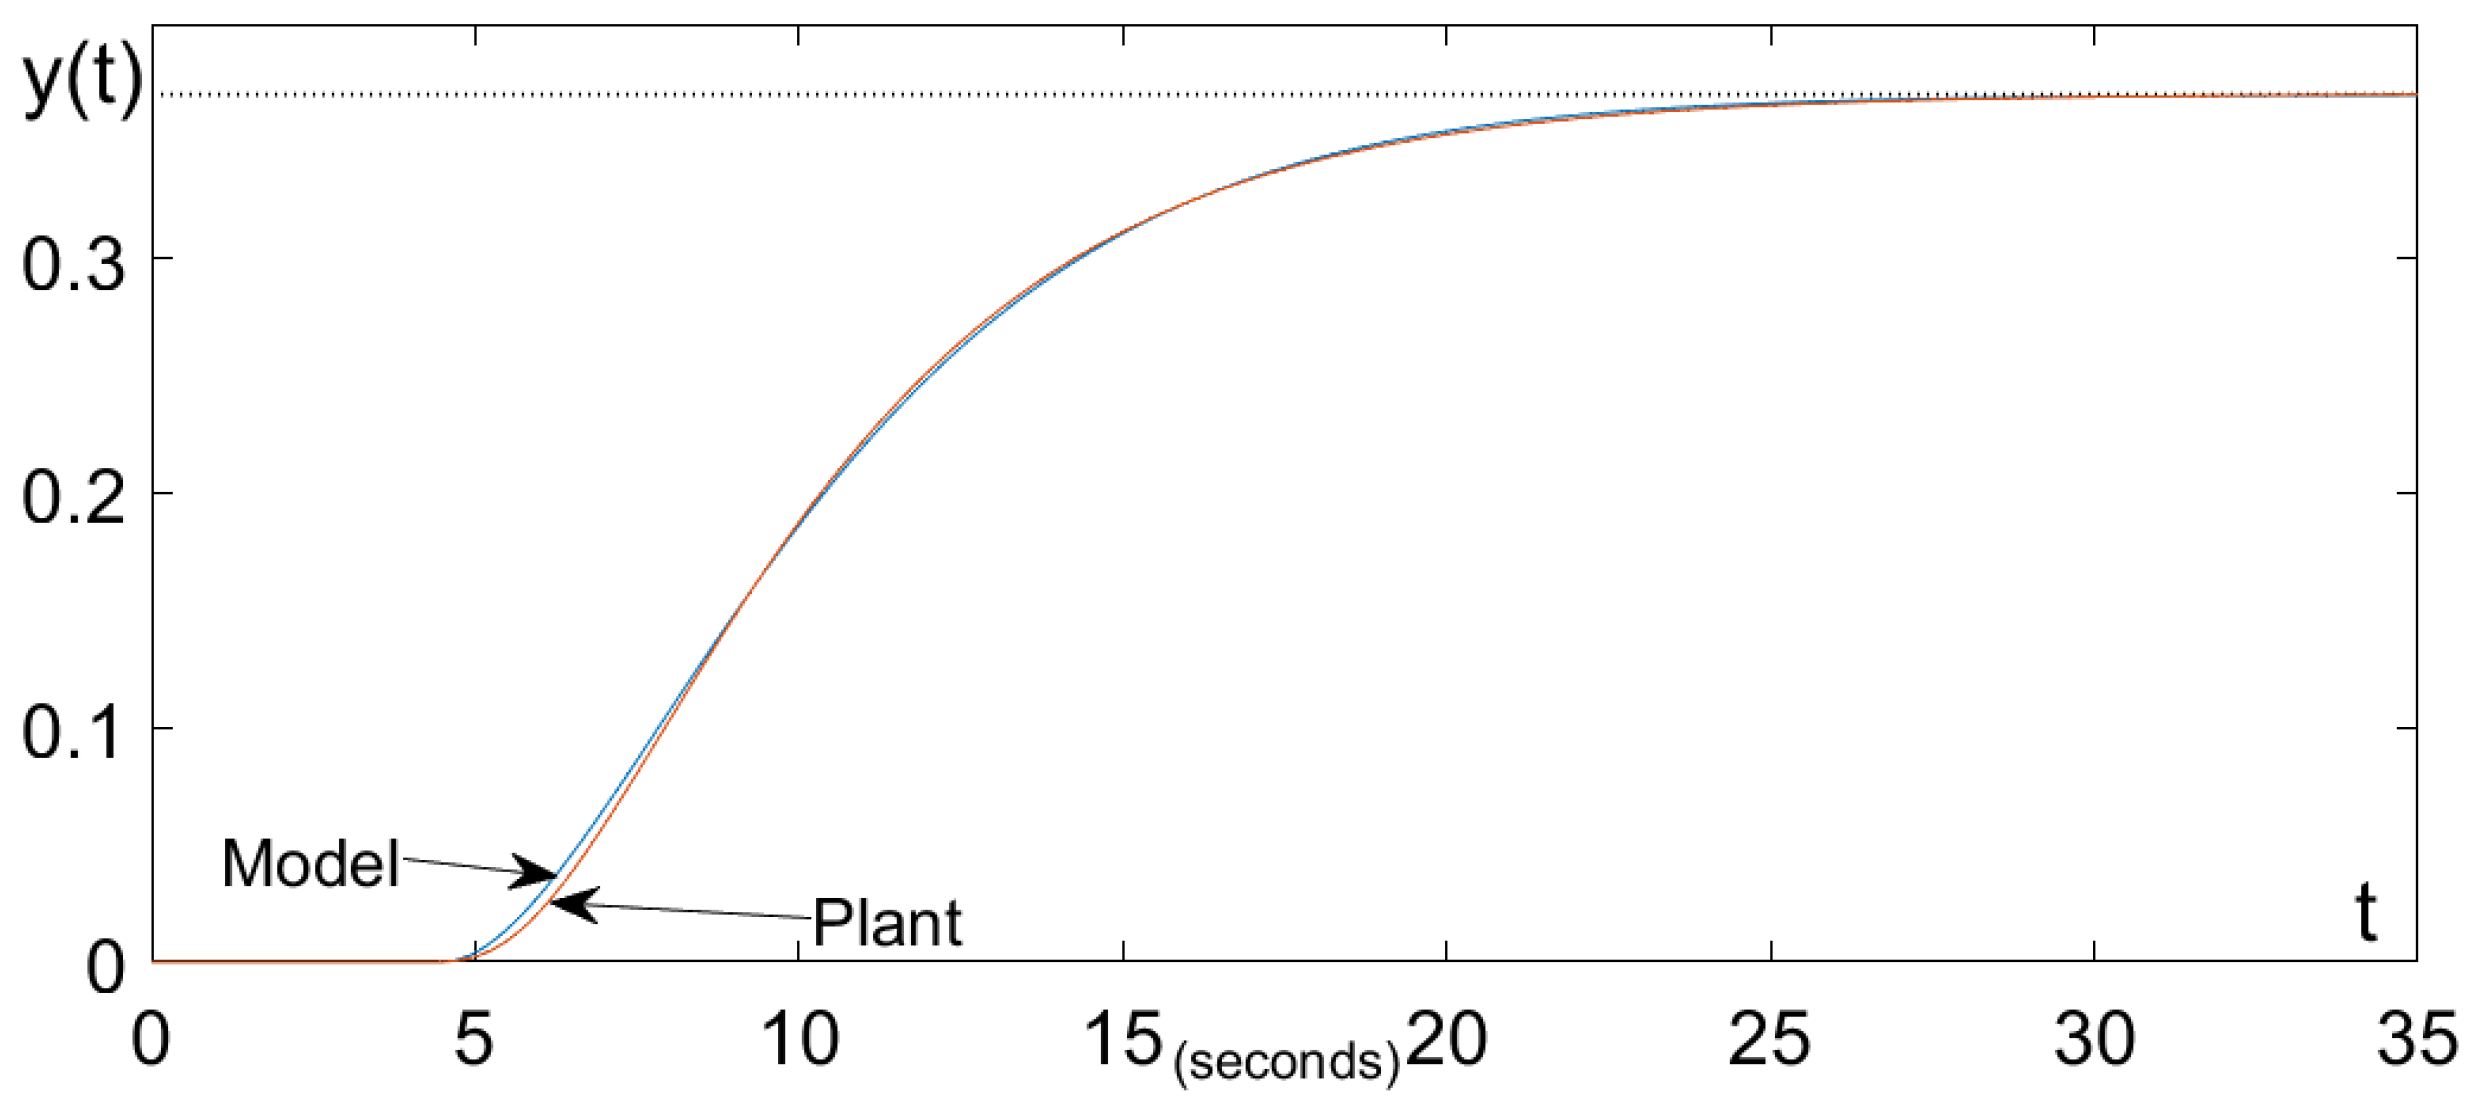
The following measurement results were obtained by simulating the identification process of this plant: the time delay was θ = 4.48 s, the increase in the controlled variable at B = 0.5 after 40 s was Δy = 0.185, oscillation period was Tosc1 = 19.2 s, and the oscillation period after adding the integrator was Tosc2 = 42.3 s. On the basis of the measured values, the steady-state gain K = 0.37 and the product a and sum b of the time constants were calculated, which were equal to a = 11.4 and b = 6.42. Figure 5 shows the step response of the plant and the model created via the proposed method.
Example 4: Plant with a low θ/Tdom ratio
In the previous example, θ/Tdom, which captures the ratio of the dead time to the dominant time constant, was large at 1. Let us now consider the case when it is small. The transfer function of a plant that is subjected to an identification test is
G 4 s = 3 1.5 s + 1   e 3 s 10 s + 1 8 s + 1 5 s + 2 3 s + 1 0.1 s + 1
The steady-state gain of the model was measured in the pretest as being 1.486 and the dead time as equal to 3.51 s. The following data were obtained during the critical oscillation measurements: the time delay was 6.5 s, an ultimate gain of Ku = 2.651 was reached, the ultimate frequency was ωu = ω1 = 0.172 rad/s, and, after the introduction of the ideal integral term, the frequency of the sustained oscillation changed the value to ω2 = 0.0681 rad/s. Since the measured time delay was found to be greater than the assumed maximum value θc, which was calculated from relation (29) to be equal to 6.1 s, the parameter θ = θc was adopted; we thus obtained the transfer function of the model as follows:
G m 4 s = 1.486 e 6.1 s   95.68 s 2 + 18.52 s + 1
The step responses of the plant and its model are shown in Figure 6.
Comparing the responses of the plant and the model, it can be concluded that the time constant of the model’s delay, although it shifts the model’s response in time, allowed for proper coverage of the high-frequency dynamics.

3.2. Comparision with Other Methods

Ramakrishnan and Chidambaram [12] applied the method formulated by Padmasree and Chidambaram [25] to an asymmetrical relay test to identify four parameters of an SOPDT model. They tested its performance on a plant like the one described in example 2. The models obtained as a result of this test and those presented by Li et al. [17], Bajarangbali et al. [9], and Shen et al. [26] were compared with the model determined above, as shown in Table 1, in which the last column gives the integral quality indicator defined as
I = 1 T 0 T y p t y m t   d t    
where yp and ym are the output of the process and model under the step change, respectively, and T is the integration time, where T = 10(T1 + T2).
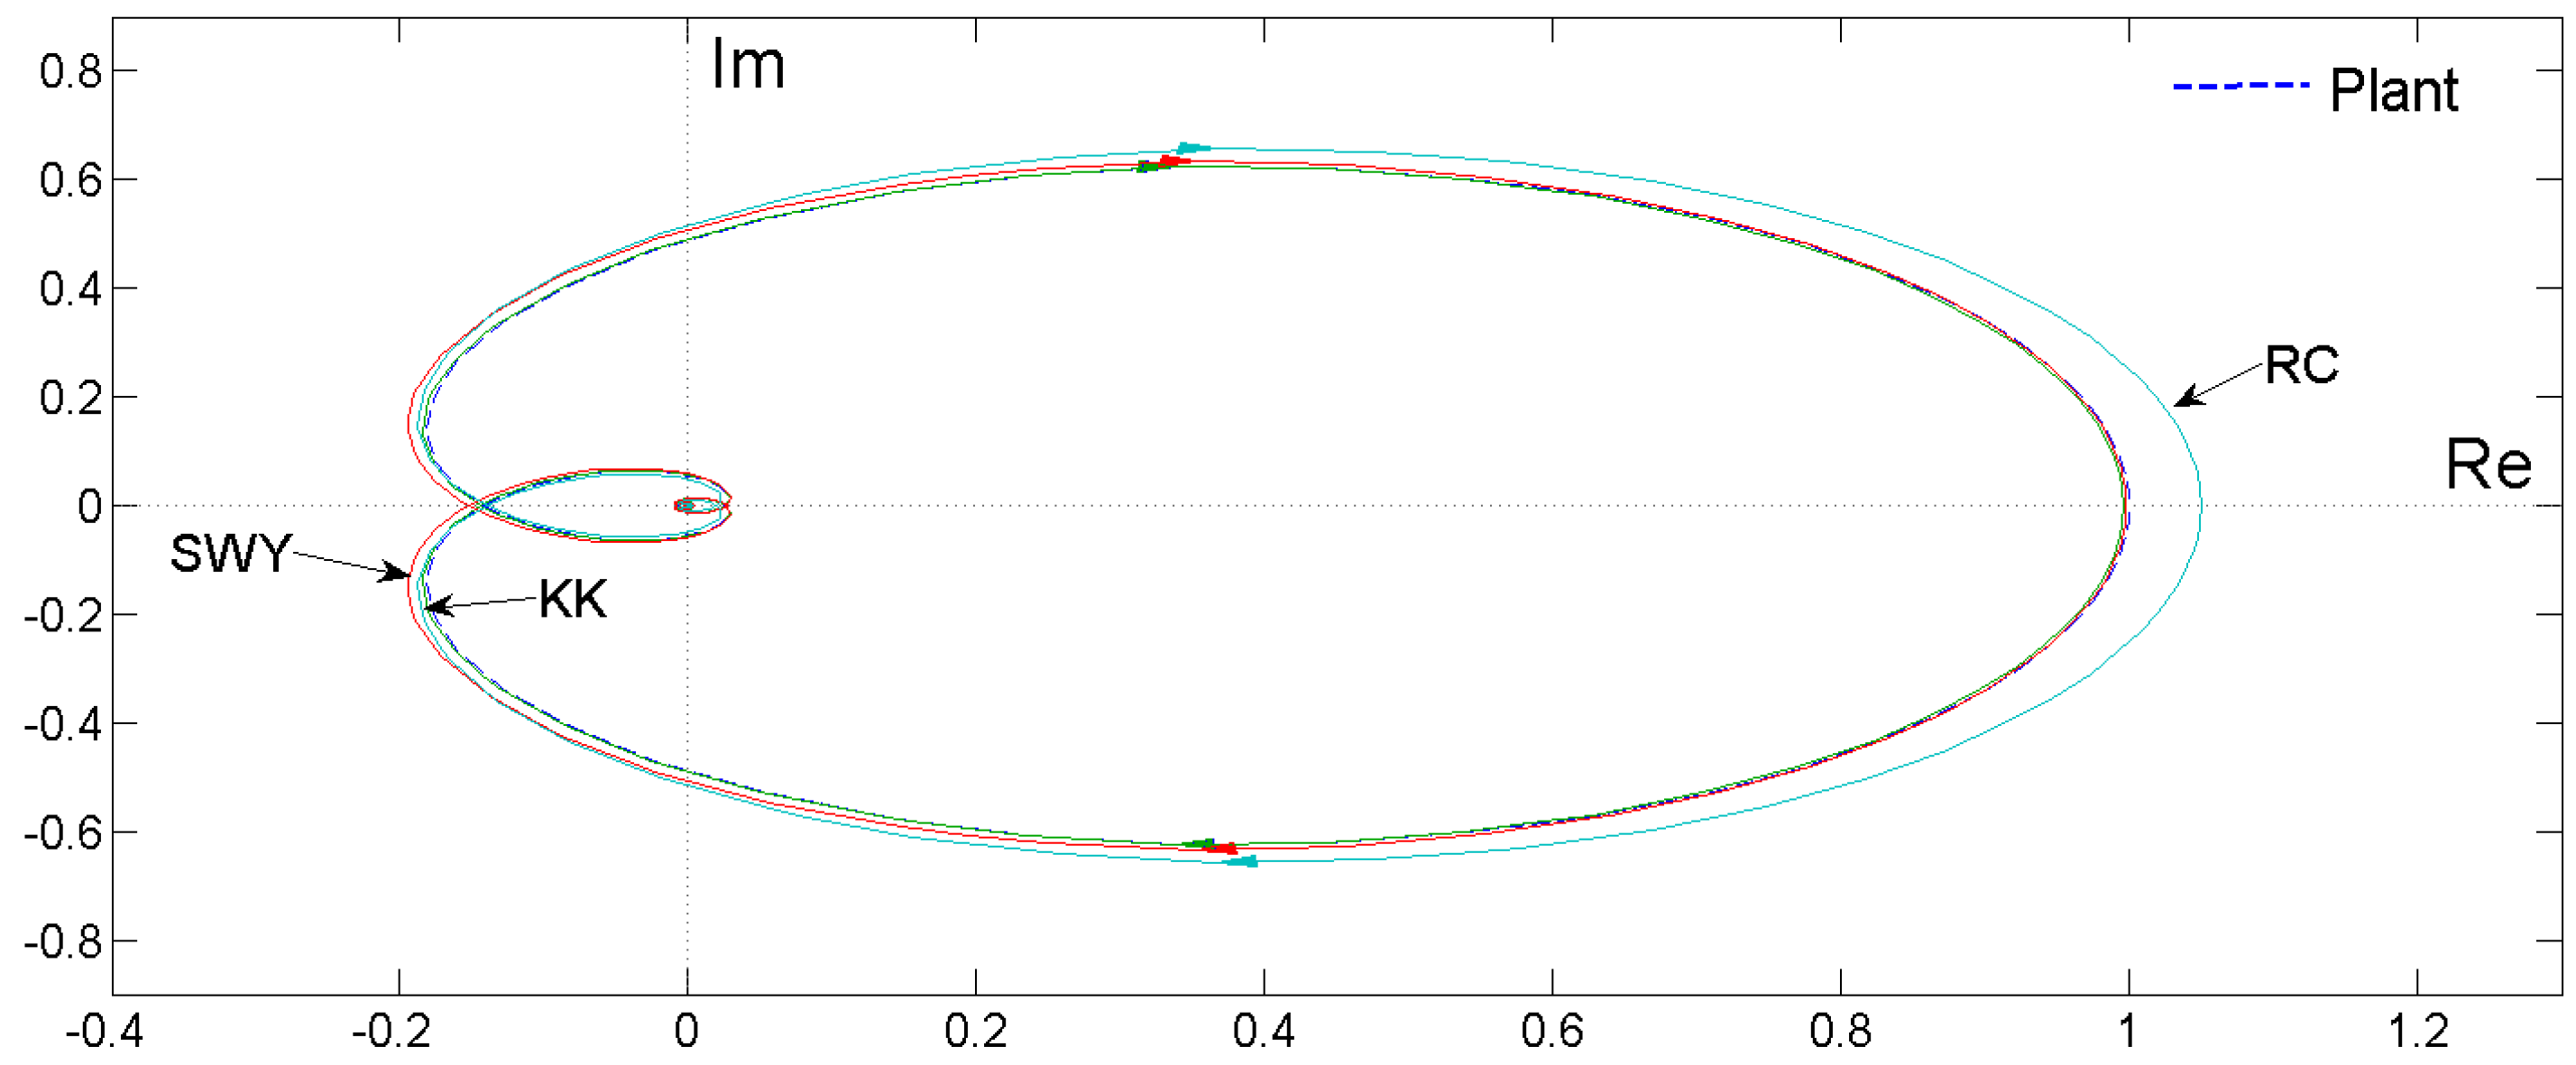
Figure 7 shows a Nyquist diagram of the plant and selected models.
RC—Ramakrishnan and Chidambaram; SWY—Shen, Wu, and Yu; KK—model obtained using the presented method.
The possibilities offered by this method were also compared with the results obtained in [18] in which Kasi and coworkers considered a plant as follows:
G 3 s = 2   e s 10 s + 1 5 s + 1
They used a discrete wavelet transform for the analysis of the noisy limit cycle and the unknown parameters were calculated numerically, allowing them to produce a highly accurate model: Gm(s) = 1.986·exp(−0.999s)/(9.8479s + 1)(5.045s + 1). Using the method described with the input data of K = 1.996, θ = 1.01, ω1 = 0.539 rad/s, and ω2 = 0.1242 rad/s, the resulting model had a transfer function Gm(s) = 1.991·exp(−1.01s)/(10.23s + 1)(4.84s + 1) and was therefore equally accurate and determined much more simply.

3.3. Robustness

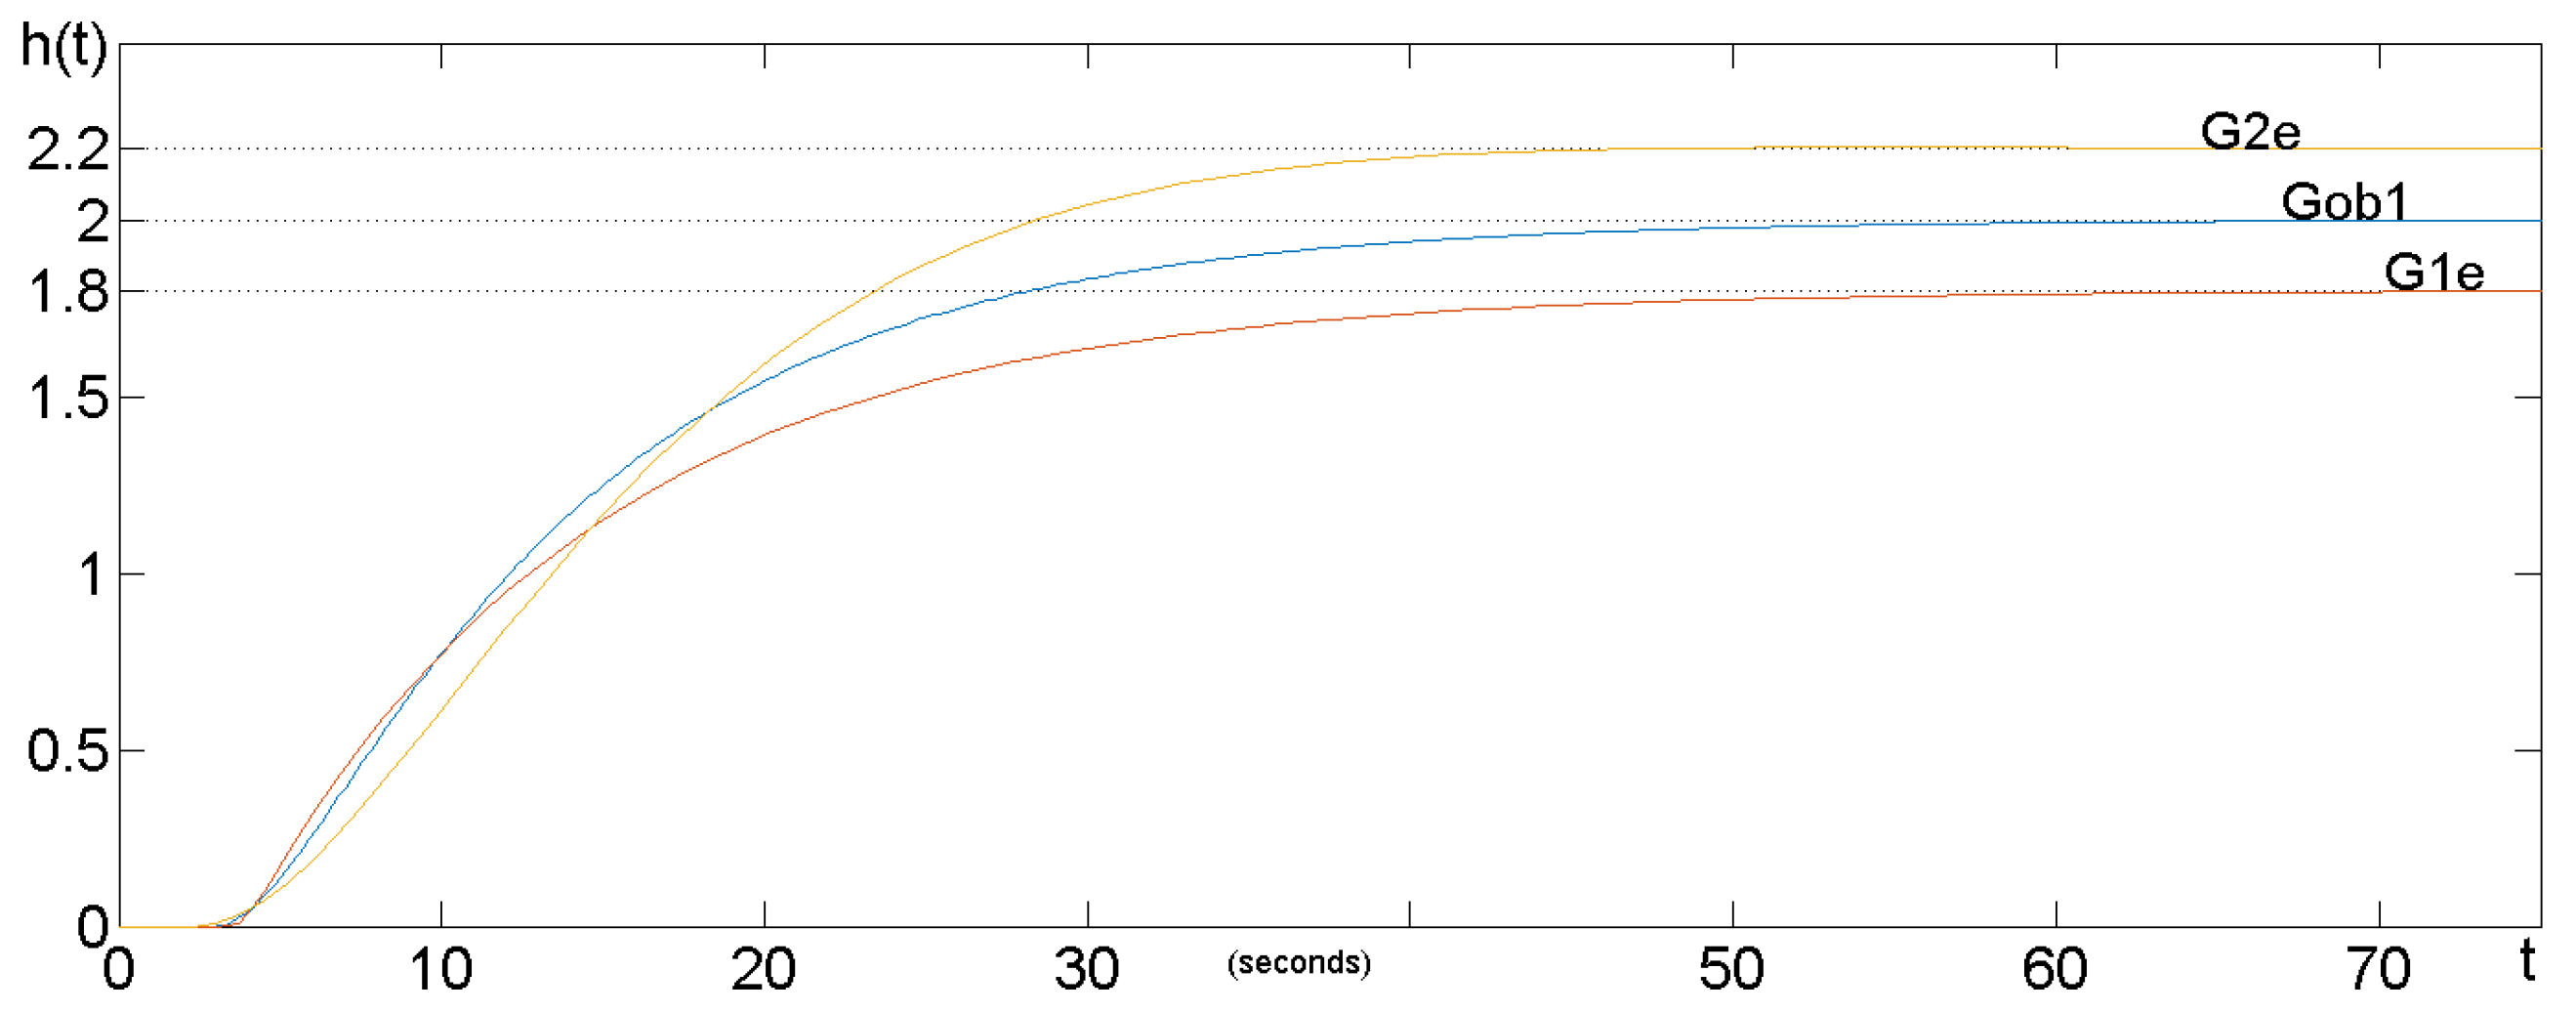
Let us assume that the measurements carried out during the identification test were subject to greater error than was apparent from the capabilities of the method used. To investigate what effect this would have on the accuracy of the model in example 1, let us assume that the error values of the measurements denoting steady-state gain, time delay, and ultimate frequency without and with the integral term in the feedback were equal:
(Case 1) K1e = 90%·K, θ1e = 120%·θ, ω11e = 120% ·ω1, ω21e = 120%·ω2;
(Case 2) K2e = 110%·K, θ2e = 80%·θ, ω21e = 80% ·ω1, ω22e = 80%·ω2.
The following models were obtained from these measurements:
G 1 e s = 1.8   e 3.6 s 3.01 s 2 + 11.19 s + 1
G 2 e s = 2.2   e 2.4 s 57.47 s 2 + 13.47 s + 1
The differences between the responses of the plant and the models determined from measurements subject to errors are shown in Figure 8. However, what effect these differences have on the variation of the controlled variable will depend on several factors, including the structure of the control system and the control rule. When a controller’s tuning is aimed at preserving higher robustness, the effect on the decrease in control performance will be low.
The presented method of online relay identification allowed for precisely determining the model of a time-delayed second-order inertial plant. Of course, the correct result will be obtained only when the measurement variables required for the calculations, such as the ultimate frequencies of the closed system and the system with an added integrator, static gain, and dead time, are accurately measured. When the measurements of these variables contain some errors, the obtained model will differ from the mathematical description of the real object. Measurement noise falling into the high-frequency range of the signal spectrum is a common problem that arises during process identification. Majhi proposed [5] the introduction of an integral filter into the loop. Such a noise-cancellation technique requires two relay experiments: one to design the integral filter and another to identify the process model parameters. Another approach used to eliminate limit cycle noise via a wavelet decomposition technique was presented by Kasi and coworkers [19]. During the identification process, they applied a wavelet transform to extract a noise-free signal. While the methods for determining the static gain mentioned in Section 2.2 are robust to both load disturbances and measurement noise, the most accurate method for determining the delay time based on the shift of the plant’s response to the input is not robust. It is based on zero-crossing detectors, which, in the presence of noise, i.e., signals that are inadequate for the actual value of the controlled variable, could distort the measurement. To avoid this, the delay measurement, what is conducted during the pretest, can be set to track the averaged plant’s response ya:
y a t = 1 τ t b t b + τ y t + η t d t
where τ is the duration of the test, tb is the moment the test starts, and η is the measurement noise.
When this exceeds a preset threshold, the timer will stop. Even if the average value of the measurement noise during the delay time is different from zero, it will still be much lower than the random deviation from the actual value of the controlled variable. This ensures greater robustness of the measurement to noise, but unfortunately reduces the accuracy of the measurement. The most sensitive parameter of the model under consideration is the time delay. As mentioned in Section 2.3, it can be measured in two ways, whereby a measurement of a delay during the limit cycle test is more robust to noise.
A limitation of this method is that it only applies to the identification of stable processes.

4. Conclusions

The SOPDT model identification method presented in this article, unlike the methods mentioned in the Introduction, did not require any signal transformations, solving of non-linear equations, or the use of other calculations using numerical methods. During the identification experiment, measurements of the relevant quantities were made.
The quality of the resulting model was influenced by the correct choice of model class; the accuracy of the measurements carried out regarding the static gain, dead time, and both critical frequencies; and, indirectly, by the duration of the measurements, the presence of measurement noise, and possibly the impact of time-variant disturbances. The relatively simple method for creating the SOPDT model presented in this paper allowed for a more accurate representation of the dynamics of lower-order systems while maintaining the standard accuracy of limit cycle parameter measurements. In order to improve the quality of the model created, a two-stage procedure was employed, which used a relay with saturation and appropriately selected gain to generate sustained oscillations.
The presented method for measuring the dead time under certain conditions may allow for a more precise determination of this model parameter. Moreover, the algorithms for the calculations needed to derive the next three of the four model parameters do not require any transformations of the process description or calculations via numerical methods, which makes this method unique with this number of unknowns. A special feature of this method is the possibility of dispensing in the second stage of the experiment with the measurement of the amplitude, which in the presence of noise may be subject to some error. The proposed SOPDT model identification method is the simplest calculation approach and produces the most accurate models within this class.
A certain disadvantage may be the slightly longer duration of the extended identification experiment, which was ultimately intended to increase the accuracy of the created model since, during the identification test, the system lost its ability to react to load disturbances.
In addition to the considered problem of reducing the influence of measurement noise, which to a greater or lesser extent affects all relay autotuning methods, it would be advisable in real-time systems to consider, if only by means of heuristic methods, the estimation of the time delay of higher-order models, of which part is due to dead time and the remainder to the phase lag introduced by high-frequency dynamics. The delay time of the critically damped model, which can be calculated analytically (29), can then be taken as a maximal reference value. Previous studies on model quality assessed on the basis of the step or frequency characteristics would suggest reaching for fuzzy logic when identifying the delay time, at least in the case of insufficient a priori knowledge of the controlled plant.

Funding

This project was financed under the program Regional Initiative of Excellence of the Polish Minister of Science and Higher Education called Regionalna Inicjatywa Doskonałości w latach 2019–2022 nr projektu 006/RID/2018/19 kwota finansowania 11 870 000 zł.

Institutional Review Board Statement

Not applicable.

Informed Consent Statement

Not applicable.

Data Availability Statement

Data sharing not applicable.

Conflicts of Interest

The author declares no conflict of interest.

References

  1. Sato, T.; Hayashi, I.; Horibe, Y.; Vilanova, R.; Konishi, Y. Optimal Robust PID Control for First- and Second-Order Plus Dead-Time Processes. Appl. Sci. 2019, 9, 1934. [Google Scholar] [CrossRef] [Green Version]
  2. Liu, T.; Wang, Q.-G.; Huang, H.-P. A tutorial review on process identification from step or relay feedback test. J. Process Control 2013, 23, 1597–1623. [Google Scholar] [CrossRef]
  3. Åstrom, K.J.; Hågglund, T. Automatic tuning of simple regulators with specifications on phase and amplitude margins. Automatica 1984, 20, 645–651. [Google Scholar] [CrossRef] [Green Version]
  4. Srinivasan, K.; Chidambaram, M. Modified relay feedback method for improved system identification. Comput. Chem. Eng. 2003, 27, 727–732. [Google Scholar] [CrossRef]
  5. Majhi, S. Relay based identification of process with time delay. J. Process Control 2007, 17, 93–100. [Google Scholar] [CrossRef]
  6. Wang, Q.-G.; Zhang, Y. Robust identification of continuous systems with dead-time from step responses. Automatica 2001, 37, 377–390. [Google Scholar] [CrossRef]
  7. Shin, G.W.; Song, Y.J.; Lee, T.B.; Choi, H.K. 2007. Genetic algorithm for identification of time-delay systems from step responses. Int. J. Control. Autom. Syst. 2007, 5, 79–85. [Google Scholar]
  8. Hofreiter, M.; Hornachova, A. Process Identification Using Relay Shifting Method for Auto Tuning of PID Controller. MATEC Web Conf. 2019, 292, 01015. [Google Scholar] [CrossRef] [Green Version]
  9. Bajarangbali, R.; Majhi, S.; Pandey, S. Identification of FOPDT and SOPDT Process Dynamics Using Closed Loop Test. ISA Trans. 2014, 53, 1223–1231. [Google Scholar] [CrossRef]
  10. Pandey, S.; Majhi, S. Limit cycle based identification of second order processes with time delay. In 2016 Indian Control Conference (ICC); IIT: Hyderabad, India, 2016; Volume 2, pp. 438–773. [Google Scholar]
  11. Majhi, S.; Atherton, D.P. Autotuning and controller design for processes with small time delays. IEE Proc. Control Theory Appl. 1999, 146, 415–424. [Google Scholar] [CrossRef]
  12. Atherton, D.P.; Majhi, S. Plant parameter identification under relay control. In Proceedings of the 37th IEEE Conference on Decision and Control, Tampa, FL, USA, 18 December 1998; pp. 1272–1277. [Google Scholar]
  13. Ramakrishnan, V.; Chidambaram, M. Estimation of a SOPTD transfer function model using a single asymmetrical relay feedback test. Comput. Chem. Eng. 2003, 27, 1779–1784. [Google Scholar] [CrossRef]
  14. Wang, Q.G.; Hang, C.C.; Bi, Q. Process frequency response estimation from relay feedback. Control. Eng. Pract. 1997, 5, 1293–1302. [Google Scholar] [CrossRef]
  15. Wang, Q.G.; Zhang, Y.; Guo, X. Robust closed-loop identification with application to auto-tuning. J. Process Control. 2001, 11, 519–530. [Google Scholar] [CrossRef]
  16. Kaya, I.; Atherton, D.P. Parameter estimation from relay autotuning with asymmetric limit cycle data. J. Process Control 2001, 11, 429–439. [Google Scholar] [CrossRef]
  17. Li, W.; Eskinat, E.; Luyben, W.L. An improved autotune identification method. Ind. Eng. Chem. Res. 1991, 30, 1530–1541. [Google Scholar] [CrossRef]
  18. Sanchez, J.; Guinado, M.; Dormido, S.; Visioli, A. An Improved Relay-based Identification Approach based on Asymmetric Oscillations. IFAC PapersOnLine 2018, 51, 468–473. [Google Scholar] [CrossRef]
  19. Kasi, V.R.; Majhi, S.; Gogoi, A.K. Identification and PID tuning techniques for stable and unstable SOPDT processes. Int. J. Dynam. Control 2018, 6, 1194–1206. [Google Scholar] [CrossRef]
  20. Ghorai, P.; Majhi, S.; Pandey, S. 2018. A real-time approach for dead-time plant transfer function modelling based on relay autotuning. Int. J. Dyn. Control 2018, 6, 950–960. [Google Scholar] [CrossRef]
  21. dos Santos, J.B.M.; Barros, P.R. 2010. A Simple Identification Technique for Second-Order plus Time-Delay Systems. IFAC Proc. Vol. 2010, 43, 188–193. [Google Scholar] [CrossRef] [Green Version]
  22. Shen, S.H.; Yu, H.D.; Yu, C.C. Use of Saturation-Relay Feedback for Autotune Identification. Chem. Eng. Sci. 1996, 51, 1187–1198. [Google Scholar] [CrossRef]
  23. Hang, C.C.; Åstrom, K.J.; Wang, Q.G. Relay feedback auto-tuning of process controllers—A tutorial review. J. Process Control 2002, 12, 143–162. [Google Scholar] [CrossRef]
  24. Prokop, R.; Korbel, J.; Matušú, R. 2005. Relay-based autotuning: A second order algebraic design. In IEEE International Workshop on Intelligent Signal Processing; Faro; IEEE International Workshop on Intelligent Signal Processing: Piscataway, NJ, USA, 2005; pp. 98–103. [Google Scholar] [CrossRef]
  25. Padmasree, R.; Chidambaram, M. Identification of transfer function model for unstable system with a zero. In Proceedings of the International Conference on Control, Instrumentation and Information Communication, Kolkata, India, 13 December 2001; pp. 37–40. [Google Scholar]
  26. Shen, S.H.; Wu, J.S.; Yu, C.C. Use of biased-relay feedback for system identification. AIChe J. 1996, 42, 1174–1180. [Google Scholar] [CrossRef]
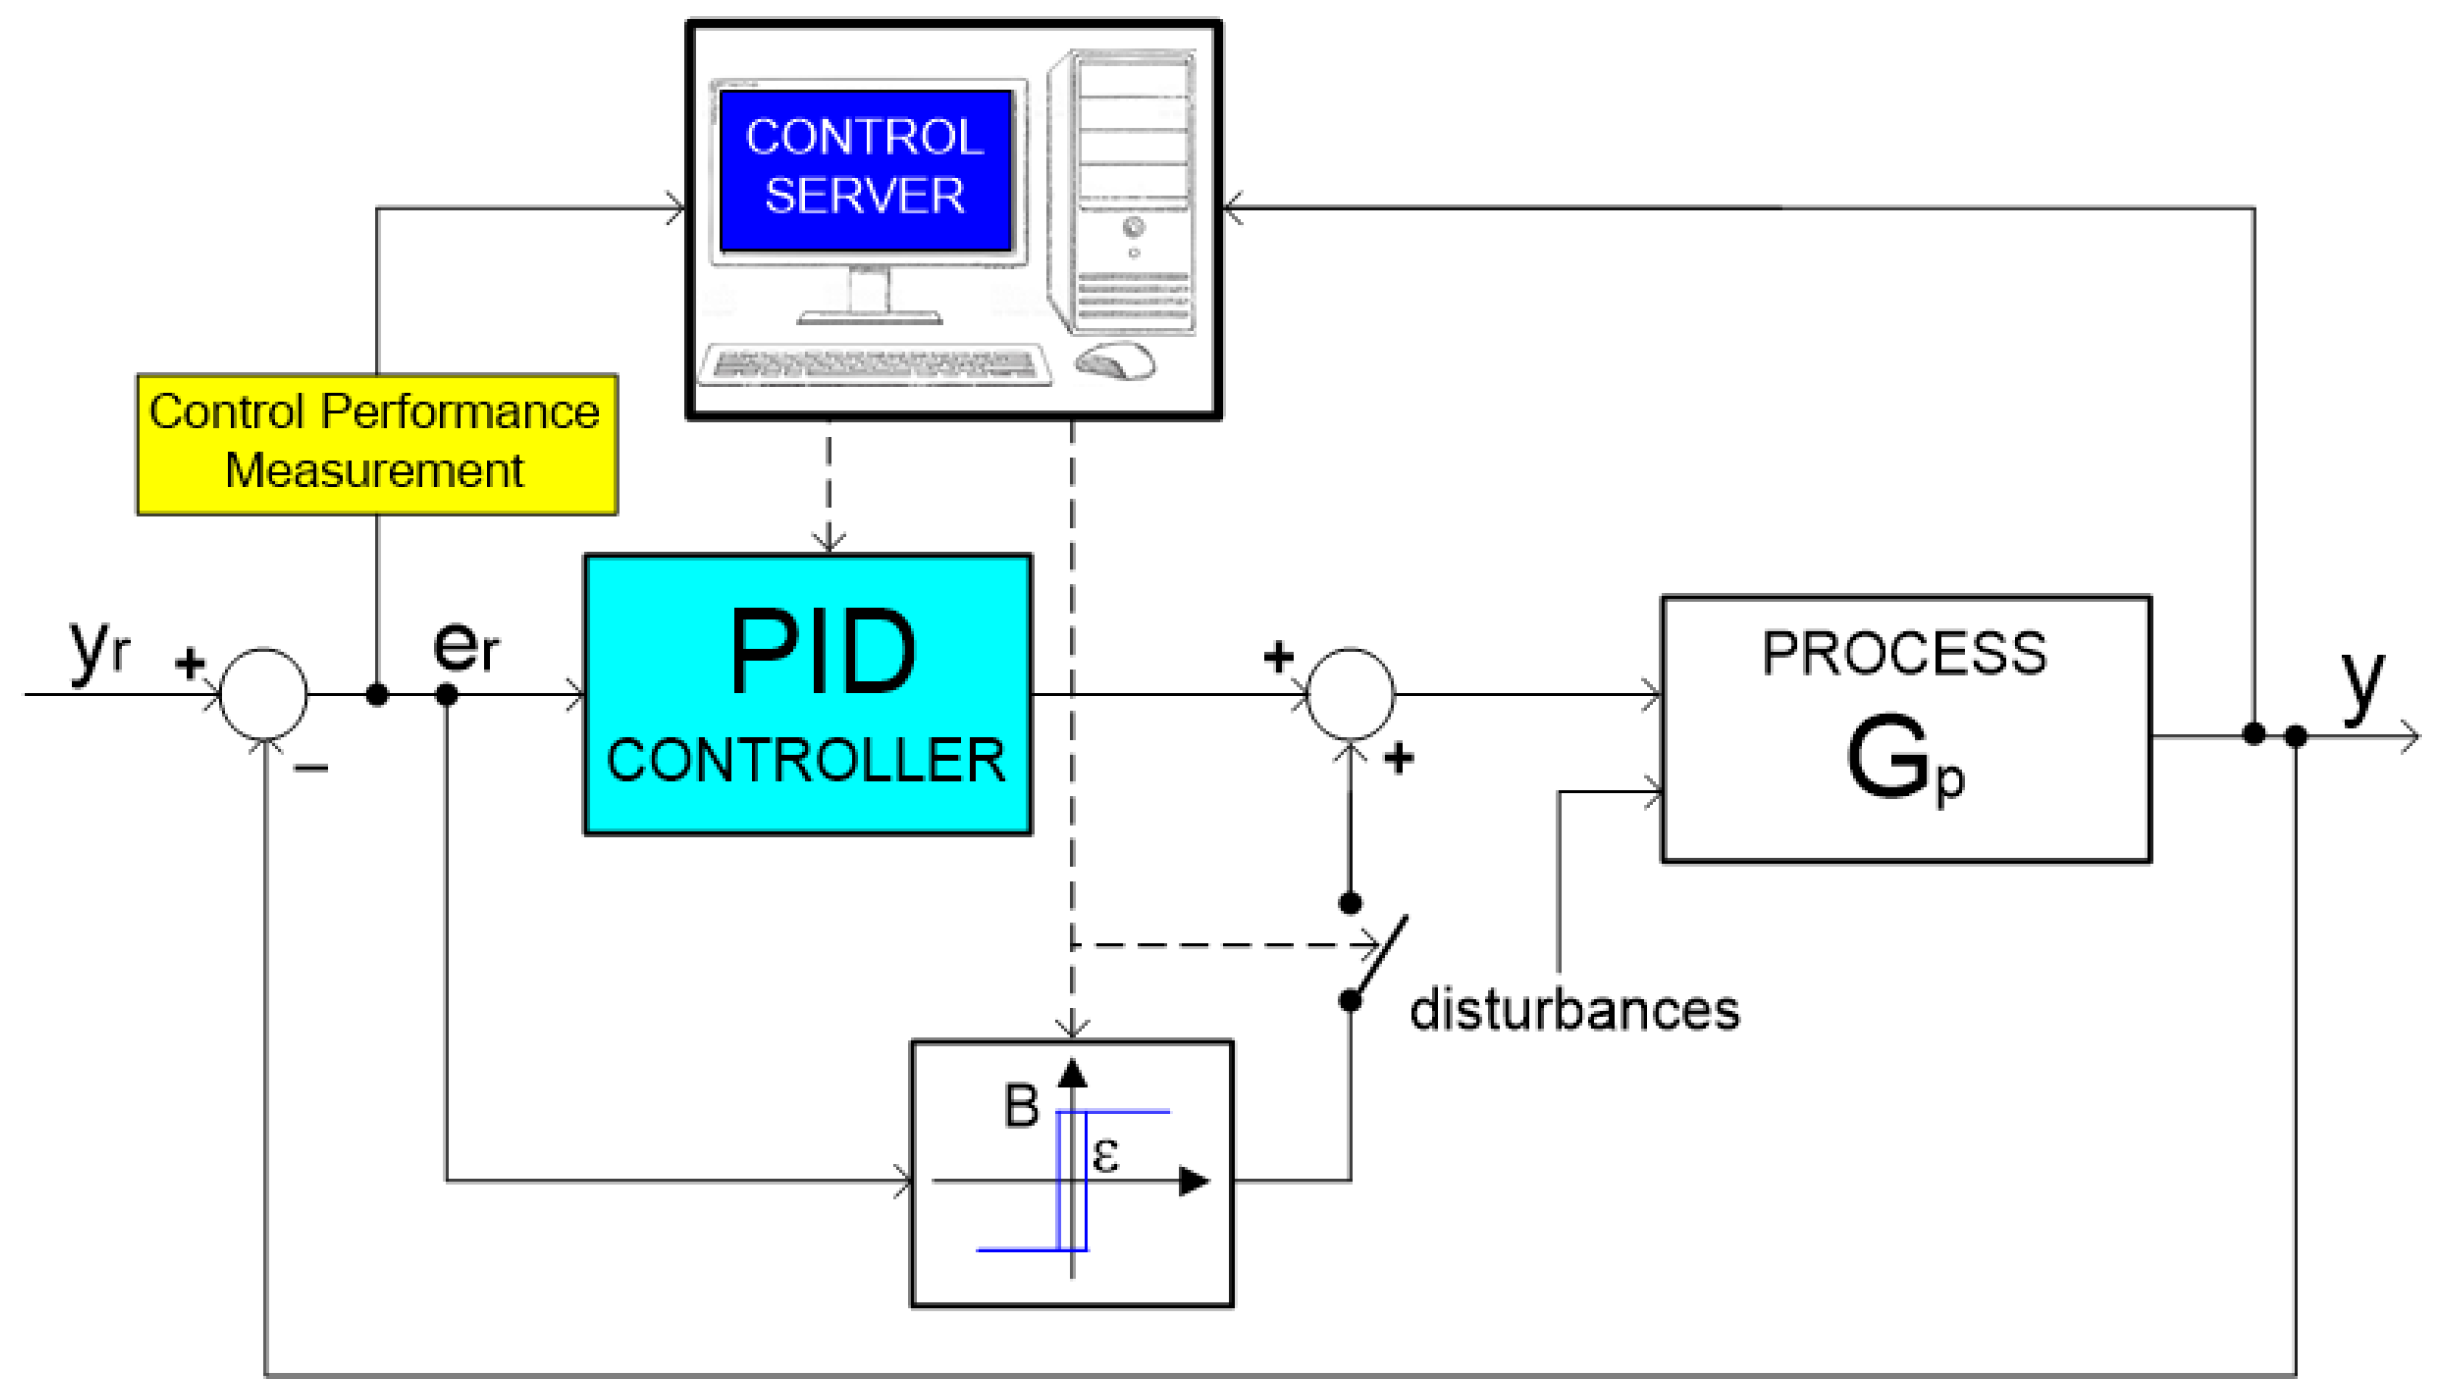
Figure 1. Structure of the control system.
Applsci 13 00632 g001
Figure 2. Time series of selected variables during the pretest.
Applsci 13 00632 g002
Figure 3. Static characteristics of a saturation relay.
Applsci 13 00632 g003
Figure 4. Step characteristics of the plant Gob1 and its models. Gm22—overdamped SOPDT model; Gm—SOPDT model with parameters determined during a single relay test; G2—critically damped SOPDT model.
Applsci 13 00632 g004
Figure 5. Step responses of the plant from example 3 and its model.
Applsci 13 00632 g005
Figure 6. Step responses of the plant from example 4 and its model.
Applsci 13 00632 g006
Figure 7. Nyquist plots of the plant from example 2 and selected models.
Applsci 13 00632 g007
Figure 8. Step responses of the plant and models that were determined from inaccurate input data.
Applsci 13 00632 g008
Table 1. Comparison of parameters of the plant and models obtained by considered methods.
KmθT1T2I
Plant121100
Ramakrishnan and Chidambaram1.051.8141.2179.7660.4603
Li, Eskinat, and Luyben0.8532.01.157.4161.122
Bajarangbali, Majhi, and Pandey0.99232.01.01059.8990.05974
Shen, Wu, and Yu0.9982.01.0449.140.07201
Presented method0.9962.010.9929.7750.03274
Disclaimer/Publisher’s Note: The statements, opinions and data contained in all publications are solely those of the individual author(s) and contributor(s) and not of MDPI and/or the editor(s). MDPI and/or the editor(s) disclaim responsibility for any injury to people or property resulting from any ideas, methods, instructions or products referred to in the content.