Abstract
Lossy dielectric bars have potential applications in high power microwave (HPM) radiation-effect experiments performed in wind tunnels. Under plane excitation, beat wave patterns are observed along lossy and lossless dielectric bars in 3-D electromagnetic simulation results. Mode analysis is performed to clarify the two main modes in the beat waves—the leaky and guided modes. Comparisons are made between the theoretical and simulated results and acceptable agreements are obtained. The absorbing array of lossy dielectric bars is further investigated. The array can attenuate 90% of the microwave power at 10 GHz when a ten-meter series of such arrays is arranged. It is expected that the proposed absorbing array can achieve the required attenuation, considering that the testing object under microwave radiation is also an absorbing structure itself.
1. Introduction
High-power microwave (HPM) radiation presents a great threat to an aircraft’s electronic system and has been widely used for military applications [1,2,3,4]. As microwaves can heat dielectric materials effectively [5,6,7,8,9], in a high-speed air current the absorbing coating on the aircraft’s surface will suffer a harmful heating process. There are also non-heating effects that have not been clearly understood by researchers and may cause some damage to the absorbing material [5,10,11,12]. Therefore, the damage effect of high-power microwaves on absorbing coatings has attracted our attention.
To study this damage effect, high power microwave experiments play an important role. Such experiments require high microwave power density at X band to be injected into a wind tunnel so that the heating effect can be measured in a high-speed wind field [3]. The whole experimental system is illustrated in Figure 1. The injected microwave can be harmful to the equipment inside the wind tunnel and to the research workers outside the wind tunnel because it can propagate along the wind tunnel and leak from some connecting junctions. Meanwhile, the field distribution on the testing object is different from the realistic one, due to the scattering effect. In this work, considering that the absorbing materials attached on the wall cannot effectively attenuate the part of the scattered microwave with the direction along the wind tunnel, the absorbing array of dielectric bars in the middle of the wind tunnel is studied so that this part of the microwave can be attenuated more effectively. In another work, we tried to eliminate the influence of the tunnel on the testing object under microwave radiation by designing the focusing antenna, the geometry of the testing object and the absorbing arrays attached on the wall; this will be introduced in another paper.
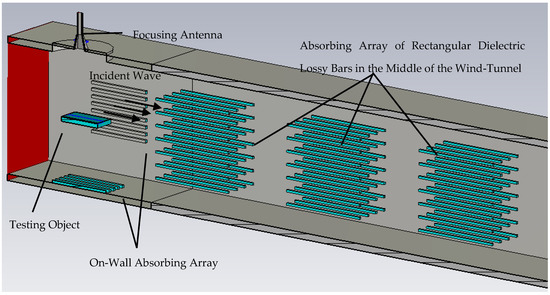
Figure 1.
Schematic diagram of microwave radiation effect experiment in wind tunnel. A matching port is assumed at the left end for simplicity. The right end extends periodically toward the end of the wind tunnel.
The absorption of the injected microwave can be a problem. On one hand, the extremely high-speed airflow restricts the application of common absorbing techniques as the material of the absorbing apparatus should be able to endure strong pressures. The total cross-section area of the absorber is also required to be much less than that of the wind tunnel so that the experimental wind speed is not influenced. Simple structures such as bars or sticks have a very small cross-plane area. For this reason, rectangular dielectric lossy bars (RDLBs) are investigated as the absorbers in the microwave radiation effect experiment.
For simplicity, the propagating modes on the RDLB are assumed to be excited by an incident plane wave whose propagation direction is parallel to the longitudinal direction of the RDLB, as shown in Figure 1, for the following reasons: (i) the geometrical size of the testing object and the distance between the testing object and the RDLBs are both much larger than the wavelength of ~3 cm, so the far field condition can be easily satisfied; (ii) it has been mentioned above that the absorbing array in the middle of the wind tunnel is used to attenuate the incident wave whose propagation direction is parallel or nearly parallel to the bar; as for the scattered waves not parallel to the bar, they will be absorbed by the absorbing structures attached on the side wall; (iii) although the amplitude of the incident wave varies in the cross section, the amplitude of the incident wave near a bar can be approximately uniform if sufficient gaps are provided between adjacent bars; thus, in the following discussions, the incident plane wave is assumed.
In addition, the required microwave power can be produced by a travelling wave tube that can deliver an output power of ~1 MW contained in a pulse of thousands of microwave periods. Therefore, the signal of the electromagnetic wave is assumed to be a time-harmonic sine signal and the transient effects are therefore not considered in this work. It is also assumed that the incident plane wave has the same polarization orientation as that of the microwave field radiated by the linearly polarized focusing antenna.
When the incident wave toward a dielectric bar is a plane-wave, the electromagnetic wave travelling along the dielectric bar or an array of such bars is investigated using scattering theory [13,14,15]. However, research has mainly focused on a situation in which the incident direction is perpendicular to the bar. However, when the incident direction is parallel to the bar or the array, i.e., from the left side to the right side as shown in Figure 1, the field distribution along the dielectric bar and the excited eigenmodes has not been discussed.
To study the modes and the field distribution along the RDLB under the specific incident plane wave, knowledge of the eigenmodes of the electromagnetic wave travelling along such bars is required; this was investigated once [16,17]. It was found that there is an energy transition between the guided mode and the leaky mode [18]. As a result, a beat wave pattern can appear when the guided mode and the leaky mode are excited simultaneously. The theoretical calculation for the guided modes has been proven to agree well with accurate numerical solutions. However, to the best of our knowledge, the analysis of the leaky mode propagating along rectangular dielectric bars has not yet been presented.
The beat wave phenomenon has also been investigated previously for different guiding systems, for example, a raised-strip waveguide [19], a metal-dielectric interface SPP waveguide [20] and a fiber waveguide suspended above a slab [21]. When the incident wave travels along the longitudinal direction of the RDLB, the beat wave pattern can be significant. To the best of our knowledge, a study of the beat wave pattern on dielectric bars under such a plane wave excitation has not yet been presented.
In this paper, efforts were made to analyze the leaky mode on the RDLB and the longitudinal beat wave distribution along such bars under the plane wave excitation with a zero incident angle. For microwave absorption in a wind tunnel as shown in Figure 1, the absorbing array of such bars is also studied with numerical simulation. In Section 2, a beat wave pattern is introduced and it is found that the beat wave consists mainly of a leaky wave and a guided wave. In Section 3, the modes are analyzed using field matching theory and the calculated phase constants are verified. In Section 4, an absorbing array of a lossy dielectric bar is investigated with CST software for absorbing microwave power in a wind tunnel microwave radiation experiment. Finally, the conclusion is presented in Section 5.
2. Problem Description
2.1. Beat wave Propagation along Dielectric Bar
The relative permittivity of the dielectric bar is εr = 4.3. The bar is a square in cross section. An incident plane wave propagates toward +z direction with the electric field polarized in y direction, as shown in Figure 2a. The CST models used in this work are shown in Figure 2b,c. In the CST Eigenmode solver, the model shown in Figure 2b has perfect electric conductor boundaries in one transverse direction and perfect magnetic conductor boundaries in the other transverse direction. Periodic boundaries are applied in the longitudinal direction. In the CST Time-Domain Solver, the model shown in Figure 2c has open boundaries and periodic boundaries in all transverse directions for single bar simulation and absorbing array simulation, respectively. Open boundaries in the longitudinal direction are always applied for exciting incident plane waves. These two models are used for the simulations in this paper containing the following sections.
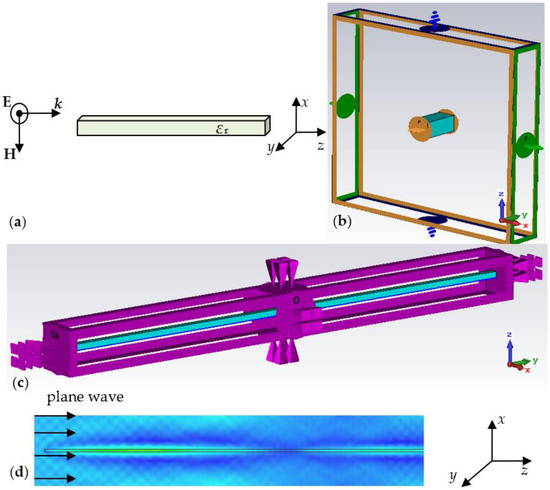
Figure 2.
Schematic diagram of dielectric bar under plane-wave excitation (a), simulation model using CST Eigenmode Solver (b), simulation model using CST Time-Domain Solver (c) and Beat wave pattern along a dielectric bar simulated by CST Time-Domain Solver (d).
Field distribution on the xoz plane with a plane wave excitation is shown in Figure 2d. It is observed that a beat wave propagates along the dielectric bar. It should be mentioned that the beat wave is usually defined as the superposition of two waves with different frequencies; however, in this situation, the waves at the same frequency have different wave numbers in the propagation direction.
A lossy bar under plane-wave excitation is simulated and the electric field distribution and power loss distribution are obtained and shown in Figure 3. The lossy material is FR-4. It has a relative permittivity of 4.3 and a tanδ value of 0.025. Figure 3 shows that the beat wave phenomenon still occurs when the material of the dielectric bar is lossy.
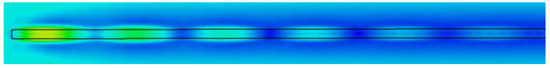
Figure 3.
Beat wave pattern along a lossy dielectric bar.
Further, wave propagation along the dielectric bar is investigated by CST simulation when the bar is illuminated by the radiation form a horn antenna. The results are shown in Figure 4. It is observed that beat wave distribution still exists under the radiation emitted from a horn antenna.
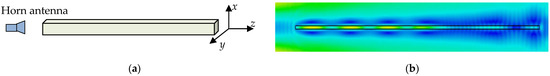
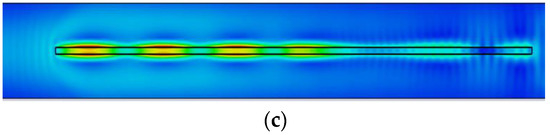
Figure 4.
Beat wave pattern under excitation of horn antenna (a) simulation model of a dielectric bar illuminated by a horn antenna (b) field distribution on x = 0 plane (c) field distribution on y = 0 plane.
Thus, it is found that the beat wave propagation along the dielectric bar (whether lossy or not) may appear under specific types of excitation. Further discussion will be found in the next sub-section.
2.2. Mismatch between Plane Wave and Guided Modes
A coordinate system is selected, as shown in Figure 1. In z < y0 half space, the plane wave propagates in free space and the E-field magnitude of the plane-wave stays to be a constant. The plane wave arrives at the dielectric bar at z = z0. Assume that all the excited modes under plane-wave excitation are guided modes (fields decay exponentially at x and z directions), i.e., radiation modes (approximated as leaky modes) and evanescent modes are negligible.
The superposition of the guided modes should satisfy the boundary condition, which requires the continuity of the tangential fields at the interface. Without the loss of generality, let E represent the tangential component of the electric field of TM(x) mode. Then, a linear combination of the guided modes at z = z0 can be written as
Here, the variation of E versus z is not in consideration. There are infinite items in Equation (1). Assume that Amn is the magnitude coefficient when the superposition of Emn satisfies the continuity of the tangential field component. Let the decay factor of the electric field along x direction in cross-plane be denoted as decay factor τ. It is known that the decay factor becomes larger when the mode order increases. Therefore, the fundamental mode has the slowest rate of decay and the higher-order modes decay quicker. Thus, it can be derived from Equation (1) that
Moreover, there is a maximum A because all the magnitude coefficients should be finite real numbers. Let Amax and τmin denote the maximum magnitude coefficient and the decay factor of the lowest mode, respectively. Equation (2) can be further derived as
where i denotes the mode number for convenience. Further consider the first nth items in Equation (3) and let n tend to infinity, then it can be obtained that
where δx is any specific small quantity and τmin is a positive real number. It can be found that Equation (4) tends to be a geometric series when n increases to infinity, and the common ratio tends to be exp(−τminδx).
It is proved that I2 tends to be zero at infinity, but the field of the plane wave stays a constant value at infinity. As a result, any a linear combination of the guided modes propagating along the dielectric bar cannot match the E-field magnitude of the incident plane wave at z = z0.
A similar conclusion can be obtained when the dielectric bar is excited by the radiation from a horn antenna as shown in Figure 4. The incident field in transverse direction is polynomial, because the traditional directivity of the antenna has a form of (cosθ)q. However, the guided modes under open boundary experience an exponential decay. The incident field experiences a slower decay in the same direction as that of the guided modes along the bar under open boundary. There is still a mismatch between the tangential electric field of the incident wave and the guided modes. Thus, the linear combination of the guided modes cannot match the incident field from a horn antenna as well.
3. Mode Analysis of Beat Wave Pattern
3.1. Guided Wave and Leaky Wave
In this section, we further discuss the beat wave propagation shown in Section 2.1 and Section 2.2 and apply mode matching theory to solve the propagation constants of the excited modes.
The beat wave discussed in this paper obviously consists of at least two modes so that the periodic field distribution can occur. It can be observed from Figure 2 and Figure 3 that local minimums of field strength locate periodically along the z axis. As the local minimums have small field strength relative to that of the local maximums as shown in Figure 5, it can be deduced that all the main modes in a beat wave have very close amplitudes.
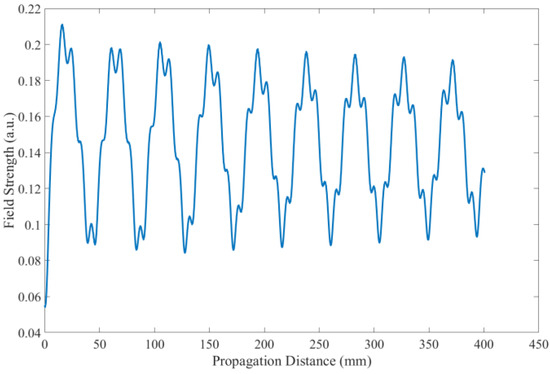
Figure 5.
Amplitude of electric field along y axis when the edge length of the losses dielectric bar is 14.4 mm and the incident plane wave is at 10 GHz.
It can also be observed from Figure 5 that the minimums have a constant periodicity. The curve is approximately close to a sine curve. If the beat wave consists of more than two modes, some other local minimums will be found between two adjacent minimums. Therefore, the number of modes in the beat wave can only be two.
It was discussed in Section 2.2 that the guided mode is not the only mode excited by the incident plane-wave. Either the leaky mode or evanescent mode exists so that the boundary condition can be satisfied. It has been shown in Figure 2 and Figure 3 that the beat wave can propagate quite a long distance relative to the wavelength. The evanescent mode cannot maintain such a long distance. Therefore, the evanescent wave will not be considered in this paper. As a result, the beat wave mainly consists of a leaky wave (representing radiation modes that have a continuous spectrum) and a guided wave. If they have close amplitudes to each other, the minimums of the field strength on y axis will be close to zero.
Leaky modes are typically considered as an approximation of the radiation modes that together with the guided modes constitute a complete set. Radiation modes have a continuous spectrum and are hard to solve theoretically. However, leaky modes provide convenience for the analysis of the beat wave. In our problem, there is only one leaky mode in consideration.
3.2. Analysis of Propagation Characteristics of Guided Wave
The theoretical analysis presented by Marcatilli [18] has been proved to be quite accurate when the frequency is bigger than the cut-off frequency of a guided mode. Field matching theory is applied for solving the propagation problem. The space inside and outside the wave-guide can be separated into 9 regions, as shown in Figure 6.
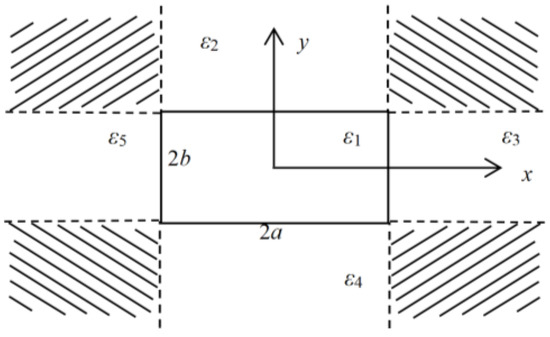
Figure 6.
Region division for theoretical analysis.
Considering the specific excitation in this problem, the propagating mode of concern, noted as TM(y) mode, consists mainly of Ey and Hx components. Under Marcatilli’s assumption, the Bergnis potential functions can be written as
The Bergonis potential functions in the fourth and fifth regions are neglected due to the symmetry of the problem. The relations between Bergonis potential functions and field components are given as
From the wave equations in each region and the phase matching condition on the boundary, the relations between wave numbers in these regions are given by
where ε2 = ε3 = ε0. Using Equations (5)–(15) and applying the boundary conditions for tangential field components, the dispersion relationships of the guided modes can be observed by numerically solving
Equations (13)−(17) consist of seven complex wave numbers that are unknowns to be solved and seven complex equations. Therefore, we can solve them numerically. The simulated and calculated real parts of the longitudinal phase constants are listed in Table 1. The edge length a is set to be 14.4 mm. Acceptable relative errors are obtained in the frequency range from 10−11 GHz. The field matching theory has enough precision for analyzing our problem.

Table 1.
Theoretical and simulated real parts of longitudinal phase constants for guide mode.
The comparison between the simulated and calculated field distribution is shown in Figure 7. It can be observed that the neglecting of the field in the corners in Figure 6 does not heavily influence the field pattern.
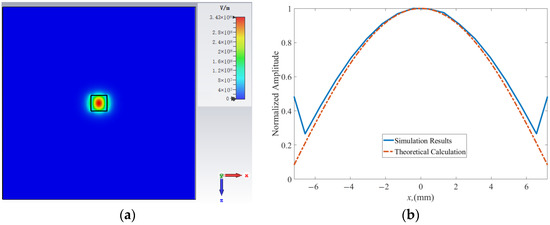
Figure 7.
Field distribution of the lowest guided mode in cross-plane (a) field distribution from CST simulation (b) simulated and calculated field strengths along x axis.
3.3. Analysis of Propagation Characteristics of Leaky Wave
When it comes to the leaky wave, it is unreasonable to neglect the fields in the corners. Some simplification is needed for obtaining the propagation constant because the consideration of the corner fields makes the number of unknowns larger than those of the equations. From Equation (13), we have
where βl is the longitudinal component of the propagation constant of the leaky wave. The fields grow exponentially as the distance from the center increases. In the corner regions, the fields grow in both x and y directions; however, in the third region in Figure 6, illustrated as ε3, the fields vary slowly in the y direction because the symmetry in angular direction is approximately satisfied when the distance from the center becomes larger than λ. As a result, we have
|ky3| << k0
In the third region, the component of the wave number in the y direction is negligible. Combining Equations (13), (17) and (18) for i = 1, the longitudinal wave number of the leaky mode can be solved neglecting the contributions of ky3 and ky1.
The real parts of the longitudinal phase constants are solved and compared with the simulated results as shown in Table 2. The edge length a is set to be 14.4 mm. The obtained longitudinal phase constants are close to the wave numbers in vacuum at the frequencies in consideration. The relative error is ~5%.
Table 2.
Theoretical and simulated real parts of longitudinal phase constants for leaky mode.
The imaginary parts can hardly match the simulation results because (i) they cannot be accurately solved by Eigenmode Solver due to the limited calculation region [22] and (ii) the theoretical ones are also inaccurate due to the assumptions made in Section 3.3. The comparison between the simulated and calculated transverse field distributions is shown in Figure 8.
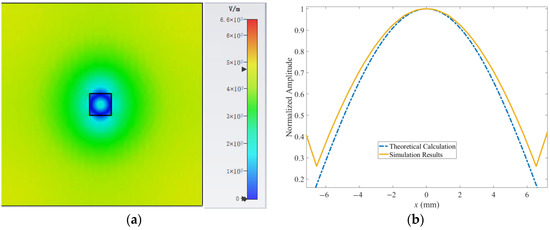
Figure 8.
Field distribution of leaky mode in cross-plane: (a) cross-plane field distribution of leaky mode simulated by Eigenmode Solver, (b) simulated and calculated field strengths along x axis.
3.4. Period Length of Field Distribution
In Section 3.2 and Section 3.3, the theoretical transverse field distributions in the dielectric bar have been compared with the simulated results using CST Eigenmode Solver. In the longitudinal direction, a beat wave pattern consisting of a leaky wave and a guided wave should exist. Therefore, the period length observed in Figure 3 and Figure 4 is determined as
where lp is the period length; βg is the real part of the propagation constant of the guided wave; βl is the real part of the propagation constant of the leaky wave.
A comparison is made between the theoretical period length and the simulated period length as shown in Table 3, when the edge length a is set to be 14.4 mm. Field monitors are set at frequencies from 10 GHz to 11 GHz with a linear step of 0.2 GHz. It can be observed that the relative errors of the theoretical results are ~10% at lower frequencies because Marcatilli’s method provides lower accuracy when the phase constant becomes close to k0 [18]. The period lengths obtained by Eigenmode Solver have good agreement with the period lengths obtained by CST Time-Domain Solver. The beat wave is therefore proved mainly to consist of a guided mode and a leaky mode.
Table 3.
Period lengths of the axial field distribution obtained by theoretical calculation, eigenmode simulation and FDTD simulation.
It can be observed from Table 3 that the simulation results by Eigenmode Solver and Time-Domain Solver are very close to each other. In the eigenmode simulation, the scattering effect of the incident wave occurring at the ends of the bar is neglected because of the periodic boundaries in the longitudinal direction. However, in the time-domain simulation, this scattering effect is considered. The very close results demonstrate that the influences of this scattering effect on the propagation of the leaky and guided modes are quite small. In addition, the time-domain method will be more accurate when the gap between adjacent bars is no larger than a wavelength and the mutual coupling effect should be considered, which is neglected in the eigenmode simulation. As for the computing costs for these two numerical methods, the time-domain method is obviously more time-consuming and requires more physical memory.
4. Absorbing Array Design and Discussion
An array of the lossy dielectric bar is expected to absorb the scattered microwave power in the wind tunnel. The theoretical analysis in previous sections helps us to understand and explain the beat wave phenomenon; however, the theoretical method loses accuracy because the material is lossy, the wavelength becomes smaller relative to the edge length of the bar [18] and mutual coupling between bars may occur. To investigate the absorbing properties of the array for the application, FDTD simulation is again applied. It is assumed that the array is infinite and periodic in both transverse directions. Periodic boundary conditions are applied in the following simulations. The incident wave can be regarded as a plane wave because the distance between the target model and the absorbing array is quite long.
Figure 9 shows the absorbed microwave power as a function of the periodic length in both transverse directions at different frequencies. The coupling effect helps increase the power loss when the space length increases. However, the power loss will not increase further after the space length becomes larger than 1.5λ because of the decay of the mutual coupling. On the other hand, the ratio between the area of the cross-plane of the bar and that of a cell of the absorbing array should be ~2% for the steady operation of the wind tunnel. When the edge length of bar is half a lamda, smaller in fact, the corresponding period length is ~3.5λ and the space length for simulation is ~1.75λ. Therefore, the reasonable choice of the period length is between 3λ–3.5λ.
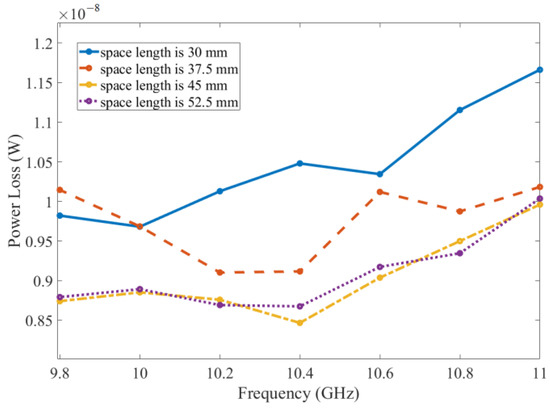
Figure 9.
Power losses as a function of frequency under different space length. The period length of the array is twice the space length, which is the distance between the simulation boundary and the model.
Figure 10 and Figure 11 shows the absorbed power as a function of the longitudinal distance. Let the longitudinal distance be denoted as x in mm; then, in Figure 10, the power loss at x mm represents the total absorbed power in the longitudinal section of the array from x mm to (x + 60) mm. For example, the power loss at x = 200 mm means the total absorbed power in the region from x = 200 mm to x = 260 mm. Figure 11 shows the absorbed power in the region from 0 to (x + 60) mm. It can be observed from Figure 10 that the absorbed power also has a periodicity that is naturally equal to the period length in the field distribution of the beat wave. When a is 7.2 mm, the wave numbers of the leaky and guided modes are 0.2126 rad/mm and 0.1993 rad/mm, simulated with CST Eigenmode Solver. The distance between the two adjacent amplitude peaks is 2π/(0.2126–0.1993) = 472 mm, which is quite close to the simulated value of 453 mm with CST FDTD Solver.
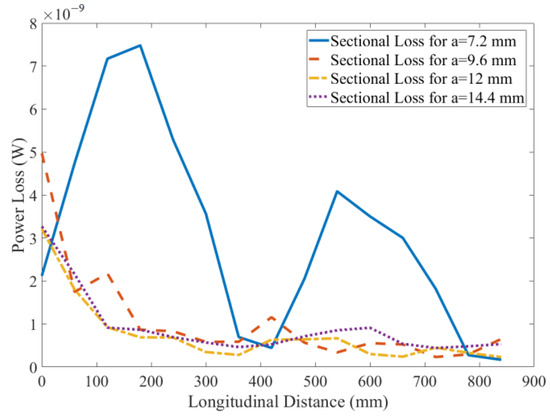
Figure 10.
Power loss in each section for different edge length a.
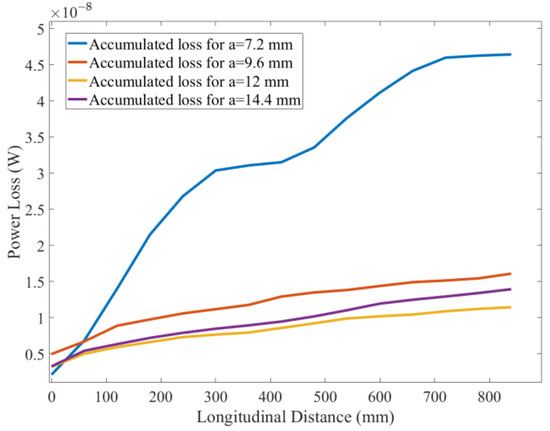
Figure 11.
Accumulated power lossin the section from 0 mm to different longitudinal distances for different edge length a.
In Figure 10, the power loss for a = 7.2 mm is apparently larger than that for other larger values of a. This is caused by the higher-order field distribution inside the dielectric bar as shown in Figure 12, noting that the edge length of 14.4 mm is close to half an equivalent wavelength inside the bar (εr = 4.3).
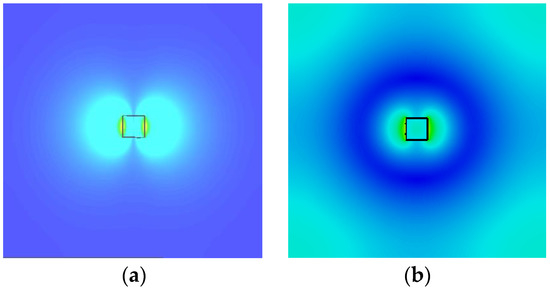
Figure 12.
Electric field distributions of (a) guided mode and (b) leaky mode at 10 GHz in the cross-plane for a = 7.2 mm simulated by CST Eigenmode Solver.
At 10 GHz, the reasonable edge length of each bar in the array is 7.2 mm; the reasonable choice of the period length is between 3.5λ and the longitudinal length of each bar is suggested to be ~300 mm for better efficiency. A single array of such bars can absorb ~10% of the microwave power, as shown in Figure 11, for which the amplitude of the incident plane wave in the simulation is set to be 0.1 V/m. A series of such absorbing arrays can be arranged along the wind tunnel, the next array separated by several wavelengths. For example, one absorbing array with an edge length of 7.2 mm and a longitudinal length of 300 mm can decrease 10% of the microwave power, and 25 such arrays in a line will be able to decrease it by 93% and will be ~10 m long, which is acceptable in a wind tunnel.
5. Conclusions
The propagating wave exhibits beat wave distribution along the propagation axis when a rectangular dielectric bar is excited by a plane wave with the incident angle of ~0°. The beat wave consists mainly of two modes—a leaky mode and a guided mode. The modes can be solved approximately by field matching theory. The longitudinal phase constants of the two modes are solved and the period lengths of the longitudinal field amplitude are obtained. The theoretical period length agrees well with the simulated results obtained by eigenmode simulation and FDTD simulation, respectively, so that the beat wave is demonstrated to mainly have the two modes.
The absorbing arrays of the FR-4 bars are simulated for the microwave absorption problem in a wind tunnel experiment. The period length of the array in transverse directions is suggested to be 3λ–3.5λ, which is large enough to avoid disturbing the wind speed in the wind tunnel. The reasonable longitudinal length depends on the period length of field amplitude along the longitudinal axis, especially when the edge length of the bar is small relative to the wavelength. When the edge length of the bar is 7.2 mm (close to half an equivalent wavelength inside the bar), a 10 m series of such absorbing arrays will be applied in the experiment in a wind tunnel with a total microwave absorption of ~90%, together with the specifically designed testing object and the absorbing arrays on the wall that, to be introduced in another paper, attenuate the microwave power by −20 dB.
Author Contributions
Writing, R.B.; supervision, Y.T. and Y.Y.; Data Curation, N.X. and X.P.; project administration, J.W. and D.L. All authors have read and agreed to the published version of the manuscript.
Funding
This research received no external funding.
Institutional Review Board Statement
Not applicable.
Informed Consent Statement
Not applicable.
Data Availability Statement
The study did not report any data.
Conflicts of Interest
The authors declare no conflict of interest.
References
- Wang, R.; Wang, Y.; Bin, L.I. Application of High Power Microwave Weapons in Air Defense. Electron. Sci. Technol. 2011, 24, 128–131. [Google Scholar]
- Yang, D.; Chen, C.; Teng, Y.; Li, S.; Li, X.; Tan, W.; Zhu, X.; Zhang, L.; Sun, J.; Su, J. Investigation of damage traces on the SWS of the RBWO with a low guiding magnetic field. Phys. Plasmas 2021, 28, 053101. [Google Scholar] [CrossRef]
- Gunin, A.V.; Klimov, A.I.; Korovin, S.D.; Kurkan, I.K.; Pegel, I.V.; Polevin, S.D.; Roitman, A.M.; Rostov, V.V.; Stepchenko, A.S.; Totmeninov, E.M. Relativistic X-band BWO with 3-GW output power. IEEE Trans. Plasma Sci. 1998, 26, 326–331. [Google Scholar] [CrossRef]
- Ansari, M.A.; Thottappan, M. Design and Simulation of Dual-Band Nonuniform Relativistic Backward Wave Oscillator Using a Bragg Structure as Its RF Circuit and Reflector-Cum-Mode Converter. IEEE Trans. Electron. Devices 2020, 67, 1814–1818. [Google Scholar] [CrossRef]
- Jacob, J.; Chia, L.H.L.; Boey, F.Y.C. Thermal and non-thermal interaction of microwave radiation with materials. J. Mater. Sci. 1995, 30, 5321–5327. [Google Scholar] [CrossRef]
- Gabriel, C.; Gabriel, S.; Grant, E.H.; Grant, E.H.; Halstead, B.S.J.; Mingos, D.M.P. Dielectric parameters relevant to microwave dielectric heating. Chem. Soc. Rev. 1998, 27, 213–219. [Google Scholar] [CrossRef]
- Hotta, M.; Hayashi, M.; Lanagan, M.T.; Agrawal, D.K.; Nagata, K. Complex permittivity of graphite, carbon black and coal powders in the ranges of X-band frequencies (8.2 to 12.4 GHz) and between 1 and 10 GHz. ISIJ Int. 2011, 51, 1766–1772. [Google Scholar] [CrossRef]
- Zhang, Y.; Li, E.; Zhang, J.; Yu, C.; Zheng, H.; Guo, G. A broadband variable-temperature test system for complex permittivity measurements of solid and powder materials. Rev. Sci. Instrum. 2018, 89, 024701. [Google Scholar] [CrossRef]
- Michael, D.; Mingos, P.; Baghurst, D.R. Tilden Lecture. Applications of microwave dielectric heating effects to synthetic problems in chemistry. Chem. Soc. Rev. 1991, 20, 1–47. [Google Scholar] [CrossRef]
- Razzaq, T.; Kremsner, J.M.; Kappe, C.O. Investigating the existence of nonthermal/specific microwave effects using silicon carbide heating elements as power modulators. J. Org. Chem. 2008, 73, 6321–6329. [Google Scholar] [CrossRef]
- Li, E.; Gao, Y.; Zhang, Y.; Gao, C.; Zheng, H.; Zeng, Z. Nonlinear behavior of microwave semiconductor materials measured under a strong electromagnetic environment using a compressed rectangular resonant cavity. Appl. Phys. A-Mater. Sci. Process. 2017, 123, 415–423. [Google Scholar] [CrossRef]
- Miyakoshi, J. Cellular and molecular responses to radio-frequency electromagnetic fields. Proc. IEEE 2013, 101, 1494–1502. [Google Scholar] [CrossRef]
- Wait, J.R. Scattering of a Plane Wave from a Circular Dielectric Cylinder at Oblique Incidence. Can. J. Phys. 1955, 33, 189–195. [Google Scholar] [CrossRef]
- Wu, R.B.; Chen, C.H. On the Variational Reaction Theory for Dielectric Waveguides. IEEE Trans. Microw. Theory Tech. 1985, 33, 477–483. [Google Scholar]
- Coves, A.; Gimeno, B.; Blas, A.A.S.; Vidal, A.; Boria, V.E.; Andres, M.V. Three-Dimensional Scattering of Dielectric Gratings Under Plane-Wave Excitation. IEEE Antennas Wirel. Propag. Lett. 2003, 2, 215–218. [Google Scholar] [CrossRef]
- Yang, Y.; Castaneda, J.A.; Alexopoulos, N.G. An Integral Equation Analysis of an Infinite Array of Rectangular Dielectric Waveguides. IEEE Trans. Microw. Theory Tech. 1990, 38, 873–880. [Google Scholar] [CrossRef]
- Goell, J.E. A Circular-Harmonic Computer Analysis of Rectangular Dielectric Waveguides. Bell Syst. Tech. J. 1969, 48, 2133–2160. [Google Scholar] [CrossRef]
- Marcatilli, E.A.J. Dielectric rectangular waveguide and directional coupler for integrated optics. Bell Syst. Tech. J. 1969, 48, 2071–2102. [Google Scholar] [CrossRef]
- Kaufman, R.G.; Hulse, G.; Vezzetti, D.J.; Munowitz, M.; Stair, K.; Bird, T. Observation and analysis of spatial beats in a multimode dielectric optical waveguide. Appl. Opt. 1992, 31, 4920–4922. [Google Scholar] [CrossRef]
- Kang, M.; Park, J.; Lee, I.M.; Lee, B. Floating dielectric slab optical interconnection between metal-dielectric interface surface plasmon polariton waveguides. Opt. Express 2009, 17, 676–687. [Google Scholar] [CrossRef]
- Marcuse, D. Investigation of coupling between a fiber and an infinite slab. J. Light. Technol. 1989, 7, 122–130. [Google Scholar] [CrossRef]
- Hu, J.; Menyuk, C.R. Understanding leaky modes: Slab waveguide revisited. Adv. Opt. Photonics 2009, 1, 58–106. [Google Scholar] [CrossRef]


Disclaimer/Publisher’s Note: The statements, opinions and data contained in all publications are solely those of the individual author(s) and contributor(s) and not of MDPI and/or the editor(s). MDPI and/or the editor(s) disclaim responsibility for any injury to people or property resulting from any ideas, methods, instructions or products referred to in the content. |
© 2023 by the authors. Licensee MDPI, Basel, Switzerland. This article is an open access article distributed under the terms and conditions of the Creative Commons Attribution (CC BY) license (https://creativecommons.org/licenses/by/4.0/).