Article

Wall Shear Stress Measurement in Carotid Artery Phantoms with Variation in Degree of Stenosis Using Plane Wave Vector Doppler

1
School of Mechanical and Power Engineering, East China University of Science and Technology, Shanghai 200237, China
2
School of Science and Engineering, University of Dundee, Dundee DD1 4HN, UK
3
School of Mechanical and Automotive Engineering, Shanghai University of Engineering Science, Shanghai 201620, China
*
Author to whom correspondence should be addressed.
Appl. Sci. 2023, 13(1), 617; https://doi.org/10.3390/app13010617
Submission received: 30 November 2022 / Revised: 26 December 2022 / Accepted: 28 December 2022 / Published: 2 January 2023
(This article belongs to the Section Biomedical Engineering)

Abstract

:
Wall shear stress (WSS) plays an important role in the formation, growth, and rupture of atherosclerotic plaques in arteries. This study measured WSS in diseased carotid artery phantoms with degrees of stenosis varying from 0 to 60% with both steady and pulsatile flow. Experiments were performed using in silico and real flow phantoms. Blood velocities were estimated using plane wave (PW) vector Doppler. Wall shear stress was then estimated from the velocity gradient near the wall multiplied by the viscosity of a blood-mimicking fluid. The estimated WSS using the in silico phantom agreed within 10% of the ground-truth values (root-mean-square error). The phantom experiment showed that the mean WSS and maximum WSS increased with the increasing degree of stenosis. The simulation and experiment results provide the necessary validation data to give confidence in WSS measurements in patients using the PW vector Doppler technique.

1. Introduction

Cardiovascular disease is responsible for approximately one-third of deaths worldwide [1]. Atherosclerosis is the most common cardiovascular disease and involves the deposition of lipids in the arterial wall, leading to the thickening of the wall and the formation of a volume-lesion called a plaque, with the later stages of the disease involving the narrowing of the lumen of the artery, called a ‘stenosis’ [2]. A common site for atherosclerosis is the carotid bifurcation, where plaque rupture can lead to stroke and death. The surgical treatment of atherosclerosis is considered if the diameter reduction is greater than 70% [3,4]. Current clinical practice for the selection of at-risk patients is based on a minimum stenosis diameter as a measure of the risk of rupture and on patients’ symptoms.
It has become recognised that atherosclerosis develops as an interplay between the local mechanical environment and biology, where central to this interplay is wall shear stress (WSS). Early studies linked the development of atherosclerosis to regions of low and/or oscillating WSS. Early plaques are associated with the preservation of the lumen associated with outward remodelling, thought to be a response to a control mechanism in which the WSS is kept within a narrow range. For the established plaque, the upstream (proximal) side of the stenosis has high WSS [5,6]. A theory developed by Slager et al. [5] states that the high WSS leads to a series of biological events, leading to the thinning of the plaque wall and leaving the wall at risk of rupture. In addition, there is much experimental and clinical evidence that inflammation contributes to the development and destabilization of atherosclerosis but with a complex pathophysiology [7,8].
The measurement of WSS in the individual patient is therefore of potential interest in understanding atherosclerosis and as a possible marker of the risk of the rupture of the plaque. Wall shear stress is estimated via the wall shear rate (WSR). The wall shear rate is the velocity gradient estimated at the vessel wall. Its measurement, therefore, involves the estimation of the velocities near the wall and the extrapolation of these velocities back to the measured location of the wall to obtain the WSR. Finally, the WSS is obtained by multiplying the WSR by the assumed viscosity of blood near the wall. Previous attempts to measure WSS have used magnetic resonance imaging (MRI) [9,10] and patient-specific modelling involving a combination of medical imaging and computational fluid dynamics [11,12]. The first reports of the ultrasound measurement of WSS were by Brands et al. [13] using a single-beam Doppler approach. Recently, ultrafast Doppler [14] has been developed, which has the advantages of a very high frame rate and a large field of view [15,16,17,18,19]. Flow phantoms are used to investigate the performance of ultrasound imaging methods, including the validation of measurements of blood velocity and related quantities [20,21,22,23]. The geometry of the flow phantom may come from the reconstruction of MRI or Computed Tomography (CT) scans [24] or from idealised geometries [25,26]. Based on an in vitro experimental setup, Goudot et al. [27] discovered that plane wave (PW) vector Doppler has the potential to estimate WSS in a straight tube but provided few details about the used Doppler methodology. Wang et al. [28] used PW vector Doppler to estimate WSS in a straight-vessel phantom and a 50% stenosed human femoral artery phantom under pulsatile flow conditions. In these phantom studies, the influence of tissue was not considered, and only one degree of stenosis was used. In terms of other aspects of WSS, such as increasing the accuracy of WSS estimation, some researchers have developed methods to improve the estimation accuracy of the near-wall velocity components [11,29].
In this paper, our aim is to investigate the association of the WSS in carotid artery (CA) phantoms measured by PW vector Doppler with variations in the degree of stenosis. This involved in silico experiments to determine the accuracy of the estimation of WSS and laboratory experiments to investigate WSS in stenosis models.

2. Materials and Methods

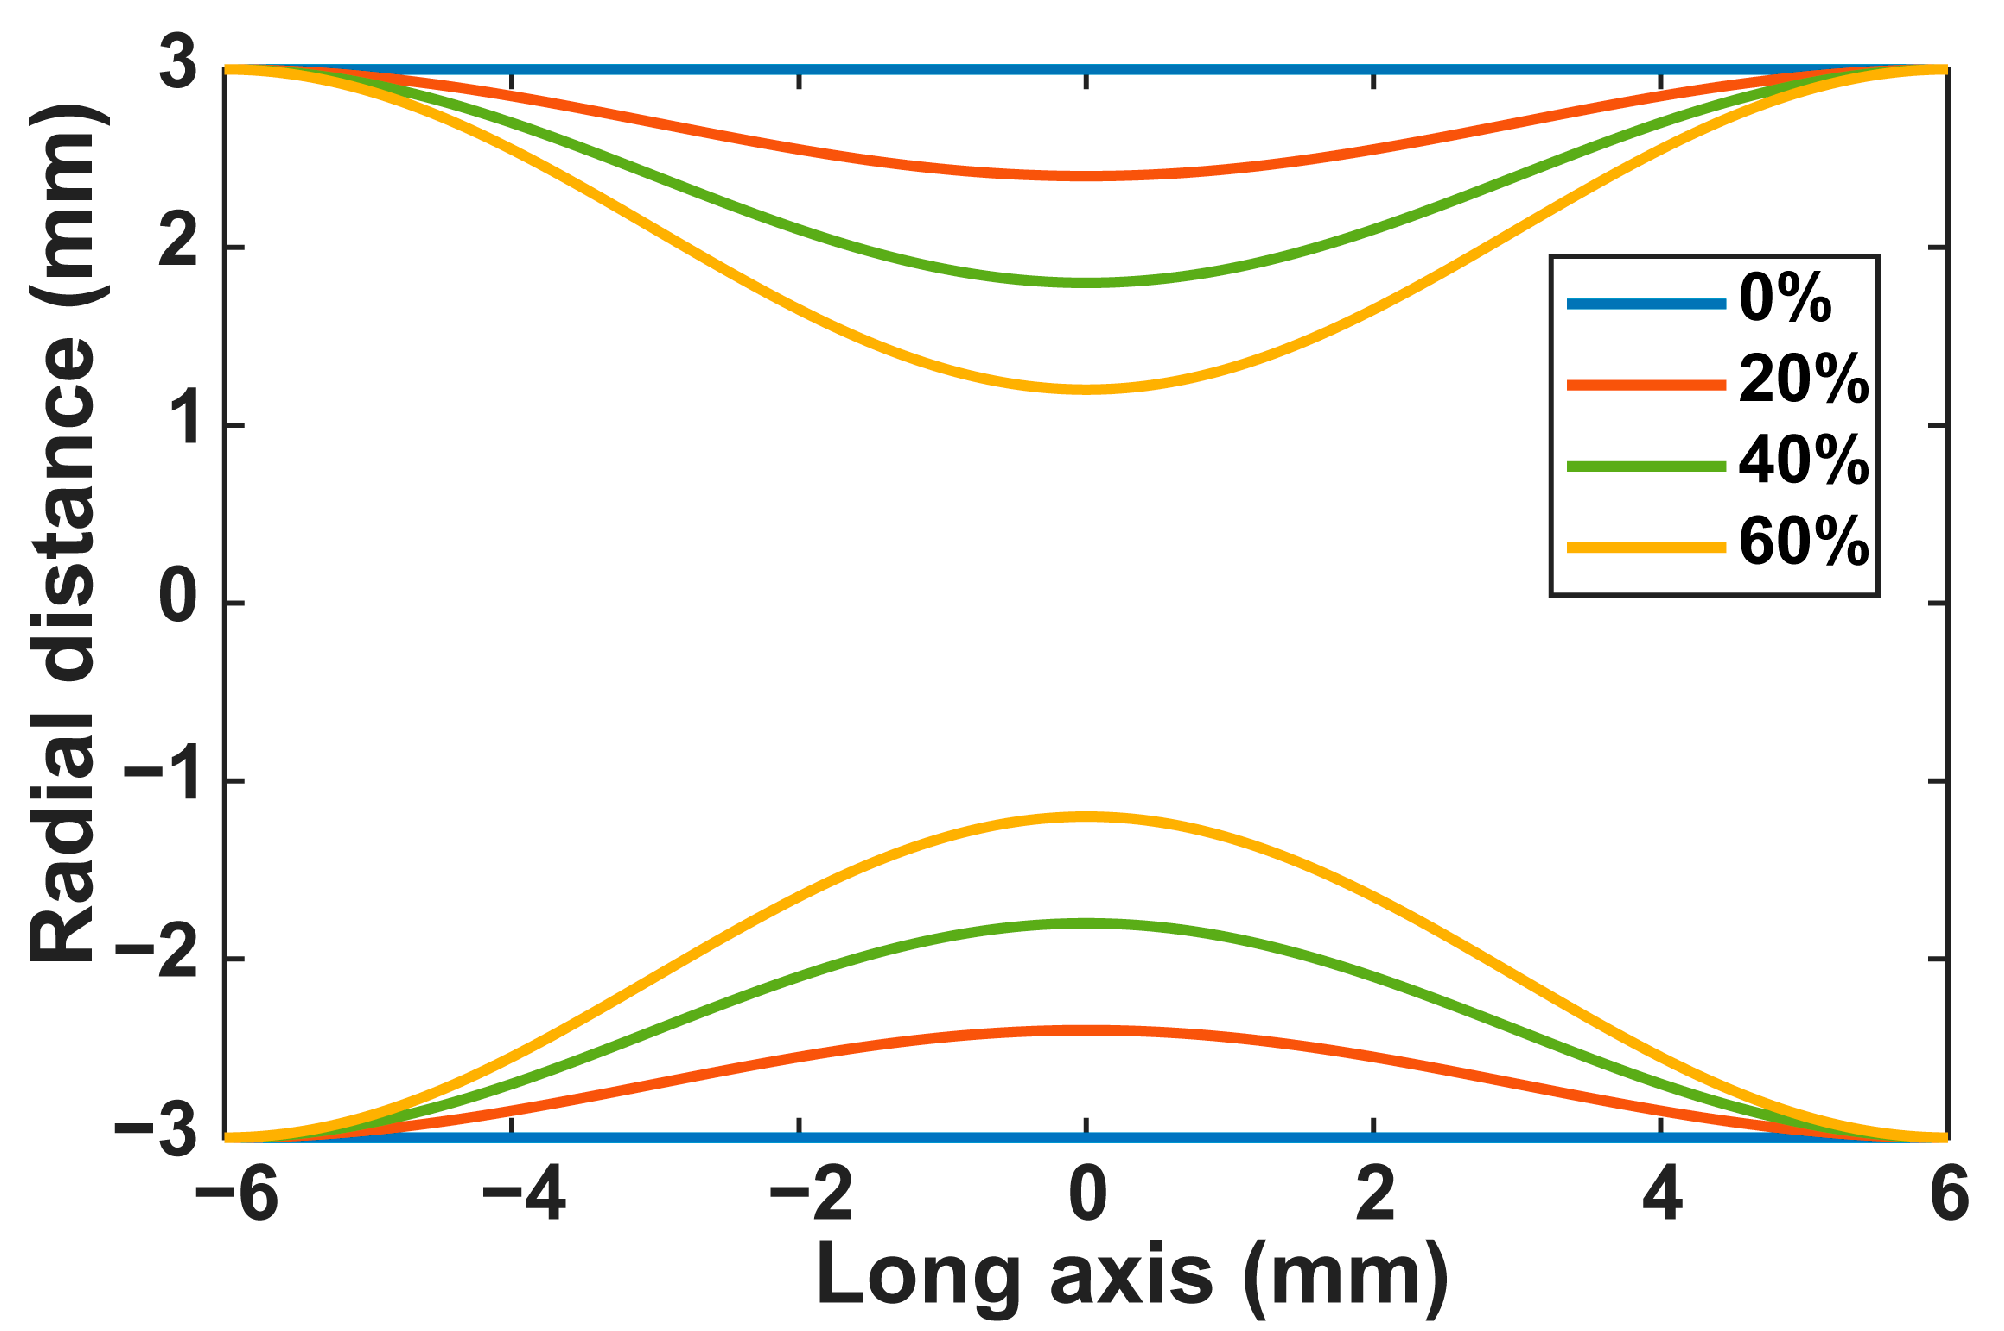
To investigate the haemodynamics in the stenotic CA with different stenosis degrees, four flow phantoms were prepared from a polyvinyl alcohol cryogel (PVA-C) vessel and an agar tissue mimic (agar-TMM). Three-dimensional printing was used to produce the vessel mould and vessel core [21]. A cuboid phantom box was used to hold the fabricated vessel and tissue mimic, as shown in Figure 1. An acoustic absorber (AptFlex F28, Precision Acoustics Ltd., Dorset, UK) was placed on the bottom of the box to reduce the sound reflection from the box bottom. Two quick-fitting flow connectors were fixed and aligned by the bolts at the two opposite ends of the phantom box to be connected by the PVA-C vessel and outer C-flex connecting tubing. A series of stenotic vessel core models were first created in Solidworks (Dassault Systèmes, Waltham, MA, USA). The stenosis was modelled at the middle of the vessel, and the degree of stenosis ranged from 0% to 60% with increments of 20%. The degree of stenosis P stenosis is defined as a percentage using the following equation:
P stenosis = d original d stenosis d original ,
where d original and d stenosis are the vessel diameters before and at stenosis, respectively. The stenosis shape follows an ideal cosine function, as used in previous papers [25,30,31], and the length of stenosis is 12 mm, as shown in Figure 2. To help form the vessel wall, a detachable mould was 3D-printed. All vessel cores and moulds for fabricating flow phantoms were printed by a Stereolithography 3D printer Form 2 (Formlabs, Somerville, MA, USA) using white resin (Formlabs, Somerville, MA, USA), which has a resolution of 100 microns. The supports attached to the printing objects for facilitating the 3D printing process were removed by using sandpaper. The designed vessels have a diameter of 6 mm, a wall thickness of 1.5 mm in the non-stenotic part, and a total length of 180 mm.
Polyvinyl alcohol (PVA) was used as the material to fabricate the vessel phantoms in this study. The fabrication of all PVA mixtures followed the fabrication procedure described by Zhou et al. [26]. In brief, a 10% (by weight) PVA mixture was mixed in 88.79% deionised (DI) water in a glass beaker to make the vessel mimic. Then, 0.75% silicon carbide was added as acoustic scatterers, and 0.46% benzalkonium chloride was added as an antibacterial agent to preserve the vessel. The PVA mixture was heated in a temperature-controlled water bath for around 2 h until a clear homogeneous gel was seen. Subsequently, the PVA mixture was degassed for 12 h after injecting the PVA mixture into the moulds. Vessel phantoms were put in a freezer for 14 h at a temperature of 20   ° C and then kept at room temperature ( 22   ° C ) for 10 h. This was repeated for a total of three freeze–thaw cycles. The vessel core was removed manually after completing freeze–thaw cycles. To simulate the surrounding human tissue, an agar-TMM was fabricated [26]. The agar-TMM consists of the following materials: (1) 3% (by weight) agar powder, (2) 82.4% DI water, (3) 3% silicon carbide, which was used as acoustic scatterers, (4) 11.32% glycerol, which was used to tune the sound speed, (5) 0.88% 0.3   μ m aluminium oxide powder and 0.94% 3   μ m aluminium oxide powder, which were used to tune the attenuation, and (6) 0.92% benzalkonium chloride, which served as the antibacterial agent. The mixture was heated in a water bath and mixed by a mechanical stirrer for 1.5 h. To prevent the collapse of the vessel, the PVA-C vessel was filled with water and sealed at both ends before pouring the agar-TMM solution into the phantom container. The acoustic properties of fabricated flow phantoms were measured by an in-house system using the time-of-flight method [32]. The top of each phantom block was covered with a 9% glycerol solution and stored in the fridge when not in use.

2.1. Flow Circuit Setup

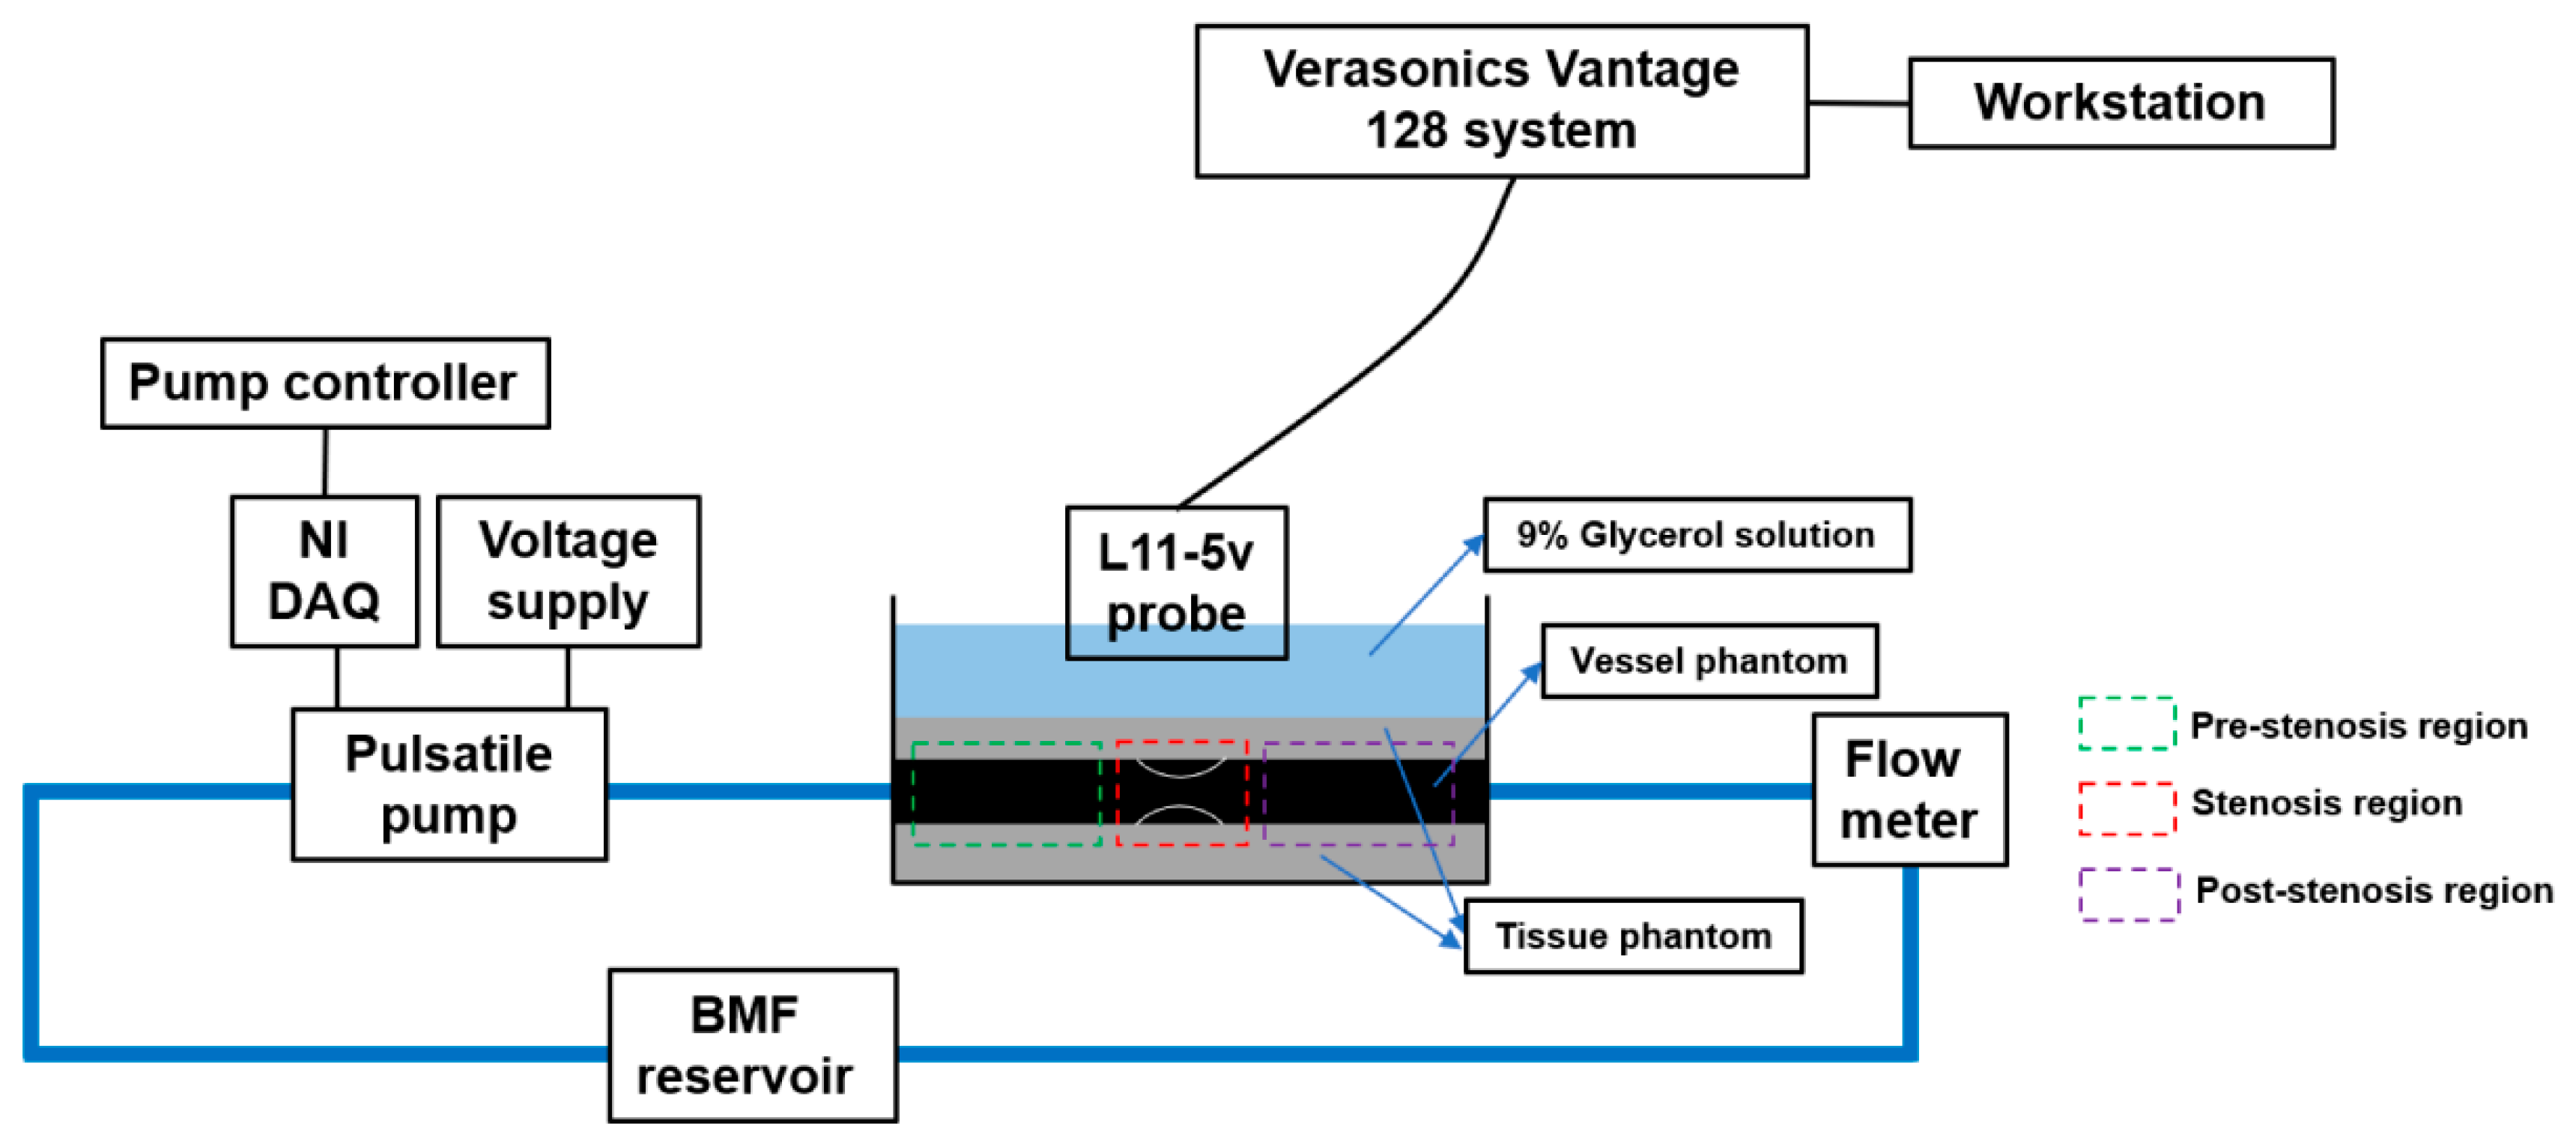
In the imaging experiment of each flow phantom, the inlet of the flow phantom was connected to the output of a gear pump (GA-V21, Micropump, Vancouver, WA, USA). A blood-mimicking fluid (BMF) was prepared to be delivered through the flow loop by the pump. The BMF was stored in a plastic reservoir. Nylon particles with a diameter of 5   μ m   were combined with DI water with dextran and surfactant and mixed for 4 h with a magnetic stirrer. The resultant BMF had similar acoustic and viscous properties to those of human blood [33]. The gear pump was controlled by a data acquisition card (National Instruments, Newbury, UK) through a LabVIEW program, which could output arbitrary waveforms within the voltage limitation of the pump. The BMF was fully degassed in a vacuum pump every time before being pumped into the flow circuit. To ensure there were no air bubbles trapped in the flow loop, degassed water was used to run the system for half an hour before pumping the BMF. A TS410 flow meter (Transonic Systems Inc., Ithaca, NY, USA) was connected directly to the outlet of the flow phantom block to measure the flow rate. The data acquisition begins when the flow rates remain stable. A schematic of the experimental setup is presented in Figure 3. For the steady flow, the pump was applied on the square signals with different voltage amplitudes to implement steady flow with a velocity of 13 . 1   cm · s - 1 , 19 . 6   cm · s - 1 , 26 . 1   cm · s - 1 , 32 . 7   cm · s - 1 , and 39 . 2   cm · s - 1 and a pulsatile flow waveform, which has a flow rate of 6   mL · s - 1 in systole.

2.2. Ultrasound Simulation Setup

A synthetic flow phantom was developed, allowing experiments to be performed in silico, i.e., using a computer. Ground-truth values for blood velocities specified in the phantom were compared with the measured values from the PW vector Doppler simulation, allowing measurement accuracy to be assessed. This approach has been previously used in our group [12]. In this study, the velocity vectors were estimated by PW vector Doppler. Ultrasound beam formation and reception were modelled using Field II [34,35]. A synthetic walled vessel phantom was modelled as a collection of scatterers. The vessel had a diameter of 6 mm and a wall thickness of 1 mm. The scatterers were randomly distributed, with 10 scatterers per resolution cell. The wall was set to have a reflection amplitude roughly 20 dB higher than the flow scatterers. The flow scatterers were propagated with a parabolic velocity profile as follows:
v = v 0 ( 1 r 2 R 2 ) ,
where v 0 is the maximum velocity of the vessel centreline, r is the distance to the centreline, and R is the radius of the synthetic vessel.

2.3. Ultrasound Experimental Setup

To obtain the flow information within the CA phantom, a linear L11-5v probe (Verasonics Inc., Kirkland, WA, USA) connected to a research ultrasound system (Verasonics Vantage 128, Verasonics Inc., Kirkland, WA, USA) was used to acquire the ultrasound data. The probe has 128 elements at a pitch of 0.3 mm. For each acquisition, three plane waves were transmitted, covering an angle span of 20 ° at a pulse repletion frequency (PRF) of 10 kHz. The received data were sampled at 25 MHz . The imaging parameters used in the experiments are shown in Table 1. The ultrasound probe attached to a mechanical positioner was aligned such that the stenotic region was at the overlapping area of the steered plane wave. The probe was placed in parallel with the long axis of the vessel to obtain a fixed beam-to-flow angle of 90°. When scanning phantoms, a 9% glycerol solution was added to the top of the flow phantoms to provide the acoustic coupling between the probe and the flow phantom. To check the geometry of fabricated phantoms, 13 plane waves from 18 ° to 18 ° were transmitted and then beamformed coherently to obtain high-quality B-mode images of all phantoms [36].

2.4. Ultrasound Signal Processing

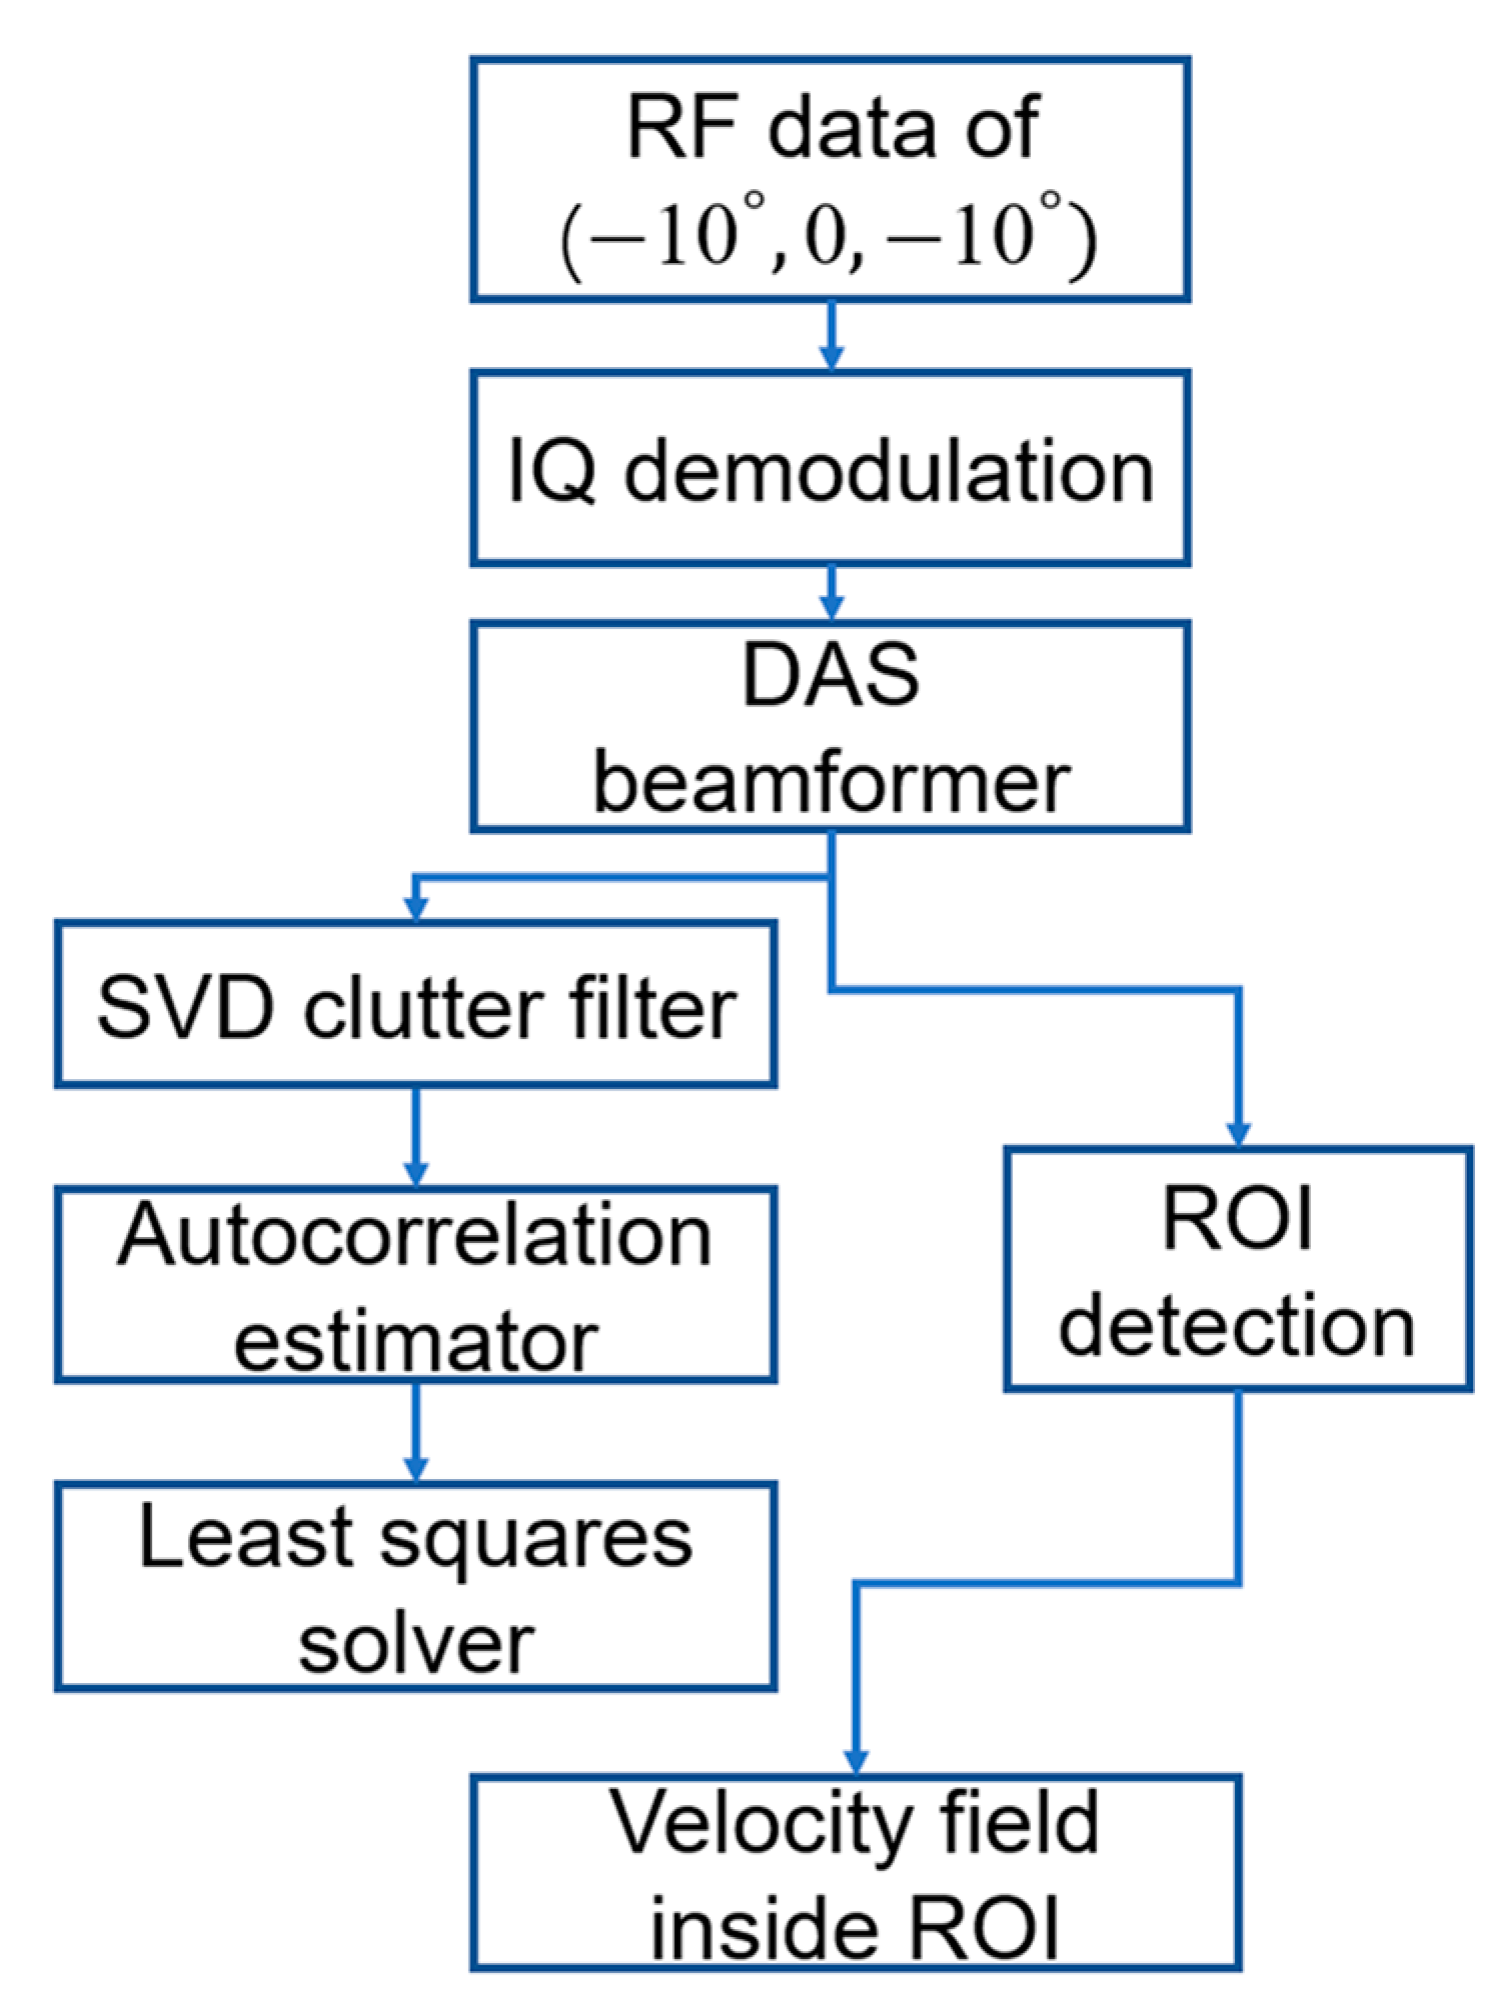
The ultrasound data were processed in MATLAB 2021b (MathWorks Inc., Natick, MA, USA). A flow chart of signal processing steps for the simulation and experiment is illustrated in Figure 4. The echo data from each transmission angle were first demodulated into in-phase and quadrate (IQ) data and then beamformed by a delay-and-sum (DAS) beamformer. Receive angles of 10 ° , 0, and 10 ° were used in beamforming. A singular value decomposition (SVD) filter [37] was used to minimize the influence of clutter on the velocity estimation. After clutter filtering, the lag-one autocorrelation algorithm [38] was applied to each filtered signal to derive the Doppler frequency in each pixel of the imaging regions. The ensemble length used in estimating the Doppler frequency was 40. The multi-angle vector Doppler method was performed to calculate the blood flow velocities in a vector form [16]. A wall detection algorithm based on intensity differences between the vessel wall and flow [39] was used to locate the region of interest (ROI) for displaying velocity vectors and WSS. In brief, the vessel wall location, i.e., the ROI, was obtained by searching for the peaks of the intensity profile through each vertical line of beamformed images.
The velocity component can be solved by the equation below:
[ c o s θ t i + c o s θ r i s i n θ t i + s i n θ r i ] [ v z v x ] = c f c f d ,
where v z and v x are the estimated velocity vectors along the horizontal and vertical axes, θ t i is the ith transmission angle, θ r i is the receive angle, f c is the probe transmission frequency, and f d is the estimated Doppler frequency. An overdetermined system was formed if i     3 . The horizontal and vertical velocity components were solved by the least-squares method and filtered by a 0.7 mm 2D median filter. The B-mode image used for displaying the vector flow field and WSS map was coherently summed by three individual angles’ data [36]. The resultant velocity magnitude v was calculated using the Pythagorean theorem as follows:
v = v x 2 + v z 2 .

2.5. Wall Shear Stress Estimation

The WSS exerted on the vessel wall was estimated from the velocity gradient near the wall using the formula below [40]:
τ w s s = μ v r | r = R ,
where τ w s s is the WSS, μ is the dynamic viscosity, and v r | r = R is the velocity gradient perpendicular to the vessel wall. Because the vessel wall is not constantly straight in the stenotic region, for these curved regions, a transformation matrix [41] was used to align the vessel wall:
C x z = [ c o s θ s i n θ s i n θ c o s θ ] ,
where θ is the rotation angle. To improve the robustness of WSS estimation, a Savitzky–Golay filter was used to regulate the velocity vectors near the wall. A value of 4   mPa · s was assumed for the viscosity of the BMF based on previously published measurements [33].

2.6. Performance Evaluation

Normalised root-mean-square error (NRMSE) was used to quantify the error between the estimated WSS and the reference WSS:
N R M S E = i = 1 M ( W S S ( i ) W S S r e f ( i ) ) 2 M ,
where W S S ( i )   is the estimated WSS, W S S r e f ( i ) is the reference WSS, and M is the number of sampling points along the vessel wall of interest.

3. Results

3.1. Results

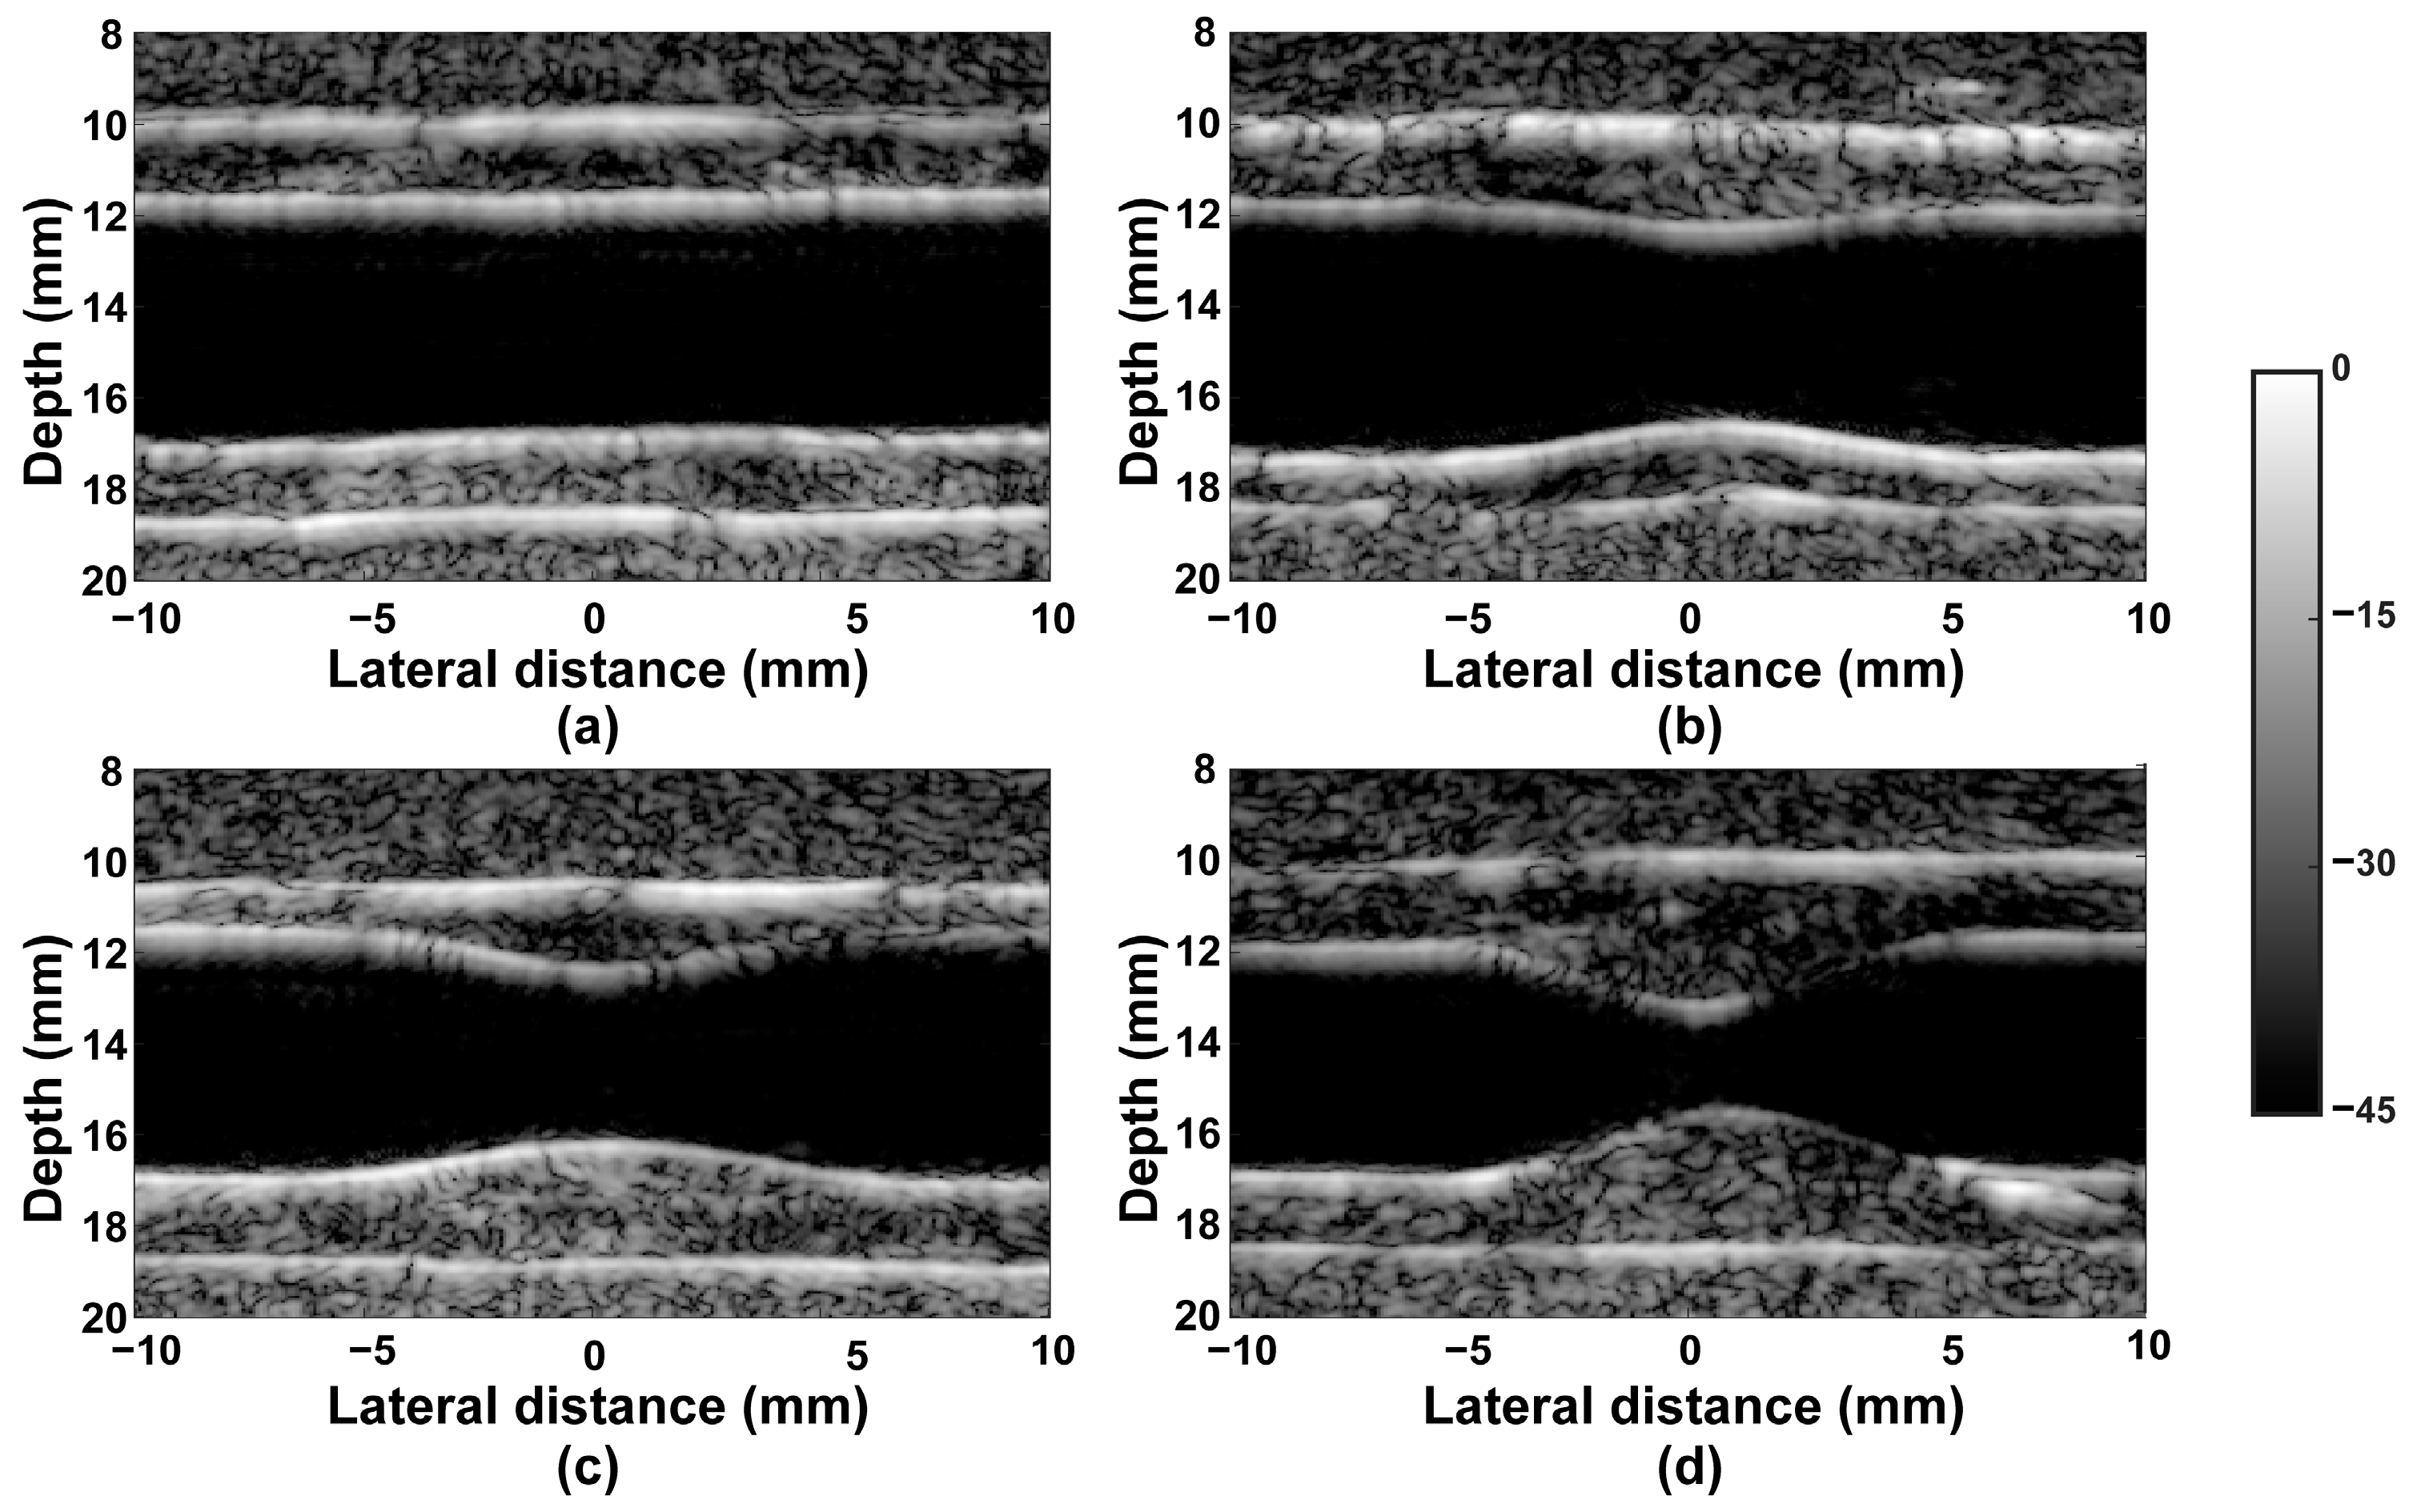
To validate the geometry of the fabricated stenotic phantom, the B-mode images of each phantom were coherently beamformed with a dynamic range of 45 dB, as shown in Figure 5a–d. It can be observed that the vessel wall is clearly visible, and the geometry of each flow phantom approximately follows the designed shape. There is a slight reduction in diameter in all four kinds of flow phantoms due to the slight shrinkage of the PVA-C vessel [42]. The diameters of the pre-stenotic region in four cases were measured as 5.7 mm, 5.7 mm, 5.7 mm, and 5.6 mm, respectively.
The calculated acoustic properties, including the speed of sound and the attenuation of the agar tissue phantom and PVA-C vessel phantom, are shown below. The means and standard deviations (std) were calculated from five realisations of measurements. The measured acoustic speed and attenuation rate were (mean ± std): 1548   ±   34   m · s - 1 and 0 . 46   ±   0 . 05   dB · cm - 1 · MHz - 1 for the PVA-C vessel and 1542   ±   22   m · s - 1 and 0 . 43   ±   0 . 12   dB · cm - 1 · MHz - 1 for agar-TMM, respectively. The measured values show good agreement with previous work by our group [26]. The acoustic results mean that our fabricated flow phantoms have a good acoustic performance when used in ultrasound imaging.
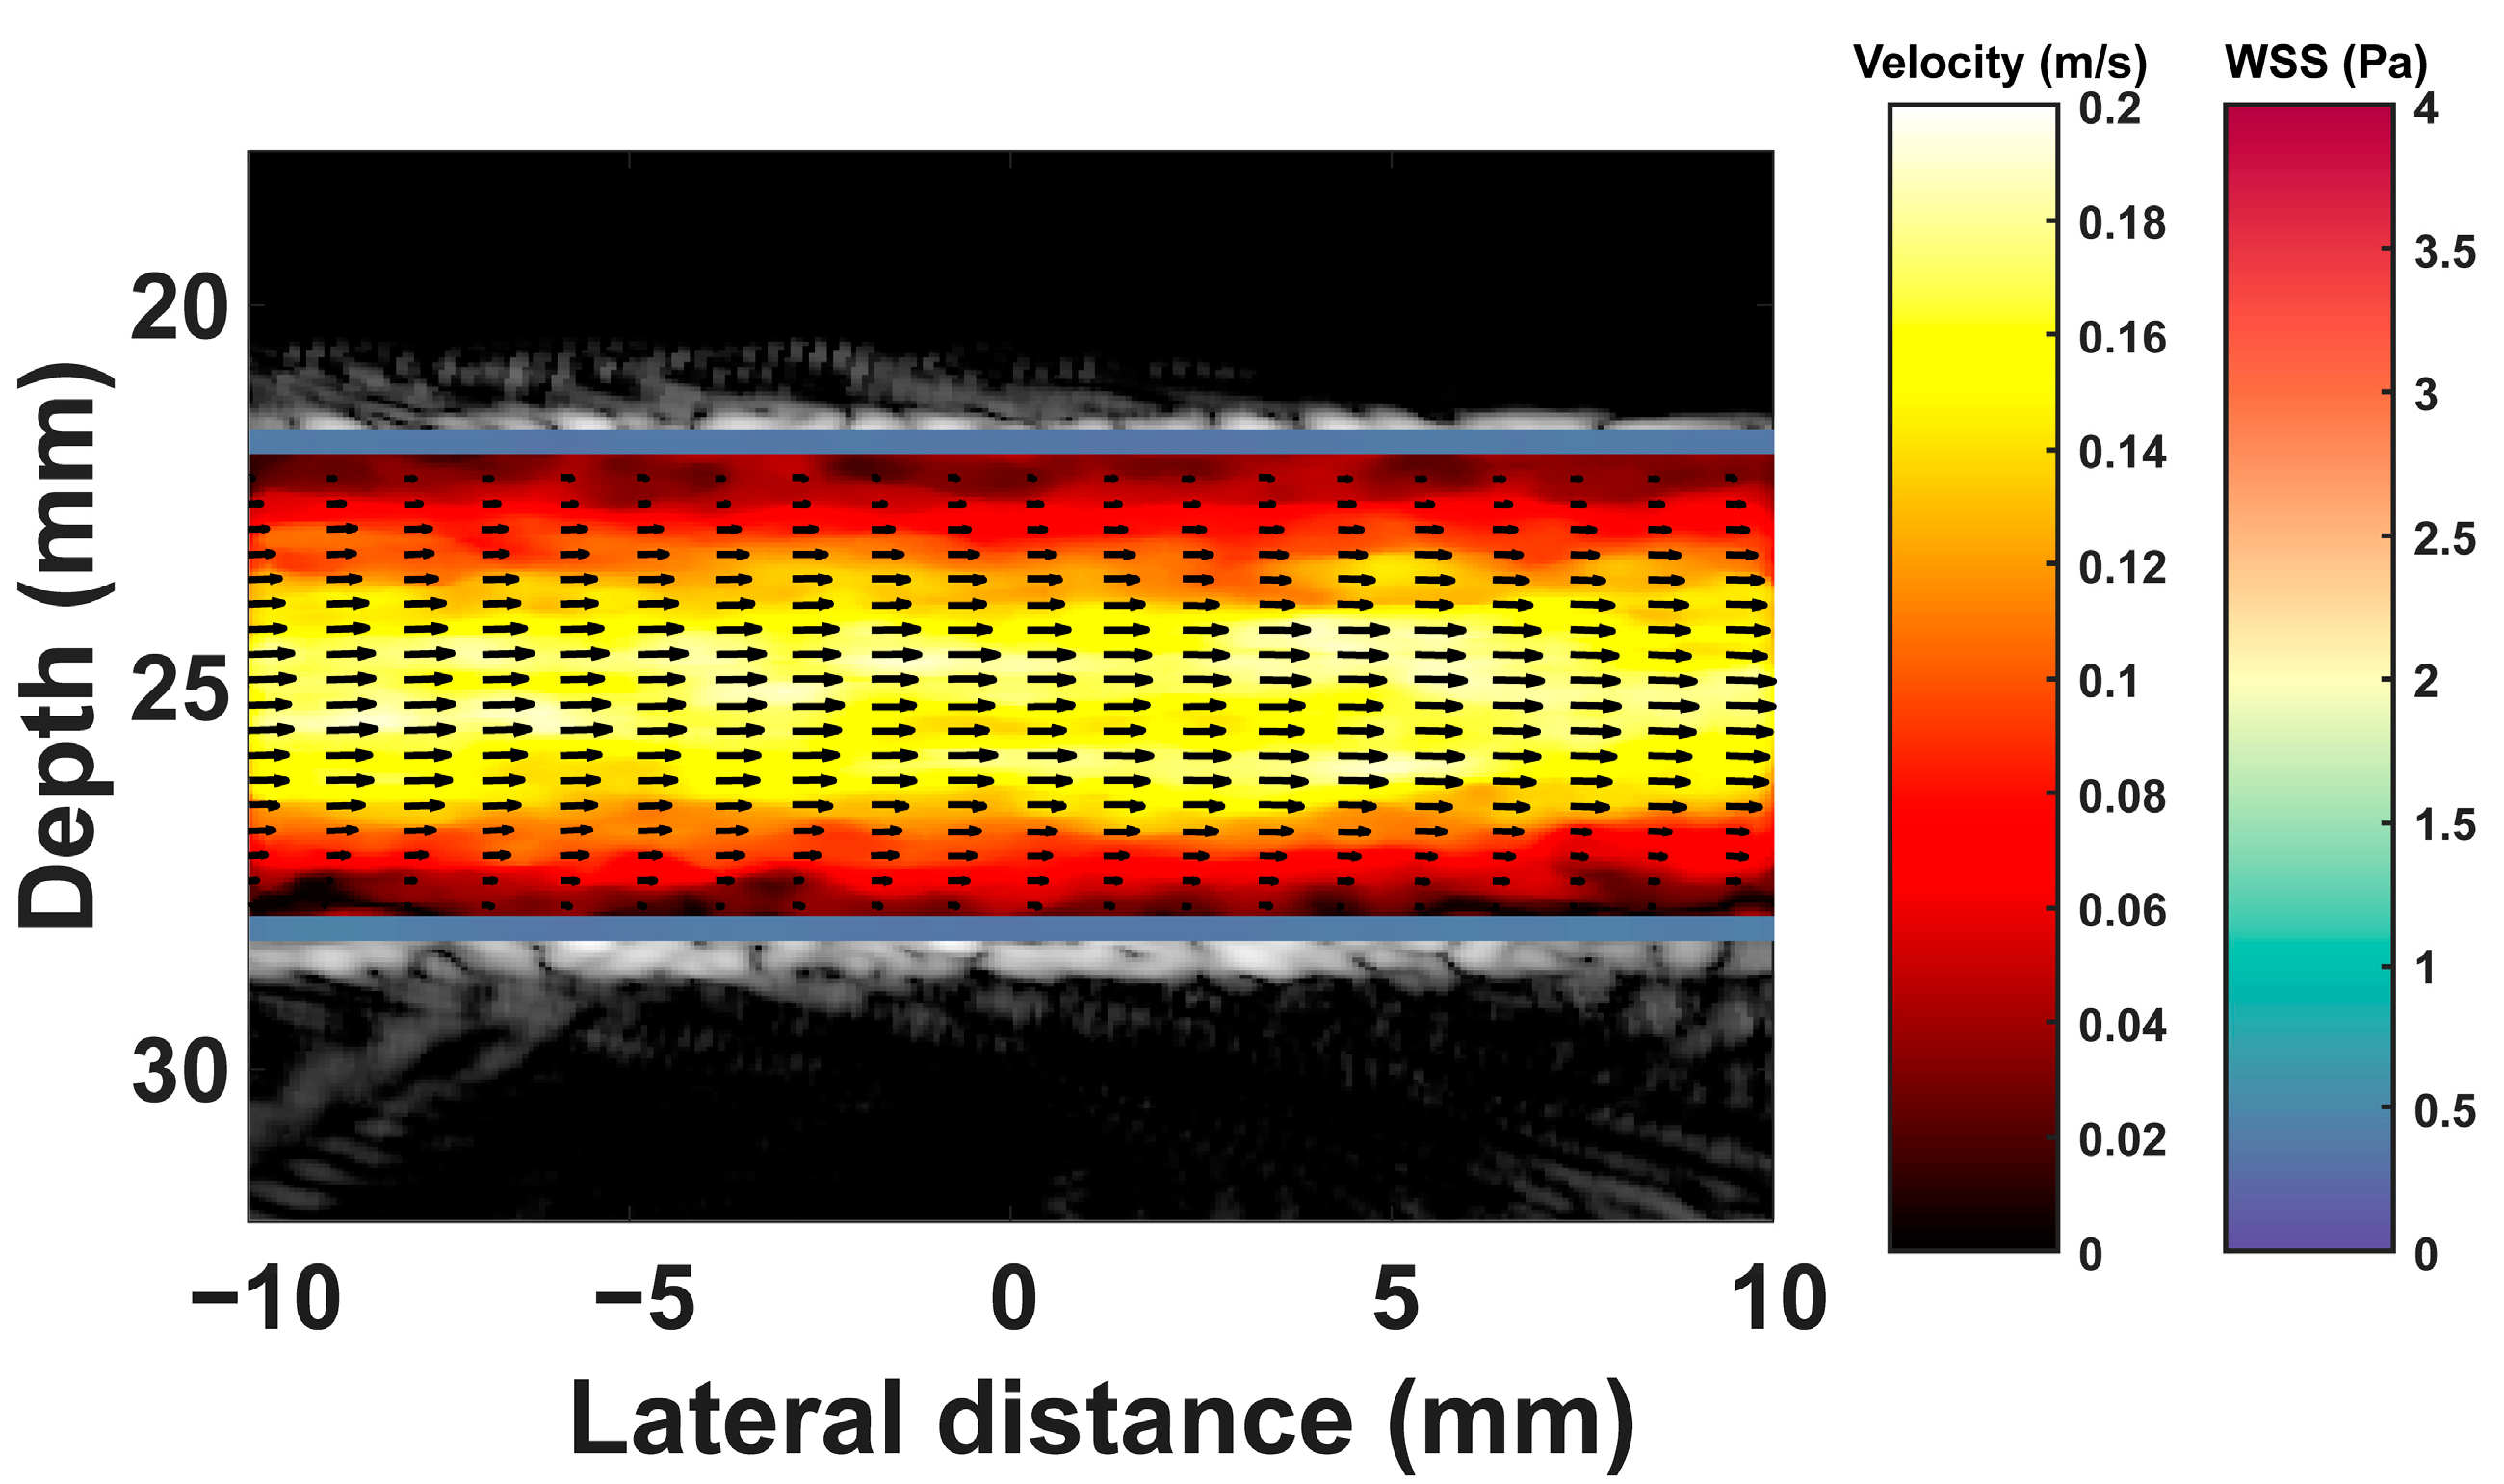
The accuracy of PW vector Doppler in estimating WSS was assessed in the synthetic vessel phantom created in Field II with a parabolic profile at centreline velocities of 0 . 2   m · s - 1 , 0 . 4   m · s - 1 , and 0 . 6   m · s - 1 . The WSS and velocity map from the simulation with a centreline velocity of 0.2 m · s - 1 is presented in Figure 6. The direction and length of the arrows represent the velocity direction and magnitude, respectively. The colour-coded velocity and WSS maps represent the distribution of the velocity and WSS. Overall, it can be observed that the flow vectors visually present a parabolic shape in all cases, as expected. The NRMSE calculated from 10 realisations of estimations between the estimated WSS and the WSS reference were (mean ± std) 9 . 4   ±   0 . 3 , 6 . 6   ±   0 . 4 , and 9 . 2   ±   0 . 9 .
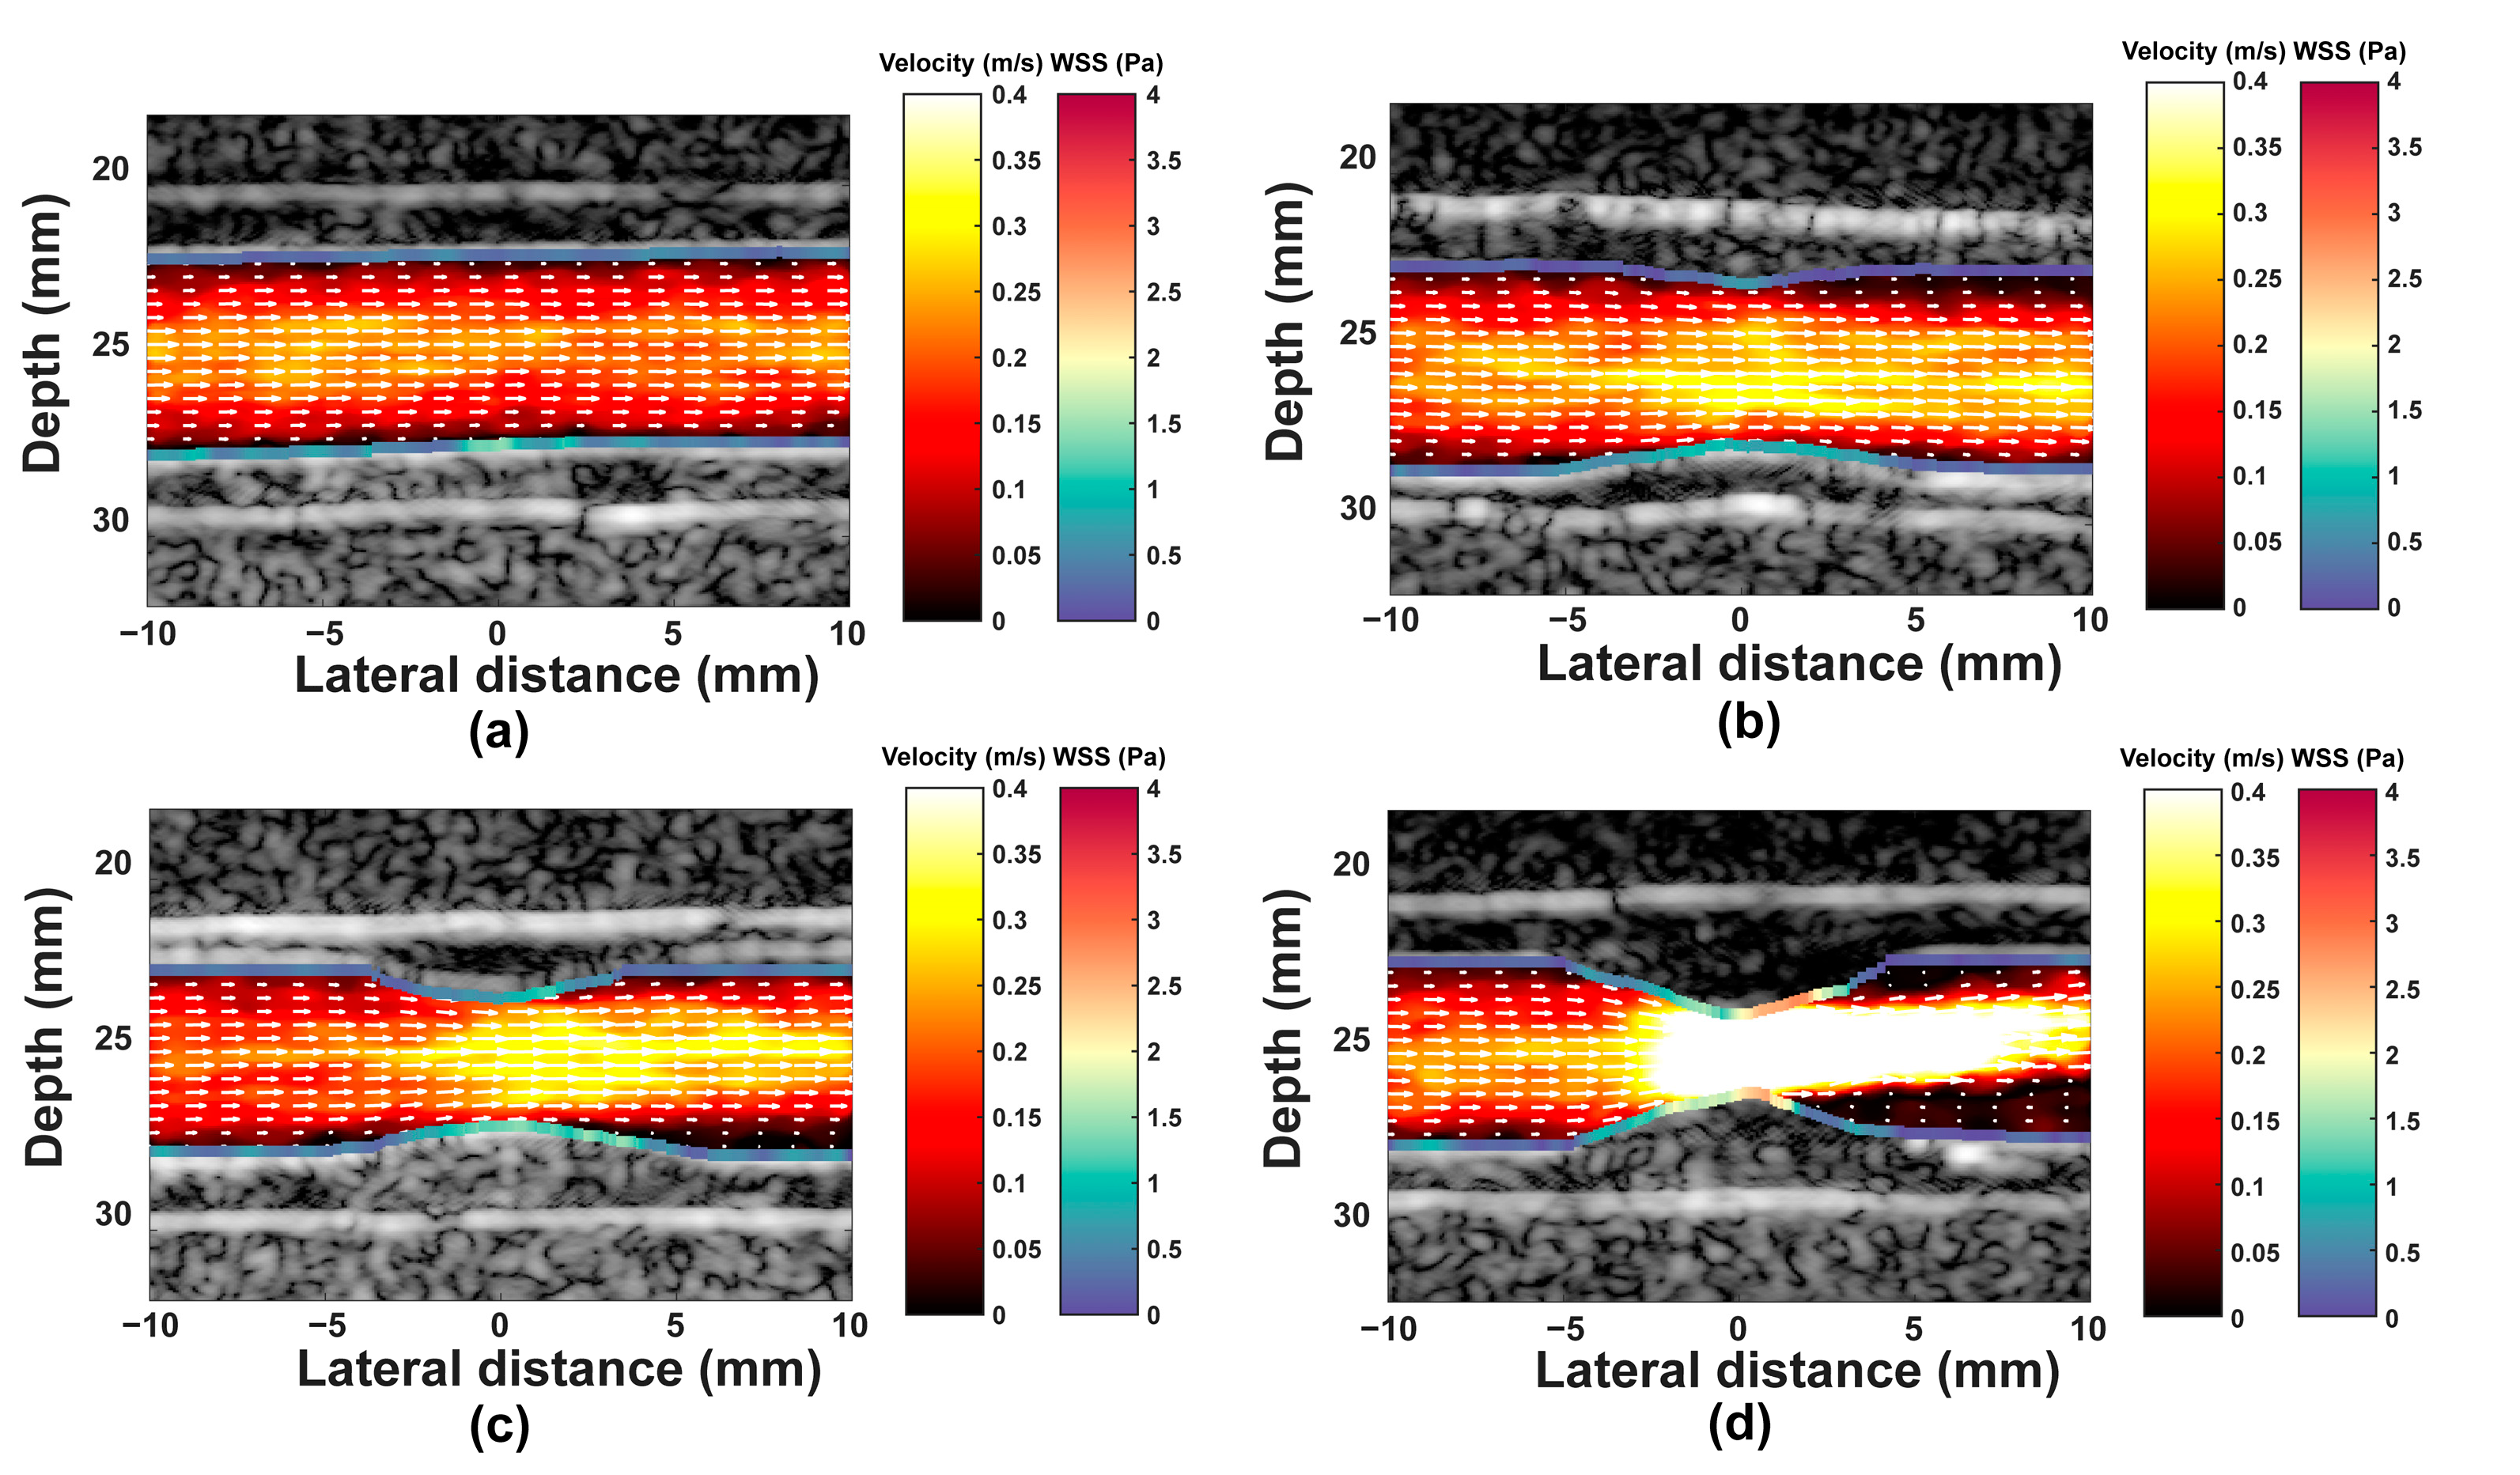
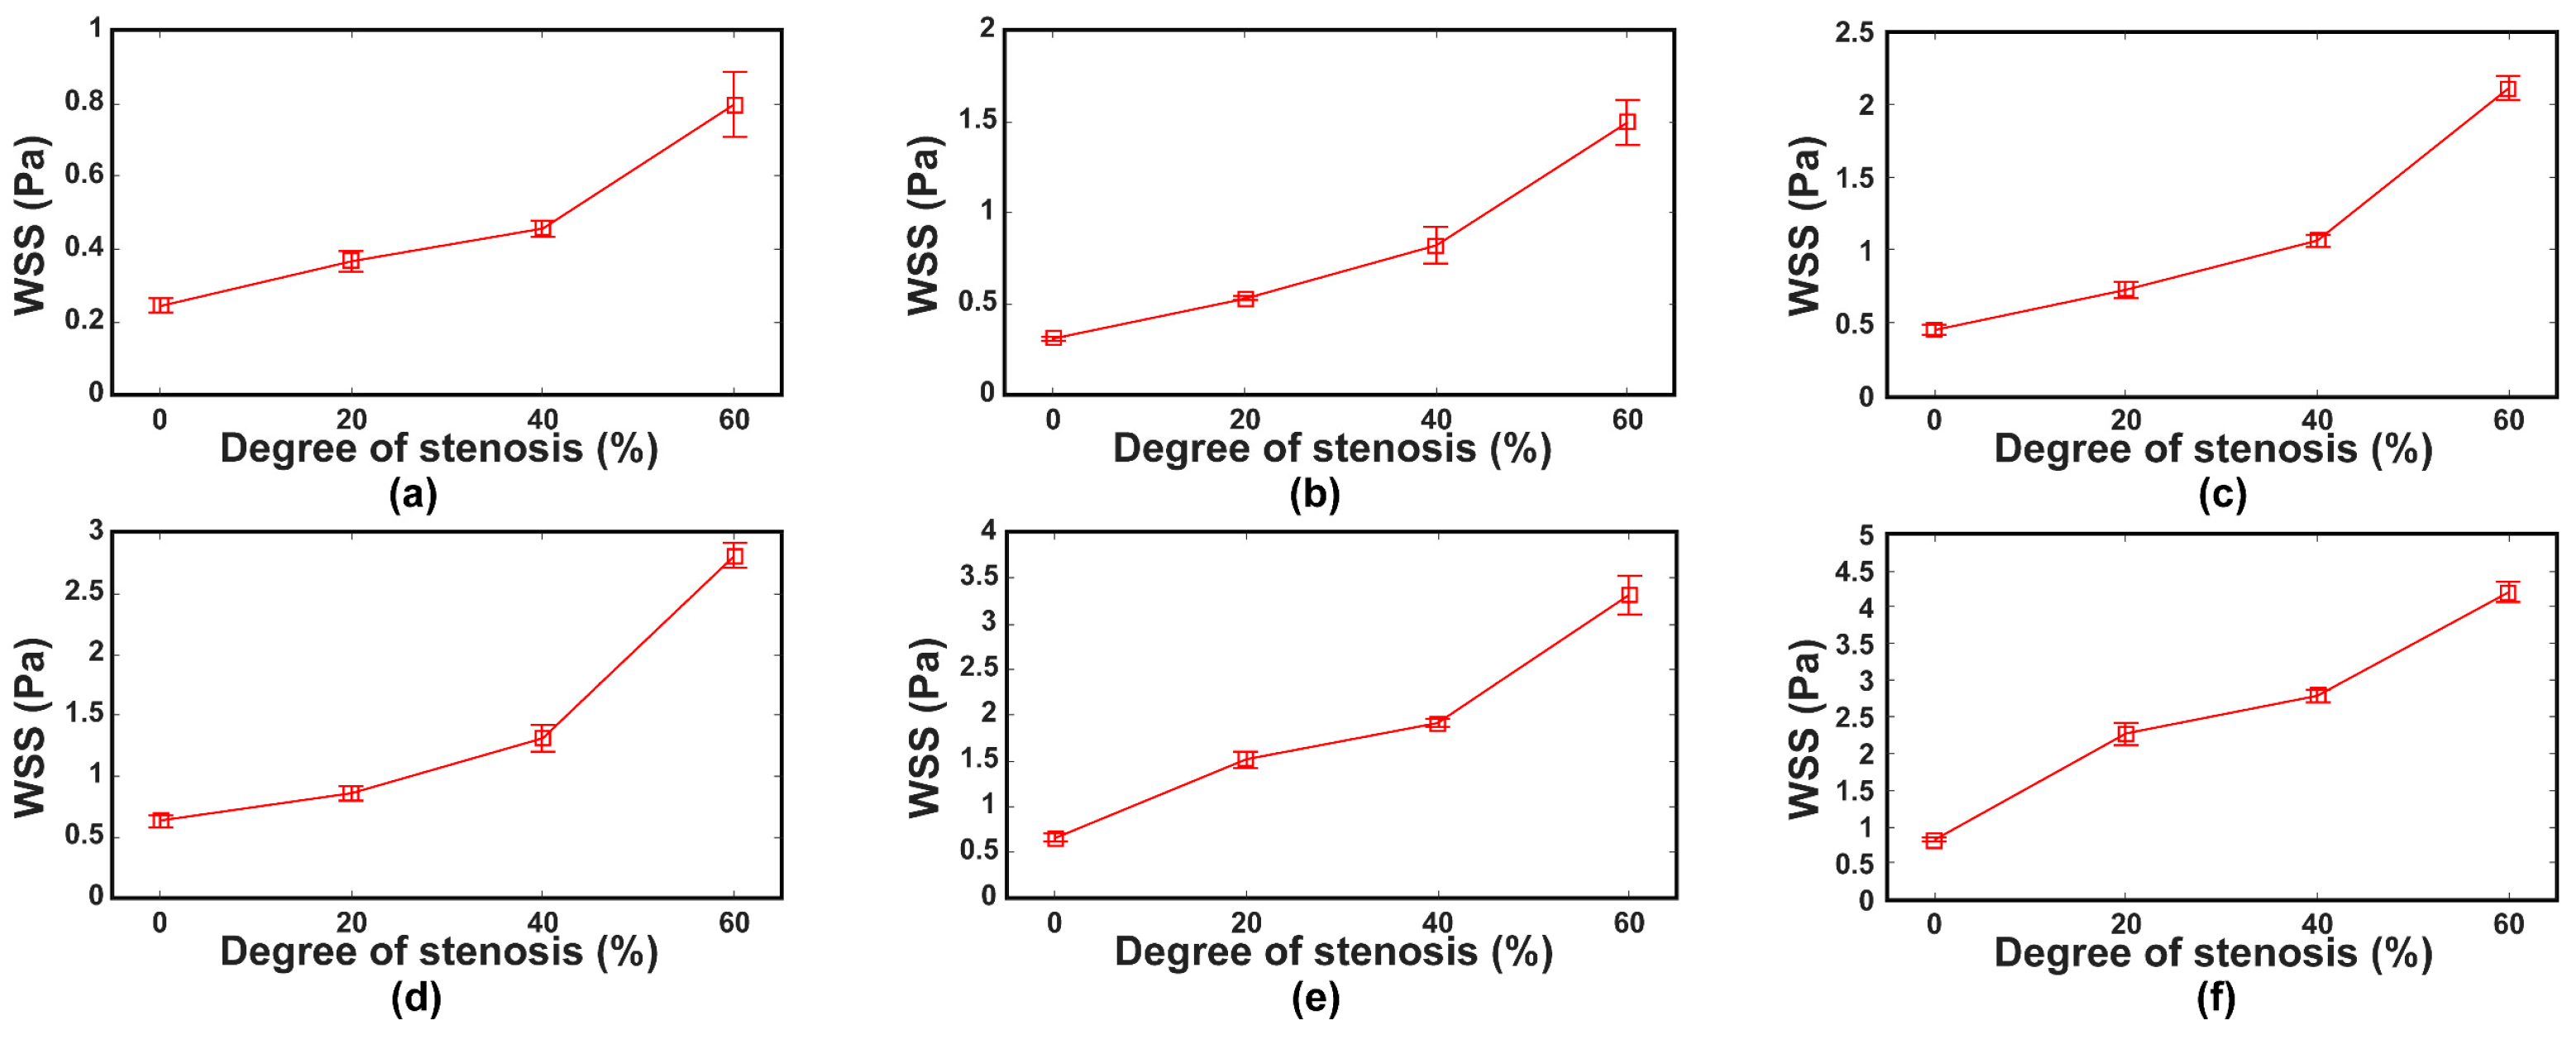
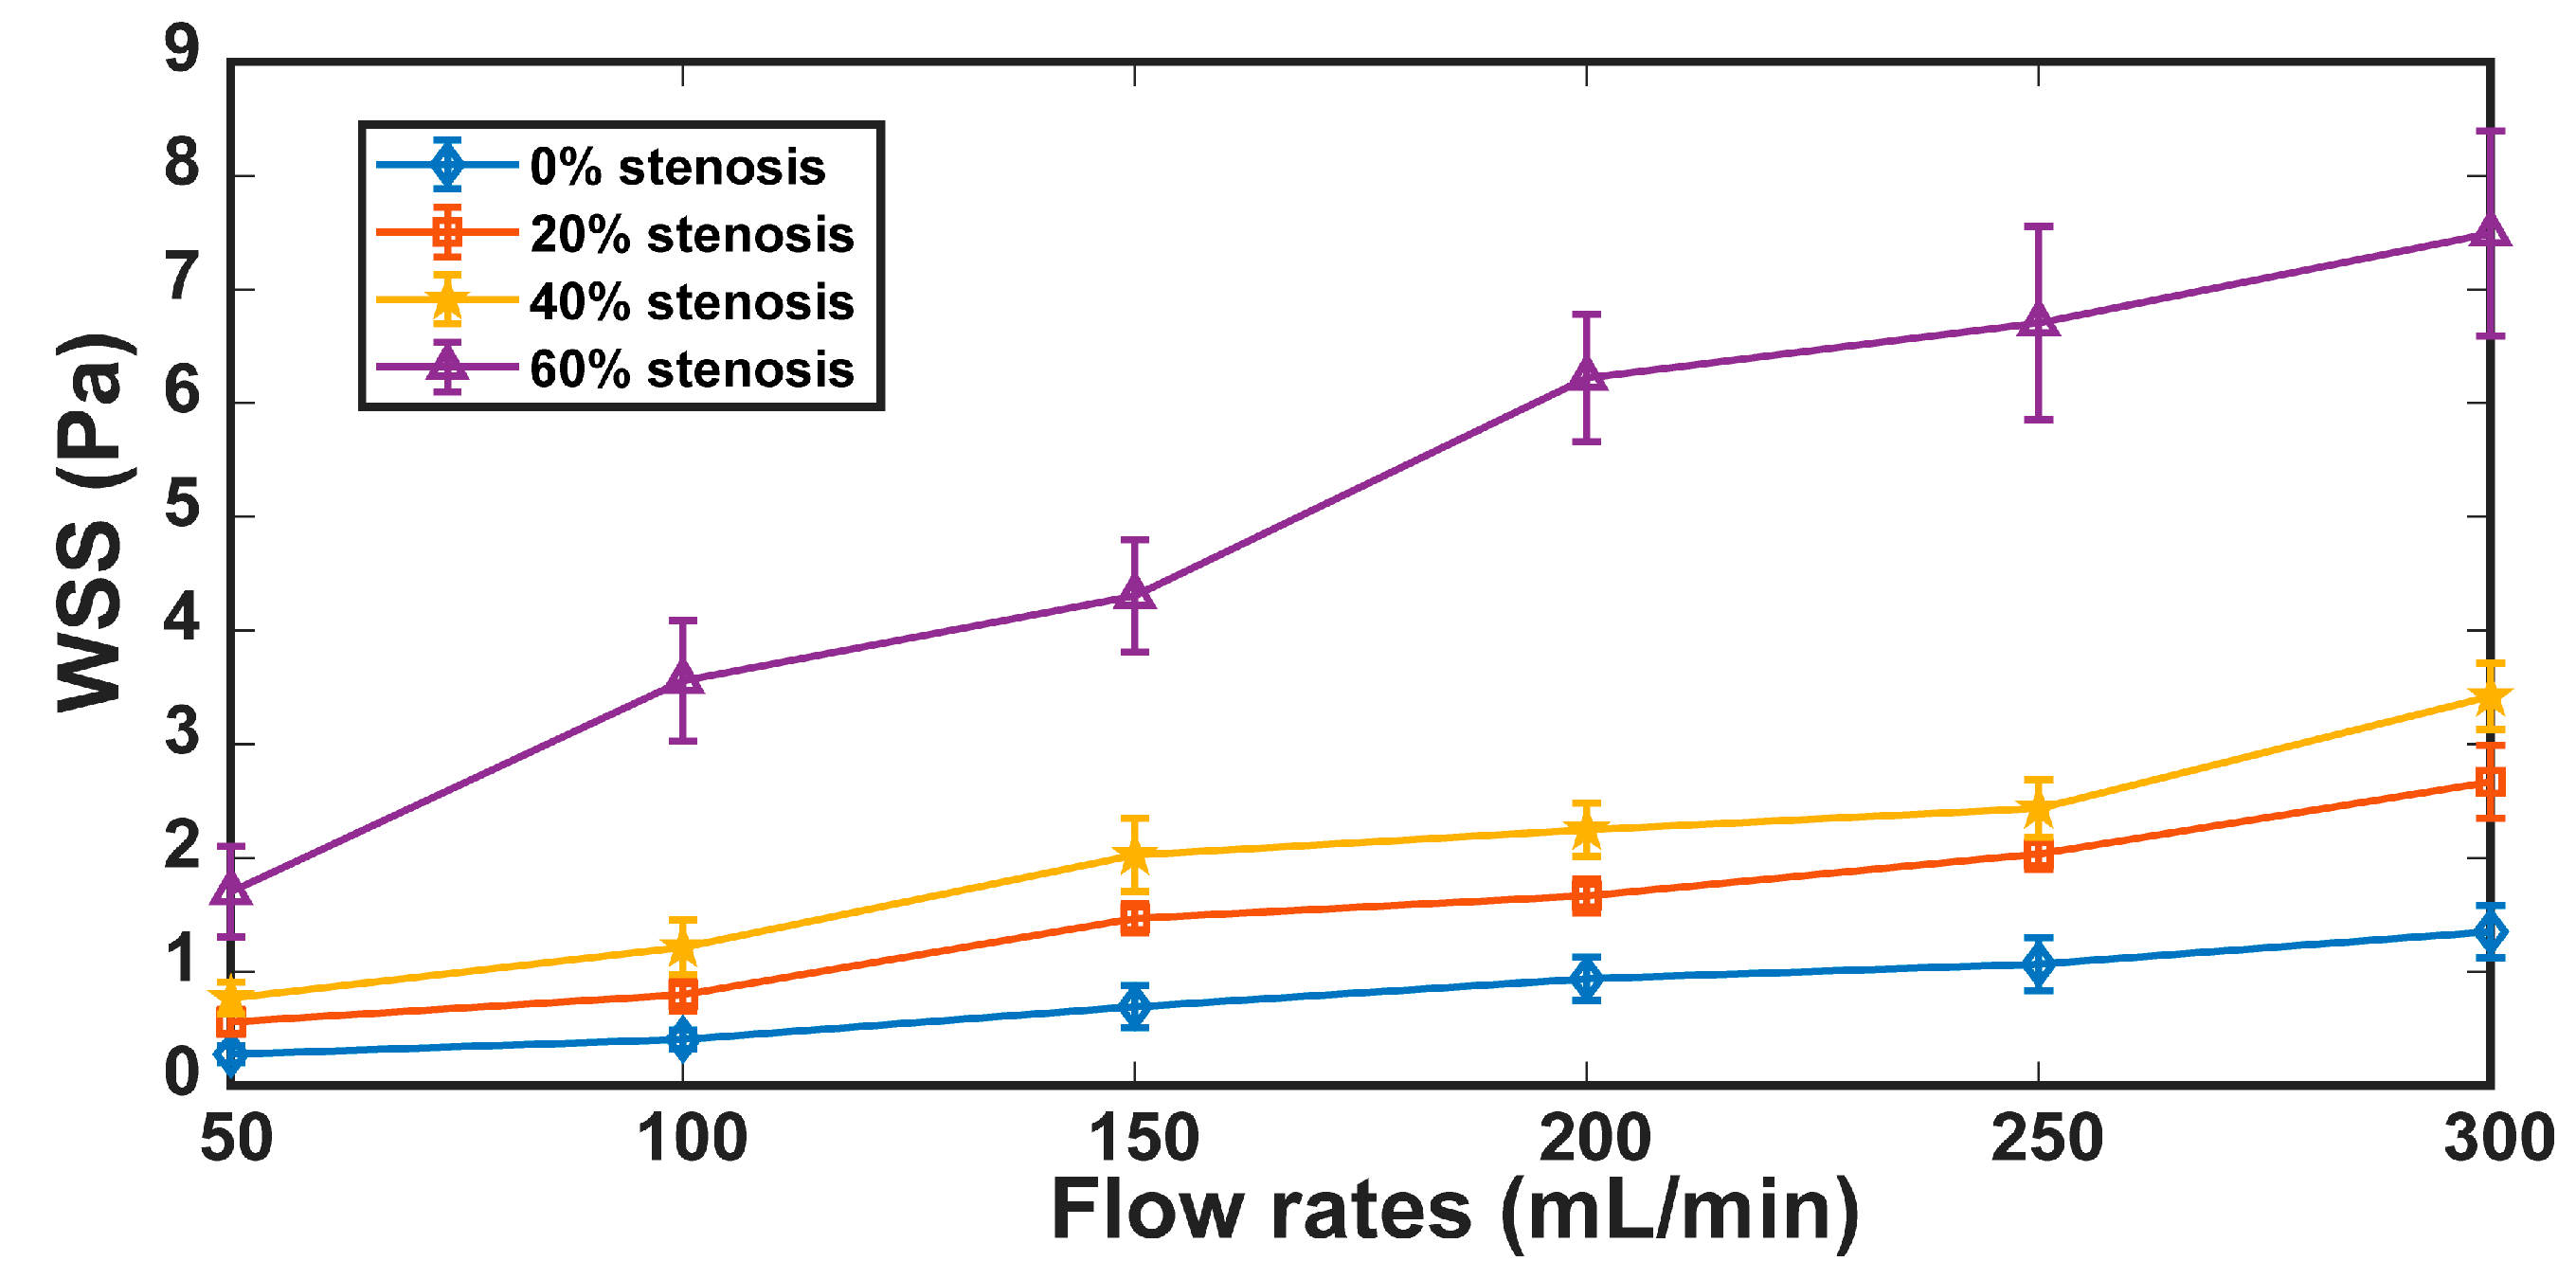
WSS measurements were conducted in the phantoms with a steady and pulsatile flow to investigate the relationship between WSS and the degree of stenosis. The vector maps and WSS maps of the four phantoms in the steady-flow experiment with a flow rate of 200   mL · min - 1 are shown in Figure 7a–d. It can be observed that the flow scatterers accelerate when passing the stenotic region and move slower when the diameter increases. The central post-stenotic region has a higher velocity magnitude than the pre-stenotic region. The maximum WSS value was found around the stenotic regions. When the degree of stenosis increased, the separation regions located in the post-stenotic region expanded, where recirculation flow was observed. Figure 8a–d show the mean WSS with variations in the degree of stenosis under different flow rates. For the stenotic vessel phantoms, the WSS was averaged along the vessel wall of stenotic regions. For the non-stenotic phantoms, the WSS was averaged along the vessel wall. The mean and std of WSS estimates were calculated from 10 consecutive realisations of WSS estimation. Each WSS estimation was performed in different frames of the acquired plane wave data. It can be seen that the mean WSS increased significantly with the degree of stenosis ( p < 0.01 ), except for the case between 0% and 20% ( p = 0.028 ). The WSS in the 60% stenotic region was significantly higher than in the 0% stenotic region ( p < 0.01 ), where the increases in WSS (in percentage) from are 226%, 381%, 367%, 341%, 403%, and 412% from 50   mL · min - 1 to 3 00   mL · min - 1 , respectively. The mean and std of maximum WSS in four phantoms with different flow rates were also calculated, as presented in Figure 9. For each flow phantom, there is an increase in the maximum WSS as the flow rate increases. In addition, the maximum WSS increases significantly with the degree of stenosis, as expected ( p < 0.01 ).
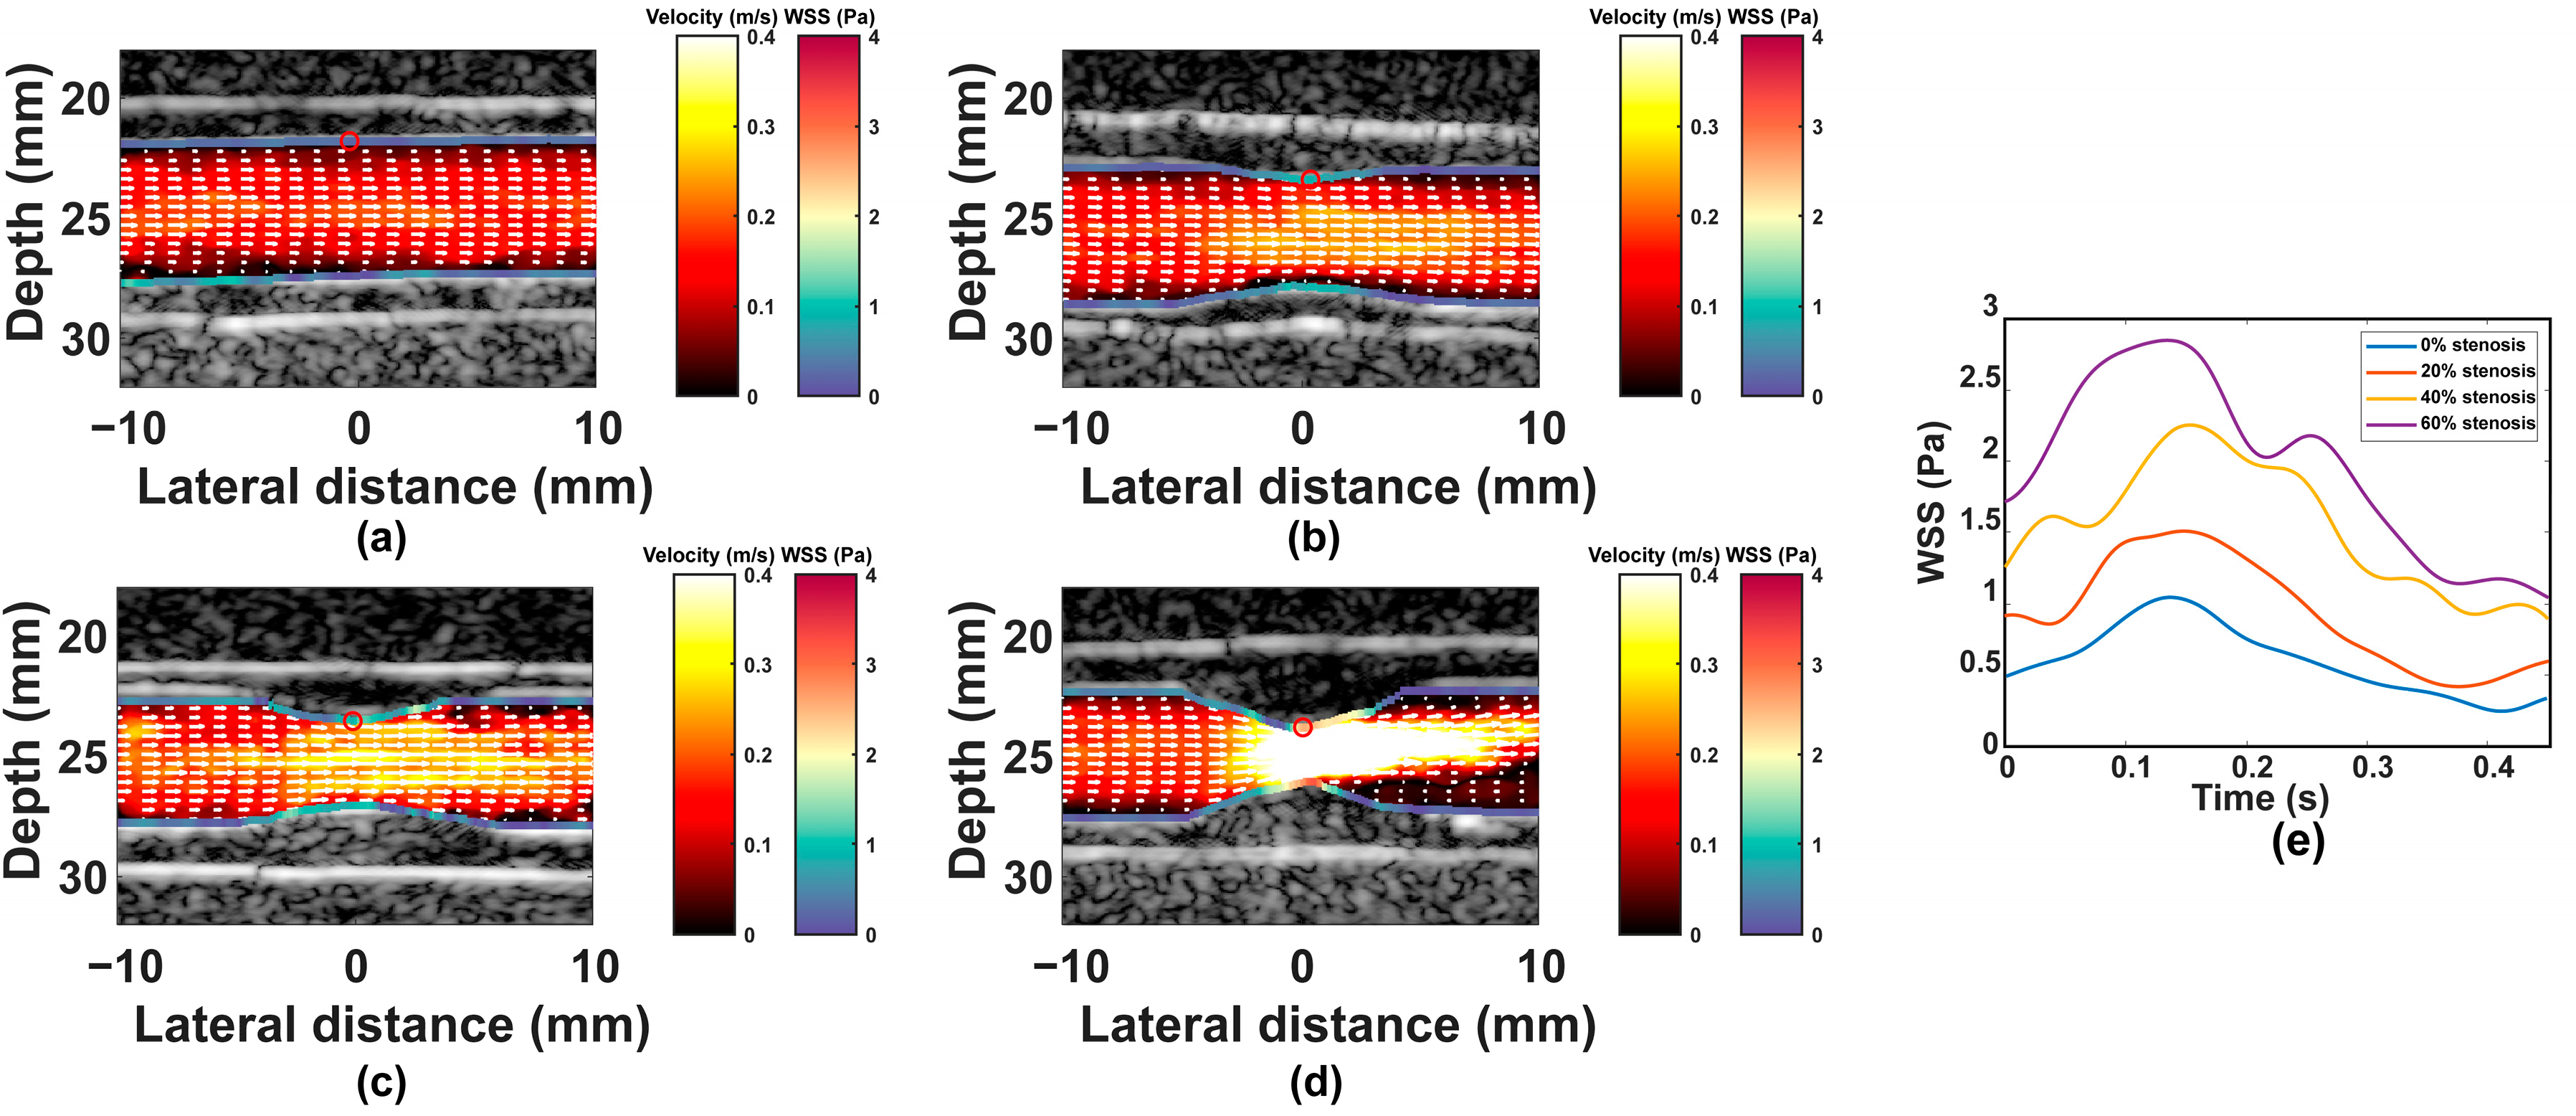
The velocity vector and WSS map in the pulsatile flow experiment are shown in Figure 10a–d, where the ROIs in red were selected to measure the WSS during the pulsatile flow cycle. For the non-stenotic flow phantoms, the ROI was located in the middle of the upper wall. For the stenotic flow phantoms, the ROI was located at the narrowest part of the vessel. The WSS variations in the ROI are shown in Figure 10e. The WSS in each flow phantom shows significant differences ( p < 0.01 ). The maximum WSS in the ROI was around 0.91 Pa, 1.31 Pa, 1.97 Pa, and 2.49 Pa for the phantom with degrees of stenosis of 0%, 20%, 40%, and 60% within the pulsatile cycle.

3.2. Discussion

The in silico experiments have demonstrated that WSS can be measured with an accuracy of less than 10% NRMSE. The flow phantom experiments have demonstrated that the PW vector Doppler method can estimate the mean WSS, the maximum WSS increases with the degree of stenosis, and WSS can be measured as a function of time in the ROIs of vessels during the pulsatile cycle. This provides the necessary validation data to give confidence in WSS measurements in patients using the PW vector Doppler technique.
This study adopted PW vector Doppler to measure WSS because it has a relatively low computational cost compared to other vector flow imaging methods, such as speckle tracking [41] and transverse oscillation [43]. For the development of a portable ultrasound device, a Doppler-based velocity estimator may be more suitable for the portable ultrasound system, most of which have a low computation ability and low power consumption. However, the estimated maximum velocity of the vector Doppler method is restricted by the pulse wavelength, leading to aliasing in the estimation of the high velocities present near the centre of the vessel. This may limit the use of PW vector Doppler in clinical practice for the measurement of the maximum velocity. For instance, for the experimental setup used in our study, the Nyquist velocity was 0 . 2   m · s - 1 . Because the overall velocity direction can be known in carotid arteries, the maximum measurable velocity is twice the Nyquist velocity, 0 . 4   m · s - 1 . Especially in multiple-transmission-angle Doppler schemes, the maximum measured velocity is reduced further. In some severely stenosed arteries, the flow velocity will be extremely high [44]. Thus, the aliasing problem will hinder the application of vector Doppler in the stenotic region. One straightforward way to tackle this problem is to use lower transmission angles to obtain a higher PRF at the cost of an increased estimation bias or apply an antialiasing algorithm in post-processing [45,46]. However, there are still some limitations when applying anti-aliasing algorithms in applications. However, the measurement of WSS involves the measurement of low velocities near the vessel wall and hence is unaffected by issues of aliasing.
The stenosis shape was an ideal cosine, which was originally used in the 1983 paper by Ahmed and Giddens [30]. In practice, stenoses in patients will have a variety of shapes, including a steeper inlet region. However, the same overall flow patterns will be seen regardless of the exact shape; the blood velocity will increase, peaking just beyond the minimum lumen, and the WSS will peak at the minimum lumen. In this respect, the exact shape of the stenosis used in this work is representative of the wide variety of stenosis shapes in patients. As for the fabrication of the experimental flow phantoms, some had non-uniform wall thicknesses. This has been observed in other work [17,21]. The vessel mould has two parts that need to be aligned together, and any bias may generate non-uniformity in the vessel mould. The variation in thickness will not invalidate measurements concerned with flow analysis and flow-derived parameters such as the WSR. More accurate flow phantom moulding must be considered when wall motion and pulse wave velocity are investigated. There is also a slight reduction in the diameter of the PVA-C vessels, typically by 2%, which has little influence on the estimation results.
There are two key factors in the estimation of the WSR; one is the method by which the location of the wall is estimated, and the second is the method by which the velocity data are extrapolated to the location of the wall. In our phantom study, we used a wall detection method based on intensity differences, which has already been validated in [39,47]. Compared to focused imaging, image quality based on plane wave ultrasound has a relatively low signal-to-noise ratio (SNR). If a high transmission frequency [48] or fewer pulse cycles are used to improve the image quality, due to the restriction of the Nyquist frequency, the maximum velocity and estimation accuracy would be influenced. Therefore, it needs a balance of parameters selected in the application. Moreover, the vessel wall is also in motion within cardiac cycles. These factors cause difficulties in accurately detecting the wall location. Especially if the imaging scenario is complex, such as in the carotid bifurcation, it is essential to seek a more robust wall segmentation method, for instance, deep learning [49] and adaptive wall tracking [50]. Moreover, clutter filtering is challenging when preserving the low-velocity components near the vessel wall. Designing a well-defined filter can help to remove the clutter as much as possible. However, the tissue velocity may overlap with the blood velocity. Very commonly used filters such as the finite impulse response (FIR) and infinite impulse response (IIR) may remove the blood flow vector within the stop band. In this work, we used an SVD filter to remove the clutter. The SVD filter is a spatiotemporal filter based on singular vector decomposition. The clutter removal is realised by rejecting the singular components belonging to tissue motion. The SVD filter performs better in separating the clutter and blood vector than traditional filter methods, such as the FIR and IIR filter methods [37]. To further increase the accuracy of estimated WSS, microbubble contrast agents may be used to increase the SNR of blood flow and the sensitivity of the imaging system [41,51]. For the estimation of the wall shear rate, we regulated the velocity near the wall by using a Savitzky–Golay filter, which is commonly used, such as in [28,41]. However, it requires the careful selection of the filter parameters. Some novel methods focusing on compensating the near-wall velocity or reconstructing the velocity profile near the wall also show promising results in estimating the near-wall velocity [11,29]. The applicability of the results of the paper to the clinical scanning of patients will be considered. The phantoms are tissue-equivalent, and therefore, the images are comparable to those that would be obtained using a clinical ultrasound system on patients. The measured velocity vectors and WSS are able to give a detailed haemodynamic depiction of the region of interest. However, in the application of in vivo scanning, the image quality is likely to be poor, in association with shadowing arising from the calcified plaque. In this case, locating the vessel wall would be difficult, which will limit the accuracy of WSS estimation. It may be that adequate results could be obtained by choosing another image plane. A second issue concerns the fact that the fabricated phantoms are straight, whereas the carotid arteries are a 3D bifurcating structure. However, the entire 3D structure is not of interest in the current study. In ultrasound scanning, the operator chooses a longitudinal scan plane in which the stenosis is centrally placed, and the lumen is visualised for 2 cm or so on either side of the stenosis. In this respect, the straight-tube phantom could resemble situations in patients. It is noted that conventional ultrasound is a 2D technique; out-of-plane WSS components would require the use of a 3D technique, which is outside the scope of this study. Moreover, in this study, the wall was identified as the location of the peak echo amplitude. In mild to moderate disease, the intima (the layer closest to the blood) is identified as a bright echo, with the medium being a dark echolucent area. Provided that the ultrasound scanner has a high spatial resolution, the intima can be observed on both the anterior and posterior walls, so the same procedure as was used in the phantom can be applied. However, in severe disease, there is no separate intimal echo, and measurement is more difficult, usually involving the inner edge to the inner edge. This will affect the estimation of the WSR in disease; an evaluation of this would require separate validation in patients or the use of a real-vessel phantom. Our current study focused on the WSS in the stenotic region. However, the flow becomes complex after passing the stenosis, and the flow distal to the stenosis is influenced by the degree of stenosis and by the distal distance [52]. In fast-changing-flow regions, the WSS changes rapidly with it. The out-of-plane motion of the flow also will affect WSS estimation. Therefore, additional studies are needed to understand the influence of complex haemodynamics on WSS estimation.
In future work, the use of two or more steered probes together and a 3D matrix probe to acquire the ultrasound data needs to be further investigated to obtain 3D velocity data. The fabrication of a more realistic carotid stenosis phantom and its use for the comprehensive investigation of WSS in regions such as the carotid bifurcation and those distal to the stenosis should also be investigated. A more robust WSS estimation method may be investigated to increase the accuracy of the estimation under the conditions of complex flow dynamics.

4. Conclusions

In this work, we investigated the associations between the WSS measured by PW vector Doppler and variations in the stenosis degree in a phantom experiment. Firstly, we validated the WSS estimation accuracy of PW vector Doppler through an ultrasound simulation. Then, four phantoms with different degrees of stenosis were constructed by 3D printing and casting. The phantom study results showed that the mean WSS and maximum WSS increased with the degree of stenosis. Both the simulation and experimental results provide necessary validation data to give confidence in WSS measurements in patients using the PW vector Doppler technique.

Author Contributions

Conceptualisation, P.R.H.; Methodology, K.Y. and P.R.H.; Investigation, K.Y.; Project Administration, Z.H.; Visualisation, K.Y. and P.R.H.; Writing—Original Draft Preparation, K.Y. and C.X.; Writing—Review and Editing, P.R.H., G.A.C. and C.X.; Funding Acquisition, C.X. and Z.H. All authors have read and agreed to the published version of the manuscript.

Funding

This work was supported in part by the China Scholarship Council (No. 202006740050) and in part by the University of Dundee.

Institutional Review Board Statement

Not applicable.

Informed Consent Statement

Not applicable.

Data Availability Statement

The data are available from the corresponding author upon reasonable request.

Acknowledgments

The authors want to thank Mengxing Tang and Matthieu Toulemonde for their kind help in guiding the setting up of the Verasonics system. The authors also want to thank Xiaowei Zhou for his guidance in fabricating the flow phantom.

Conflicts of Interest

The authors declare no conflict of interest.

References

  1. Roth, G.A.; Johnson, C.; Abajobir, A.; Abd-Allah, F.; Abera, S.F.; Abyu, G.; Ahmed, M.; Aksut, B.; Alam, T.; Alam, K.; et al. Global, regional, and national burden of cardiovascular diseases for 10 causes, 1990 to 2015. J. Am. Coll. Cardiol. 2017, 70, 1–25. [Google Scholar] [CrossRef] [PubMed]
  2. Hoskins, P.R.; Lawford, P.V.; Doyle, B.J. Cardiovascular Biomechanics; Springer: Cham, Switzerland, 2017. [Google Scholar]
  3. Chaer, R.A.; Abularrage, C.J.; Coleman, D.M.; Eslami, M.H.; Kashyap, V.S.; Rockman, C.; Murad, M.H. The Society for Vascular Surgery clinical practice guidelines on the management of visceral aneurysms. J. Vasc. Surg. 2020, 72, 3S–39S. [Google Scholar] [CrossRef] [PubMed]
  4. Oates, C.P.; Naylor, A.R.; Hartshorne, T.; Charles, S.M.; Fail, T.; Humphries, K.; Aslam, M.; Khodabakhsh, P. Joint Recommendations for Reporting Carotid Ultrasound Investigations in the United Kingdom. Eur. J. Vasc. Endovasc. Surg. 2009, 37, 251–261. [Google Scholar] [CrossRef] [Green Version]
  5. Slager, C.J.; Wentzel, J.J.; Gijsen, F.J.; Schuurbiers, J.C.; van der Wal, A.C.; van der Steen, A.F.; Serruys, P.W. The role of shear stress in the generation of rupture-prone vulnerable plaques. Nat. Clin. Pract. Cardiovasc. Med. 2005, 2, 401–407. [Google Scholar] [CrossRef] [PubMed]
  6. Slager, C.J.; Wentzel, J.J.; Gijsen, F.J.; Thury, A.; van der Wal, A.C.; Schaar, J.A.; Serruys, P.W. The role of shear stress in the destabilization of vulnerable plaques and related therapeutic implications. Nat. Clin. Pract. Cardiovasc. Med. 2005, 2, 456–464. [Google Scholar] [CrossRef]
  7. Raggi, P.; Genest, J.; Giles, J.T.; Rayner, K.J.; Dwivedi, G.; Beanlands, R.S.; Gupta, M. Role of inflammation in the pathogenesis of atherosclerosis and therapeutic interventions. Atherosclerosis 2018, 276, 98–108. [Google Scholar] [CrossRef] [Green Version]
  8. Wolf, D.; Ley, K. Immunity and Inflammation in Atherosclerosis. Circ. Res. 2019, 124, 315–327. [Google Scholar] [CrossRef]
  9. Steinman, D.A.; Thomas, J.B.; Ladak, H.M.; Milner, J.S.; Rutt, B.K.; Spence, J.D. Reconstruction of carotid bifurcation hemodynamics and wall thickness using computational fluid dynamics and MRI. Magn. Reson. Med. 2002, 47, 149–159. [Google Scholar] [CrossRef]
  10. Köhler, U.; Marshall, I.; Robertson, M.B.; Long, Q.; Xu, X.Y.; Hoskins, P.R. MRI measurement of wall shear stress vectors in bifurcation models and comparison with CFD predictions. J. Magn. Reson. Imaging 2001, 14, 563–573. [Google Scholar] [CrossRef]
  11. Ricci, S.; Swillens, A.; Ramalli, A.; Segers, P.; Tortoli, P. Wall shear rate measurement: Validation of a new method through multiphysics simulations. IEEE Trans. Ultrason. Ferroelectr. Freq. Control. 2017, 64, 66–77. [Google Scholar] [CrossRef]
  12. Zhou, X.; Xia, C.; Stephen, G.; Khan, F.; Corner, G.A.; Hoskins, P.R.; Huang, Z. Investigation of Ultrasound-Measured Flow Velocity, Flow Rate and Wall Shear Rate in Radial and Ulnar Arteries Using Simulation. Ultrasound Med. Biol. 2017, 43, 981–992. [Google Scholar] [CrossRef] [PubMed] [Green Version]
  13. Brands, P.J.; Hoeks, A.P.; Hofstra, L.; Reneman, R.S. Reneman. A noninvasive method to estimate wall shear rate using ultrasound. Ultrasound Med. Biol. 1995, 21, 171–185. [Google Scholar] [CrossRef] [PubMed]
  14. Bercoff, J.; Montaldo, G.; Loupas, T.; Savery, D.; Mézière, F.; Fink, M.; Tanter, M. Ultrafast compound Doppler imaging: Providing full blood flow characterization. IEEE Trans. Ultrason. Ferroelectr. Freq. Control. 2011, 58, 134–147. [Google Scholar] [CrossRef] [PubMed]
  15. Ekroll, I.K.; Swillens, A.; Segers, P.; Dahl, T.; Torp, H.; Lovstakken, L. Simultaneous quantification of flow and tissue velocities based on multi-angle plane wave imaging. IEEE Trans. Ultrason. Ferroelectr. Freq. Control. 2013, 60, 727–738. [Google Scholar] [CrossRef] [PubMed]
  16. Yiu, B.Y.; Lai, S.S.; Yu, A.C. Vector projectile imaging: Time-resolved dynamic visualization of complex flow patterns. Ultrasound Med. Biol. 2014, 40, 2295–2309. [Google Scholar] [CrossRef]
  17. Karageorgos, G.M.; Apostolakis, I.Z.; Nauleau, P.; Gatti, V.; Weber, R.; Kemper, P.; Konofagou, E.E. Pulse wave imaging coupled with vector flow mapping: A phantom, simulation, and in vivo study. IEEE Trans. Ultrason. Ferroelectr. Freq. Control. 2021, 68, 2516–2531. [Google Scholar] [CrossRef]
  18. Yang, K.; Hoskins, P.R.; Corner, G.A.; Xia, C.; Huang, Z. Vector flow imaging by plane wave speckle tracking based on different beamformers. In Proceedings of the 2022 7th International Conference on Signal and Image Processing (ICSIP), Nanjing, China, 20–22 July 2022; pp. 563–566. [Google Scholar]
  19. Hasegawa, H.; Mozumi, M.; Omura, M.; Nagaoka, R.; Saito, K. Measurement of flow velocity vectors in carotid artery using plane wave imaging with repeated transmit sequence. J. Med. Ultrason. 2021, 48, 417–427. [Google Scholar] [CrossRef]
  20. Kenwright, D.A.; Anderson, T.; Moran, C.M.; Hoskins, P.R. Assessment of spectral Doppler for an array-based preclinical ultrasound scanner using a rotating phantom. Ultrasound Med. Biol. 2015, 41, 2232–2239. [Google Scholar] [CrossRef] [Green Version]
  21. Chee, A.J.; Ho, C.K.; Yiu, B.Y.; Yu, A.C. Walled carotid bifurcation phantoms for imaging investigations of vessel wall motion and blood flow dynamics. IEEE Trans. Ultrason. Ferroelectr. Freq. Control. 2016, 63, 1852–1864. [Google Scholar] [CrossRef]
  22. Shimizu, M.; Tanaka, T.; Okada, T.; Seki, Y.; Nishiyama, T. Wall shear stress measurement method based on parallel flow model near vascular wall in echography. Jpn. J. Appl. Phys. 2017, 56, 07JF08. [Google Scholar] [CrossRef]
  23. Nagaoka, R.; Ishikawa, K.; Mozumi, M.; Cinthio, M.; Hasegawa, H. Basic study on estimation method of wall shear stress in common carotid artery using blood flow imaging. Jpn. J. Appl. Phys. 2020, 59, SKKE16. [Google Scholar] [CrossRef]
  24. Chayer, B.; van den Hoven, M.; Cardinal, M.R.; Li, H.; Swillens, A.; Lopata, R.; Cloutier, G. Atherosclerotic carotid bifurcation phantoms with stenotic soft inclusions for ultrasound flow and vessel wall elastography imaging. Phys. Med. Biol. 2019, 64, 095025. [Google Scholar] [CrossRef] [PubMed]
  25. Blake, J.R.; Easson, W.J.; Hoskins, P.R. A dual-phantom system for validation of velocity measurements in stenosis models under steady flow. Ultrasound Med. Biol. 2009, 35, 1510–1524. [Google Scholar] [CrossRef]
  26. Zhou, X.; Kenwright, D.A.; Wang, S.; Hossack, J.A.; Hoskins, P.R. Fabrication of two flow phantoms for Doppler ultrasound imaging. IEEE Trans. Ultrason. Ferroelectr. Freq. Control. 2017, 64, 53–65. [Google Scholar] [CrossRef] [Green Version]
  27. Goudot, G.; Poree, J.; Pedreira, O.; Khider, L.; Julia, P.; Alsac, J.M.; Laborie, E.; Mirault, T.; Tanter, M.; Messas, E.; et al. Wall shear stress measurement by ultrafast vector flow imaging for atherosclerotic carotid stenosis. Ultraschall Med. 2021, 42, 297–305. [Google Scholar] [CrossRef] [PubMed]
  28. Wang, I.C.; Huang, H.; Chang, W.T.; Huang, C.C. Wall shear stress mapping for human femoral artery based on ultrafast ultrasound vector Doppler estimations. Med. Phys. 2021, 48, 6755–6764. [Google Scholar] [CrossRef] [PubMed]
  29. Ekroll, I.K.; Perrot, V.; Liebgott, H.; Avdal, J. Tapered vector Doppler for improved quantification of low velocity blood flow. IEEE Trans. Ultrason. Ferroelectr. Freq. Control. 2021, 68, 1017–1031. [Google Scholar] [CrossRef]
  30. Ahmed, S.A.; Giddens, D.P. Flow disturbance measurements through a constricted tube at moderate Reynolds numbers. J. Biomech. 1983, 16, 955–963. [Google Scholar] [CrossRef]
  31. Li, M.X.; Beech-Brandt, J.J.; John, L.R.; Hoskins, P.R.; Easson, W.J. Numerical analysis of pulsatile blood flow and vessel wall mechanics in different degrees of stenoses. J. Biomech. 2007, 40, 3715–3724. [Google Scholar] [CrossRef]
  32. Zell, K.; Sperl, J.I.; Vogel, M.W.; Niessner, R.; Haisch, C. Acoustical properties of selected tissue phantom materials for ultrasound imaging. Phys. Med. Biol. 2007, 52, N475–N484. [Google Scholar] [CrossRef]
  33. Ramnarine, K.V.; Nassiri, D.K.; Hoskins, P.R.; Lubbers, J. Validation of a new blood-mimicking fluid for use in Doppler flow test objects. Ultrasound Med. Biol. 1998, 24, 451–459. [Google Scholar] [CrossRef] [PubMed]
  34. Jensen, J.A.; Svendsen, N.B. Calculation of pressure fields from arbitrarily shaped, apodized, and excited ultrasound transducers. IEEE Trans. Ultrason. Ferroelectr. Freq. Control. 1992, 39, 262–267. [Google Scholar] [CrossRef] [PubMed] [Green Version]
  35. Jensen, J.A. Field: A program for simulating ultrasound systems. In Proceedings of the 10th Nordic-Baltic Conference on Biomedical Imaging, Medical and Biological Engineering and Computing, Tampere, Finland, 9–13 June 1996; pp. 351–353. [Google Scholar]
  36. Montaldo, G.; Tanter, M.; Bercoff, J.; Benech, N.; Fink, M. Coherent plane-wave compounding for very high frame rate ultrasonography and transient elastography. IEEE Trans. Ultrason. Ferroelectr. Freq. Control. 2009, 56, 489–506. [Google Scholar] [CrossRef] [PubMed]
  37. Baranger, J.; Arnal, B.; Perren, F.; Baud, O.; Tanter, M.; Demene, C. Adaptive spatiotemporal svd clutter filtering for ultrafast Doppler imaging using similarity of spatial singular vectors. IEEE Trans. Med. Imaging 2018, 37, 1574–1586. [Google Scholar] [CrossRef] [Green Version]
  38. Kasai, C.; Namekawa, K.; Koyano, A.; Omoto, R. Real-time two-dimensional blood flow imaging using an autocorrelation technique. IEEE Trans. Sonics Ultrason. 1985, 32, 458–464. [Google Scholar] [CrossRef]
  39. Blake, J.R.; Meagher, S.; Fraser, K.H.; Easson, W.J.; Hoskins, P.R. A method to estimate wall shear rate with a clinical ultrasound scanner. Ultrasound Med. Biol. 2008, 34, 760–774. [Google Scholar] [CrossRef]
  40. Papaioannou, T.G.; Stefanadis, C.J.H.J.C. Vascular wall shear stress: Basic principles and methods. Hell. J. Cardiol. 2005, 46, 9–15. [Google Scholar]
  41. Leow, C.H.; Tang, M.X. Spatio-temporal flow and wall shear stress mapping based on incoherent ensemble-correlation of ultrafast contrast enhanced ultrasound images. Ultrasound Med. Biol. 2018, 44, 134–152. [Google Scholar] [CrossRef] [Green Version]
  42. Chee, A.J.Y.; Yiu, B.Y.S.; Ho, C.K.; Yu, A.C.H. Arterial phantoms with regional variations in wall stiffness and thickness. Ultrasound Med. Biol. 2018, 44, 872–883. [Google Scholar] [CrossRef]
  43. Jensen, J.; Villagomez Hoyos, C.A.; Stuart, M.B.; Ewertsen, C.; Nielsen, M.B.; Jensen, J.A. Fast plane wave 2-d vector flow imaging using transverse oscillation and directional beamforming. IEEE Trans. Ultrason. Ferroelectr. Freq. Control. 2017, 64, 1050–1062. [Google Scholar] [CrossRef] [Green Version]
  44. Polak, J.F.; Alessi-Chinetti, J.M.; Kremkau, F.W. Doppler velocity estimates of internal carotid artery stenosis: Angle correction parallel to the color Doppler lumen versus parallel to the artery wall. J. Ultrasound Med. 2019, 38, 3211–3218. [Google Scholar] [CrossRef] [PubMed]
  45. Posada, D.; Poree, J.; Pellissier, A.; Chayer, B.; Tournoux, F.; Cloutier, G.; Garcia, D. Staggered multiple-prf ultrafast color Doppler. IEEE Trans. Med. Imaging 2016, 35, 1510–1521. [Google Scholar] [CrossRef]
  46. Poree, J.; Goudot, G.; Pedreira, O.; Laborie, E.; Khider, L.; Mirault, T.; Messas, E.; Julia, P.; Alsac, J.M.; Tanter, M.; et al. Dealiasing high-frame-rate color Doppler using dual-wavelength processing. IEEE Trans. Ultrason. Ferroelectr. Freq. Control. 2021, 68, 2117–2128. [Google Scholar] [CrossRef]
  47. Zhou, X.; Xia, C.; Khan, F.; Corner, G.A.; Huang, Z.; Hoskins, P.R. Investigation of ultrasound-measured flow rate and wall shear rate in wrist arteries using flow phantoms. Ultrasound Med. Biol. 2016, 42, 815–823. [Google Scholar] [CrossRef] [PubMed] [Green Version]
  48. Fekkes, S.; Saris, A.; Nillesen, M.M.; Menssen, J.; Hansen, H.H.G.; de Korte, C.L. Simultaneous vascular strain and blood vector velocity imaging using high-frequency versus conventional-frequency plane wave ultrasound: A phantom study. IEEE Trans. Ultrason. Ferroelectr. Freq. Control. 2018, 65, 1166–1181. [Google Scholar] [CrossRef]
  49. Park, J.H.; Lee, S.J. Ultrasound deep learning for wall segmentation and near-wall blood flow measurement. IEEE Trans. Ultrason. Ferroelectr. Freq. Control. 2020, 67, 2022–2032. [Google Scholar] [CrossRef] [PubMed]
  50. Dorazil, J.; Repp, R.; Kropfreiter, T.; Pruller, R.; Riha, K.; Hlawatsch, F. Tracking carotid artery wall motion using an unscented Kalman filter and data fusion. IEEE Access 2020, 8, 222506–222519. [Google Scholar] [CrossRef]
  51. Tang, M.X.; Mulvana, H.; Gauthier, T.; Lim, A.K.; Cosgrove, D.O.; Eckersley, R.J.; Stride, E. Quantitative contrast-enhanced ultrasound imaging: A review of sources of variability. Interface Focus 2011, 1, 520–539. [Google Scholar] [CrossRef]
  52. Timofeeva, M.; Ooi, A.; Poon, E.K.W.; Barlis, P. Numerical simulation of the blood flow through the coronary artery stenosis: Effects of varying eccentricity. Comput. Biol. Med. 2022, 146, 105672. [Google Scholar] [CrossRef]
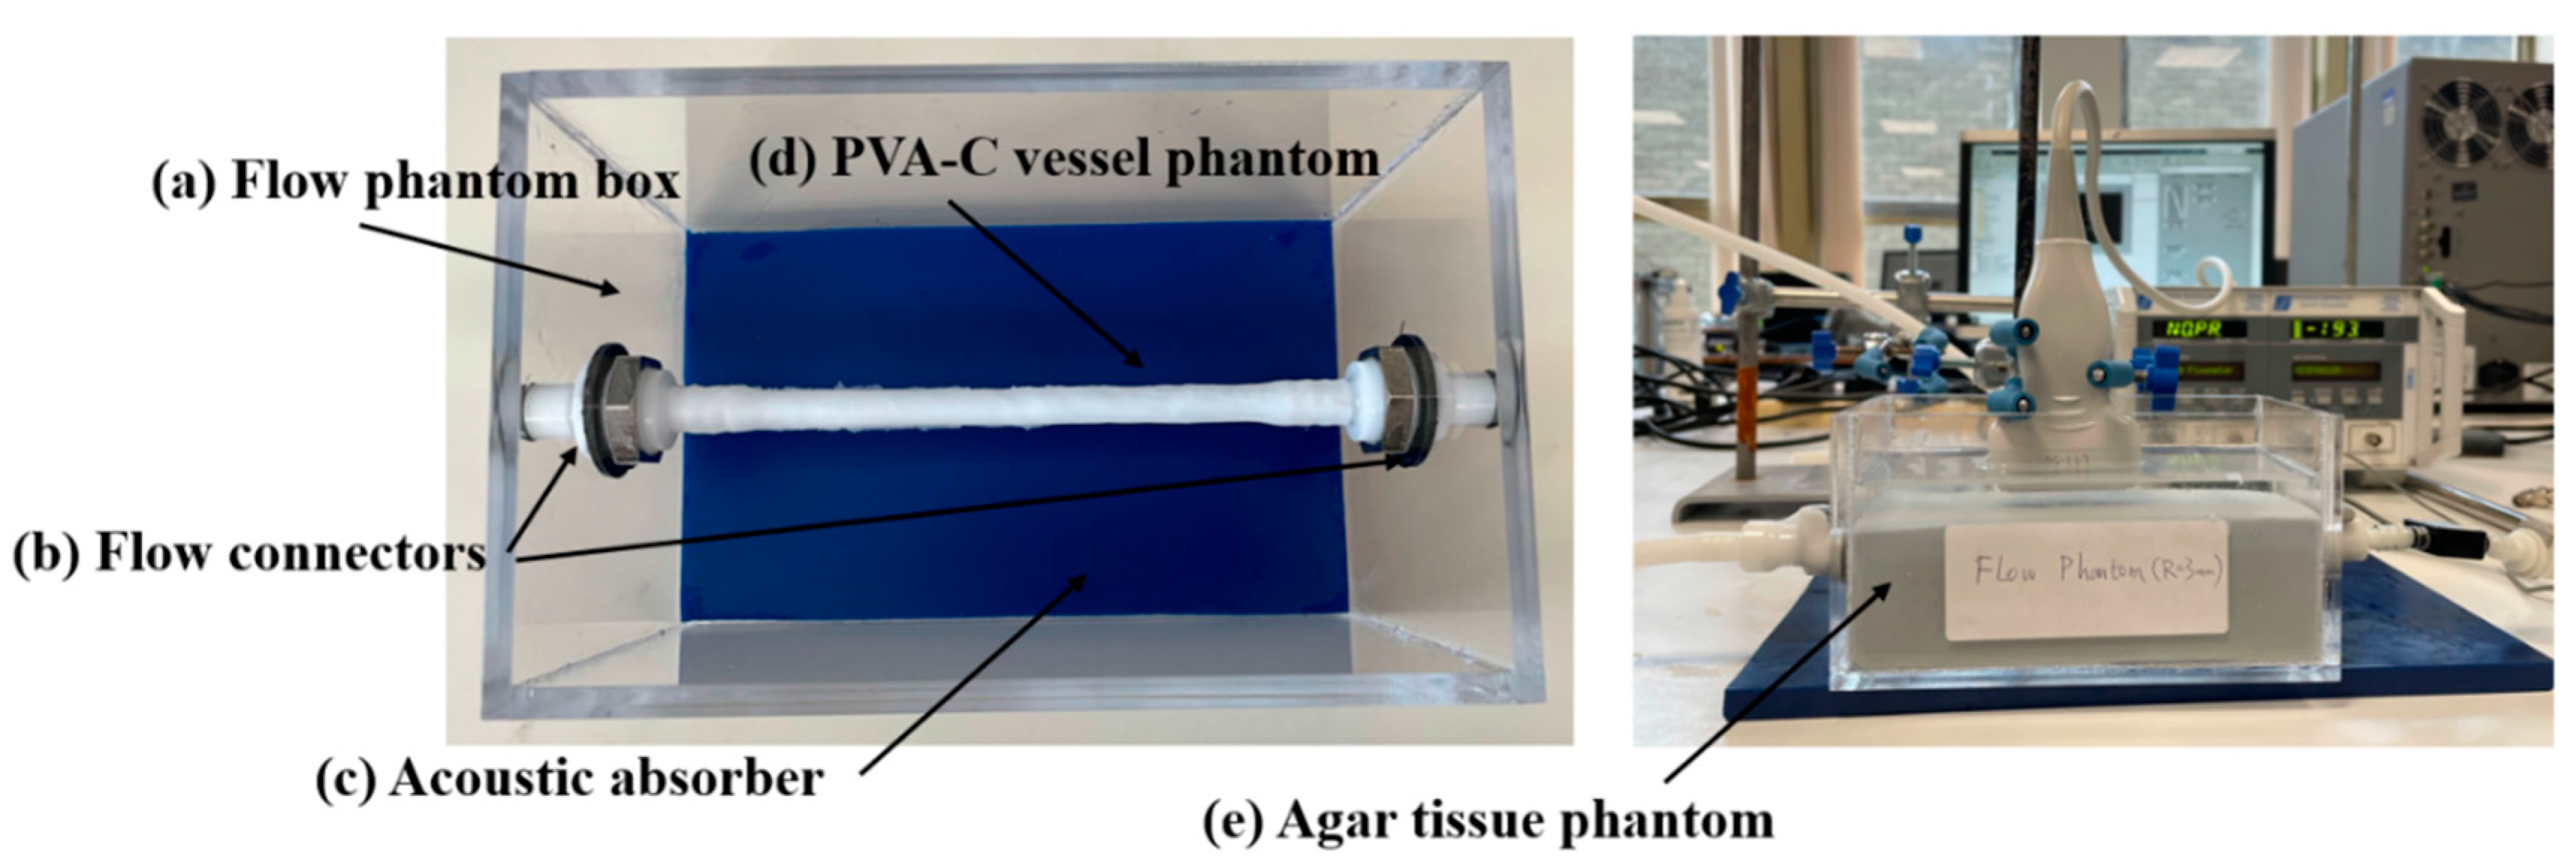
Figure 1. The fabricated flow phantom.
Applsci 13 00617 g001
Figure 2. Stenosis shape with degrees of stenosis of 0%, 20%, 40%, and 60%.
Applsci 13 00617 g002
Figure 3. A schematic of the experimental setup. The flow phantom was connected to the flow circuit to allow the circulation of the BMF. A Verasonics Vantage 128 system with an L11-5v probe was used to scan the flow phantom. (The green, red, and purple dashed rectangles represent the positions of the pre-stenotic region, stenotic region, and post-stenotic region.)
Applsci 13 00617 g003
Figure 4. Typical velocity vectors and WSS mapping of simulation.
Applsci 13 00617 g004
Figure 5. B-mode images of fabricated CA phantoms: (a) 0% stenosis, (b) 20% stenosis, (c) 40% stenosis, and (d) 60% stenosis. The scale bar on the right indicates the intensity (dB).
Applsci 13 00617 g005
Figure 6. The velocity vector and WSS map of simulation with a centreline velocity of 0.2 m · s - 1 .
Applsci 13 00617 g006
Figure 7. The velocity vectors and WSS maps imposed on B-mode images of flow phantoms in steady-flow experiment with 200   mL · min - 1 : (ad) 0%, 20%, 40%, and 60% degrees of stenosis.
Applsci 13 00617 g007
Figure 8. Mean WSS measured in stenotic regions with different degrees of stenosis under different flow rates: (af) 50 mL/min–300 mL/min. The vertical bar represents ±1 standard deviation.
Applsci 13 00617 g008
Figure 9. Maximum WSS in the flow phantoms with different degrees of stenosis under different flow rates. The vertical bar represents ±1 standard deviation.
Applsci 13 00617 g009
Figure 10. The velocity vectors and WSS maps in the pulsatile flow experiment with 0% stenosis (a), 20% stenosis (b), 40% stenosis (c), and 60% stenosis (d). (e) WSS variations in the ROI (indicated by red circles in (ad)) during the cardiac cycle.
Applsci 13 00617 g010
Table 1. Parameters used in simulation and experiment.
ParametersSimulationExperiment
ProbeN/AL11-5v
Steering angle−10°, 0, 10°−10°, 0, 10°
Transmission frequency6.25 MHz6.25 MHz
Number of elements128128
Number of transmit/receive elements128128
PRF10 kHz10 kHz
Sampling frequency50 MHz25 MHz
Pulse length2.5 cycles2.5 cycles
Disclaimer/Publisher’s Note: The statements, opinions and data contained in all publications are solely those of the individual author(s) and contributor(s) and not of MDPI and/or the editor(s). MDPI and/or the editor(s) disclaim responsibility for any injury to people or property resulting from any ideas, methods, instructions or products referred to in the content.