Abstract
Remote working is increasingly seen as an effective model in several countries in the last decade, mainly thanks to the development of information and communication technologies in support of common daily working tasks. The emergence of the COVID-19 pandemic has represented a pivotal moment for the adoption of remote working in multiple sectors, with positive effects on the environmental impacts caused by the daily commuting of workers. However, due to the fact that pandemic-induced remote working has represented a major forced experiment on a global scale, and that it has often been imposed rather than chosen by employees, workers’ well-being has not always been ensured. This research work presents an analysis of a wide survey of remote workers in public administrations in four different provinces in Italy, with the aim of assessing the main characteristics of the users and the related environmental benefits. Survey data refer to remote workers before COVID-19, thus representing workers who have freely chosen to work from home for different reasons. The results of this work represent a useful tool with which to support the definition of new remote work strategies that could help policy makers reduce a part of the systematic mobility demand. We have also calculated average energy and emission savings to provide useful indicators for a preliminary estimation of the potential environmental benefits of remote working. Considering the entire sample of respondents, workers who would have commuted at least partially by car have saved on average 6 kg of CO2 per day thanks to remote working (with an average round-trip commuting distance of approximately 35 km). The current results will be supplemented by the results of a new survey underway, aimed at evaluating the differences of remote working experiences during the emergency response to COVID-19.
1. Introduction
This paper presents the results of a research study to evaluate the potential benefits of remote working on the environmental impacts of urban transport, based on survey data collected in four different Italian cities.
1.1. Remote Working
Remote working has gradually emerged in many sectors as a viable alternative to physically working in an office, allowing for a range of benefits including better work–life balance, greater satisfaction at work, lower time productivity losses due to road congestion, and lower environmental impacts in cities thanks to a decreased mobility demand.
Different terms are used to refer to work performed outside the workplace, with varying degrees of flexibility in terms of location and working hours, and differences in innovation in working arrangements. These include telework, smart work, mobile e-work, and ICT-based mobile work. In the following, the term remote work will be used as a generic term for work carried out away from the company premises. Teleworking is used to refer to forms of remote work in which the work is carried out in a place other than the company headquarters (typically at the employee’s home) following a traditional organisation of work and activities. The main objective of this approach is to enable employees to work remotely, in order to meet needs related to special conditions (disability, even temporary, care of small children or other family members) and to improve the quality of life and work–life balance. Smart working, on the other hand, is characterised by a new way of organising work, in which activities are organised with high levels of autonomy and responsibility for results, flexibility in working hours and location and openness to continuous change. This is a paradigm shift that requires a radical transformation at both the organisational and cultural level. The introduction of forms of smart working (also called lavoro agile in Italy) in public administration in Italy has not always been accompanied by an adequate evolution of the organisation of work, especially in the case of smart working activated in an emergency form as a response to the need to contain the COVID-19 pandemic and provide services and carry out work activities. Thus, in the following, the term “remote working” will be used rather than smart working.
The organisational aspects of the different forms of remote working and their impacts on the quality of work, well-being, and the different dimensions involved at a social and urban development level are being studied across disciplines.
Several studies have addressed the social and organisational benefits of remote working through digital technologies that offer workers flexibility with regard to where and when they work [1,2,3,4]. Eurofound suggests that remote access to communication systems ensures that workers can exchange information with colleagues and managers [3,4], promoting innovation in the form of organisational change, flexibility, online learning, and new forms of cooperation. Work–family conflicts arise when the worker is unable to cope with family or work pressure [5]. Remote working affects work–life balance by helping to reduce stress, burnout, depression or other psychosocial risks at work. The level of worker autonomy reduces stress and increases performance and productivity [6,7,8]. The effect of uncoupling the organization of work from traditionally fixed times and places can be a key factor that can lead to multiple effects not only on the quality of life, but also on the environment in general, in terms of both direct impact and rural and urban development. Remote working can trigger a range of related changes, enabling a wider adoption of sustainable, user-centered models for mobility, urban design, housing planning, and land use. A discussion of the relationship between remote work, territorial development, and urban mobility is discussed in [9].
Only in recent years has the impact of remote work on the environment been analysed, both in terms of climate and local pollution. In a study summarising 39 empirical studies on teleworking, Ref. [10] states that there is a lack of consensus on the energy and environmental benefits of working from home. Some recent studies have also considered the specific context of Italy [11,12]. Looking at the four domains of transport, office buildings, housing, and ICT, Ref. [13] identified rebound effects that reduce some of the benefits of teleworking. These uncertainties and complexities are due to the variety of contexts and research methods in the different studies, as well as the different spatial and temporal scope that may profoundly influence some behavioural choices.
Indeed, smart working is an important driver of change. It has emerged in the context of work organisation, but has shown the ability to expand its effects to multiple contexts, from welfare to gender policies, from urban mobility to the transformation of urban layouts, to the repopulation of peripheral and remote areas. Starting from the transformation of the organisation of work activity—a pivotal element in the life of the urban community and in the organisation of the city—there is the possibility of setting up integrated policies capable of contributing to the development of cities by significantly affecting the economy of the territories and, in particular, the demand for mobility.
Important developments on environmental issues are expected from the numerous investigations conducted during the COVID-19 pandemic. The adoption of compulsory work-from-home schemes following the COVID-19 emergency measures created the condition of a global, though forced, experiment in remote working. It must be said that the experience of moving work activities to homes during the COVID-19 period has nothing to do with remote working and with the various forms it has taken over the years. That is due above all to the nonvoluntary nature of the work organization during the emergency that often determined unfavourable conditions, especially for women, in the way work activities were carried out [14].
1.2. The Environmental Impacts of Urban Transport
Transport is one of the economic sectors exerting the greatest pressure on environmental and natural resources. The decoupling of transport growth from economic growth and modal rebalancing are among the qualifying objectives for sustainable mobility.
The environmental indicators used to assess the status and trend of the transport sector include energy consumption, greenhouse gas emissions (carbon dioxide, methane and nitrous oxide), atmospheric pollutant emissions (nitrogen oxides, non-methane volatile organic compounds, particulate matter, lead, benzene and sulphur oxides), and the share of the vehicle fleet complying with certain emission standards. Another key indicator is the demand and intensity of passenger transport, which measures the demand for passenger transport (broken down by the different modes of transport) and its intensity also in relation to economic growth trends.
In Europe, the transport sector is responsible for almost a third of final energy consumption and about a quarter of total greenhouse gas emissions [15]. In 2018, the energy used for transport (considering road, rail, maritime, and aviation) was 393,143 ktoe, corresponding to 28% of final consumption (authors’ calculation from [16]). Road transport, in particular, is responsible for the largest share of energy consumption in the transport sector. In the 27 EU Member States (EU-27), it accounted for about 93% of total demand in 2019, excluding international aviation and maritime transport, an increase of about 34% since 1990 (authors’ calculation from Eurostat data, available in [17]). Regarding greenhouse gases (GHG) emissions, transport is, together with energy industries, the most responsible emitting sector. From 1990 to 2019 in the EU-28 countries, GHG emissions from the transport sector increased by 20.3%, although they decreased in the period 2008–2013.
Comparable figures apply to Italy. The transport sector was responsible for 25.2% of total national GHG emissions in 2019 [15], of which, excluding international aviation and international shipping, 92.6% are from road transport. Specifically, 68.7% of national GHG emissions came from passenger cars, 15.4% from heavy duty vehicles, 10% from light commercial vehicles, 3.3% from buses, 2.6% from motorbikes and 0.3% from mopeds. Road transport in 2019 was also responsible for 40.3% of nitrogen oxides emissions, 11.4% of NMVOC emissions, 10.1% of PM2.5 fine particulate emissions, and 18.7% of carbon monoxide emissions over the total emitted in Italy [15,18]. However, it is important to remember that although carbon emissions cause the same damage no matter where (and when, to a certain extent) they are emitted, the place and time of local pollutants emissions is crucial. The emission of pollutants in high-density urban environments is thus even more harmful.
Over the period 1995–2019, passenger transport demand increased by 17.4% in Italy, with more than 90% road transport in 2019, predominantly met by individual transport (cars and motorbikes) [15,18]. In 2018, cars accounted for 76.5% of the modal split of passenger-km, compared to 5.7% use of rail and 10.9% of buses [19])+. The motorisation index in Italy is also very high, with 666 cars per 1000 inhabitants in 2020 [20], the second-highest among EU countries after Luxembourg. On the basis of available data [21,22], we estimate that in 2019, 42.1% and 94.5% of the consumption of diesel and petrol, respectively, is due to passenger cars, which account for 68.9% of road consumption, with approximately 410,000 million vehicle-km, representing 80.8% of the total.
After reaching its highest level around 2007, the evolution of passenger transport intensity (which is measured as passengers per kilometre in relation to population) in Italy had sharp reductions in 2011–2012 due to the economic crisis in those years and a subsequent increase between 2013 and 2016. In 2017 it reached the value recorded in 2009, also maintained in 2019 after a slight decrease in 2018. In 2020 and 2021, the pandemic caused a contraction in transport demand, with a reduction of 36.4% in 2020 compared to 2019, while at the same time showing an increase in the percentage of individual road transport use. However, it is still not clear if this will have medium- and long-term effects on national transport emissions [23].
Motorized road transport is responsible for various effects on society, human habits and behaviour. In addition to being responsible for local and global environmental impacts, it generates negative externalities, including health issues, road damage, accidents, congestion, poor quality of life, noise, etc. Furthermore, the expansion of the modal share of road transport has mitigated the progress achieved through technological improvements and infrastructural interventions, in terms of reducing environmental impacts and increasing transport safety. As far as energy consumption is concerned, the increase in the energy efficiency of vehicles has not offset the effects of the growing demand for transport, and total energy consumption by road grew by 1.9% in the period 1990–2017. The recent phenomena related to the pandemic and the conflict in Ukraine have introduced new variables that make it even more urgent to define integrated policies to implement sustainable mobility models through the use of technological and nontechnological measures.
1.3. Policies and Measures
In application of the subsidiarity principle, urban mobility in Europe is managed at the level of individual states, and there are no EU regulations or directives regulating it. However, due to the relevance of the issue, the Commission has drafted several strategy papers and allocated considerable financial resources to urban mobility [24,25,26,27,28,29]. However, the environmental problem persists both at the general level—in terms of increased greenhouse gas emissions, loss of biodiversity, and growth in energy demand—and at the urban level, together with the effects of congestion, pollution and land take [30,31]. The effects of awareness-raising, education, and training pathways are also limited. Although essential for building awareness of environmental and social issues, they take a long time to develop and produce effects in some groups of the population, but do not seem effective in changing habits on a large scale. At all levels, there is then a constant increase in social gaps and inequalities and the increasingly marginal spaces of participation available to the population [32,33,34,35]. The role of individual behaviour is considered crucial to achieve concrete sustainability goals in all environmental domains [36,37]. So far, however, governing collective behaviour has relied almost exclusively on command-and-control or economic incentive/disincentive systems. In the transport sector, the prevailing direction has been toward replacing in-use vehicles with vehicles with a lower environmental impact and promoting the use of public or collective transport. The limitations of the two approaches are reflected in the data [38].
The dependence on car use and the increasing decentralisation of cities are processes that are difficult to reverse [39]. Home-work commuting, in terms of number and prevalent mode of travel, is among the main pressures in large and medium-sized urban areas [20,40,41].
The vast majority of mobility and transport solutions adopted so far in urban areas can be traced back to two of the three pillars of the avoid, shift, improve (ASI) strategy [42] adopted by EEA and UNEP. The first pillar, which aims to avoid or reduce demand formation for passenger and freight transport, which has played a very marginal role, is an exemplary field of action for the type of approach proposed here, to which high margins for low-cost intervention can be associated.
The limitations shown by interventions put in place so far highlight the need for policies to acquire the ability to read contexts and influence the sociotechnical patterns that determine people’s lifestyles and behavioural models. By triggering innovations that are at once technical, organisational, and cultural, it is indeed possible to achieve changes in behavioural patterns, on a large scale, and orient them in favour of the community [43].
This paper intends to provide useful data and analysis to contribute to the development of new urban policy tools to support sustainable mobility models. The manuscript makes use of the results of the first Italian survey on distance working experiences in public administration and public institutions. Fuel consumption and emission reductions are estimated on the basis of real data provided by workers on mobility characteristics, instead of national average data on commuting habits. The survey was in fact specifically aimed at analysing the main dimensions affected by remote work: work organisation, experiences and level of satisfaction of workers at professional and personal levels, and mobility habits and their impacts. The detail of the information collected on this last dimension and the development of a methodology for the estimation of energy consumption and emissions, represent an innovative contribution to the understanding of the characteristics of home-work mobility and its impacts.
The results of a survey conducted in four Italian cities are analysed to examine how, by operating a radical innovation in work organisation, it is possible to affect mobility patterns related to urban commuting, resulting in energy and emissions savings and other benefits for individuals and the urban society.
2. Materials and Methods
To investigate the changes produced by the new models of work organization on the quality of life and urban sustainability, the research project “Smartwoking for Smart Cities” was started in ENEA in 2013. In this framework, an analysis involving 29 administrations and public bodies in Italy was started in 2014. This included 16 entities among regions, local authorities, and agencies/territorial agencies [8]. The analysis involved both employees and employers (management structures, personnel administration and other services concerned). The investigation aimed at collecting quantitative and qualitative data in the period from 2015–2018. A survey was conducted by means of an online questionnaire, addressed to employees who teleworked and/or worked remotely in the years 2015 to 2018. Guided interviews were conducted with the heads of human resources department of the administrations. The interviews investigated the genesis, processes and organisational arrangements adopted to introduce teleworking and smart working. The research covered three main areas: (a) the individual dimension of the worker, (b) the organisational dimension of the work activity, and (c) the collective dimension. At the individual level, the following aspects were explored: the family and personal environment, the system of relationships, the characteristics of work activity, demand and mobility habits. With regard to the organisational dimension, the stages of development and dissemination of teleworking and agile working arrangements within administrations and public bodies were analysed, as well as the organisational arrangements adopted. On a collective level, the potential for reducing fuel consumption and emissions of greenhouse gases, macropollutants and micropollutants due to workers’ different mobility habits were estimated.
This paper focuses on the responses to the survey given by the employees working in four cities (Bologna, Roma, Torino, Trento) who worked remotely in the period 2015–2018. This four-year period is representative of the phase of the implementation of remote work policies in the public administration sector in Italy, consisting mainly of telework and in a marginal share, especially from 2018 onward, of smart working.
The research work aimed at investigating the implementation of smart working policies in the period starting from 2019 was interrupted by the COVID-19 pandemic, and by the adoption of emergency measures in work activities. Remote work done from home during the period of the COVID-19 emergency cannot be considered to all intents and purposes as a form of smart working, agile working or teleworking, as it lacks some basic elements that characterize the flexible organization of remote work, such as voluntariness, agreed definition of work tools and objectives, and the absence of constraints in the times and places of carrying out activities. Rather, people experienced a situation of “working from home” under forced conditions and often using unsuitable home spaces shared with other members of the household.
During the COVID-19 emergency, the number of people in remote work is estimated to have reached a total of 6.6 million people in the worst phases of the pandemic, more than ten times the 0.57 million recorded in 2019 [44]. This provided a strong impetus for the development of new, flexible and results-oriented work organization models. Experiences from the pre-pandemic period can be extremely valuable to complement those gathered from 2020 and draw useful information and support decisions for the post-pandemic period.
The analyses presented in this paper represent a useful tool with which to support the definition of new remote working policies. They will be complemented by the results of a new survey currently being carried out, aimed at assessing the experiences of “forced” distance working experienced during the various phases of the COVID-19 and the new arrangements.
2.1. Survey
The survey at the basis of this work was implemented in Google Forms, the survey administration software included as part of the web-based Google Docs Editors suite by Google. It was designed to be filled in by employees who spent at least one period in remote work (teleworking or smart working) in the period 2015–2018. The survey, available in [8], consists of five main sections:
- personal information: gender, education and title, age, professional qualification and seniority, family unit, institution of affiliation;
- experience during 2015–2018: remote working mode and organization, reasons for choice, ICT expertise, training provided;
- home-work mobility: modes of transport, reasons for choice, daily commuting times, daily commuting distance;
- use of own motorized vehicle: commuting distance, type of route, power train, engine size, technology; and
- organization of remote work: characteristics of remote work (days at office), ICT used, time management (time for self and family, work-life time interference), relationships with colleagues and managers, quality of work, satisfaction, autonomy, distances and modes of travel for daily needs, overall evaluation of the experience.
The data collected in Section 3 and Section 4 are used to analyse mobility patterns and habits and to estimate energy and emissions savings due to the commuting travels avoided thanks to remote working. They include modes of transport (foot/bike, public transport and train, private car as driver, private car as passenger, two-wheeler, company collective transport, other) and, for respondents who indicated that they use their own vehicle (car or two-wheeler) the following:
- characteristics of the route travelled by private motorized vehicle: number of kilometers, type of route (urban, rural, mixed), time;
- characteristics of the two-wheeler: engine size (two-stroke < 50 , four-stroke < 250 , four-stroke 250–750 , four-stroke > 750 ), technology (EURO class);
- characteristics of the private car: powertrain/fuel (petrol, diesel, LPG, CNG, hybrid-eletric, electric, other), engine capacity range (mini < 0.8 L, Small 0.8–1.4 L, Medium 1.4–2 L, Large-SUV-Executive > 2 L), technology (EURO class).
The responses were organized in a database. Data were pre-processed to exclude anomalies and errors due to an incorrect compilation of the survey. Following consistency checks, 3387 records were deemed valid and analyzed by using Microsoft Excel [45] and the software environment for statistical computing and graphics R [46]. A computational methodology was developed for estimating fuel consumption and emissions avoided during remote work days, shown in Section 2.2.
2.2. Methodology for the Estimation of Energy Consumption and Emissions
The factors used in the calculations are taken from the database of average emission factors for road transport in Italy created by ISPRA [47] in accordance with the updated COPERT estimation model version 5.1.1. and the EMEP/EEA Air Pollutant Emission Inventory Guidebook [48]. For the present work, emission factors for the year 2016 were used for the following categories: greenhouse gases: carbon dioxide (CO2), methane (CH4) and nitrous oxide (N2O); macropollutants: carbon monoxide (CO), nitrogen oxides (NOx) as the sum of nitrogen monoxide (NO), and nitrogen dioxide (NO2), particulate matter (PM), benzene and nonmethane volatile organic compounds (NMVOC); micropollutants: metals, polycyclic aromatic hydrocarbons (PAH) and benzo-pyrene (BaP); and fuel consumption. With regard to particulate emission factors, PM10 and PM2.5 were used. Both estimate both particulate matter from combustion (exhaust), which is almost entirely made up of particles smaller than 2.5 µm, and that from tire wear, vehicle brakes and road surface abrasion (nonexhaust). The same was done for the estimation of metals. Emissions of nonmethane volatile organic compounds from petrol vehicles include evaporative emissions in addition to exhaust. COPERT fuel consumption emission factors refer to energy consumption and are expressed in MJ/km. The litres of fuel consumed were calculated by using the density values and calorific value from [48]. The Global Warming Potential Values from the IPCC Fifth Assessment Report, 2014 (AR5) [49] were used to convert methane and nitrous oxide into CO2 equivalent.
The equation to calculate the emissions is
where represents the emitted quantity of pollutant i, n is the number of respondents in the sample, is the pollutant emission factor by fuel, size, abatement technology and type of route (urban, rural, total, mixed), km are the kilometers driven per day, and d are the days worked remotely.
The described procedure and the specific emission factors [47] are applied to all complete records, which provide all the data requested in Section 3 and Section 4 of the questionnaire. In cases in which respondents have omitted some of the required information, equivalent factors are applied according to the following criteria in the absence of specifications on vehicle technology, emission factors referring to the 2016 national average fleet of passenger vehicles by fuel type are used: in the absence of information on engine capacity, the COPERT value for the particular type of fuel used is considered; in cases in which the fuel type is also omitted, emission factors referring to the 2016 national average passenger vehicle fleet are used; in the absence of information on the type of journey, it is considered mixed; in the absence of the specific number of kilometres travelled with the vehicle, the arithmetic average between the extremes of the kilometres travelled was used (data requested in the questionnaire regardless of the means of transport used).
3. Case Study
The survey sample is represented by the people whose place of work is located in the provinces of Turin, Trento, Bologna, and Rome. The reasons for the selection of these four particular provinces are due to their distinct peculiarities, both physical and historical-urban, with reasonable hypotheses of different impacts on urban circulation, and to the high number of responses to the survey 59% of the data are from workers from the four cities, specifically 18.7% from Bologna, 12.2% from Rome, 12.4% from Trento, and 15.6% from Turin)
Rome is the biggest city in Italy, both in terms of population, with 2.8 million inhabitants (the double of the second, Milan), and surface, with almost 1300 square km (again the double of the second, Ravenna). Its density is around 2150 inhabitants/km². Rome is also the eighth-largest city in Europe in terms of population, just below Madrid and Kyiv and above Bucharest and Paris. Rome shows a very important level of congestion, especially on the ring roads and consular radial roads. Daily commuting in Rome is influenced by the concentration of work opportunities in certain areas of the city. Rome is in fact characterised by a medium-low degree of spatial decentralisation of functions in the city [50]. It is estimated that the number of people not resident in the city of Rome who travel daily exclusively for work and study is 420,000 [51]. A large percentage comes from other cities in Regione Lazio and Regione Campania. The road system is characterised by a radial structure [52], with a relevant role played by the ancient Roman consular roads, an uneven degree of accessibility of public transport that tends to degrade from the centre towards the periphery [53], and the dominance of road transport [54]. According to the TomTom index, Rome is the second-most congested city in Italy, with an estimated annual time loss of 82 h per driver [55]. Moreover, important differences exist in the quality of the urban space when comparing the city center, which is very attractive for tourists and is the seat of many offices of public and private companies, with the suburban residential areas. The motorization rate in Rome in 2020 was 645 cars per 1000 inhabitants [56], the fourth highest among large Italian cities.
Turin is the fourth-biggest city in Italy, with 850,000 inhabitants, comparable to other European cities like Amsterdam, Marseille, Kraków, and Valencia. Turin is also in the top list for population density in Italy (considering cities with more than 50,000 inhabitants) with around 6525 inhabitants/km². The motorization rate in Turin in 2020 was 655 cars per 1000 inhabitants [56], an average level for large Italian cities. The city is much relying on private car use, which has been historically prioritized over public transport or active mobility.
Bologna is the seventh-biggest city in Italy, with 390,000 inhabitants, comparable to Tallinn, Iași, Sintra, or Brno. Its population density reaches 2780 inhabitants/km². The motorization rate in Bologna in 2020 was 614 cars per 1000 inhabitants [56], well below the average level for large Italian cities. Bologna will be the first city in Italy to have a speed limit of 30 km/h in almost all the roads within its municipality by June 2023 (with only some large roads allowed up to 50 km/h) [57]. The city is also well known for its high number of bicycle usage, especially within the historical city centre.
Trento is the smallest of the four cities that we analyzed, with around 120,000 inhabitants, and also the one with the lowest population density, 750 inhabitants/km². The official motorization rate in Trento in 2021 was 3.9 cars per inhabitant [56], but this figure is caused by the very high number of rental car registrations, due to favorable fiscal conditions compared to other Italian cities [58].
Considering the key indicators of the four cities [59], the municipalities of Turin, Trento, and Bologna rank much better than Rome in terms of indicators of pedestrian areas, bicycle lanes, interchange car parks and low-emission vehicle fleets. As far as Trento is concerned, there is less use of public transport than the other three cities, with a passenger/inhabitant ratio of less than 200, compared to a ratio of around 300 or more. Despite a fair availability of seats on public transport, the conformation of the municipal territory and the low percentage of coverage can lead to low use of this mode. There is a very good level of infrastructural supply to support sustainable mobility in terms of parking spaces and bicycle lanes. At the same time, however, there is a more car-centred pattern of habits, evidenced by the low level of public transport use and a high rate of motorisation, although characterised by a high share of lower emission vehicles.
The level of accessibility of the public service (represented by the distance on foot, measured in minutes, from the nearest stop) is satisfactory for the aggregates of Turin and Bologna (where it can be judged “high” or “very high” for 88% of the population), whereas for those of Trento and Rome it drops to a much lower level (63% for Trento and 80% for Rome) [60]. Note also the size of the population fraction with a very high level of service in the case of Rome (almost 36%), a figure which is counterbalanced by the incidence of the population served poorly, or not served at all (almost 7%), a suspected indication of a disparity in the degree of distribution of the accessibility of the public service. The evidence that a part of the population living in Rome is not well served by public transport is also confirmed by the figure for the ratio of the distance travelled by public transport to the number of inhabitants. It is very low in Rome compared to the other three cities (10.3 km travelled by public transport per 1000 inhabitants), despite the relatively high number of seats available overall (6883 seats per km travelled per inhabitant).
4. Results
The questionnaire sent to workers in 29 Italian administrations and public bodies (full list available in [8]) who worked remotely for at least one period in the four-year interval 2015-18 was answered by 3397 employee respondents (representing 61% of the target reached by the survey).
A total of 1997 valid answers were received from workers with offices in Bologna (31.8%), Rome (20.6%), Trento (21.1%), and Turin (26.5%). In each of the territories, more than 95% of the offices are located in the main municipality of the province, and the remainder in municipalities that are situated almost exclusively within the territory of metropolitan cities. It is worth noting that in Italy metropolitan cities have replaced provinces as local territorial authorities in vast areas, following the implementation of Law No. 56 Art. 1 of 7 April 2014.
Regarding the demographic composition, the total sample is mainly composed of women, 73.7% of the total, and the sample has a rather high average age of 54% of the total is in the over-50 age group, which substantially reflects the demographic data of employees in the Italian public administration in the period considered [61]. The median age group drops to 45–49 years for those who work in the province of Trento. The median number of family members in the household is 3. Just over half of the sample (52%) declares to have children of school age, and about two-fifths of the sample (42%) declares to have family members in need of assistance. The relatively high incidence of family care needs observed in the sample, especially for teleworking, is an indication of the subjective factors driving the demand for activation of the remote-working mode.
4.1. Mobility Habits
Fifty percent of the people in the sample travel around 30 km daily, with a median duration of 1 h and 20 min. The presence of workers travelling long home-work distances is significant, with around 12% of respondents travelling more than 100 km. As far as gender is concerned, a tendency toward greater mobility emerges for men. A total of 30% of them travel more than 70 km daily, compared to a figure of 20% for women, a fact that has been widely confirmed in the empirical literature [62,63].
The analysis of the average speed of circulation of means of transport in the four provinces provides further information indicating the specificity of the territorial contexts. Figure 1 shows 60-min polygons isochrone both related to public transportation and to car generated with the TravelTime plugin to the geographic information software QGIS [64], i.e., a line on each map province joining points together which are all one hour constant time distance away from a starting point. By convention, the outward journey from the surrounding territories to the institutional seat of the town hall of the provincial capital at 8 a.m. on a Wednesday has been selected. In yellow colour are represented the isochrones relative to travel by public transport; in blue are the isochrones relative to travel by car. Affecting the isochrones are the geographical conformation, such as lowland or mountainous environment, the quantity and quality of the road network, and the population density in the urban space. The small size of the polygon is evident for the province of Trento and Rome, both for public transport and for the car. The difficulty of getting around in Trento is largely attributable to the geography corresponding to the Adige Valley, although this is compensated for by the presence of the Brenner motorway line and the railway, a polygon with a particularly elongated shape. The difficulty of circulation in Rome is presumably attributable to the phenomena of conurbation, in the central and semicentral areas, and of urban sprawl, on the outskirts of the province, which is counterpointed by the high incidence of commuting. Furthermore, for Rome and Turin it appears that residents in the municipalities of the first belt can rarely reach the centre in one hour by using public transport. As to travelling by car, Turin and Bologna show a similar structure between them, which would seem to indicate a more fluid circulation.
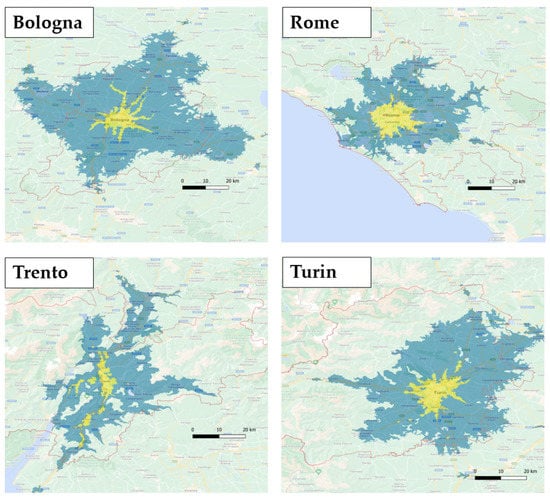
Figure 1.
Isochrones of places that can be reached in 1 h by public transport/train (in yellow) and by car (in blue) in the four cities.
The key mobility figures for workers in the four cities are summarized in Table 1, more detailed indicators are in Table 2 and Table 3.

Table 1.
Key mobility figures for workers in the four cities.
Table 2.
Transport modes in the four cities.
Table 3.
Transport modes and distances - total values for the four cities (Detailed data for the four cities are listed in the Additional Material).
For workers in the provinces of Turin and Bologna, home-work distances are relatively short. A total of 47% of the workers interviewed in Turin and 41% in Bologna travel less than 20 km per day (Figure 2). With the exception of the case of long commuters (relevant for Rome workers) longer distances are recorded for respondents from the province of Trento, where 70% cover between 20 and 100 km per day, compared to 43%, 45%, and 52% in Turin, Bologna, and Rome, respectively. Trento is confirmed as a dispersed city. It is characterised by high average values of home-to-work distances, but at the same time by a low standard deviation of distances, suggesting more similar individual profiles. Rome shows the highest commuting distances, especially taking into account the frequency of those in the highest classes (one in five Rome workers travels more than 100 km a day).
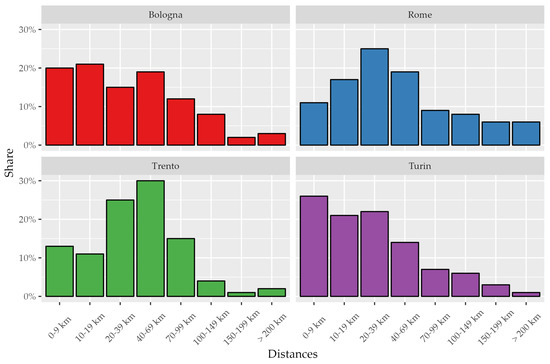
Figure 2.
Daily commuting distance of workers from the survey in the four cities.
As far as daily travel time to and from work is concerned, the average for the overall sample is just over an hour and a half (1 h 35 min). Rome is confirmed as the most critical city, with an average travel time of 2 h, probably due to the longer distances travelled and the more intense traffic conditions. Overall, these data are confirmed in recent literature (see, for example the survey in [65]) and in the results of the analysis of the average speed of circulation of means of transport reported in Figure 1. Daily commutes of more than 2 h are travelled by 11% of workers in Trento, 24% in Bologna and Turin, and 37% in Rome (Figure 3).
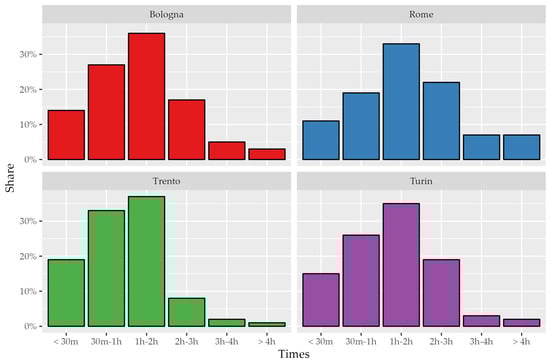
Figure 3.
Daily commuting time of workers from the survey in the four cities.
Almost half of the workers interviewed declare that their travels are exclusively by private means of transport (47% by car and 2% by two-wheeler), while 17% travel exclusively by public transport (including rail transport) and 16% travel by a public/private mix. The exclusive use of soft mobility (walking or cycling) is a much less frequent option (4%), which increases in mixed mode with public or private transport (11%).
Significant differences in the use of private means of transport in an exclusive form (car and two-wheeler) between workers in Trento (62.9%) and Rome (54.4%) can be seen (Table 1 and Table 2). For the former, the high use of private transport is to the detriment of public transport, for the latter to the detriment of soft mobility. Although public transport, with foot/bike, is relatively more used in Turin (29.3%), it is much less so in Trento (14%).
Looking at the data, relations can be observed between distance and choice of home-work mode of travel (Table 3; the data for each city are shown in tables in the additional material). The most sustainable modes are used most at shorter distances. For distances of less than 20 km, 56.6% of the respondents use a combination of soft mobility and public transport, compared to 25.6% in the range 20–70 km, 6.5% in the range 70–100 km, and 11.4% for longer distances. The mixed public/private mode is more frequent to travel longer distances (41.9% in the range 20–70 km, 16.8% in 70–100 km, and 24.8% for more than 100 km). Finally, the tendency to use only car or two-wheeler is greater for respondents who make a daily trip between 20 and 70 km (49.9%); however, even for trips of less than 20 km the use of the latter is significant (33.6%). Three patterns of choice seem to emerge: sustainable modes for short distances, with a presumable incidence of urban and metropolitan bus and tram lines; intermodal for long distances, with a presumable incidence of the train; the car for distances neither too long nor too short. From the data collected in the survey, another strongly discriminating variable seems to be the family variable, about having or not having children of school age [66]. Approximately 20% of those who do not have school-age children use public transport exclusively, compared to approximately 14% of those who do. Similarly, those who have school-age children use the exclusively private mode in 52% of the cases, compared to approximately 47% for those who do not.
The reasons given for mobility choices highlight the centrality of the private vehicle in the management of life time; it is used by 48.7% of workers exclusively and by 75.1% combined with other means, showing different habits across the cities under examination (Table 1). The city with the lowest use of car/two-wheeler is Turin, followed by Bologna.
Private mobility offers flexible solutions in terms of time-saving and autonomy of movement, and is often the easiest solution to certain specific logistical problems (such as inadequate or nonexistent public services, or the need to travel to intermediate destinations, etc.). Public transport, on the other hand, is mainly chosen with a view to saving money or in the event of a shortage of parking spaces.
4.2. Mobility Habits during Remote Working
Table 4 shows the frequencies of usual modes of travel for daily needs in the days of remote work and office work. Cases of exclusive use of modes were considered (n. 1399 workers using in an exclusive way walking/cycling or public or car/two-wheeler). The table represents a transition matrix, in which the cells arranged diagonally represent the number of respondents remaining loyal to the same chosen mode of travel between the period before and during remote work. In contrast, cells outside the diagonal indicate a change in the choice of medium. It can be observed that the choice of private means of transport and soft mobility is confirmed/maintained in the two different work modes in 64.7% and 81% of the cases, respectively. The use of public means of transport, on the other hand, drops dramatically when workers are remote. Only 18.1% of the respondents in fact remain faithful (check the figure in the four provinces). It may also be interesting to assess the environmental effect of remote working by breaking down precisely the category of those who do not prove faithful and change their mobility habits. The number of respondents who previously used sustainable modes of transport (walking/cycling or public transport) and after the introduction of distance working use private transport is a good approximation of an estimate of the rebound effect on habitual travel (8.7%, or 122 persons). A positive effect (environment and urban environment), on the other hand, is given by the share of people who betray private transport in favour of sustainable modes (24.8%, or 347 people). In particular, the use of walking/cycling increases sixfold with the adoption of soft mobility distance working, against a reduction of ¼ in the use of private transport and ¾ in public transport.
Table 4.
Frequencies of the modes of travel for daily needs when working remotely and at office.
In Trento and Rome, the percentage of respondents who make use of public transport while working remotely is even lower (8.8% and 15.5%, respectively). One possible explanation is the low territorial coverage of public transport, as suggested by the analysis of the isochrones (see Figure 1), at least compared to its most direct competitor, the car. In the province of Rome, in fact, even residents in the municipalities that are part of the first belt would take more than 60 min if they used public transport to reach the metropolitan core. Another significant statistic is the increase in the number of respondents resident in Rome who say they exclusively use the bicycle/foot mode during their commute to work, from just 4 to 116 (out of a sample of 412 workers).
4.3. Energy Consumption and Emissions Avoided from Private Vehicles
The methodology described in Section 2.2 was applied to each of the workers who use a private motorised vehicle for at least part of the home-work route, to estimate the energy and emission savings that can be associated to remote working.
A first interesting aspect to highlight is the contribution of the car in multimodal trips, which is often neglected in the literature. In our sample, of the total 1270 workers that used to commute at least partially by car, one-third was using it as part of multimodal combinations. In this case, they travelled on average 21 km per day by car, compared to an average of 43 km for those travelling exclusively by car. This finding suggests that the contribution of car usage as part of a multimodal trip should not be neglected when accounting for total commuting impacts. For this reason, we included also partial car trips in our analysis of avoided emissions.
Table 5 reports some indicators in the four cities for remote workers that would have exclusively or partially used private cars for commute. The average number of days worked remotely per week varies from 1.7 for Trento to 2.8 for Rome, and so do the average distance that would have been travelled by car, from 27.7 km/day in Turin to 40.9 km/day in Trento. Daily avoided carbon dioxide emissions and fuel consumption also vary accordingly.
Table 5.
Selected average indicators for remote workers travelling exclusively or partially by car for each city.
Considering the entire sample of the four cities, the average respondent that commutes at least partially by car works remotely 2.1 days per week, avoiding approximately 35 km per day of car travel, which in turn leads to 6 kg/day of CO2 emissions savings and 85 MJ/day of fuel savings. Considering average annual figures, based on 48 working weeks (to account for holidays), each remote worker saves around 600 kg of CO2 emissions and 8.6 GJ of fuel.
The CO2 emission estimates per capita for the workers commuting partially or exclusively by private cars can be extended to the entire group of respondents, to compare average figures with the literature. In the cities considered in this study, each remote worker leads to an average emissions saving of 3.8 kg of CO2 per day. This remains a conservative estimation, because only emissions of private transport means have been computed. A study for the US [67] estimated that approximately 3.9 million Americans telecommuted in 2014 and that telecommuters saved between 17 and 23 kg of CO2 emissions a day. The higher values for the US context are often explained by average longer commuting routes and higher specific emissions due to higher car sizes and lower efficiency.
A recent study by the International Energy Agency [68] estimates the net CO2 emissions savings from remote working in different areas, including both transport savings and additional household energy consumption. The average daily net CO2 emission savings are around 4.9 to 6.0 kg/day in the United States, in winter and summer respectively, and 3.1 to 4.9 in the European Union in the same seasons. The study also remarks that the average one-way commute is 18 km in the US and 15 km in the EU, and that the average car in the US consumes around 45% more fuel than the average in the EU for a trip of the same length. Thus, the results of this study for CO2 emission savings are comparable to those found in the literature.
The data used in this work are a selection of a larger dataset collected during an ENEA survey of the public administration. The dataset shows considerable variability in the calculation of avoided emissions, which deserves an explanation. The key concept to understand to interpret the savings data is the variability of the configurations that the variables used can assume. The amount of km travelled, the type of route, and the vehicle parameters generate a significant variability of the results. The results of our study are appreciably close to those of the reference study. Our methodology, as shown in the graph, can produce strong variability in the average daily data of CO2 saved among samples, and considering the inevitable inhomogeneities between the used sample, the results show good agreement with Burrell.
An alternative aggregation can be performed on the kind of fuel or technology, as reported in Table 6. The results highlight the different average distances based on the type of fuel. Although two-wheelers are generally chosen for short distances (although the absolute number of people is very low and may not be statistically significant), it is interesting to remark that petrol and hybrid cars show shorter distances compared to the other three fuels (i.e. diesel, CNG, and LPG). These fuels are in fact often chosen by people travelling on average longer distances, because they show a the higher upfront investment cost and lower fuel costs, representing an advantage for users with high annual mileage. Higher average distances for the workers with these cars also lead to higher daily emission and fuel savings when they opt for remote working.
Table 6.
Selected average indicators for remote workers travelling exclusively or partially by car for each fuel.
In addition to GHG emissions, an estimation of the total emissions of several local pollutants has been performed. The main pollutants are reported in Table 7. As already mentioned in the methodology section, it is important to remember that the actual damage of local pollutants is related to their dispersion in the surrounding atmosphere and their concentration in the air. For this reason, the total amount of pollutant emissions can only provide a preliminary indication, but more precise analyses would be needed to estimate the actual damage to the affected population, as well as a meaningful comparison across the cities considered in this study.
Table 7.
Selected average avoided daily pollutant emissions per capita for remote workers travelling exclusively or partially by car for each city.
5. Discussion
In the territorial contexts analysed, some of the different aspects that characterise the demand for mobility emerge. The choice of means of transport does not only reflect an individual preference, linked to cultural and psychological aspects, but is also linked to the characteristics of the urban environment and the work context. The analysis shows the positive effects, in terms of reduction of energy consumption and emission of pollutants with local and global effects, resulting from the reduced use of cars and two-wheelers. Further benefits are expected on an urban and local scale due to reduced road congestion at peak times and lower traffic levels (with consequent effects on noise, accidents, and others).
A preliminary analysis of the effects of remote working on mobility for daily needs suggests a shift in behavior toward active modes, at the expense of public transportation and car use. The rebound effects due to a possible increase in car/two-wheel miles traveled as a result of the adoption of remote working require dedicated analyses in order to assess the impacts locally and globally and on the urban environment. Analyses will need to consider daily commuting and leisure travel, including weekends. The limitations shown by interventions put in place so far to reduce the negative impacts of transport highlight the need for policies to acquire the ability to read contexts and influence the sociotechnical patterns that determine people’s lifestyles and behavioural models (e.g., school-age children, parking places, public transport). By triggering innovations that are at once technical, organisational, and cultural, it is indeed possible to achieve changes in behavioural patterns, on a large scale, and orient them in favour of the community [43]. Reorganising the logic of home-to-work travel appears to be a relevant issue in the restructuring of urban areas and the development and use of urban peripheries and the development of rural areas. Some positive effects of smart working in urban suburbs have already been highlighted through studies on urban regeneration [69]. Livable mixed-use functional and social neighbourhoods (a form of development that combines residential and commercial use and provides services at the neighbourhood, block and building level to ensure proximity to services in residential areas) are an efficient and functional method of renewal and use of urban areas [70,71]. Renovation projects with mixed-use neighbourhoods can attract more people if smart working approaches become a common practice, also allowing for “soft” mobility options at the city/neighbourhood level. Such solutions have been developed in recent initiatives in several European cities (15-min cities, Spanish city blocks). The studies conducted within the Smart Working for Smart Cities Project indicate the need for coordinated and integrated policy actions, in which technological measures (technological innovation and infrastructure) are combined with measures to accompany behavioural change, consistent with the specific needs of workers and family groups in the territories under examination. The adoption of flexible models of remote working represents a valuable tool for improving the sustainability of the urban environment and territories.
The findings of this study are relevant for the specific case studies that have been considered, but they are affected by some limitations when extrapolating the results to other contexts. The first aspect to be highlighted is the fact that they are related to a pre-pandemic situation, in which remote working was not seen as a common opportunity but rather limited to workers that had specific needs. An update of this study, which is currently being done, may provide additional insights about the differences that have arisen after the forced COVID-19 remote working models. Another limitation is related to the fact that remote working was chosen by a limited number of employees, which may not reflect the average characteristics of the workforce. Thus, when estimating the potential broader impact of increasing remote working share it is important to analyze specific aspects, including the average distance from home to office, the transport mode that is being used and the specific technology. Finally, it should be borne in mind that the results on consumption and avoided emissions presented in this paper do not take into account, being calculated for the period 2015–2018, the evolution of the characteristics of the average vehicle fleet and the use of electric vehicles, both cars and electric bicycles and scooters. Similarly, in some cases the authors have used average figures for the vehicle characteristics due to the impossibility of having all of the required technical information from the survey.
6. Conclusions
This paper presents the results of a survey focused on public employees that have chosen remote working in four Italian large cities. In these cities, 71% of workers would have travelled by car, exclusively or in combination with other modes. The variables most capable of influencing travel choices, and in particular the probability of using private vehicles, are to be found in (a) home-to-work distance, though with no linear dependence; (b) in the characteristics of the province of belonging, e.g., transport opportunities, urban spread; (c) in the family situation, in particular having children of school age.
The intensity of the use of private vehicles, in fact, proves to be higher at intermediate distances, between 20 and 70 km (considering round trips). At the shorter distances (less than 20 km per day, for round trip) and at the higher ones (more than 70 km) the preference for the private vehicle as exclusive mode decreases, especially to the advantage of the mixed public/private mode. As for the province of belonging, in the design of the research this acts as a proxy of the exogenous context, both physical and social, and highlights how the cities of Turin and Bologna are characterized by a lower tendency to use private vehicles compared to Trento and Rome.
The evidence conveys the idea of a partial rebound effect, with decreasing commuting compensated by greater proximity mobility, with a modal distribution more in favor of sustainability, in particular of active modes. The center of gravity of habitual movements tends to shift, especially in metropolitan areas, with greater gravitation within one’s neighborhood. That the neighborhood becomes a more lived-in space is undoubtedly a positive element, not only for environmental sustainability but also for the social, economic, and cultural implications.
Finally, the study allowed for an estimation of the potential benefits of remote working in terms of energy and emission savings. Considering the entire sample of respondents in the four cities, workers that would have commuted at least partially by car have saved on average 6 kg of CO2 per day thanks to remote working (their average round-trip commuting distance was around 35 km). When extending these savings to the entire group of respondents, on average a remote worker can lead to CO2 emission savings of at least 3.8 kg/day, only considering avoiding emissions from private transport modes. This figure has been found to be comparable to other similar studies in the literature.
The results of this work confirm the important positive effects that remote working can have on the workers’ life quality as well as on the environment. Policy makers should be aware of the different dimensions that are involved with remote working, and define specific strategies in support of this option, especially for workers that have few alternatives to private transport modes and whose daily commuting is affected by long wait times due to congestion. At the same time, the results of this survey highlight the importance of remote working to be provided as a choice and not as an obligation, because each worker shows various life conditions and priorities.
Author Contributions
Conceptualization, B.F., R.R., A.Z. and M.R.; methodology, R.R., A.Z. and M.R.; formal analysis, R.R., A.Z., M.R. and M.N.; data curation, R.R.; writing—original draft preparation, R.R., A.Z., B.F., M.R. and M.N.; writing—review and editing, R.R. and M.N.; All authors have read and agreed to the published version of the manuscript.
Funding
This research received no external funding.
Institutional Review Board Statement
Not applicable.
Informed Consent Statement
Not applicable.
Data Availability Statement
Restrictions apply to the availability of these data. Data was obtained from ’Smartworking for Smart Cities’ project involving different institutions and are not publicly available.
Acknowledgments
This paper and the research behind it would not have been possible without the work of Marina Penna, one of the initiators of the Smart Working for Smart Cities project in ENEA and coauthor of previous contributions. The authors would like to thank the administrations and organisations that participated in the survey and the workers who provided answers to the questionnaire.
Conflicts of Interest
The authors declare no conflict of interest.
Abbreviations
The following abbreviations are used in this manuscript:
| ASI | avoid, shift, improve |
| CNG | compressed natural gas |
| COVID-19 | Coronavirus disease 2019 |
| EEA | European Environmental Agency |
| EU | European Union |
| ICT | information and communication technology |
| IPCC | Intergovernmental Panel on Climate Change |
| GHG | greenhouse gases |
| LPG | liquefied petroleum gas |
| NMVOC | non-methane volatile organic compounds |
| PAH | polycyclic aromatic hydrocarbons |
| PM | particulate matter |
| UNEP | United Nations Environment Programme |
| US | United States |
References
- Gschwind, L.; Vargas, O. Telework and its effects in Europe. In Telework in the 21st Century: An Evolutionary Perspective; Messenger, J.C., Ed.; Edward Elgar Publishing: Cheltenham, UK, 2019. [Google Scholar]
- OECD. The Well-Being of Nations: The Role of Human and Social Capital; OECD Publications: Paris, France, 2001. [Google Scholar]
- Eurofound. How Does Employee Involvement in Decision-Making Benefit Organisations? European Working Conditions Survey 2015 series; Publications Office of the European Union: Luxembourg, 2020. [Google Scholar]
- Eurofound. Telework and ICT-Based Mobile Work: Flexible Working in the Digital Age; New forms of employment series; Publications Office of the European Union: Luxembourg, 2020. [Google Scholar]
- Allen, T.D.; Johnson, R.C.; Kiburz, K.M.; Shockley, K.M. Work–Family Conflict and Flexible Work Arrangements: Deconstructing Flexibility. Pers. Psychol. 2013, 66, 345–376. [Google Scholar] [CrossRef]
- Sardeshmukh, S.R.; Sharma, D.; Golden, T.D. Impact of telework on exhaustion and job engagement: A job demands and job resources model. New Technol. Work Employ. 2012, 27, 193–207. [Google Scholar] [CrossRef]
- Gajendran, R.S.; Harrison, D.A.; Delaney-Klinger, K. Are Telecommuters Remotely Good Citizens? Unpacking Telecommuting’s Effects on Performance Via I-Deals and Job Resources. Pers. Psychol. 2015, 68, 353–393. [Google Scholar] [CrossRef]
- Penna, M.; Felici, B.; Rao, M.; Roberto, R.; Zini, A. Il tempo dello Smart Working. La PA tra Conciliazione, Valorizzazione del Lavoro e dell’ambiente—Primi Risultati dell’indagine Nazionale su Lavoro Agile e Telelavoro nel Settore Pubblico. Available online: https://www.enea.it/it/seguici/pubblicazioni/pdf-volumi/2020/smart_working_nella_pa.pdf (accessed on 26 October 2022).
- Roberto, R.; Penna, M.; Felici, B.; Rao, M. Chapter 8. Smart working and flexible work arrangements: Opportunities and risks for sustainable communities. In Intelligent Environments: Advanced Systems for a Healthy Planet; Elsevier: Amsterdam, The Netherlands, 2022. [Google Scholar]
- Hook, A.; Court, V.; Sovacool, B.K.; Sorrell, S. A systematic review of the energy and climate impacts of teleworking. Environ. Res. Lett. 2020, 15, 093003. [Google Scholar] [CrossRef]
- Fabiani, C.; Longo, S.; Pisello, A.L.; Cellura, M. Sustainable production and consumption in remote working conditions due to COVID-19 lockdown in Italy: An environmental and user acceptance investigation. Sustain. Prod. Consum. 2021, 28, 1757–1771. [Google Scholar] [CrossRef]
- Noussan, M.; Jarre, M. Assessing Commuting Energy and Emissions Savings through Remote Working and Carpooling: Lessons from an Italian Region. Energies 2021, 14, 7177. [Google Scholar] [CrossRef]
- O’Brien, W.; Yazdani Aliabadi, F. Does telecommuting save energy? A critical review of quantitative studies and their research methods. Energy Build. 2020, 225, 110298. [Google Scholar] [CrossRef] [PubMed]
- Blasko, Z.; Papadimitriou, E.; Manca, A. How Will the COVID-19 Crisis Affect Existing Gender Divides in Europe? Available online: https://publications.jrc.ec.europa.eu/repository/bitstream/JRC120525/covid_gender_effects_f.pdf (accessed on 15 November 2022).
- ISPRA. Annuario dei Dati Ambientali 2021. Banca Dati Degli Indicatori Ambientali. Available online: https://annuario.isprambiente.it/sys_ind/macro (accessed on 16 November 2022).
- IEA. Total Energy Supply by Sector—Europe. Available online: https://www.iea.org/regions/europe (accessed on 15 November 2022).
- EUROSTAT. Database EUROSTAT. Available online: https://ec.europa.eu/eurostat/data/database (accessed on 15 November 2022).
- ISPRA. Stato dell’Ambiente 97/2022. Available online: https://annuario.isprambiente.it/sites/default/files/pdf/2021/annuario_in_cifre_2021.pdf (accessed on 16 November 2022).
- Bernetti, A.; Caputo, A.; Finocchiaro, G.; Iarocci, G. Annuario dei Dati Ambientali—Edizione 2019, Area Tematica Trasporti, Stato dell’Ambiente, 89/2020. 2020. Available online: https://www.isprambiente.gov.it/it/pubblicazioni/stato-dellambiente/annuario-dei-dati-ambientali-edizione-2019 (accessed on 16 November 2022).
- ISFORT. 18∘ Rapporto sulla Mobilità degli Italiani. Governare le Transizioni per una Ripresa Sostenibile. Available online: https://www.isfort.it/wp-content/uploads/2021/11/211130_RapportoMobilita2021.pdf (accessed on 16 November 2022).
- Previsioni di Domanda Energetica e Petrolifera Italiana 2019–2040. Available online: https://www.unem.it/download/previsioni-domanda-energetica-e-petrolifera-2019_2040/ (accessed on 16 November 2022).
- Italian Government. National Energy Balance. 2021. Available online: https://dgsaie.mise.gov.it/bilancio-energetico-nazionale (accessed on 16 November 2022).
- Bazzana, D.; Cohen, J.J.; Golinucci, N.; Hafner, M.; Noussan, M.; Reichl, J.; Rocco, M.V.; Sciullo, A.; Vergalli, S. A multi-disciplinary approach to estimate the medium-term impact of COVID-19 on transport and energy: A case study for Italy. Energy 2022, 238, 122015. [Google Scholar] [CrossRef] [PubMed]
- European Commission. COM/2011/0144 Final—WHITE PAPER Roadmap to a Single European Transport Area—Towards a Competitive and Resource Efficient Transport System. 2011. Available online: https://eur-lex.europa.eu/LexUriServ/LexUriServ.do?uri=COM:2011:0144:FIN:en:PDF (accessed on 16 November 2022).
- European Commission. COM(2013) 17 Final—Communication from the Commission to the European Parliament, the Council, the European Economic and Social Committee and the Committee of the Regions Clean Power for Transport: A European Alternative Fuels Strategy. 2013. Available online: https://eur-lex.europa.eu/legal-content/EN/ALL/?uri=celex%3A52013PC0017 (accessed on 16 November 2022).
- European Commission. COM(2013) 913 Final—Communication from the Commission to the European Parliament, the Council, the European Economic and Social Committee and the Committee of the Regions Together towards Competitive and Resource-Efficient urban Mobility. 2013. Available online: https://eur-lex.europa.eu/legal-content/EN/TXT/?uri=celex%3A52013DC0913 (accessed on 16 November 2022).
- European Commission. COM/2017/0283 Final—Communication from the Commission to the European Parliament, the Council, the European Economic and Social Committee and the Committee of the Regions Europe on the Move an Agenda for a Socially Fair Transition towards Clean, Competitive and Connected Mobility for All. 2017. Available online: https://eur-lex.europa.eu/legal-content/EN/TXT/?uri=CELEX%3A52017DC0283 (accessed on 16 November 2022).
- European Commission. COM/2020/789 Final—Communication from the Commission to the European Parliament, the Council, the European Economic and Social Committee and the Committee of the Regions Sustainable and Smart Mobility Strategy—Putting European Transport on Track for the Future. 2020. Available online: https://eur-lex.europa.eu/legal-content/EN/TXT/?uri=CELEX%3A52020DC0789 (accessed on 16 November 2022).
- European Commission. COM(2021) 102 Final—Communication from the Commission to the European Parliament, the Council, the European Economic and Social Committee and the Committee of the Regions Empty the European Pillar of Social Rights Action Plan. 2021. Available online: https://eur-lex.europa.eu/legal-content/EN/TXT/?uri=COM%3A2021%3A102%3AFIN (accessed on 16 November 2022).
- Sustainable Urban Mobility in the EU: No Substantial Improvement Is Possible without Member States’ Commitment. Special Report n.6. 2020. Available online: https://www.eca.europa.eu/en/Pages/DocItem.aspx?did=53246 (accessed on 16 November 2022).
- The European Environment—State and Outlook 2020 Knowledge for Transition to a Sustainable Europe; EU Publications Office: Luxembourg, 2019. [CrossRef]
- Berkhout, E.; Galasso, N.; Lawson, M.; Morales, P.A.R.; Taneja, A.; Pimentel, D.A.V. Briefing Paper—Il Virus della Disuguaglianza. 2021. Available online: https://www.oxfamitalia.org/wp-content/uploads/2021/01/FINAL_Sintesi_report_-Il-Virus-della-Disuguaglianza.pdf (accessed on 16 November 2022).
- Indagine Conoscitiva Sulle Nuove Disuguaglianze Prodotte dalla Pandemia nel Mondo del Lavoro. Available online: https://www.istat.it/it/archivio/259938 (accessed on 23 November 2022).
- Cerruto, M. La partecipazione politica in Italia (1992–2012). Quad. Psicol. 2012, 1, 17–39. [Google Scholar]
- Blais, A.; Kostelka, F. The decision to vote or abstain in the 2014 European elections. Eur. J. Soc. Sci. 2015, 53, 79–94. [Google Scholar] [CrossRef]
- Strengers, Y.; Maller, C. (Eds.) Social Practices, Intervention and Sustainability: Beyond Behaviour Change; Routledge: London, UK, 2014. [Google Scholar] [CrossRef]
- Barr, S.; Shaw, G.; Coles, T. Times for (Un)sustainability? Challenges and opportunities for developing behaviour change policy. A case-study of consumers at home and away. Glob. Environ. Chang. 2011, 21, 1234–1244. [Google Scholar] [CrossRef]
- European Environment Agency; Briefing—Transport: Increasing Oil Consumption and Greenhouse Gas Emissions Hamper EU Progress towards Environment and Climate Objectives. 2020. Available online: http://119.78.100.173/C666/handle/2XK7JSWQ/251535 (accessed on 12 November 2022).
- Banister, D. The sustainable mobility paradigm. Transp. Policy 2008, 15, 73–80. [Google Scholar] [CrossRef]
- Armstrong, Martin; Statista—How the World Commutes. 2021. Available online: https://www.statista.com/chart/25129/gcs-how-the-world-commutes/ (accessed on 16 November 2022).
- Zhang, K.; Batterman, S. Air pollution and health risks due to vehicle traffic. Sci. Total Environ. 2013, 450–451, 307–316. [Google Scholar] [CrossRef] [PubMed]
- Deutsche Gesellschaft für Internationale Zusammenarbeit GmbH. Sustainable Urban Transport: Avoid-Shift-Improve (A-S-I). Available online: https://ledsgp.org/app/uploads/2016/01/SUTP_GIZ_FS_Avoid-Shift-Improve_EN.pdf (accessed on 26 November 2022).
- Roberto, R.; Penna, M.; Felici, B.; Rao, M. Massive Smart-Work Deployment: Opportunities and Risks for Resilient Communities. In Intelligent Environments Advanced Systems for a Healthy Planet, 2nd ed.; Droege, P., Ed.; Elsevier/North Holland: Amsterdam, The Netherlands, 2022; pp. 107–132. [Google Scholar]
- Dallo Smart Working d’Emergenza al “New Normal”: Nuove Abitudini e Nuovi Approcci al Lavoro. Available online: https://www.osservatori.net/it/ricerche/comunicati-stampa/smart-working-emergenza-covid19-new-normal (accessed on 23 November 2022).
- Microsoft Corporation. Microsoft Excel. Available online: https://office.microsoft.com/excel (accessed on 23 November 2022).
- The R Project for Statistical Computing. Available online: https://www.R-project.org/ (accessed on 23 November 2022).
- ISPRA. La Banca dati dei Fattori di Emissione medi del Trasporto Stradale in Italia. Available online: https://fetransp.isprambiente.it/#/ (accessed on 25 November 2022).
- European Environment Agency. EMEP/EEA Air Pollutant Emission Inventory Guidebook 2016—Technical Guidance to Prepare National Emission Inventories, EEA Report No 21/2016. Available online: https://www.eea.europa.eu/publications/emep-eea-guidebook-2016 (accessed on 25 November 2022).
- CoreWriting Team; Pachauri, R.K.; Meyer, L.A. (Eds.) Climate Change 2014: Synthesis Report. Contribution of Working Groups I, II and III to the Fifth Assessment Report of the Intergovernmental Panel on Climate Change; IPCC: Geneva, Switzerland, 2014; Available online: https://www.ipcc.ch/report/ar5/syr/ (accessed on 20 November 2022).
- Veneri, P. Urban Polycentricity and the Costs of Commuting: Evidence from Italian Metropolitan Areas. Growth Chang. 2010, 41, 403–429. [Google Scholar] [CrossRef]
- Video in Italian. 2022. Available online: https://www.rm.camcom.it/archivio27_focus_0_582_0_10.html (accessed on 26 November 2022).
- Casacchia, O.; Crisci, M. La Mobilità all’interno di Roma. 2011. Available online: https://data.cnr.it/data/http://www.cnr.it/ontology/cnr/individuo/prodotto/ID309277 (accessed on 23 November 2022).
- Celata, F.; Lucciarini, S. Atlante delle Diseguaglianze a Roma. 2016. Available online: https://web.uniroma1.it/memotef/sites/default/files/Atlante_Camcom_2016_compresso.pdf (accessed on 23 November 2022).
- Legambiente. Rapporto Pendolaria 2022. Available online: https://www.legambiente.it/wp-content/uploads/2021/11/Rapporto-Pendolaria-2022.pdf (accessed on 26 November 2022).
- TomTom. TomTom Traffic Index Ranking. 2022. Available online: https://www.tomtom.com/traffic-index/ranking/ (accessed on 12 November 2022).
- ACI. Autoritratto 2021. 2022. Available online: https://www.aci.it/laci/studi-e-ricerche/dati-e-statistiche/autoritratto/autoritratto-2021.html (accessed on 12 November 2022).
- Comune di Bologna. Bologna Città 30. 2022. (In Italian). Available online: https://www.comune.bologna.it/notizie/bologna-citta-30 (accessed on 12 November 2022).
- Eurostat. Eurostat Regional Yearbook. 2022. Available online: https://ec.europa.eu/eurostat/en/web/products-flagship-publications/-/ks-ha-22-001 (accessed on 26 November 2022).
- Osservatorio Mobilità Sostenibile in Italia. Available online: https://www.xn--osservatorio50citt-wrb.it/searchIndicator_NEW/index.php?lan=English (accessed on 26 November 2022).
- How Many People Can You Reach by Public Transport, Bicycle or on Foot in European Cities? Measuring Urban Accessibility for Low-Carbon Modes. 2020. Available online: https://ec.europa.eu/regional_policy/en/information/publications/working-papers/2020/low-carbon-urban-accessibility (accessed on 25 October 2022).
- Ministero dell’economia e delle Finanze, Dipartimento della Ragioneria Generale dello Stato. Conto Annuale. Available online: https://www.rgs.mef.gov.it/VERSIONE-I/e_government/amministrazioni_pubbliche/personale_delle_pa/conto_annuale (accessed on 26 November 2022).
- Morikawa, M. Long Commuting Time and the Benefits of Telecommuting. 2018. Available online: https://www.rieti.go.jp/jp/publications/dp/18e025.pdf (accessed on 26 November 2022).
- Öhman, M.; Lindgren, U. Who Are the Long-Distance Commuters? Patterns and Driving Forces in Sweden. Cybergeo Eur. J. Geogr. 2003, 1, 243. [Google Scholar] [CrossRef]
- QGIS. Available online: https://qgis.org (accessed on 26 November 2022).
- Donati, A.; Petracchini, F.; Gasparini, C.; Tomassetti, L. (Eds.) Politiche di Mobilità e Qualità dell’aria Nelle 14 Città e Aree Metropolitane 2017–2018. 2019. Available online: https://www.kyotoclub.org/medialibrary/LibroMOB2019_digital_sm.pdf (accessed on 26 November 2022).
- Felici, B.; Penna, M.; Rao, M.; Roberto, R.; Zini, A. Smart Working: Prospettive di Cambiamento per la Sostenibilità Urbana. Un’analisi Comparata in 4 Province Italiane. 2022. Available online: https://www.pubblicazioni.enea.it/component/jdownloads/?task=download.send&id=471&catid=3&m=0&Itemid=101 (accessed on 26 October 2022).
- Burrell, D.N.; Barnard-Zaffino, M.E.; Ulomi, S. An applied research analysis of telework programmes as an environmentally friendly policy and a viable sustainability development leadership practice. Int. J. Environ. Policy Decis. Mak. 2014, 1, 123–143. [Google Scholar] [CrossRef]
- IEA. Working from Home Can Save Energy and Reduce Emissions. But How Much? Available online: https://www.iea.org/commentaries/working-from-home-can-save-energy-and-reduce-emissions-but-how-much (accessed on 27 November 2022).
- Shearmur, R.; Pajević, F. Work Habits Are Changing: Cities Need to Keep Up. 2018. Available online: https://www.bloomberg.com/news/articles/2018-08-31/what-does-work-sprawl-mean-for-urban-planning (accessed on 26 November 2022).
- Swilling, M.; Hajer, M.; Baynes, T.; Bergesen, J.; Labbé, F.; Musango, J.K.; Ramaswami, A.; Robinson, B.; Salat, S.; Suh, S.; et al. The Weight of Cities: Resource Requirements of Future Urbanization. IRP Rep. 2018. Available online: https://wedocs.unep.org/handle/20.500.11822/31624 (accessed on 27 November 2022).
- Kaway, Y. Work/life community by telework—Possibilities and issues in the case of Loma Linda. J. Green Build. 2008, 3, 128–139. [Google Scholar] [CrossRef]


Disclaimer/Publisher’s Note: The statements, opinions and data contained in all publications are solely those of the individual author(s) and contributor(s) and not of MDPI and/or the editor(s). MDPI and/or the editor(s) disclaim responsibility for any injury to people or property resulting from any ideas, methods, instructions or products referred to in the content. |
© 2023 by the authors. Licensee MDPI, Basel, Switzerland. This article is an open access article distributed under the terms and conditions of the Creative Commons Attribution (CC BY) license (https://creativecommons.org/licenses/by/4.0/).