1. Introduction
Traumatic Brain Injuries (TBI) are a significant burden to society globally, with an estimated 27 million people worldwide being reported to sustain a TBI in 2016 alone [
1]. The statistics, however, show that the problem may be underestimated, as a significant number of these injuries are not accurately reported [
1]. The consequences of TBI are often catastrophic and may lead to long term disabilities or death. Significant investments have been made in injury prevention (e.g., road safety, public awareness, etc.), but there is a current need to improve technologies that will help clinicians to treat such injuries rapidly and more efficiently.
Intracranial pressure (ICP) is a standard biomarker used in the treatment of TBI, and is defined as the pressure surrounding the brain within the skull. As the skull is a rigid enclosed space, any change in intracranial volume can lead to an increase in ICP. The Monroe–Kellie doctrine defines the relationship between intracranial volume and pressure within the cranial cavity [
2]. The three main components of the cranial volume are the brain, cerebrospinal fluid (CSF), and blood. As the brain volume can be relatively constant or compressible to a certain level, any change in CSF or blood volume, in the absence of any compensatory mechanism, can result in an increased ICP [
2,
3]. For these reasons, brain lesions or surrounding oedema resulting from TBI can cause a rapid rise in ICP. Such an increase in ICP can lead to a decreased cerebral perfusion and reduced cerebral blood flow, leading to cerebral ischemia, tonsillar/cerebral herniation, and other physiological responses with devastating neurological consequences [
4]. Therefore, monitoring ICP is crucial in neurocritical care to avoid secondary brain injury and to improve outcomes [
3].
The normal range of ICP in adults is 7–15 mmHg, and while the threshold for intervention due to a raised ICP may differ between patients, there is a consensus that treatment should start if the ICP is higher than 20–25 mmHg [
5,
6]. The currently available methods for measuring ICP involve insertion of a pressure transducer or catheter into the cranial cavity. The ‘gold standard’ ICP measurement is a catheter inserted into the ventricle (normal fluid-filled cavity) of the brain, connected to an external strain-gauge transducer [
6]. A more commonly used method is based on a pressure microtransducer placed directly into the brain parenchyma or subdural space (between the brain and the skull). These sensors are easier to place and have a lower rate of complications such as infections or haemorrhage [
6,
7]. However, both methods are invasive, require a surgical procedure which can only be performed by a neurosurgeon, and expose the patient to potentially life-threatening complications [
6,
8].
Due to the limitations of invasive methods, other techniques have been investigated in an attempt to measure the ICP non-invasively [
9,
10]. Among these, Transcranial Doppler-based techniques or the measurement of the Optic Nerve Sheet Diameter seem to be the most promising [
11,
12]. Nonetheless, these techniques have not replaced the standard (invasive) methods to measure ICP, as they have not yet proven their clinical efficacy and accuracy. Additionally, these devices comprise cumbersome technology, require skilled personnel, are operator-dependent, and may not provide direct and continuous measurement of ICP [
13]. Therefore, there is a significant need to develop novel technologies that will allow the non-invasive and easy measurement of ICP, as well as permitting clinicians to measure the ICP within the ‘golden hour’ after a traumatic brain injury, before they reach the hospital. These factors will greatly reduce the risks for patients, improve the treatment outcomes, and avoid the requirement of specialised training.
Among the non-invasive techniques that can be used to monitor cerebral haemodynamics, Photoplethysmography and/or Near Infrared Spectroscopy (NIRS) offers the potential of being exploited to non-invasively monitor intracranial pressure. The technique is employed to monitor cerebral oxygenation by shining multiple wavelengths of near-infrared light into the brain. Due to the low absorption and high scattering properties of the skull bones in the near-infrared part of the light spectrum, near-infrared light can penetrate easily through the skull and reach the cerebral tissue. When the emitted light is detected by a photodetector, the optical variations in the signal at multiple near-infrared wavelengths can be used to infer the concentrations of oxygenated haemoglobin (HbO2) and deoxygenated haemoglobin (HHb), thus determining changes in cerebral oxygenation. More details on the technical aspects and applications of cerebral NIRS can be found in a recently published review by Roldan and Kyriacou [
9].
The raw optical signals measured by NIRS can be further exploited by analysing the cardio-synchronous pulsations (Photoplethysmograms (PPGs)) caused by blood volume changes in light absorption during each cardiac cycle [
14,
15]. The hypothesis underlying the utilisation of the PPG in this application is based on the fact that increased pressure surrounding the cerebral arteries on the cortex surface will affect the shape of these arteries; consequently, their squeezed blood volume could yield to changes in the morphology of the detected optical signal. Therefore, this PPG signal will contain features that can be extracted using signal processing techniques, and which can be related to physiological effects of increased intracranial pressure such as increased cerebrovascular vascular resistance and decreased cerebrovascular compliance. This paper describes the in vitro evaluation of a novel non-invasive intracranial pressure (nICP) monitor which utilises the technique of PPG to measure the ICP by analysing the features of the acquired optical signal. The nICP device was evaluated in an in vitro model which simulated the haemodynamics of the cerebral circulation. The signals from the nICP monitor were acquired in different monitoring protocols in which the pressure was incrementally changed and the relevant features from the PPGs were analysed to estimate the ICP non-invasively.
2. Material and Methods
2.1. In Vitro Model of the Cardiovascular System
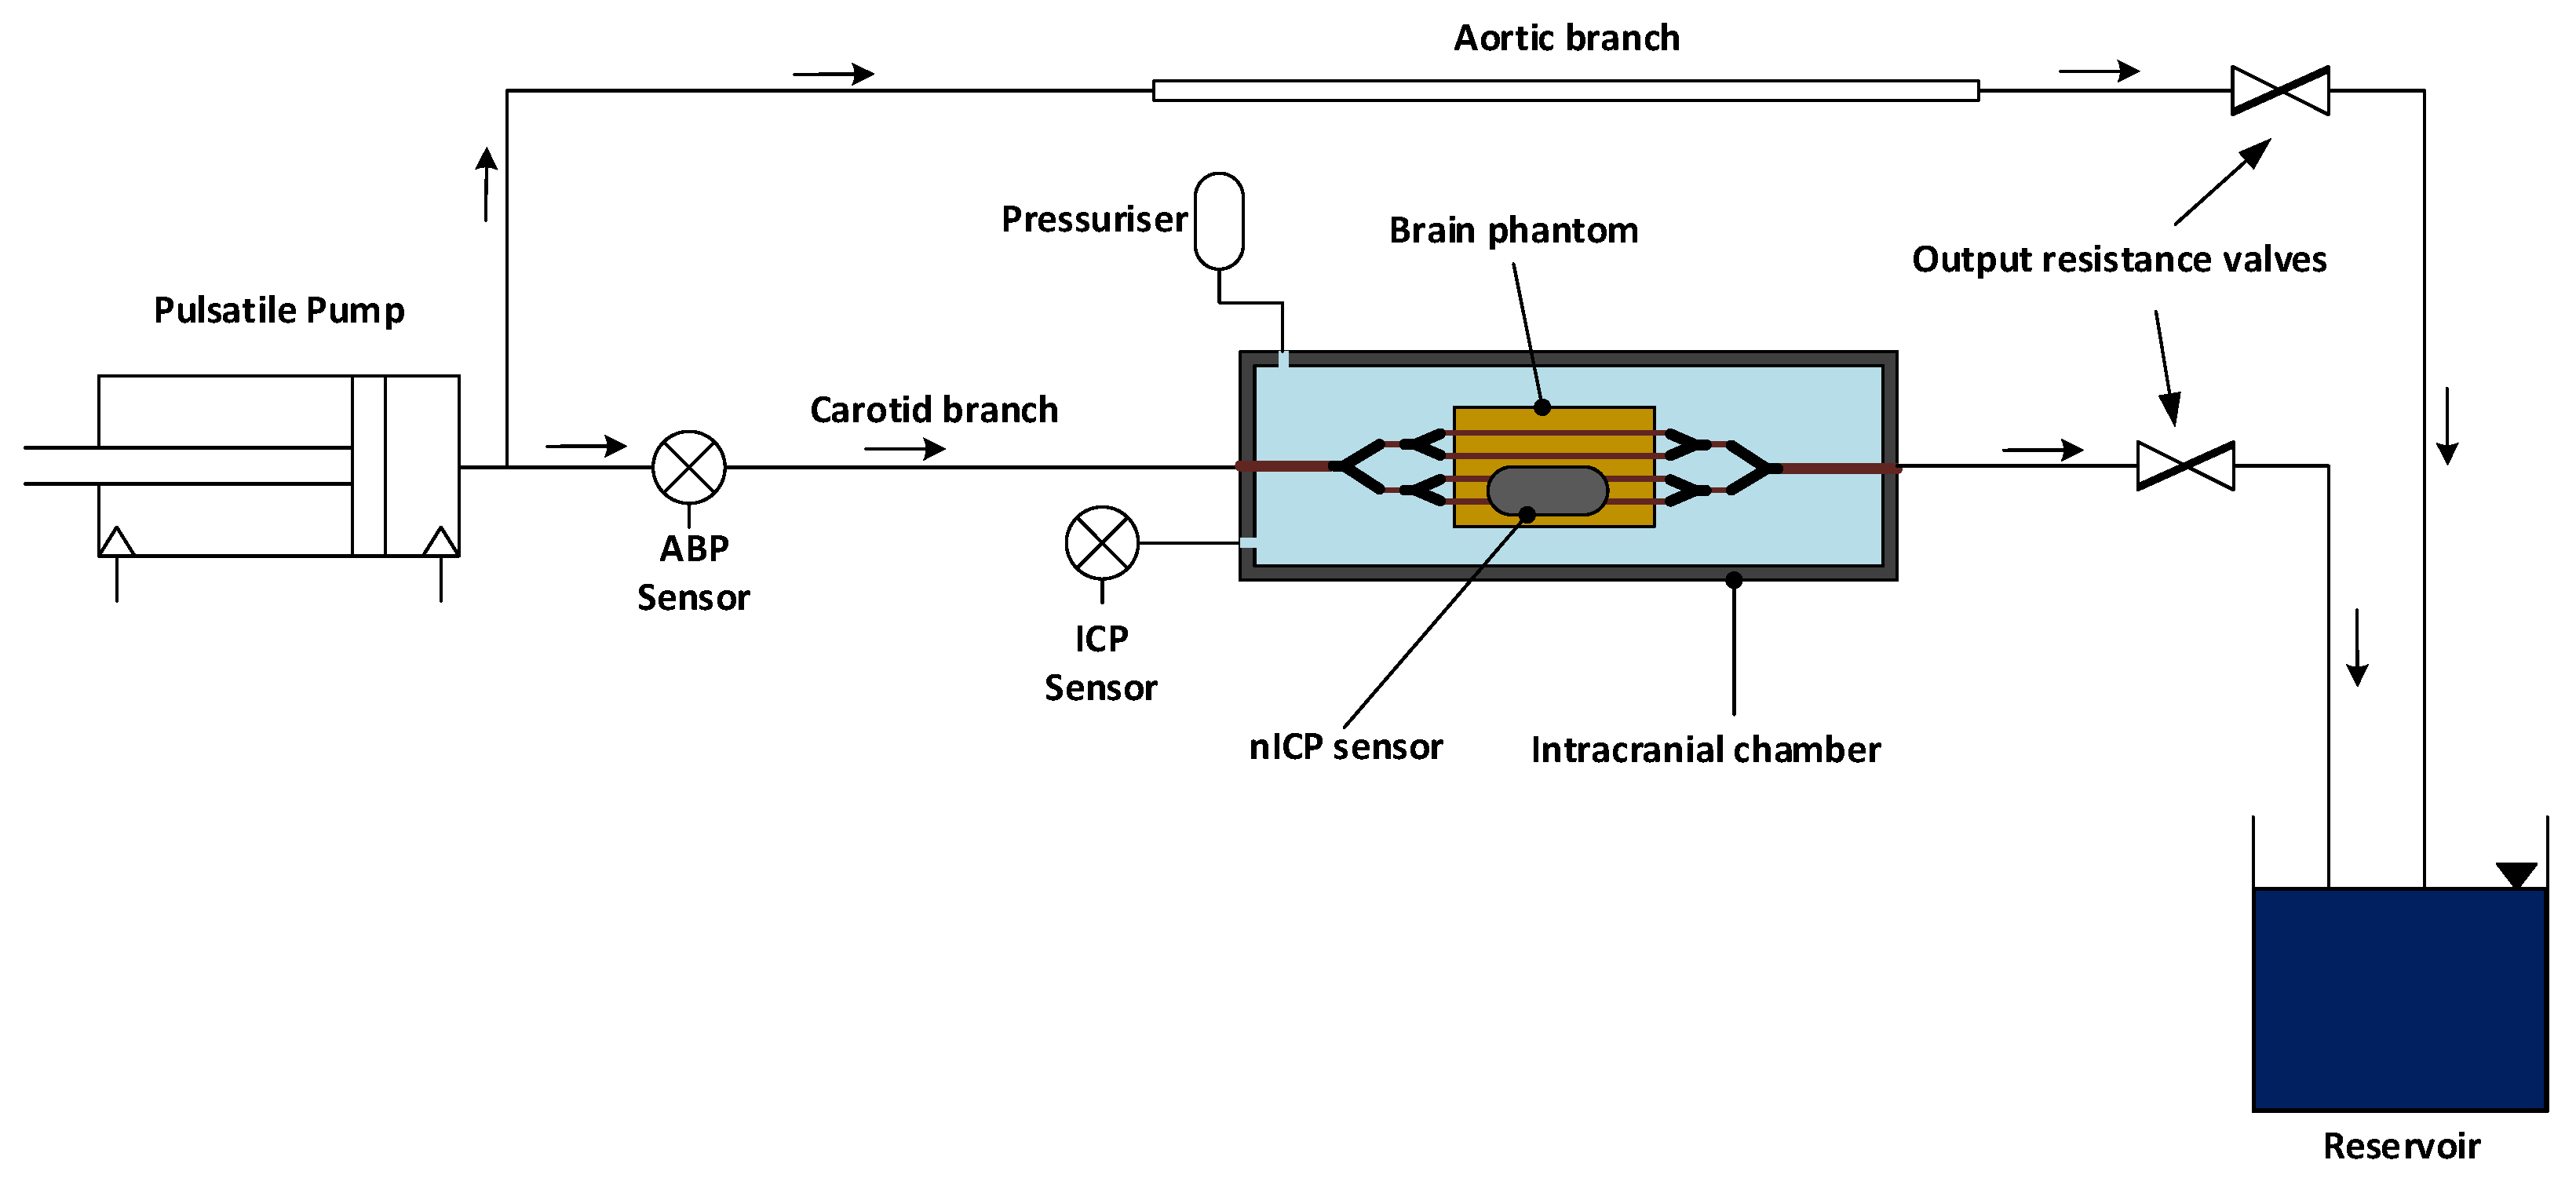
An in vitro model of the upper cardiovascular circulation was developed to recreate the physiological conditions necessary to simulate the pressure in an intracranial environment. The model was a closed-loop circulation circuit, and its main components were a pulsatile pump (heart), silicone vessels (arteries), intracranial chamber, brain phantom, and a reservoir.
The pulsatile pump, used in this study to recreate the pumping action of the left ventricle, was a custom-made piston pump which outputs a pressure/volume profile corresponding to a square waveform. The pump was driven by an ad hoc driving unit and software application through which the user could customise the output profile by controlling the heart rate (HR), stroke volume (SV), and the in-stroke/out-stroke ratio.
As shown in
Figure 1, the output of the pulsatile pump was connected to the aortic branch of the system, comprising a rubber tube with a diameter of 20 mm and a wall thickness of 0.5 mm. The aortic branch split into the carotid and descending aorta. The carotid branch was connected to the cerebral circulation within the brain phantom via the intracranial chamber’s inlet, whereas a ‘Y’ hose connector separated the incoming flow from the descending aorta into the right and left iliac arteries. The iliac arteries were then connected to the reservoir, where the fluid returned before being redirected towards the pulsatile pump. The carotid branch (excluding the brain phantom, see the following section) and the iliac arteries were composed of silicone tubing of different diameters corresponding to the arteries’ dimensions. Two valves at the output of the carotid and aortic branch enabled the control and regulation of the output resistance of the system (i.e., the systemic pressure of the circuit).
2.2. Blood Mimicking Fluid
In order to simulate the optical properties of blood, a dye solution was prepared and used as a blood-mimicking fluid. The light-absorbing solution was adapted from the dye mixture previously described by Akl et al. [
16]. The mixture mimicked the optical properties of oxygenated blood in the near-infrared region of the spectrum, and was composed by 160 mg/L of an infrared dye (Epolight 2735, Epolin, Newark, NJ, USA) and 0.088 %
v/
v of India ink in phosphate-buffered saline (PBS) solution. The Epolight 2735 dye presents an absorption profile similar to oxygenated blood in the near-infrared, while the India ink increases the baseline absorption over the spectrum.
2.3. Intracranial Chamber & Brain Phantom
The intracranial chamber was designed to mimic the intracranial compartment within the human skull. The chamber was manufactured in Polyvinyl Chloride (PVC) with internal dimensions of 300 mm × 85 mm × 65 mm (W × D × H) and a wall thickness of 15 mm. The intracranial chamber had a total of six inlets/outlets for the connection with the rest of the cardiovascular circuit and two additional draining outlets.
A brain phantom was enclosed in the intracranial chamber to recreate the cerebrovascular tissue within the skull. The brain phantom was developed in silicone gel (Sylgard 527, DOWSIL—Dow Corning, MI, USA), as this material mimics the mechanical properties of the brain under dynamic and static conditions [
17]. The casting mixture was prepared by adding the two-part silicone gel in a ratio of 1:1. In addition, as the silicone gel is transparent with minimal scattering properties, Titanium Dioxide (TiO2) particles with a primary crystal size of 550 nm (Altiris 550, Venator Corporation, Teesside, UK) were added to the mixture in a ratio of (
weight/
volume) 0.1 g/100 mL to simulate near-infrared scattering. The solution of Sylgard 527 and Titanium Dioxide particles was then hand-mixed and sonicated before undergoing a degassing cycle into a vacuum chamber (i.e., to remove air bubbles which may cause optical heterogeneities within the phantom).
The silicon mixture was poured into a cast of dimensions 150 mm × 70 mm × 50 mm (W × D × H), with a resulting total volume of 525 mL. The cast pre-contained a net of four silicone rubber vessels with an internal diameter of 1.5 mm and wall thickness equal to 0.5 mm (SP15-0.5-X-CLS, Hilltop Products Ltd., Warrington, UK), representing the superficial cerebral arteries on the surface of the brain. These were positioned at a depth of approximately 2 mm from the surface. Below this vascular net, a single silicone rubber vessel of an internal diameter of 3 mm and wall thickness 0.5 mm (SP30-0.5-X-CLS, Hilltop Products Ltd., Warrington, UK) simulated the basilar cerebral artery and aimed at aiding the mechanical actions of compression/extension of the cerebral tissue during the cardiac cycle. After an initial curing cycle of 48 h at ambient temperature, the silicone phantom was removed from the casting and cured in the oven at 125 °C for 60 min.
Figure 2 shows the intracranial chamber environment, inclusive of the brain phantom. The extracerebral space in the intracranial chamber was filled with deionised water, and the chamber was sealed with a clear acrylic plate.
2.4. Pressure Measurements and Pressuring System
The pressure inside the intracranial chamber, surrounding the brain phantom, represents the ICP measured in clinical settings by intraparenchymal sensors. The pressure inside the intracranial chamber was continuously measured by a needle-tip pressure transducer (CTN-0-4F, Gaeltec Devices Ltd., Edinburgh, UK) connected to an external amplification unit (NL109 Bridge Amplifier-NeuroLog System, Digitimer Ltd., Welwyn Garden City, UK). An identical sensor also measured the systemic ‘arterial’ pressure (ABP) at the junction between the aortic and the carotid branch.
The extracerebral space within the intracranial chamber was filled with deionised water, whereas one of the inlets of the chamber was connected to a pressurising unit consisting of a 50 mL burette filled with ionised water. The pressure Pi (i.e., ICP) applied in the extracerebral space by the burette is given by the hydrostatic pressure exerted by the column of water, as in Equation (1).
where ρ is the density of the fluid, g is the gravitational acceleration constant, and h is the height of the column of water
By adding water to the column of water in the burette, the ICP was increased, whereas drainage of the water through one of the chamber inlets would allow the pressure to be decreased.
2.5. The nICP Sensor and Measuring System
An optical custom-made reflectance sensor placed on top of the intracranial chamber acquired PPG signals from the brain phantom. The nICP sensor comprised a high-intensity light-emitting diode (OIS-330-810-X, Osaoptolight, Berlin, Germany) with a peak emission wavelength at 810 nm, whereas the detector was a silicone photodiode (VBPW34S, Vishay Intertechnology, Malvern, PA, USA) with a large active area, which was positioned at a distance of 35 mm from the light source. This inter-optodes distance was chosen as it guaranteed the light penetration necessary to interrogate the cerebral cortex, as commonly used in cerebral Near Infrared Spectroscopy measurements [
18]. The latter was analysed by the authors in a previous publication [
19]. In addition, the emission of near-infrared light at the isobestic point of 810 nm ensures that the measurements are unaffected by changes in blood oxygenation (i.e., changes in oxygenated and deoxygenated haemoglobin concentrations).
An instrumentation unit was employed to drive the light source and process the signals detected by the photodiode. The platform (
ZenPPG) has been described in detail by Budidha et al., and it was responsible for supplying the driving currents to the LEDs, transforming and amplifying light intensities into voltages, and pre-processing the acquired signals [
20].
2.6. Acquisition Measurement and Investigation Protocol
The intracranial and systemic pressure signals from the in vitro model were digitised by a data acquisition system (NI cDAQ-9172, National Instruments, Austin, TX, USA), whereas the optical signals measured from the brain phantom were digitised by a second data acquisition system (USB6212, National Instruments, Austin, TX, USA) directly connected to the instrumentation unit. The digitised signals from both data acquisition cards were read by a software application developed in LabVIEW (National Instruments, Austin, TX, USA), and all measurements were digitised and acquired simultaneously at a sampling frequency of 1 kHz and saved in a text file for post hoc analysis.
The investigation protocol involved the acquisition of continuous optical measurements from the brain phantom during stepwise increase/decrease in ICP. By varying the height of the column of water in the burette, the ICP was changed in steps of approximately 2 mmHg from an initial pressure of 10 mmHg (i.e., physiologically normal ICP in adults). A 2-way valve between the burette output and the intracranial chamber allowed for the circuit to be closed once the chamber was pressurised.
Figure 3 shows an example of the variations in ICP measured inside the intracranial chamber during incremental increases in pressure.
Three distinct and independent measurement protocols were performed in which the ICP was either incrementally increased (Dataset 1 and 2) or gradually decreased (Dataset 3). The protocol timing comprised 60 s of continuous acquisition of signals at each pressure-step, whereas a transition period of 30 s between steps was allocated to vary the pressure and to allow the signals to stabilise. The heart rate and stroke volume for all three measurement protocols were set at 80 bpm and 60 mL, respectively, whereas the systemic mean arterial pressure (MAP) in the circuit was regulated between 105–115 mmHg.
2.7. Data Analysis and Features Extraction
The PPG signals acquired by the nICP monitor were filtered from noise and dc offset using a 10th order band-pass Butterworth filter with a passband of 0.5–7 Hz. The invasive ICP signals collected by the pressure sensor in the intracranial chamber were low pass filtered at 10 Hz to remove high-frequency noise.
The features illustrated in
Figure 4 were then extracted from the filtered PPG signal in a 15 s rolling window. The features were extracted for each cardiac cycle (systole/diastole) and averaged to obtain a single value for the entire window. The Pulse Amplitude was calculated as the difference in magnitude between a minimum (or valley) and the succeeding peak. The Half Peak Width was estimated from the PPG signal as the horizontal distance (in number of sample points) between the points in the signal intercepting the reference line, set at half of the peak height (amplitude). The Systolic Risetime was derived as the time, in seconds, between each pulse peak and the preceding minimum point. Conversely, the Systolic Decay time was estimated as the time, in seconds, between each pulse peak and the following minimum point. The Systolic Upslope was estimated as the slope of the systolic phase of each pulse by determining the gradient in V/s (Volts/seconds) of the twenty sample points preceding and following the mid-point between each peak, and each minimum point of the PPG signal.
As per its definition, the invasive (reference) ICP was estimated from the ICP waveform as the mean value across the rolling window. The signals were then time-segmented for each protocol step, outliers were removed, and, for each pressure step, the data were split in an 80/20% ratio to train and test the model, respectively.
After standardising the features, a Partial Least Square Regression (PLSR) model was used to estimate the response variable (i.e., ICP). The PLSR regression model transforms the features into a combination of components (predictors) in which the correlation between predictors (i.e., collinearity) is minimised and the variance maximised with respect to the observed response variable. After training the PLSR model with the train data, the PLSR model’s coefficients were used to compute the new components and estimate the non-invasive ICP (nICP) from the test data. The coefficient of determination, R2, was computed to assess the adequacy of the model.
The estimated nICP was compared with the reference invasive ICP for correlation and accuracy. Correlation between the two measures was assessed by computing the Pearson’s correlation coefficient. The accuracy of the measurement was assessed by calculating the Root Mean Square Error (RMSE) and analysis of agreement by Bland and Altman plots. A p-value < 0.05 was considered statistically significant.
3. Results
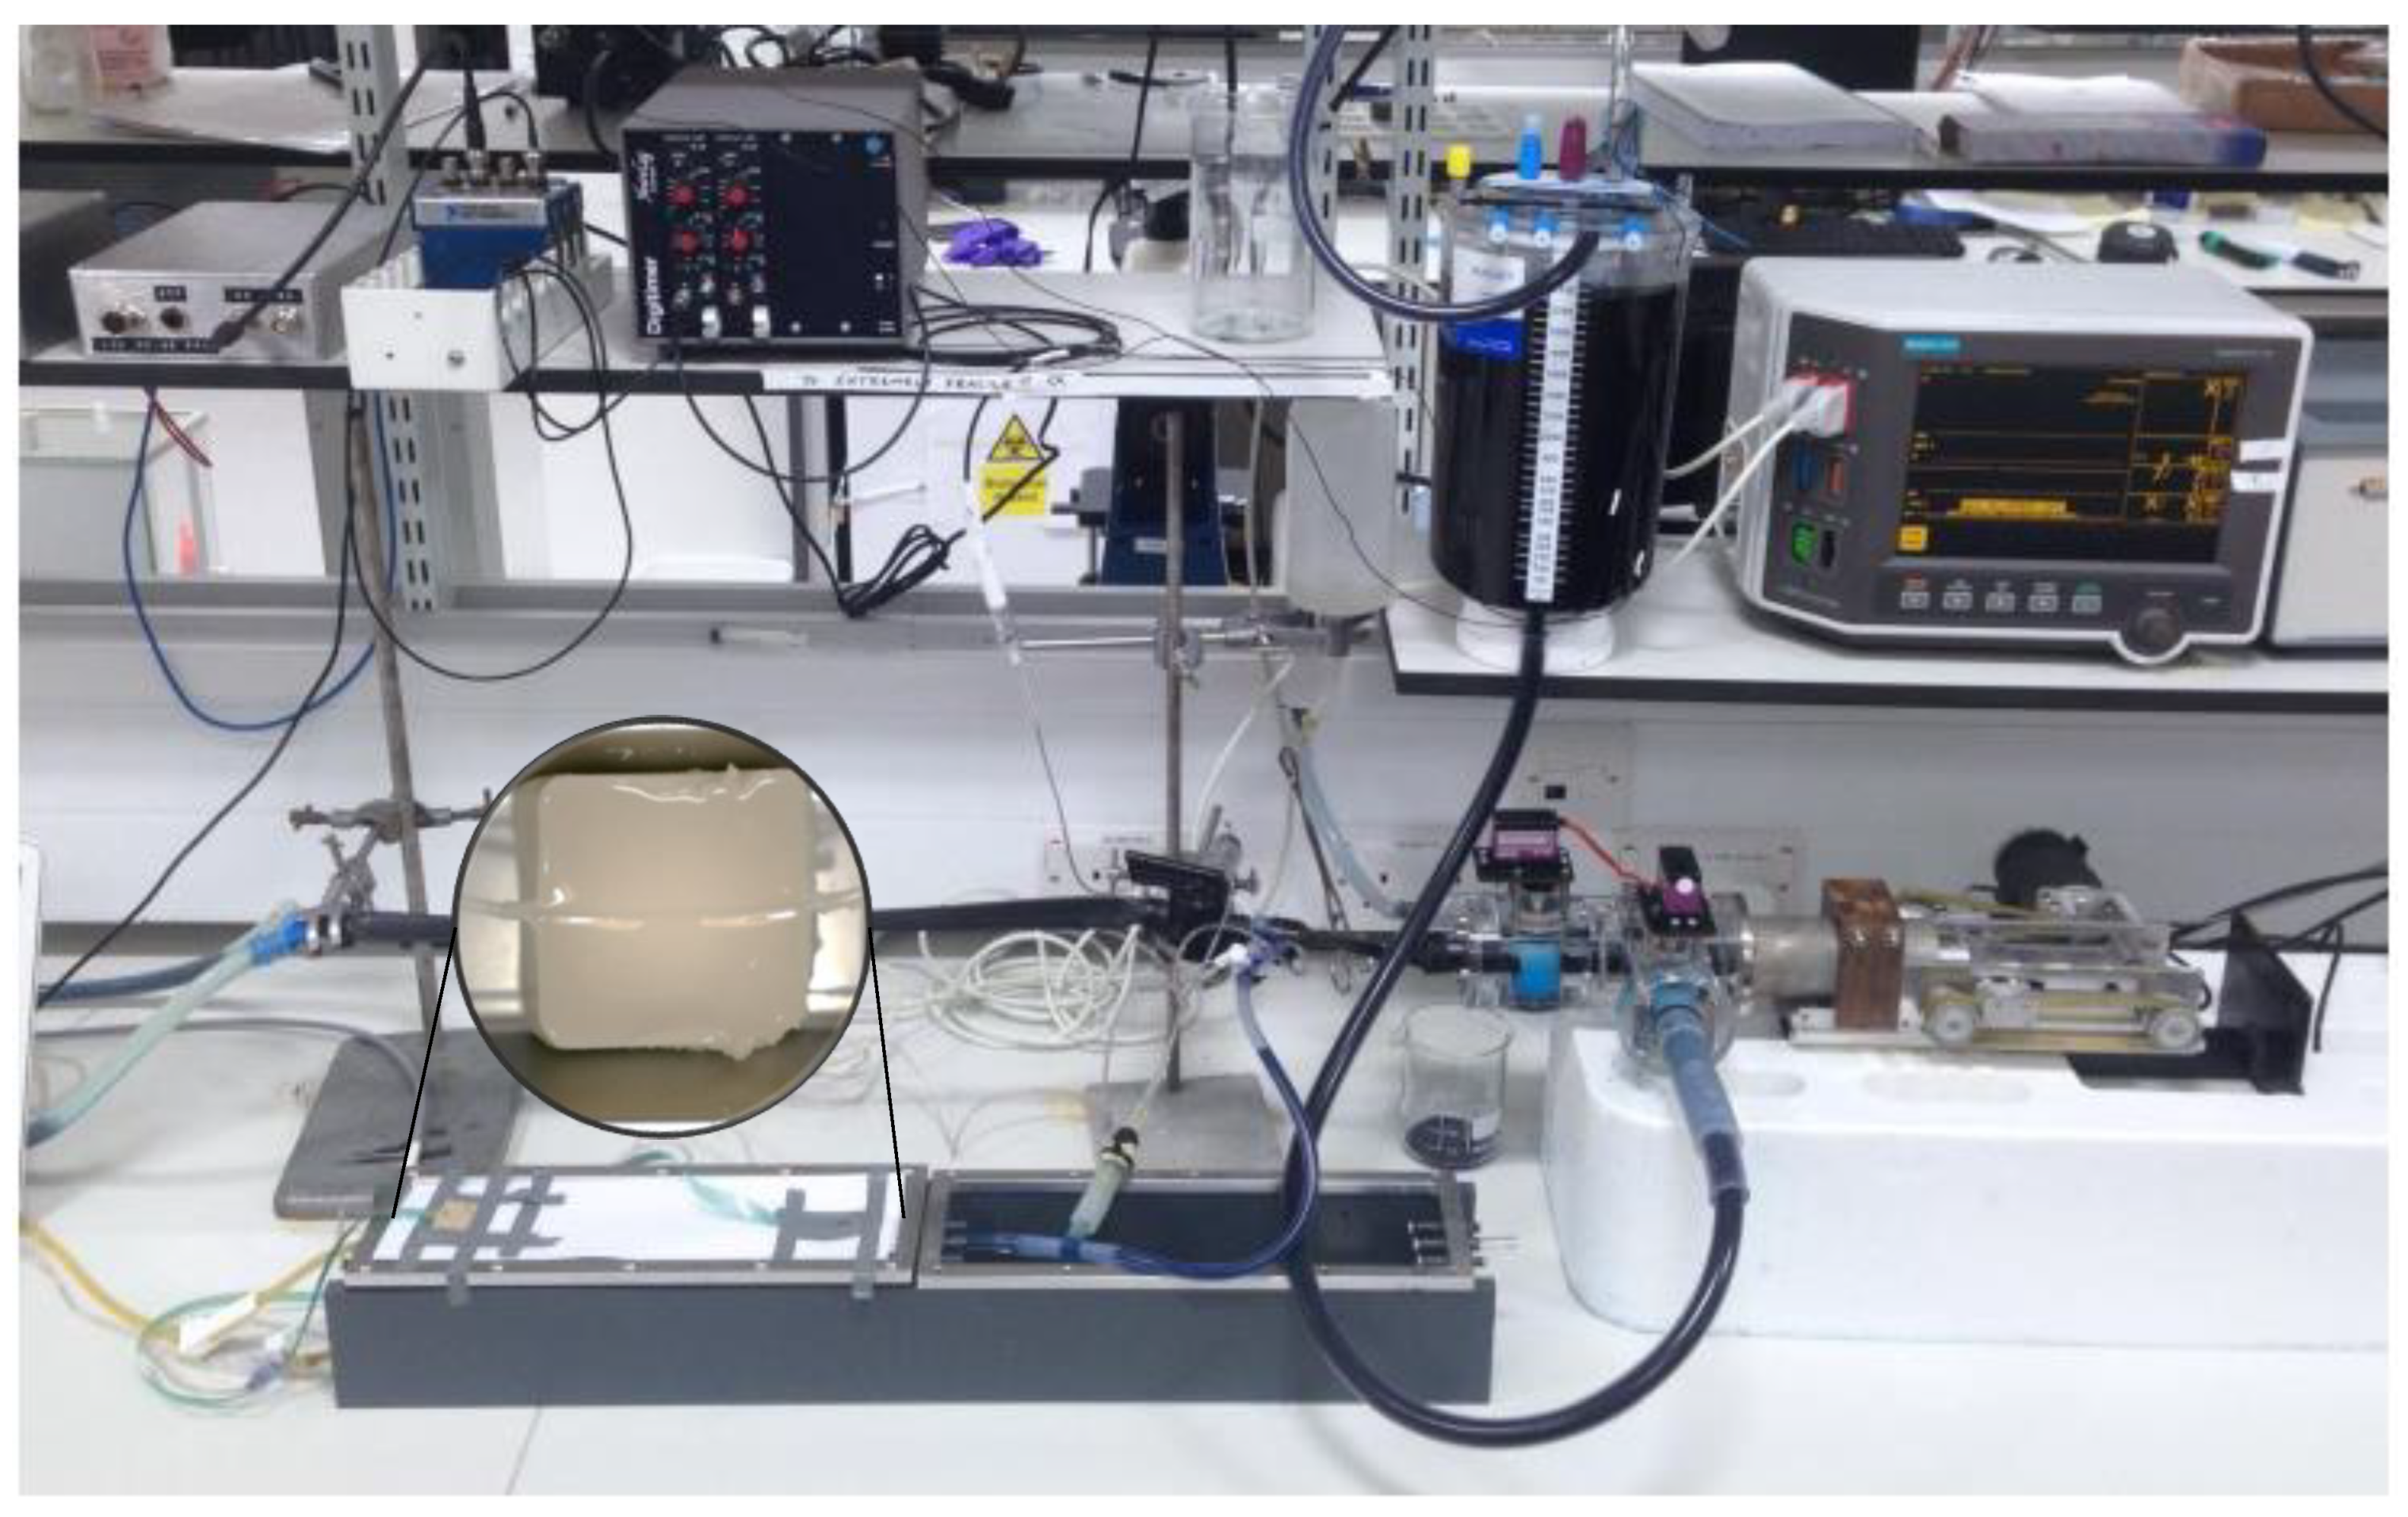
The final result of the in vitro model is shown in
Figure 5, where the main components of the closed-loop circulation circuit are depicted. From right to left, the figure presents the pulsatile pump (heart), reservoir, silicone vessels (arteries), intracranial chamber, and brain phantom.
The predictive model appeared to satisfactorily explain the variance observed in the measurements, with coefficients of determination equal to R2 = 0.90, R2 = 0.97, and R2 = 0.98 for the three datasets, respectively.
Figure 6 shows the scatter plots between the non-invasive ICP predictions against the reference invasive ICP measurements. The predicted nICP showed high correlation with the reference invasive ICP, and the computed Pearson’s correlation coefficients between the nICP and invasive ICP were r = 0.95 (
p < 0.01), r = 0.98 (
p < 0.01), and r = 0.98 (
p < 0.01), respectively, for Dataset 1, Dataset 2, and Dataset 3.
When comparing the residuals of the prediction error between nICP and ICP, the nICP demonstrated an acceptable difference from the reference measurements. In Dataset 1, the predicted nICP was observed to have a higher root-mean-square-error, equal to RMSE = 3.12 mmHg, whereas the measurements in Dataset 2 and Dataset 3 showed a lower error, respectively, of RMSE = 1.48 mmHg and RMSE = 1.45 mmHg.
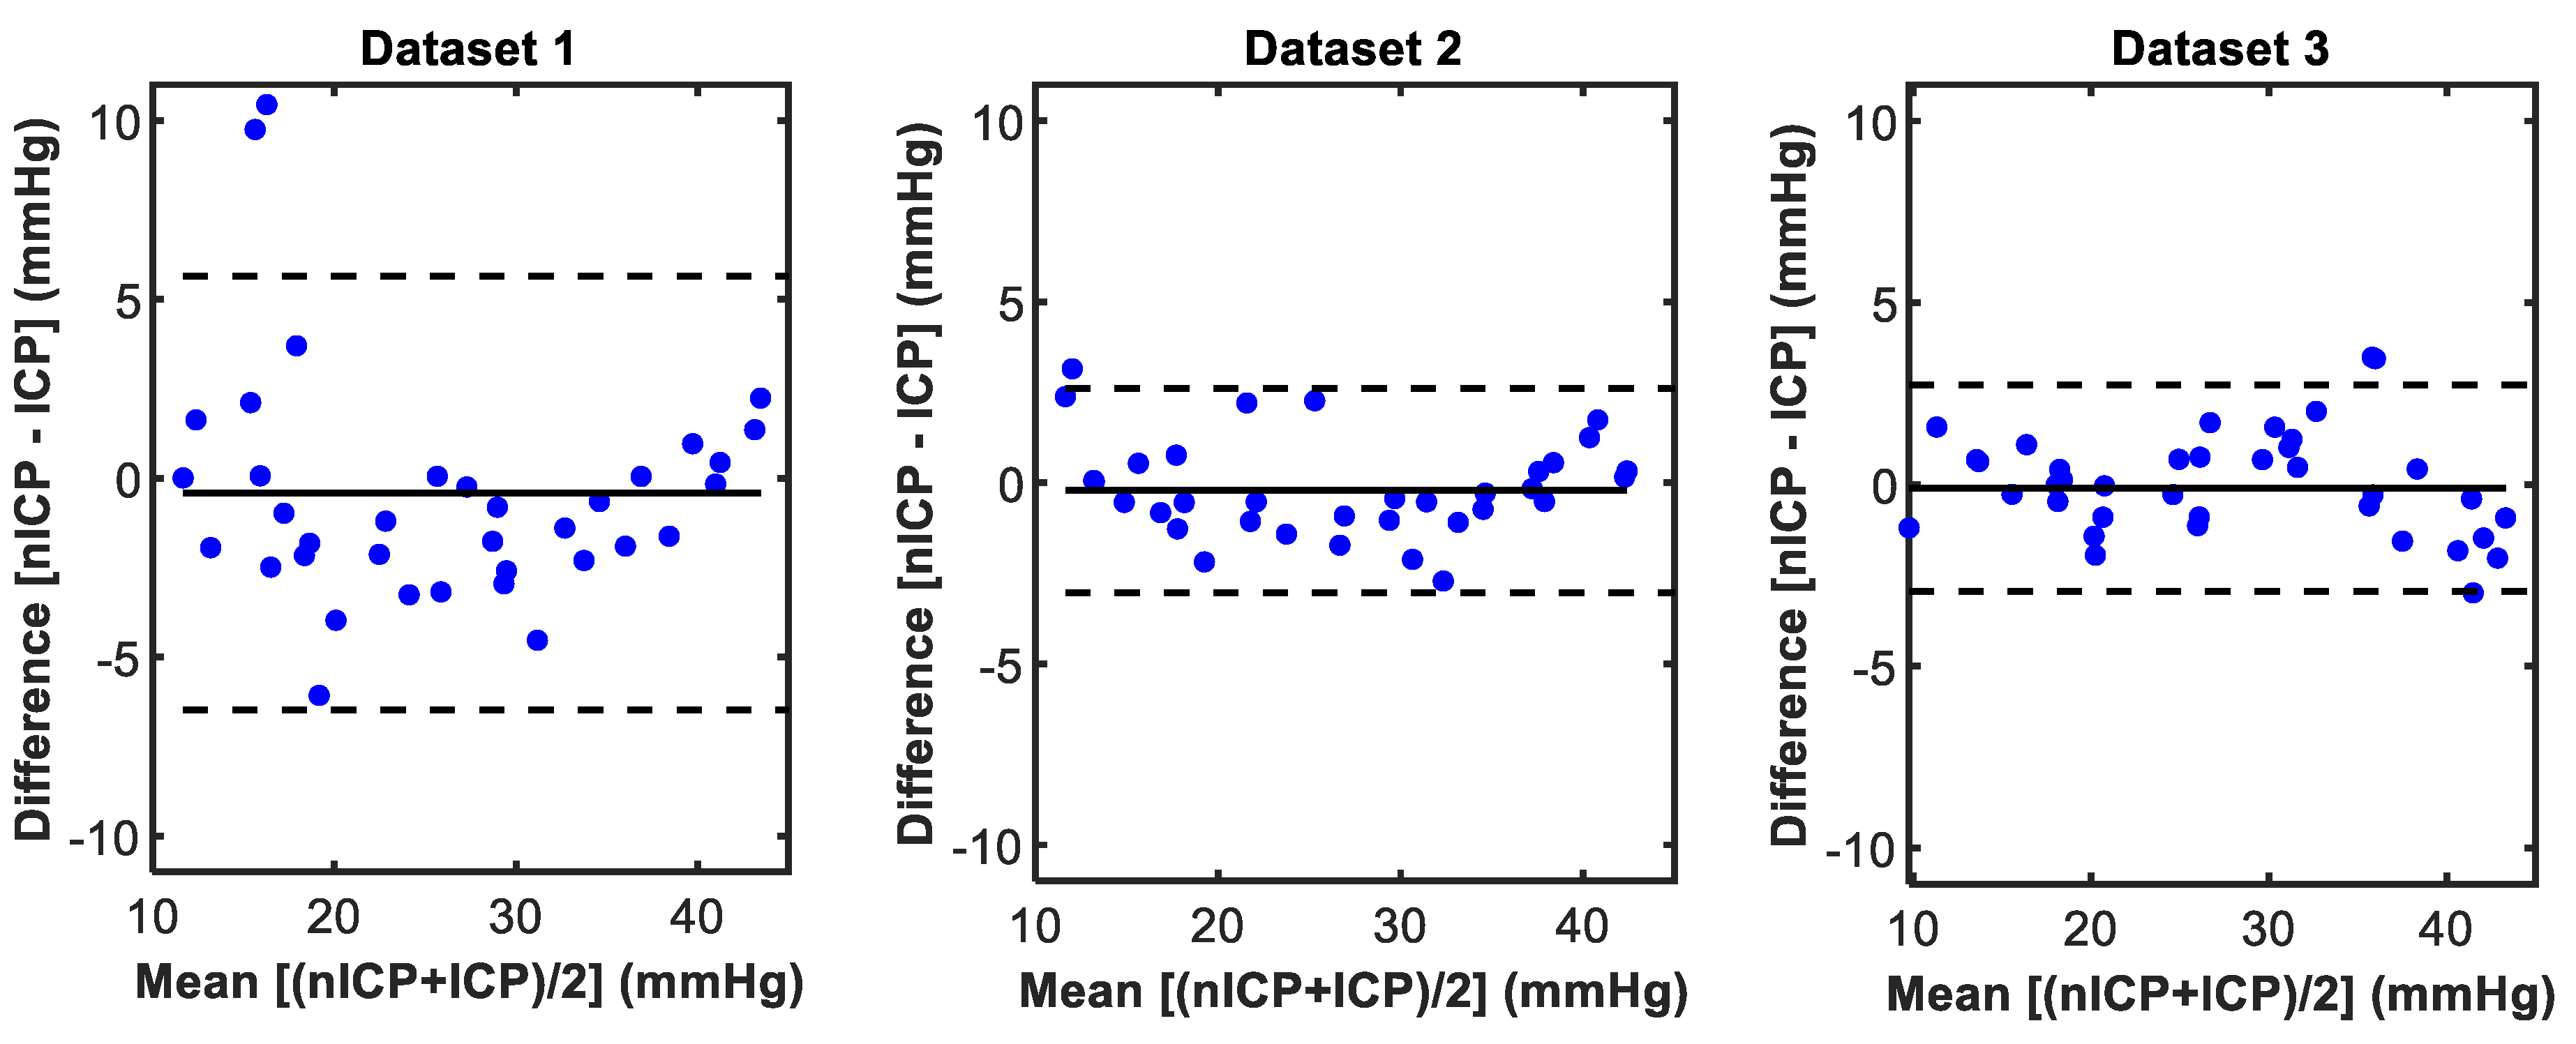
The Bland and Altman analysis of agreement provides a visual and statistical method to assess the agreement between two measures.
Figure 7 displays the Bland and Altman plots between the predicted nICP and the reference invasive ICP measurement for all three datasets. Dataset 1 showed a low bias of −0.4 mmHg between the two measurements, but also displayed a wider interval of agreement of ±6 mmHg. Datasets 2 and 3 showed both low bias and narrower deviation, with limits of agreements of −0.2 ± 2.8 mmHg and −0.4 ± 2.8 mmHg.
4. Discussion
The work presented in this paper describes the development and evaluation of a non-invasive PPG-based ICP monitor in an in vitro model. The very promising results indicate that the ICP may be measured non-invasively using PPG signals, and this sets the ground for further exploration and validation.
Due to the invasive nature of the currently available ICP monitoring systems, the validation of new instruments relies on clinical testing performed on patients who require a standard invasive ICP monitor as part of their medical treatment. This limits the range of testing that can be performed to evaluate the efficacy of new instruments. In vitro models are used to recreate complex pathophysiological phenomena in a controlled environment, and they present a great advantage in this particular application. An in vitro model simulating changes in ICP offers the capability to evaluate a technology in a proof-of-concept stage and guide further developments prior to in-human or animal investigations.
The work by Bottan et al. and Benninghaus et al. in developing a phantom model of intracranial physiology stands out, as their models recreated the complex dynamics of the intracranial circulation in detail [
17,
21]. Although our model presented a more simplistic representation in terms of cerebral haemodynamics and geometry, it also combined optical modelling for its specific application. Several optical phantoms have been reported in the literature for different purposes [
22]. These phantoms either simulated the optical properties of tissues only in a ‘static’ form [
23,
24,
25] or recreated both optical and haemodynamic properties of tissues [
26,
27,
28,
29]. Our in vitro phantom mimicked general optical properties, and also simulated the haemodynamic and mechanical properties of the intracranial environment (i.e., cerebral arteries and mechanical properties of brain under compression). Therefore, the phantom in this paper uniquely combines different properties of cerebral/intracranial circulation, and a similar model may be used and refined in the future by other researchers in this field.
Cerebral tissue (brain), blood, and CSF are the main components of the intracranial volume, and intracranial pressure comprises a vascular and a CSF component. The former relates to the arterial and venous cerebral vasculature, and it is responsible for the cardio-synchronous pulsations visible in the ICP waveform. The CSF component is the main player in the variations in ICP and external drainage, and may be used in the management of intracranial hypertension [
3]. The in vitro model described in this paper mimicked both components, as the presence of the vascular component was represented in the ICP waveform (see
Figure 3), and CSF pressure was used to increase or decrease the ICP within the intracranial chamber. Although the CSF is continuously produced and flows within the cranial cavity, as simulated accurately by Bottan et al. [
15], we used a simplified approach with a ‘static’ CSF pressure, without recreating the CSF flow. This allowed us to easily vary the ICP in the intracranial chamber within the physiological range, and to evaluate the proof-of-concept of our nICP monitor. Undoubtedly, intracranial hypertension can also be caused by brain swelling, space-occupying lesions, or a combination of different causes, but a scenario simulating the build-up of CSF was the most straight-forward approach. Further refinements of the model could include mimicking CSF flow, as well as simulating the optical properties of the CSF and recreating the more complex dynamics of intracranial hypertension following brain swelling or haemorrhagic lesions.
The correlation between the invasive and non-invasive instruments observed in this work showed that the noninvasive optical ICP monitor was effectively able to follow the trends in ICP changes during the protocol. This provided reassurance that the extracted PPG features correlated with changes in ICP, as initially hypothesised. Among the features extracted, the PPG Pulse Amplitude and Upslope were the highest contributors to the prediction, and the most correlated to the changes in ICP. However, it may be premature to conclude which of these features may be most representative of the changes in cerebral haemodynamics due to increased intracranial pressure. Further analysis on this aspect from in vivo measurements will shed more light on which PPG features are the highest contributors to the prediction of non-invasive intracranial pressure. The estimated nICP also showed a good accuracy (i.e., low RMSE) and good agreement in estimating absolute values of ICP when compared to the reference ICP. The accuracy of different invasive ICP sensors has been reported to be in the range of 0.7–2.3 mmHg [
30], whereas the expected accuracy is ±2 mmHg for ICP < 20 mmHg or ±10% for ICP > 20 mmHg [
31]. For these reasons, the accuracy between the nICP monitor and the reference invasive ICP sensor observed in this investigation was well in line with the expected error for a new ICP measuring technique. The morphology between the optical signals and the invasive pressure signals is different; therefore, this tool would only be implemented to estimate non-invasive mean ICP values for a period of time, based on the features extracted from PPG signals. Accordingly, the clinical information provided by the percussion, tidal, and dicrotic waves, commonly found in invasive measurements [
32], would not be provided by the non-invasive device.
As also described above, the in vitro model developed in this study had some limitations, which should be discussed in the context of future research on the subject. The ratio between the chamber and the brain phantom did not fully resemble the dimensions observed for the human anatomy. The dimensions of the brain phantom were chosen to facilitate the connection of the inlet/outlet tubing on the internal sides of the chamber and to provide space for the ramification of a vascular network. The different dimensions between the brain phantom and chamber did not have any impact on simulating the intracranial pressure, which we successfully replicated, and it was in line with the typical ICP waveform and values observed in human cerebral haemodynamics (see
Figure 3). Due to the properties of the silicone gel utilised to fabricate the brain phantom, it was not possible to dissolve optical absorbers such as India ink, which are commonly used in similar phantoms. Therefore, the brain phantom could not replicate the absorption properties of the brain. However, we needed to trade off this aspect with the essential mechanical properties required to realistically recreate the intracranial pressure. Nevertheless, we were still able to dissolve scattering particles in the brain phantom in order to allow the reflectance diffusion of near-infrared light from the light emitter to the photodiode. Additionally, it is recognised that the PPG waveform is impacted by multiple physiological parameters, such as respiratory rate and artery stiffness, among others [
33,
34,
35]. As an in vitro evaluation, there are inherent limitations that did not allow for the implementation of all these physiological parameters. Although limited, the current brain phantom allowed us to validate the proof-of-concept in this study, and we hope to see more dedicated research in the future where both exact optical and mechanical properties of the brain will be simulated in phantoms, thus further advancing the ability to recreate cerebral opto-haemodynamics.


 ,
, 


