Abstract
Wood used in production processes can be infected by various fungi growing on its surface. The presence of fungi on the wood surface results from the method of storage, handling and transport of the wood. However, the presence of fungi on wood carries a high risk to the health of production operators and users. At the same time, it has a negative impact on the quality and durability of manufactured products. Because of the risks indicated, an attempt was made to develop an industrial, automated system for detecting fungal infections. This paper presents a vision method for detecting fungal infections on the wood surface. A description of the vision system using the laser triangulation method (LTM) to build a three-dimensional surface image is shown. The paper consists of an analysis of the imaging resolution and a description of the concept of using laser illuminator power selection for identifying fungal-infested surfaces. Imaging results for the selected wavelength of electromagnetic radiation are presented. Measurements and parameters describing the identified areas are shown. It was found that it is possible to choose imaging method parameters and laser illumination power allowing identification under industrial conditions of a fungus-infected region on a wood surface while using the image to determine product measurement parameters.
1. Introduction
The industry, which uses wood in various forms, relies on material supplied by sawmills. One of the critical tasks associated with quality control of the provided material is the control of defects present in the material. Defects come in many different forms. One can distinguish between defects related to the machining, which include all kinds of lack of dimensions required, i.e., faults in boards’ width, length and thickness and defects on milled or drilled surfaces. Natural defects can also be identified, such as the presence of knots and internal cracks that disqualify the material. The types of defects and their classification depend on the industry using wood as a material. This paper presents the results of a study and a system developed for the wood pallet production industry. Material defects are defined by the quality standards applicable to European Pallet Association (EPAL) and Commonwealth Handling Equipment Pool (CHEP).
The rapid increase in production efficiency of process lines used in the woodworking industry is also linked to the automation of the quality control process for materials and manufactured products [1]. Statistical process control (SPC) is insufficient due to increasing customer demands. In the age of automation and industry digitalization, quality control of all products leaving the production line is required. The dynamic development of cyber-physical systems makes it possible to realize continuous production control and observation in production management systems of critical parameters describing the quality of materials and products [2]. Currently, manufacturers of specialized machines are forced to equip the machines with control systems that carry out selected inspection tasks directly at the production stations. For example, studies are carried out to optimize the cutting of boards in sawmills, to control the surface of the wood in the furniture industry and monitoring of the absence of structural defects in boards as a construction material [3,4,5,6,7]. In addition, quality control of the finished products just before shipment to the customer is also realized to improve the companies’ financial performance [8].
Methods for quality control of wood materials have been developed for many years to evaluate the internal parameters of wood and assess the dimensions and surfaces of wood. Based on thermal radiation, imaging is used to determine wood damage by fungi and insects [9,10]. Methods based on ultrasound detection allow the detection of internal defects in the wood [11]. Similarly, internal defects can be detected using computed tomography [12,13]. Wood defects visible on the surface are imaged using monochrome or colour cameras that allow 2D image acquisition. This type of imaging is used to look for knots, cracks or other surface defects [14].
The development of surface defect classification methods was based on edge analysis, area segmentation techniques or parameters describing areas in the image [15]. However, the high variability occurring on the wood surface in terms of changes in surface colour, changes in defect shape and colour, and variability in the geometric structure of the wood surface made the construction of a universal defect inspection system significantly difficult [16,17].
With the development of information technology, imaging and various artificial intelligence algorithms have been applied to wood surface analysis tasks [18,19]. These methods have completely changed the approach to identifying wood defects. The possibility of learning with different types of artificial intelligence algorithms from images of real defects occurring on wood has given great flexibility in their identification on surfaces [20]. The combination of classical methods of wood image analysis and methods using artificial intelligence algorithms allows for the realization of a wide range of parameters describing wood and product surface parameters used in the Smart Industry [13,21,22,23,24]. However, the industrial application of artificial intelligence algorithms for high-resolution images may prove difficult or impossible in many tasks due to the required time.
Three-dimensional imaging methods are also used in wood quality assessment tasks [25]. Within these methods, one can distinguish ways which require the product to stop during image registration. Methods that enable the image registration of a product moving on the processing line can also be identified. Depending on the imaging method, vision systems will allow the registration of images with different resolutions [26]. The choice of method is also influenced by the time taken to build a three-dimensional image which, for industrial applications, is one of the critical parameters determining the choice of vision system type. Analysis of 3D images allows the assessment of surface defects and knots localization on the surface of boards regardless of the variation in the color of the observed surface [27]. It also allows the assessment of the geometric structure of the board and tree bark [28]. 3D imaging enables the measurement of a much larger number of parameters in terms of spatial and surface dimensions realized in terms of quality control of the materials used in production.
Industry standards define the quality of wood used in manufacturing wood products. For the production of wood pallets according to EPAL and CHEP standards [29,30], the presence of fungal infections is considered a defect in the material, defined as ‘rot’. Our research and analysis of the literature in this area indicate that blue-green fungi are most commonly found on the surface of the wood [31]. Depending on the season, up to a dozen blue stain fungi were identified. For example, one of these is Ceratocystis pinicola, which is visible as characteristic, with extensive blue-black discoloration often reaching up to several centimeters deep into the wood. Examples of identified infected surfaces on material supplied from sawmills are summarized in Figure 1.
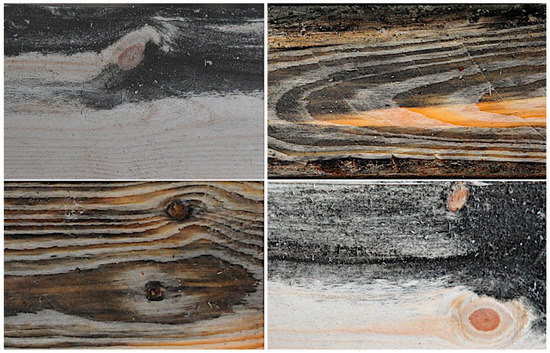
Figure 1.
Examples of fungal infections: the fungus Ceratocystis pinicola visible on the surface of boards delivered from the sawmill.
The research described in this paper aimed to develop a system to identify fungal infections on a wood surface. In addition, it was assumed that the system would work under industrial conditions allowing the inspection of all boards entering the production line. The identification and rejection of infected boards are intended to improve the quality of the final product. It is also designed to eliminate the cost of repairing a finished product for which infected material has been used. Due to the production cycle, imaging of the plank surface should not be longer than 1 s, and the analysis and identification of infected planks should also be carried out in less than 0.5 s. In addition, it was assumed that it should be possible to determine the dimensions of the boards on the image during the inspection.
Achieving such an objective required the development of an imaging method that enables the entire task of inspecting the surface quality of planks to be carried out in flow-through mode. This means that the object being inspected, a plank, is not stopped in the production line. The planks are moved on a conveyor belt, and an image of the surface is captured during their movement. The image is then analyzed, after which a surface evaluation result is issued. This result is used by the sorting system, allowing defective boards to be removed from the process. This research was carried out as part of a project to improve manufacturing quality by eliminating defective materials, such as fungus-infected boards.
2. Methods of Surface Imaging
This paper presents the subject of the identification of defects associated with the presence of various surface infections observed as fungi. For this, a 3D image was made using the LTM with control of the laser illuminator power. As part of the preparatory work, tests were carried out on material in the form of boards supplied by sawmills. Some of the boards delivered from sawmills were found to be infected with various fungal species. Fungal infections on the surface of boards originate and develop both at the stage of wood storage in the forest and processing in sawmills. Defects may also develop during the transport of boards from the sawmill to the factory. Studies to identify the type of fungi that develop most frequently on the surface of boards have found the presence of blue-rot fungi, rot fungi and mold fungi [31,32,33].
Both 2D and 3D imaging methods were considered in the process of selecting the imaging method. Due to the need to image different species of wood (pine and spruce) and the need to image a product in motion, moved-on conveyors, an imaging method based on the use of LTM and the construction of a 3D image of the product was selected.
Recording an image using the LTM involves determining the height profiles of the object and combining these profiles in a 3D image. Imaging is carried out using a RangerE area scan camera and laser line illuminator (Figure 2a). The camera is positioned at an angle to the laser beam. It captures an image of the laser line visible on the surface of the object (Figure 2a,b). A height profile is then determined based on the geometric relationships resulting from the camera’s geometry and laser setup. Based on the analysis of the beam image and knowledge of the camera’s parameters and laser alignment geometry concerning the object, the height profile in a cross-section perpendicular to the surface is determined (Figure 2c).
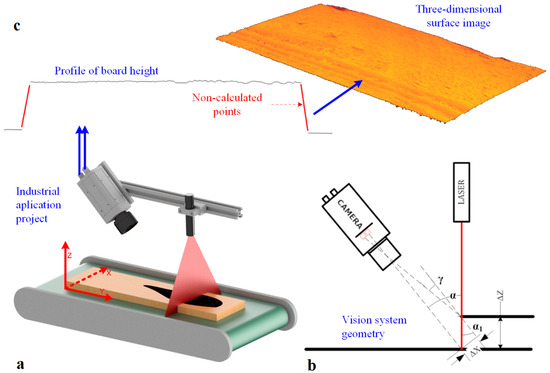
Figure 2.
3D surface image acquisition: (a) vision station model, (b) vision system geometry configuration, (c) height profile and the 3D surface of the board.
By determining a set of height profiles for successive positions of the object moved with respect to the laser-camera system along the Y-axis, a description of the surface of the object under study is realized (Figure 2a). A three-dimensional image of the object surface is built by accumulating profiles in a matrix in its successive rows.
The number of measurement points forming a single height profile corresponds to the number of columns on the sensor. The number of profiles determined for an object corresponds to the number of rows in the matrix.
For 3D vision systems using the LTM, the coordinate system is adopted in such a way that the X-axis is parallel to the laser plane. The Y axis is adopted according to the object’s direction of movement during the determination of successive height profiles.
The resolution of a 3D vision system is the minimal visible change in the measurement that can be recorded in a 3D image. For imaging with 3D vision systems, the resolution is determined in the direction of the three axes of the coordinate system associated with the measurement and control station. The following designations are used in this paper:
—resolution in the X-axis direction, i.e., along the laser line,
—resolution towards the Y axis, i.e., the axis perpendicular to the laser line and, at the same time, the direction of movement of the object under examination,
—resolution in the Z-axis direction of the vision system coordinate system.
When calculating the imaging resolution in the configuration shown in Figure 2b, an approximation is used in which we assume that the angle α is equal to the angle . In reality, the angle . 3D vision systems use resolutions of = 0.1 mm or greater. Consequently, this simplification does not significantly affect the value of the determined resolution. The imaging resolution in the Z-axis is determined from the relationship:
α—the angle between the optical axis of the camera and the optical axis of the laser.
The 3D imaging resolution of the plank surface was calculated considering the dimensions of the board subjected to surface inspection (Figure 3). These dimensions were assumed to be 1200 × 145 × 22. The imaging field of view (FOV) was selected to be larger than the test object for such a defined test object.
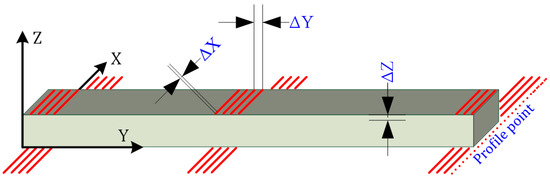
Figure 3.
3D imaging resolution described on the object.
Resolution calculations for each X, Y and Z axis of the measurement system were made for the 1536 × 512 sensor from the RangerE camera. The 3D image contains 1000 profiles in the Y direction. The following parameters were assumed for the calculations:
α = 30° to 70°,
FOV = 160 mm X-axis imaging field expressed in mm (boards = 140–160 mm),
RM = 1400 pixel X-axis imaging field expressed in pixels (usable resolution of the sensor).
The geometry of the vision system and the choice of camera mounting angle and la-serial illumination were selected based on an analysis of the possible installation conditions of the triangulation measurement system on the production line. It was assumed that the angle α could be set between 30° to 70° (Figure 4). For such a selected range, the characteristics of the variation of resolution in the Z-axis as a function of α angle were determined.
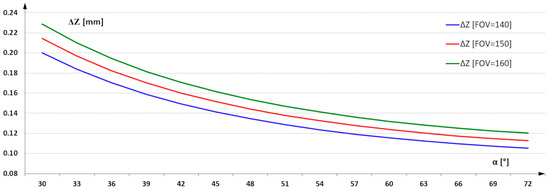
Figure 4.
3D imaging resolution in Z-axes as a function of α angle.
For an angle of 30°, the imaging resolution for a FOV = 160 mm is 0.25 mm/pixel, and for an angle of 70°, it reaches 0.1 mm/pixel. Imaging with this resolution allows from 16 to 100 measurement points to be captured over an area of 1 mm2. For the task of detecting infection, this resolution is surplus to requirements. Infected regions have significantly larger surface areas. The use of resolution at the designated level allows the additional task of assessing the quality of the geometric structure parameters of the board surface and its dimensions. The focus of this paper is on the selection of image acquisition parameters that enable the effective identification of infected areas. As a result of the analysis carried out on the imaging resolution, a resolution of 0.25 mm in the X and Y axes was used as a sufficient parameter. This means using 16 measurement points to describe an area of 1 mm2. The reduction in the number of points describing the surface was also intended to reduce the analysis time of the entire image of the board surface. The reduction in time was required due to the need to inspect successive boards fed into the production line.
Preliminary imaging was carried out using the comparison method. Two board surfaces were imaged simultaneously, a board without infection and a board infected with blue stain fungi (Figure 5). A 658 nm laser with a power of 20 mW was used in the study.
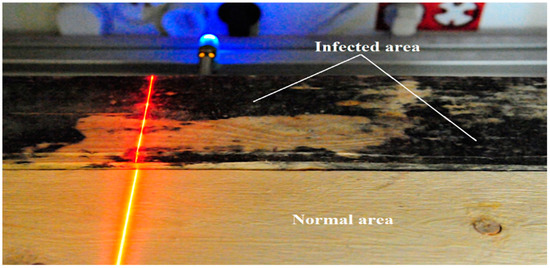
Figure 5.
Illumination of the surface of a healthy board and a board infected with blue-veined fungi using a 658 nm laser and a power of P = 20 mW.
Imaging with an assumed resolution of 0.25 mm in the X and Y axes and using a 20-mW laser allowed the construction of images of both surfaces (Figure 6), even though one of them is significantly infected. The 3D image of the surface was constructed at a frequency of 500 profiles per second. Using a laser of sufficiently high power (e.g., 20 mW), allows the acquisition of a three-dimensional image of the surface regardless of the presence of infection. The laser beam is visible on the boards. Dispersion and absorption on infected surfaces do not cause differences in imaging of infected and non-infected areas. This imaging strategy can be used to measure board dimensions without infection detection. In order to detect infected areas, the laser power should be reduced so that infected surfaces change the visibility of the laser beam due to scattering and absorption. In contrast, surfaces without an infection should still be imaged correctly.
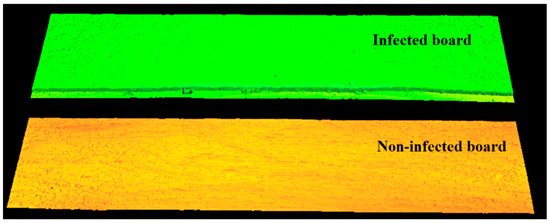
Figure 6.
Three-dimensional image of the surface of both boards recorded at 20 mW laser power. No occlusion on the infected area can be seen due to excessive illuminator power.
Figure 6 is not intended to indicate which board is infected. Its purpose is to indicate that with too much laser power we are not able to distinguish which board is infected and which is not. In order to distinguish between infected and non-infected boards, research must be carried out and the laser correct power has to be selected according to the method presented in this paper.
Tests carried out during the image acquisition parameter selection phase indicated large differences in the reflection of the laser beam in infected and non-infected areas. The image of the laser beam recorded on the vision system sensor depends on the laser beam’s interaction with the material’s surface to be illuminated.
The observed differences are, therefore, due to the change in absorption and scattering of the laser beam projected onto the infected surface relative to the normal wood surface. The image of the laser line visible on the normal surface is continuous and clearly visible. In contrast, the laser line image observed in infected areas is characterized by a much smaller width and lower intensity (Figure 7).
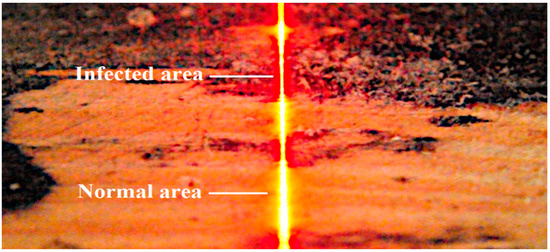
Figure 7.
Laser line scattering on the surface of the board with healthy and infected regions.
It was decided to use this observation to differentiate between the right and infected areas on the 3D image. In the next stage of the study, imaging was performed using reduced laser power. This study aimed to determine the minimum laser power sufficient to image infection-free surfaces correctly. For a power of 7 mW, an image was obtained in which an infection-free area was correctly registered on both boards (Figure 8). On the surface of the board where the infection is present, the laser beam at 7 mW was absorbed in the areas covered by the infection, and a full height profile could not be determined. At this power, the infected areas are not imaged. Only the area of the board that is not infected is visible on the 3D image. The entire area is correctly imaged for the non-infected board visible in the lower part of the figure.
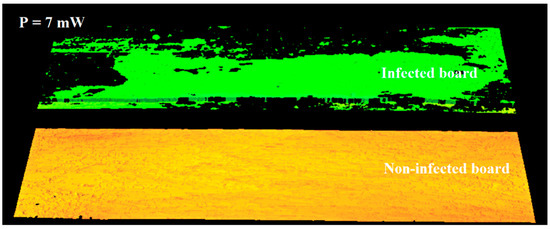
Figure 8.
Three-dimensional image of a surface acquired using 7 mW power.
The fungi on the wood surface significantly limit the possibility of observing the low-power laser beam. The 2D image of the laser beam projected onto the infected surface is not visible on the camera sensor. The reason for this is the absorption and scattering of a laser line on the surface.
In order to assess the differences in imaging of healthy and infected surfaces, a series of comparative studies were performed using laser powers from 1 mW to 20 mW. Selected images are presented in Figure 9.
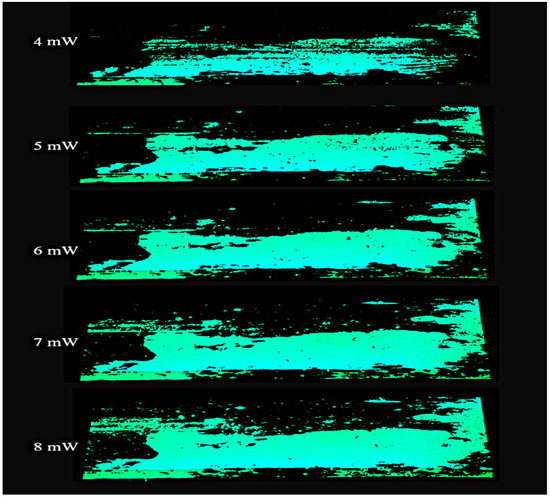
Figure 9.
Image of a non-infected region area on the board surface recorded with a laser operating at a power range of 4 to 8 mW.
Only the wood surface without fungal infection is observed in the images shown above. Too low power does not allow correct imaging of surfaces without infection. Too high of power, however, enables imaging of the infected surfaces. It is, therefore, necessary to determine the laser power at which normal surfaces are imaged correctly while infected surfaces are invisible.
The infected area was identified by measuring the obtained area on the three-dimensional image (Figure 10). On both surfaces, i.e., the board without infection and the board with visible infection, two measuring fields of the same dimensions were defined. On the surface without infection, measurement field P1 was defined, and on the surface containing infection, measurement field P2 was defined.
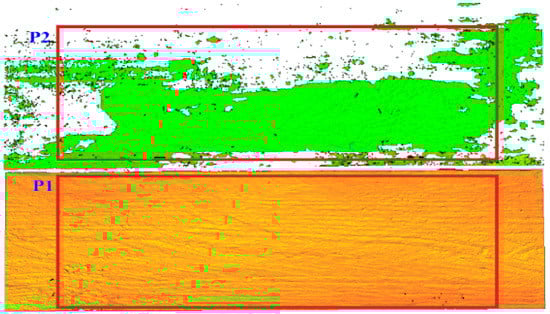
Figure 10.
Definition of the measurement area P1 and P2 in the uninfected and infected area.
The measuring fields in both cases include the 270,000 measuring points that make up the surface. If both measuring fields were set up on the non-infected wood surface, the measurement result should be the same and indicate a value of 270,000 points. However, as the laser power is reduced and the laser beam is scattered on the infected surface, the number of points classified as valid surfaces in the P2 area will be lower. Points describing a non-infected region are marked in green in the P2 field. A decrease in the area score is an indicator of the presence of infection on the imaged surface.
For an assumed laser power range of 1 mW to 20 mW, 20 images were recorded. The number of points describing the uninfected area was then determined for each image. These tests were then repeated for several dozen boards in order to verify and compare the results obtained.
Single profiles can also be used to assess the presence of infection. In this case, the construction of a complete image of the surface is dispensed. Only the profile to be analyzed is recorded. The intervals between recorded profiles must be chosen to the linear speed of the transported plates. Figure 11a shows an image of an entire infected board taken at a power of 7 mW. Only one example profile is indicated in this image, which was analyzed. An image of the profile and its immediate vicinity for different powers is shown in Figure 11b. In contrast, the shape of the profile as a function of laser beam power is presented in Figure 11c.
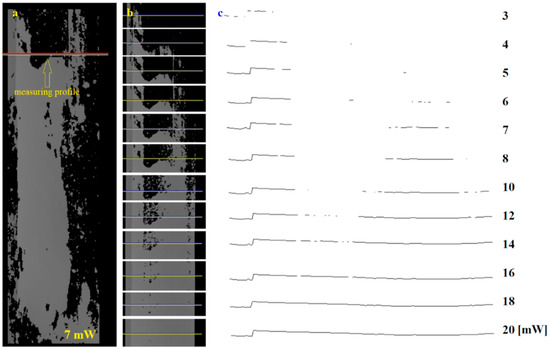
Figure 11.
Analysis of the selected height profile on the board surface: (a) 3D image with the selected profile for surface inspection, (b) image fragment with selected profile recorded at different laser powers, (c) profile shape for power from 3 to 20 mW.
For each profile, the continuity of the profile shape or a measurement of its length should be carried out to assess the presence of an infected area. The continuity of the profile can be investigated by determining the number of edges (gaps) present in its extent. Alternatively, the length of the profile can also be measured. Both indicators make it possible to determine the presence of infected areas (Figure 11c).
Analysis of the shape of the profiles and their continuity enables the presence of infected surfaces to be assessed very quickly. Analysis time can be reduced to as little as 1 ms. However, we are not considering the entire image, only selected profiles spaced, for example, every 100 mm on the board. Therefore, we do not have complete information about the board’s surface. In applications requiring accurate, i.e., 100% surface analysis, a whole surface image should be built and analyzed.
3. Results
The results of area measurements for infected and non-infected areas are presented in Figure 12. The curves in the graph show the result of the area measurement as a function of the laser power used to build the 3D image.
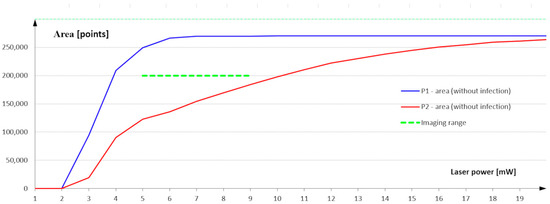
Figure 12.
Measurement of surface area as a function of the laser power used to build a 3D image of the surface.
The characterization analysis shows that, with laser power in the range of 1 to 5 mW, the surface area measured in the measurement field P1 defined on the infected surface is not constant. Using such a low laser power also results in a scattering of the laser beam on the non-infected surface that is so strong that it is impossible to determine the height profile points correctly and to build the 3D image correctly. The surface measurement in the P1 field stabilizes at a power of 6 mW, close to the maximum value resulting from the measurement field dimension.
A second range is visible at a power of 6 to 9 mW. The measurement value in the P1 area maintains a maximum over the entire analyzed range. This means that the power range from 6 to 9 mW ensures image construction and correct classification of all points belonging to the uninfected area. This is the reference value for the measurement using the measurement field P2 defined on the infected area. The largest difference between the measurement value of the non-infected area defined in the P2 field and the maximum possible value is visible in this range. Once you are sure that the laser power correctly identifies the points belonging to the non-infected area, the measurement in the P2 field indicates how many points in this field are also classified as non-infected. The difference between the measurement in field P1 and the value measured in field P2 defines the infected area expressed in the number of infected points.
Images recorded at laser powers of 9 to 20 mW show a reduction in the difference between the measured value in the infected and non-infected regions. Part of the infected area is assigned as a non-infected area.
The laser power of 20 mW is already high enough that, despite partial scattering and partial absorption of the beam on the infected surface, it is possible to reproduce all height profiles. It is then possible to build up a three-dimensional image of the board surface even in intense fungal infections (Figure 13).
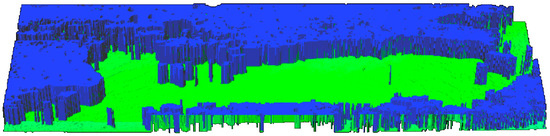
Figure 13.
View of the infected area in a 3D image captured with a laser operating power at 7 mW.
4. Discussion
Both measurement methods—i.e., measurement of the infected area and profile analysis—use the phenomenon of scattering and absorption of the laser beam in the infected areas. Measuring the surface area with a resolution of 0.25 mm in the X and Y axes guarantees the verification of 16 measurement points in an area of 1 mm2. It ensures an accurate check of the entire board surface. The use of profile analysis does not allow a detailed assessment of the presence of infection. However, it can only be used as an indicator in applications where it is impossible to build up a complete surface image of the board due to the technological line’s design.
The best results for detecting an infected surface were obtained at a power of 6–7 mW. Imaging can also be performed with laser power specified in the range of 8 to 9 mW. However, the differences in area measurement in the infected area and in the area without infection will be smaller. These differences will only be visible on heavily infected surfaces. Slightly infected areas will be counted as non-infected ones.
During the tests, it was observed that the choice of laser power depends on the moisture content of the controlled boards. An additional 20–30% increase in humidity enhances the scattering and absorption of the laser beam, even on non-infected surfaces. The laser power selected when imaging was realized in such cases increased by about 2 mW. Depending on the chosen laser power, the recording time for a single height profile and the operating frequency of the vision system must also be selected. Tests were performed with frequencies ranging from 100–500 profiles per second.
The research used a laser emitting electromagnetic radiation with a laser wavelength of 658 nm. The question arises whether the use of a laser emitting other wavelengths would have altered the scattering and absorption effect of the laser beam on the infected surfaces used. And if so, would an enhancement of this effect or weakening it be achieved? However, the choice of a different type of laser and the selection of its power should be confronted with the safety regulations applicable to production lines. These could be the subjects of further research carried out on this topic.
Most solutions presented in the literature are based on advanced conventional algorithms or algorithms based on artificial intelligence. However, this requires advanced parameterization of the vision system or a significant increase in the computing power used for such tasks. Making changes to the operation of such algorithms involves modifying them or repeating the network learning procedure [4,18,19,20].
Image acquisition is carried out while the board is being transported on a conveyor. It, therefore, does not require stopping the product for imaging. The image analysis carried out is based on a fast algorithm for surface area measurement. The time required for image analysis and display of the analysis result for the board sorting system is no more than 10 ms.
In addition, the use of laser power control makes it possible to amplify the difference between infected and non-infected surfaces already at the image acquisition stage. Operators can quickly calibrate and tune the laser power for a new batch of products. A change in wood species or a change in wood moisture content allows efficient management of the product inspection system.
The image construction using LTM enables the differences between the infected area and the area without infection to be effectively indicated. In addition, these differences are amplified already at the image acquisition stage. The evaluation of the board area can be further shortened by considering only a selected height profile for analysis. The tests and construction of the prototype vision system confirmed the feasibility of realizing the identification of infected areas with a short analysis time of 10 ms for the area measurement method and 1 ms for the profile method.
Author Contributions
Conceptualization, A.S.; methodology, A.S. and B.L.; investigation, A.S. and B.L.; writing—original draft preparation, A.S.; writing—review and editing, A.S. and B.L; supervision, A.S. All authors have read and agreed to the published version of the manuscript.
Funding
This research was co-funded by the National Centre for Research and Development of the Republic of Poland within the research program Smart Growth Operational Programme No. POIR.01.01.01-00-0165/21.
Institutional Review Board Statement
Not applicable.
Informed Consent Statement
Not applicable.
Data Availability Statement
Not applicable.
Conflicts of Interest
The authors declare no conflict of interest.
References
- Al-Refaie, A.; Lepkova, N.; Camlibel, M.E. The Relationships between the Pillars of TPM and TQM and Manufacturing Performance Using Structural Equation Modeling. Sustainability 2022, 14, 1497. [Google Scholar] [CrossRef]
- Oleskiv, O.; Mykytyn, I. Metrological verification of cyberphysical systems. Sci. J. Rzesz. Univ. Technol. Ser. Electrotech. 2015, 34, 87–92. [Google Scholar] [CrossRef]
- Yang, Y.; Wang, H.; Jiang, D.; Hu, Z. Surface Detection of Solid Wood Defects Based on SSD Improved with ResNet. Forests 2021, 12, 1419. [Google Scholar] [CrossRef]
- Yang, Y.; Zhou, X.; Liu, Y.; Hu, Z.; Ding, F. Wood Defect Detection Based on Depth Extreme Learning Machine. Appl. Sci. 2020, 10, 7488. [Google Scholar] [CrossRef]
- Jiang, Z.; Liang, Y.; Su, Z.; Chen, A.; Sun, J. Nondestructive Testing of Mechanical Properties of Bamboo–Wood Composite Container Floor by Image Processing. Forests 2021, 12, 1535. [Google Scholar] [CrossRef]
- Ruz, G.A.; Estévez, P.A.; Ramírez, P.A. Automated visual inspection system for wood defect classification using computational intelligence techniques. Int. J. Syst. Sci. 2009, 40, 163–172. [Google Scholar] [CrossRef]
- Zeng, Q.; Lu, Q.; Yu, X.; Li, S.; Chen, N.; Li, W.; Zhang, F.; Chen, N.; Zhao, W. Identification of defects on bamboo strip surfaces based on comprehensive features. Eur. J. Wood Wood Prod. 2022, 1–14. [Google Scholar] [CrossRef]
- Boulter, L.; Bendell, T.; Dahlgaard, J. Total quality beyond North America. Int. J. Oper. Prod. Manag. 2013, 33, 197–215. [Google Scholar] [CrossRef]
- Pitarma, R.; Crisóstomo, J.; Pereira, L. Detection of wood damages using infrared thermography. Procedia Comput. Sci. 2019, 155, 480–486. [Google Scholar] [CrossRef]
- Meinlschmidt, P. Thermographic detection of defects in wood and wood based materials. In Proceedings of the 14th International Symposium of Nondestructive Testing of Wood, Hannover, Germany, 2–4 May 2005; p. 6. [Google Scholar]
- Tiitta, M.; Tiitta, V.; Gaal, M.; Heikkinen, J.; Lappalainen, R.; Tomppo, L. Air-coupled ultrasound detection of natural defects in wood using ferroelectret and piezoelectric sensors. Wood Sci. Technol. 2020, 54, 1051–1064. [Google Scholar] [CrossRef]
- Wei, Q.; Chui, Y.H.; Leblon, B.; Zhang, S.Y. Identification of selected internal wood characteristics in computed tomography images of black spruce: A comparison study. J. Wood Sci. 2009, 55, 175–180. [Google Scholar] [CrossRef]
- Ondrejka, V.; Gergeľ, T.; Bucha, T.; Pástor, M. Innovative methods of non-destructive evaluation of log quality. Cent. Eur. For. J. 2021, 67, 3–13. [Google Scholar] [CrossRef]
- Hu, C.; Tanaka, C.; Ohtani, T. Locating and identifying sound knots and dead knots on sugi by the rule-based color vision system. J. Wood Sci. 2004, 50, 115–122. [Google Scholar] [CrossRef]
- Funck, J.; Zhong, Y.; Butler, D.A.; Brunner, C.C.; Forrer, J.B. Image segmentation algorithms applied to wood defect detection. Comput. Electron. Agric. 2003, 41, 157–179. [Google Scholar] [CrossRef]
- Lin, L.; He, S.; Fu, F.; Wang, X. Detection of wood failure by image processing method: Influence of algorithm, adhesive and wood species. Eur. J. Wood Wood Prod. 2015, 73, 485–491. [Google Scholar] [CrossRef]
- Wakaf, Z.; Jalab, H.A. Defect detection based on extreme edge of defective region histogram. J. King Saud Univ.-Comput. Inf. Sci. 2018, 30, 33–40. [Google Scholar] [CrossRef]
- He, T.; Liu, Y.; Yu, Y.; Zhao, Q.; Hu, Z. Application of deep convolutional neural network on feature extraction and detection of wood defects. Measurement 2020, 152, 107357. [Google Scholar] [CrossRef]
- Haciefendioglu, K.; Başaga, H.B.; Bulut, M.C.; Kartal, M.E. Automatic Damage Detection on Traditional Wooden Structures with Deep Learning-Based Image Classification Method. Drv. Ind. 2022, 73, 163–176. [Google Scholar] [CrossRef]
- Hu, J.; Yu, X.; Zhao, Y.; Wang, K.; Lu, W. Research on bamboo defect segmentation and classification based on improved U-net network. Wood Res. 2022, 67, 109–122. [Google Scholar] [CrossRef]
- Du, W.; Xi, Y.; Harada, K.; Zhang, Y.; Nagashima, K.; Qiao, Z. Improved Hough Transform and Total Variation Algorithms for Features Extraction of Wood. Forests 2021, 12, 466. [Google Scholar] [CrossRef]
- Lenty, B.; Kwiek, P.J. Quality control automation of metallic surface using machine vision. In Proceedings of the Photonics Applications in Astronomy, Communications, Industry, and High Energy Physics Experiments 2021, Warsaw, Poland, 31 May–1 June 2021; Smolarz, A., Romaniuk, R.S., Wojcik, W., Eds.; SPIE: Bellingham, WA, USA, 2021; Volume 2021, p. 28. [Google Scholar]
- Sioma, A. Quality control system of wooden flanges based on vision measurement system. Wood Res. 2019, 64, 637–646. [Google Scholar]
- Lenty, B. Tree-ring growth measurements automation using machine vision. In Proceedings of the Photonics Applications in Astronomy, Communications, Industry, and High Energy Physics Experiments 2020, Wilga, Poland, 31 August–2 September 2020; Romaniuk, R.S., Linczuk, M., Eds.; SPIE: Bellingham, WA, USA, 2020; p. 30. [Google Scholar]
- Sioma, A. 3D imaging methods in quality inspection systems. In Proceedings of the Photonics Applications in Astronomy, Communications, Industry, and High-Energy Physics Experiments 2019, Wilga, Poland, 25 May–2 June 2019; Romaniuk, R.S., Linczuk, M., Eds.; SPIE: Bellingham, WA, USA, 2019; p. 91. [Google Scholar]
- Sioma, A. Geometry and resolution in triangulation vision systems. In Proceedings of the Photonics Applications in Astronomy, Communications, Industry, and High Energy Physics Experiments 2020, Wilga, Poland, 31 August–2 September 2020; Romaniuk, R.S., Linczuk, M., Eds.; SPIE: Bellingham, WA, USA, 2020; p. 33. [Google Scholar]
- Sioma, A. Assessment of wood surface defects based on 3D image analysis. Wood Res. 2015, 60, 339–350. [Google Scholar]
- Sioma, A.; Socha, J.; Klamerus-Iwan, A. A New Method for Characterizing Bark Microrelief Using 3D Vision Systems. Forests 2018, 9, 30. [Google Scholar] [CrossRef]
- European Pallet Association e.V. EPAL. Available online: www.epal.eu (accessed on 1 November 2022).
- Commonwealth Handling Equipment Pool CHEP. Available online: www.chep.com (accessed on 1 November 2022).
- Jankowiak, R. Assessing the virulence of ophiostomatoid fungi associated with the pine-infesting weevils to scots pine Pinus sylvestris L. seedlings. Acta Agrobot. 2013, 66, 85–94. [Google Scholar] [CrossRef]
- Linnakoski, R.; de Beer, Z.W.; Ahtiainen, J.; Sidorov, E.; Niemelä, P.; Pappinen, A.; Wingfield, M.J. Ophiostoma spp. associated with pine- and spruce-infesting bark beetles in Finland and Russia. Persoonia-Mol. Phylogeny Evol. Fungi 2010, 25, 72–93. [Google Scholar] [CrossRef]
- Kubicek, C.P.; Steindorff, A.S.; Chenthamara, K.; Manganiello, G.; Henrissat, B.; Zhang, J.; Cai, F.; Kopchinskiy, A.G.; Kubicek, E.M.; Kuo, A.; et al. Evolution and comparative genomics of the most common Trichoderma species. BMC Genomics 2019, 20, 485. [Google Scholar] [CrossRef]


Disclaimer/Publisher’s Note: The statements, opinions and data contained in all publications are solely those of the individual author(s) and contributor(s) and not of MDPI and/or the editor(s). MDPI and/or the editor(s) disclaim responsibility for any injury to people or property resulting from any ideas, methods, instructions or products referred to in the content. |
© 2022 by the authors. Licensee MDPI, Basel, Switzerland. This article is an open access article distributed under the terms and conditions of the Creative Commons Attribution (CC BY) license (https://creativecommons.org/licenses/by/4.0/).