Article

Operation State Evaluation of Miter Gate Based on On-Line Monitoring and Finite Element Analysis

1
School of Transportation and Logistics Engineering, Wuhan University of Technology, Wuhan 430063, China
2
Three Gorges Navigation Authority, Yichang 443002, China
3
Hubei Key Laboratory of Hydroelectric Machinery Design & Maintenance, China Three Gorges University, Yichang 443002, China
4
School of Computer Science and Artificial Intelligence, Wuhan University of Technology, Wuhan 430070, China
*
Author to whom correspondence should be addressed.
Appl. Sci. 2023, 13(1), 381; https://doi.org/10.3390/app13010381
Submission received: 3 November 2022 / Revised: 25 December 2022 / Accepted: 25 December 2022 / Published: 28 December 2022
(This article belongs to the Special Issue New Frontiers in Advanced Manufacturing)

Abstract

:
As an essential part of the water conservancy hub, the miter gate undertakes the vital task of navigational operation and works in a complex basin with a high water level drop for a long time; therefore, it is necessary to ensure its safe operation. In this paper, taking the Gezhouba No. 2 ship lock miter gate as an example, the actual gate stress and crack signals are obtained using the online monitoring system. The stress distributions of the gate under different working conditions are studied using finite element simulation analysis. Combining simulation analysis with the collected signal analysis, the operation status of the actual gate under each working condition is evaluated. The results show that the stress analysis of the online monitoring is consistent with the finite element analysis results, which verifies the reasonableness of the sensor arrangement. The stress is more concentrated in the area of the gate shaft column, the middle door seam, and the rear flange plate during the operation of the miter gate, and the maximum stress appears on the central sector shaft column of the gate. The cracks of the miter gate mainly appeared in the lower layer of the gate body, and the cracks expand gradually during the long-term operation of the gate. The crack expansion speed corresponds to the miter gate’s stress magnitude.

1. Introduction

Yangtze River shipping is an important shipping belt in the inland navigation from southwest to east China. Three Gorges locks and Gezhouba locks are important water conservancy hubs in the middle and upper reaches of Yangtze River in China which bear the indispensable shipping tasks. As the first hub built on the mainstream of the Yangtze River, Gezhouba locks have been in use for more than 40 years. Many sudden maintenance and planned maintenance occurred due to lock failures during this term, significantly impacting navigation scheduling and transportation channels [1]. Online health monitoring is an excellent method to prevent serious failure, which was widely used on engineering structures such as the Hulan River Bridge, Haikou Century Bridge, and L-shaped structures to improve the safety factor of the systems [2,3,4]. For safety monitoring, distributed fiberoptic grating sensors are widely used in current emerging fields, such as, for example, additive manufacturing [5,6], to obtain the temperature and stress of the structure in real-time. They can also be used for the monitoring of large metal structures by using freeform robotics engineering [7,8,9]. In the safety monitoring of the Luzzone hydroelectric dam in Switzerland, distributed fiberoptic grating sensors were implanted in the dam body for the real-time monitoring of concrete temperature and stress changes [10]. Shenzhen Baoan District Xikeng Reservoir also installed an all-fiberoptic type large present safety monitoring automation system based on fiberoptic grating sensors [11]. For the structural stability and strong anti-interference ability of the sensing element, the current fiberoptic grating has been widely used in various extensive online structural monitoring engineering systems. To determine the critical monitoring position of the miter gate, Chen performed finite element stress analysis on the ship lock structure and obtained the stress distribution of each part of the lock structure [12]. We obtained the structural stability of the gate by using finite element three-dimensional, non-linear analysis on the lower head structure of the ship lock [13]. Other researchers analyzed the stability through process monitoring and control in intelligent manufacturing [14,15,16].
The repairment of the miter gate of the lock always adopts regular maintenance and post maintenance, which influences the safety of the miter gate and the economic and social benefits of the enterprise. It is necessary to adopt the real-time monitoring method to monitor the operation status of the gate to reduce maintenance and prevent accidents. The miter gate is a large, thin-walled structure, therefore the choice of the installation position of the sensor is significant to make the sensor sensitive to defect changes. Therefore, the stress distribution of the gate can be determined by finite element simulation to help the sensor location. At the same time, if the simulation results are consistent with the measured results, it is also helpful for the analysis of the gate state. Our research aims to construct a feasible online monitoring system of the miter gate and determine the failure reason using simple finite element analysis.
This paper takes the Gezhouba dam No. 2 miter gate lock as the research object and establishes the online monitoring system of the miter gate. Combining the real-time monitoring signals with the finite element simulation model, we can evaluate the critical areas of stress concentration and crack expansion of the miter gate and provide a basis for the gate fault prevention and maintenance work.

2. Monitoring Systems

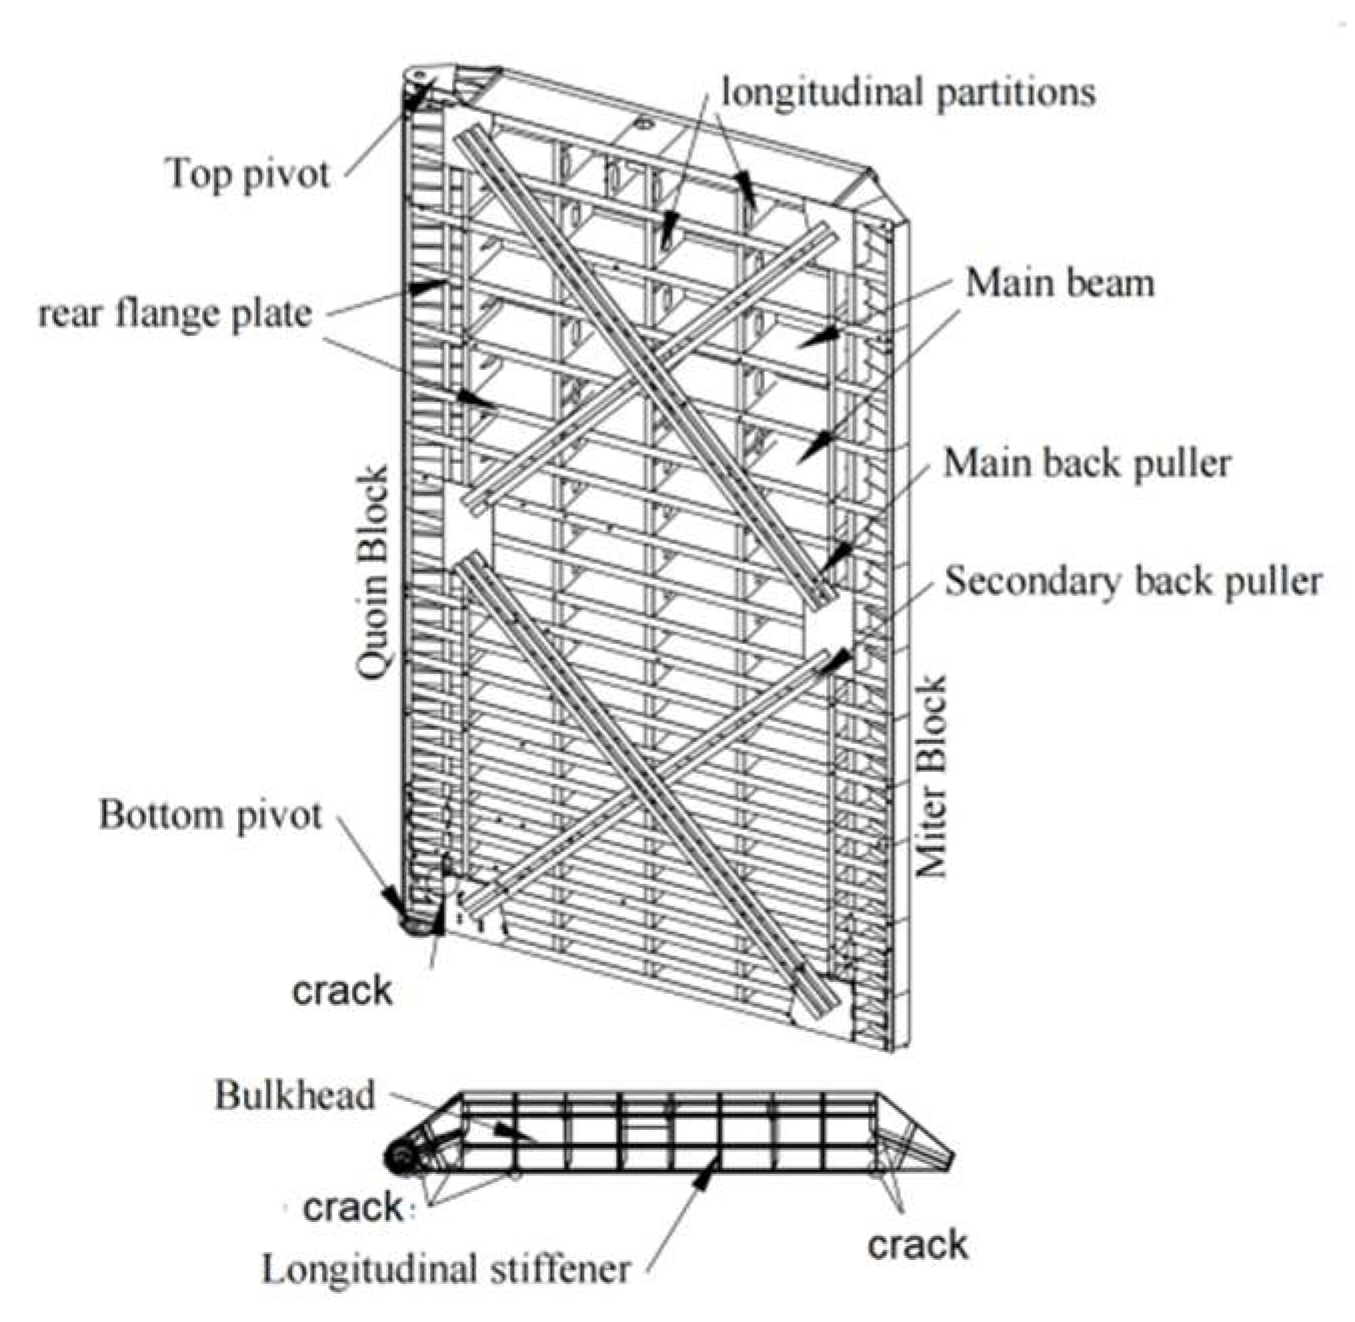
2.1. Miter Gate of Gezhouba Dam

This paper takes the downstream miter gate of the Gezhouba dam No. 2 lock as the research object. The single gate size is 33,400 mm × 19,700 mm × 2700 mm (height × width × thickness), with 23 main beams and 5 longitudinal partitions. As shown in Figure 1, there are 10 back ties in the downstream surface, including 3 primary back ties and 2 vice back ties in the upper and lower layers, and the area of back ties is 300 mm × 28 mm. The threshold elevation of the downstream miter gate is 34.00 m, and the height of the bottom main beam is 34.39 m. The highest navigable water level upstream of the lock is 67.0 m, the highest acceptable water level downstream is 54.50 m, and the lowest acceptable water level is 39.00 m. The primary wind pressure is 0.3 kN/m2, and the water level difference between the gate opening and closing is 0.20 m [17].
The miter gate is a spatial thin-walled steel structure. When the miter gate switches to operate under self-weight and hangs freely, it generates a sizeable torsional deformation of warping upstream. The back tie rod is set on the miter gate, and the pre-stress is applied to effectively improve the gate’s torsional stiffness and reduce the gate’s torsional deformation [18,19,20]. According to the information provided by the Yangtze River Three Gorges Navigation Administration, the pre-stressing value is about 80 MPa for the central rod and 70 MPa for the secondary rod of the downstream miter gate of lock No. 2 [21]. The miter gate is subjected to water pressure in closing and retaining water.

2.2. On-Line Monitoring System for Gates

The system adopts large-scale, multi-parameter, and fiberoptic grating sensors to monitor all critical components and stress concentration areas of the gate and to realize the dynamic monitoring of the stress strain and the cracks of the gate in a full-time and total size. Fiber Bragg grating (FBG) technology is formed by using ultraviolet exposure technology to cause periodic changes in the refractive index in the fiber core. The FBG stress sensor is usually attached to an elastic body and protected with packaging. The wavelength of reflected light is very sensitive to temperature, stress, and strain. When the flexible body is under pressure, the fiber Bragg grating and the elastic body will strain together, resulting in the shift of the peak wavelength of the reflected light of the fiber Bragg grating. The temperature, stress, and strain can be sensed by measuring the wavelength shift. The FBG sensor has a strong anti-electromagnetic interference ability, electrical insulation, corrosion resistance, and material safety compared with traditional electrical sensors. It can be transmitted without forming a loop and maintain good working characteristics in harsh environments.
The system consists of signal detection, data acquisition, data processing, data presentation, remote supervision, and other modules, as shown in Figure 2. The signal monitoring module includes sensors, signal transmitters, and a signal pre-processing board, using FBG stress sensors to collect the stress signal at different locations on the gate and an FBG crack sensor to collect the gate crack state.
During the overhaul process of the Gezhouba No. 1 to No. 3 lock miter gates, some cracks were found on the node plate of the bottom layer, the connection of the lower flange plate of the main transverse beam of the gate body, as well as on the stiffening plate of the gate shaft column end, etc., [22,23,24]. Combined with the faults and the location of the cracks in the gate body during the historical overhaul of No. 2 locks, the FBG stress and crack sensors were chosen for application. The FBG crack sensors are installed on the door shaft, door partition, diagonal joint column, and door seam. We installed the FBG crack sensors on the back ties, rear flange plate, and inner web of the 23rd to 27th layers of the door body, where there are connection holes between adjacent measurement points in the horizontal and vertical directions. The fiberoptic cables are installed to connect the network using these holes, as shown in Figure 3. Waterproof and long-life FBG strain gauge GBC-1108 (produced by Wuhan Polytechnic Optical Co., Ltd., Wuhan, China) with the tube package and the exceptional support (Q345 steel) is used for stress monitoring. The FBG crack displacement gauge GYC-1102 (produced by Wuhan Polytechnic Optical Co., Ltd.) with box package is installed by the special brackets (Q345) in series on the cracks repaired by welding on the door body for real-time monitoring. All sensors’ sampling frequency is 1 Hz.

3. Finite Element Analysis of the Miter Gate

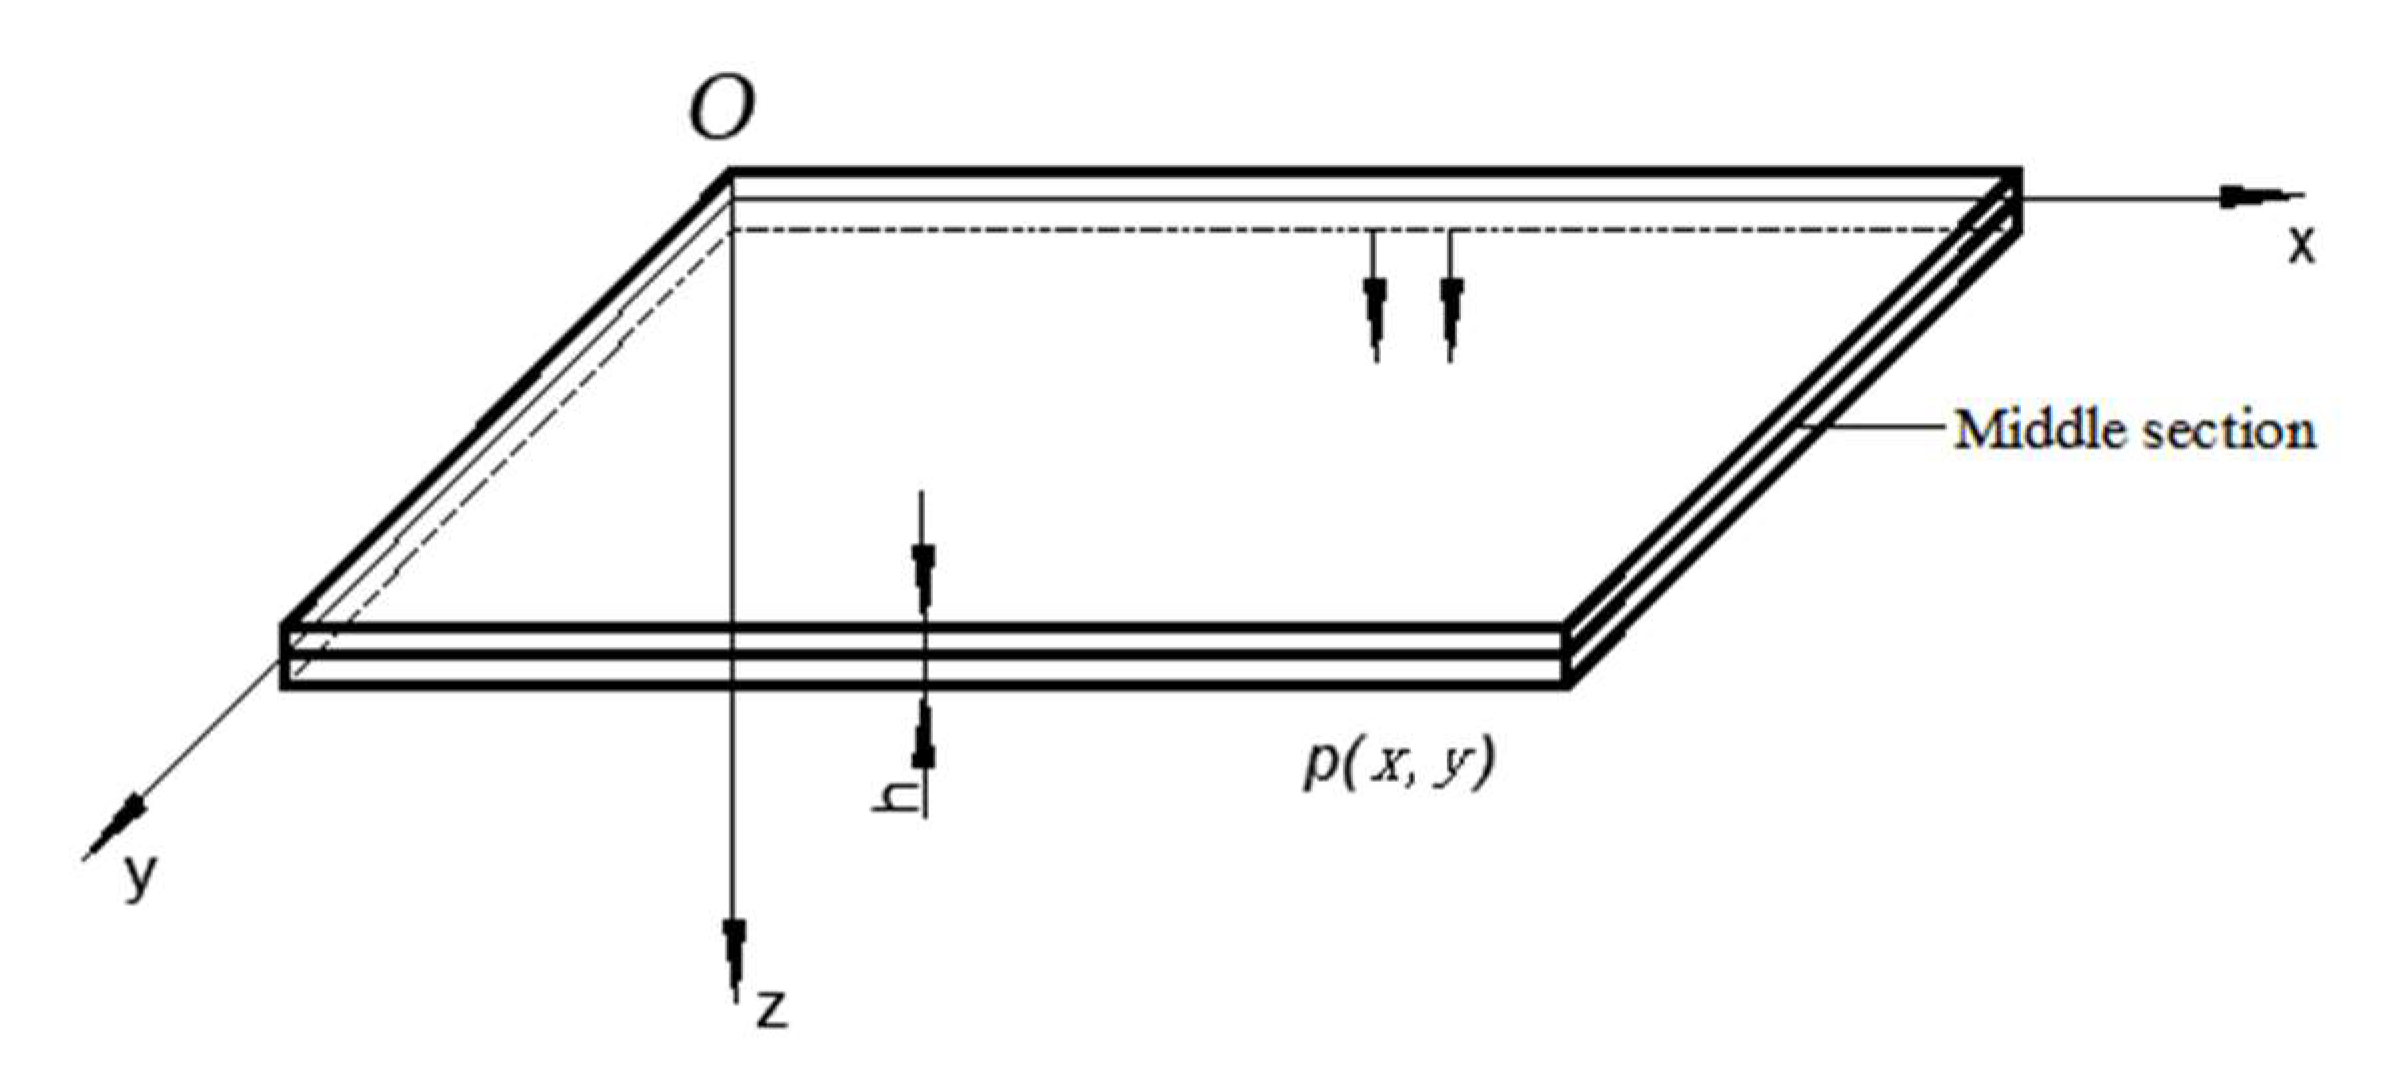
3.1. Model Establishment and Grid Division

The gate size is large, and the ratio of the length to width to thickness of the plate is too large. Therefore, to obtain a high-quality grid, the grid size must be reduced, which will increase the number of grids, resulting in doubling the calculation amount. Therefore, it is necessary to simplify the model.
The plate shell structure means that the thickness t of the plate is much smaller than the dimensions in the other two directions. Whether the structure can be simplified as a plate and shell problem requires determining the thickness ratio to other azimuth dimensions. If 1/80 ≤ t ≤ 1/10, it can be attributed to a plate (thin shell) problem. If it is between 1/10–1/5, it belongs to a thick shell problem. If it exceeds 1/5, it does not belong to a plate and shell structure problem. The mechanical model of the plate and shell element is taken as the neutral surface of the structural element. Each neutral surface is represented as a combination of plate or shell elements with different thicknesses to simulate the structural body, as shown in Figure 4.
A miter gate comprises a gate leaf structure, supporting part, water stop part, and other auxiliary parts. The gate leaf structure includes a panel, main beam, secondary beam, diaphragm, vertical diaphragm, back tie rod, door shaft column, and miter column. The panel, main beam, secondary beam, diaphragm, and vertical diaphragm are plate parts with a large ratio of length, width, and thickness. We set them as plate elements in modeling, and the rest are solid elements, including 200 plate elements and 19 solid elements. The coordinate system selects the x-axis as the axial direction of the main beam of the gate, the y-axis from the upstream to the downstream is perpendicular to the axial direction of the main beam, and the z-axis is vertical upward. The grid type is mainly a hexahedral grid. Finally, the finite element analysis model of 137,296 elements and 160,573 nodes is generated. The finite element model is shown in Figure 5. In the analysis process, the model’s material is 16Mn, the elastic modulus is 206,000 MPa, the Poisson’s ratio is 0.3, the density is 7850 kg/m3, and the gravity acceleration is 9800 mm/S2. Other attribute parameters adopt default values.

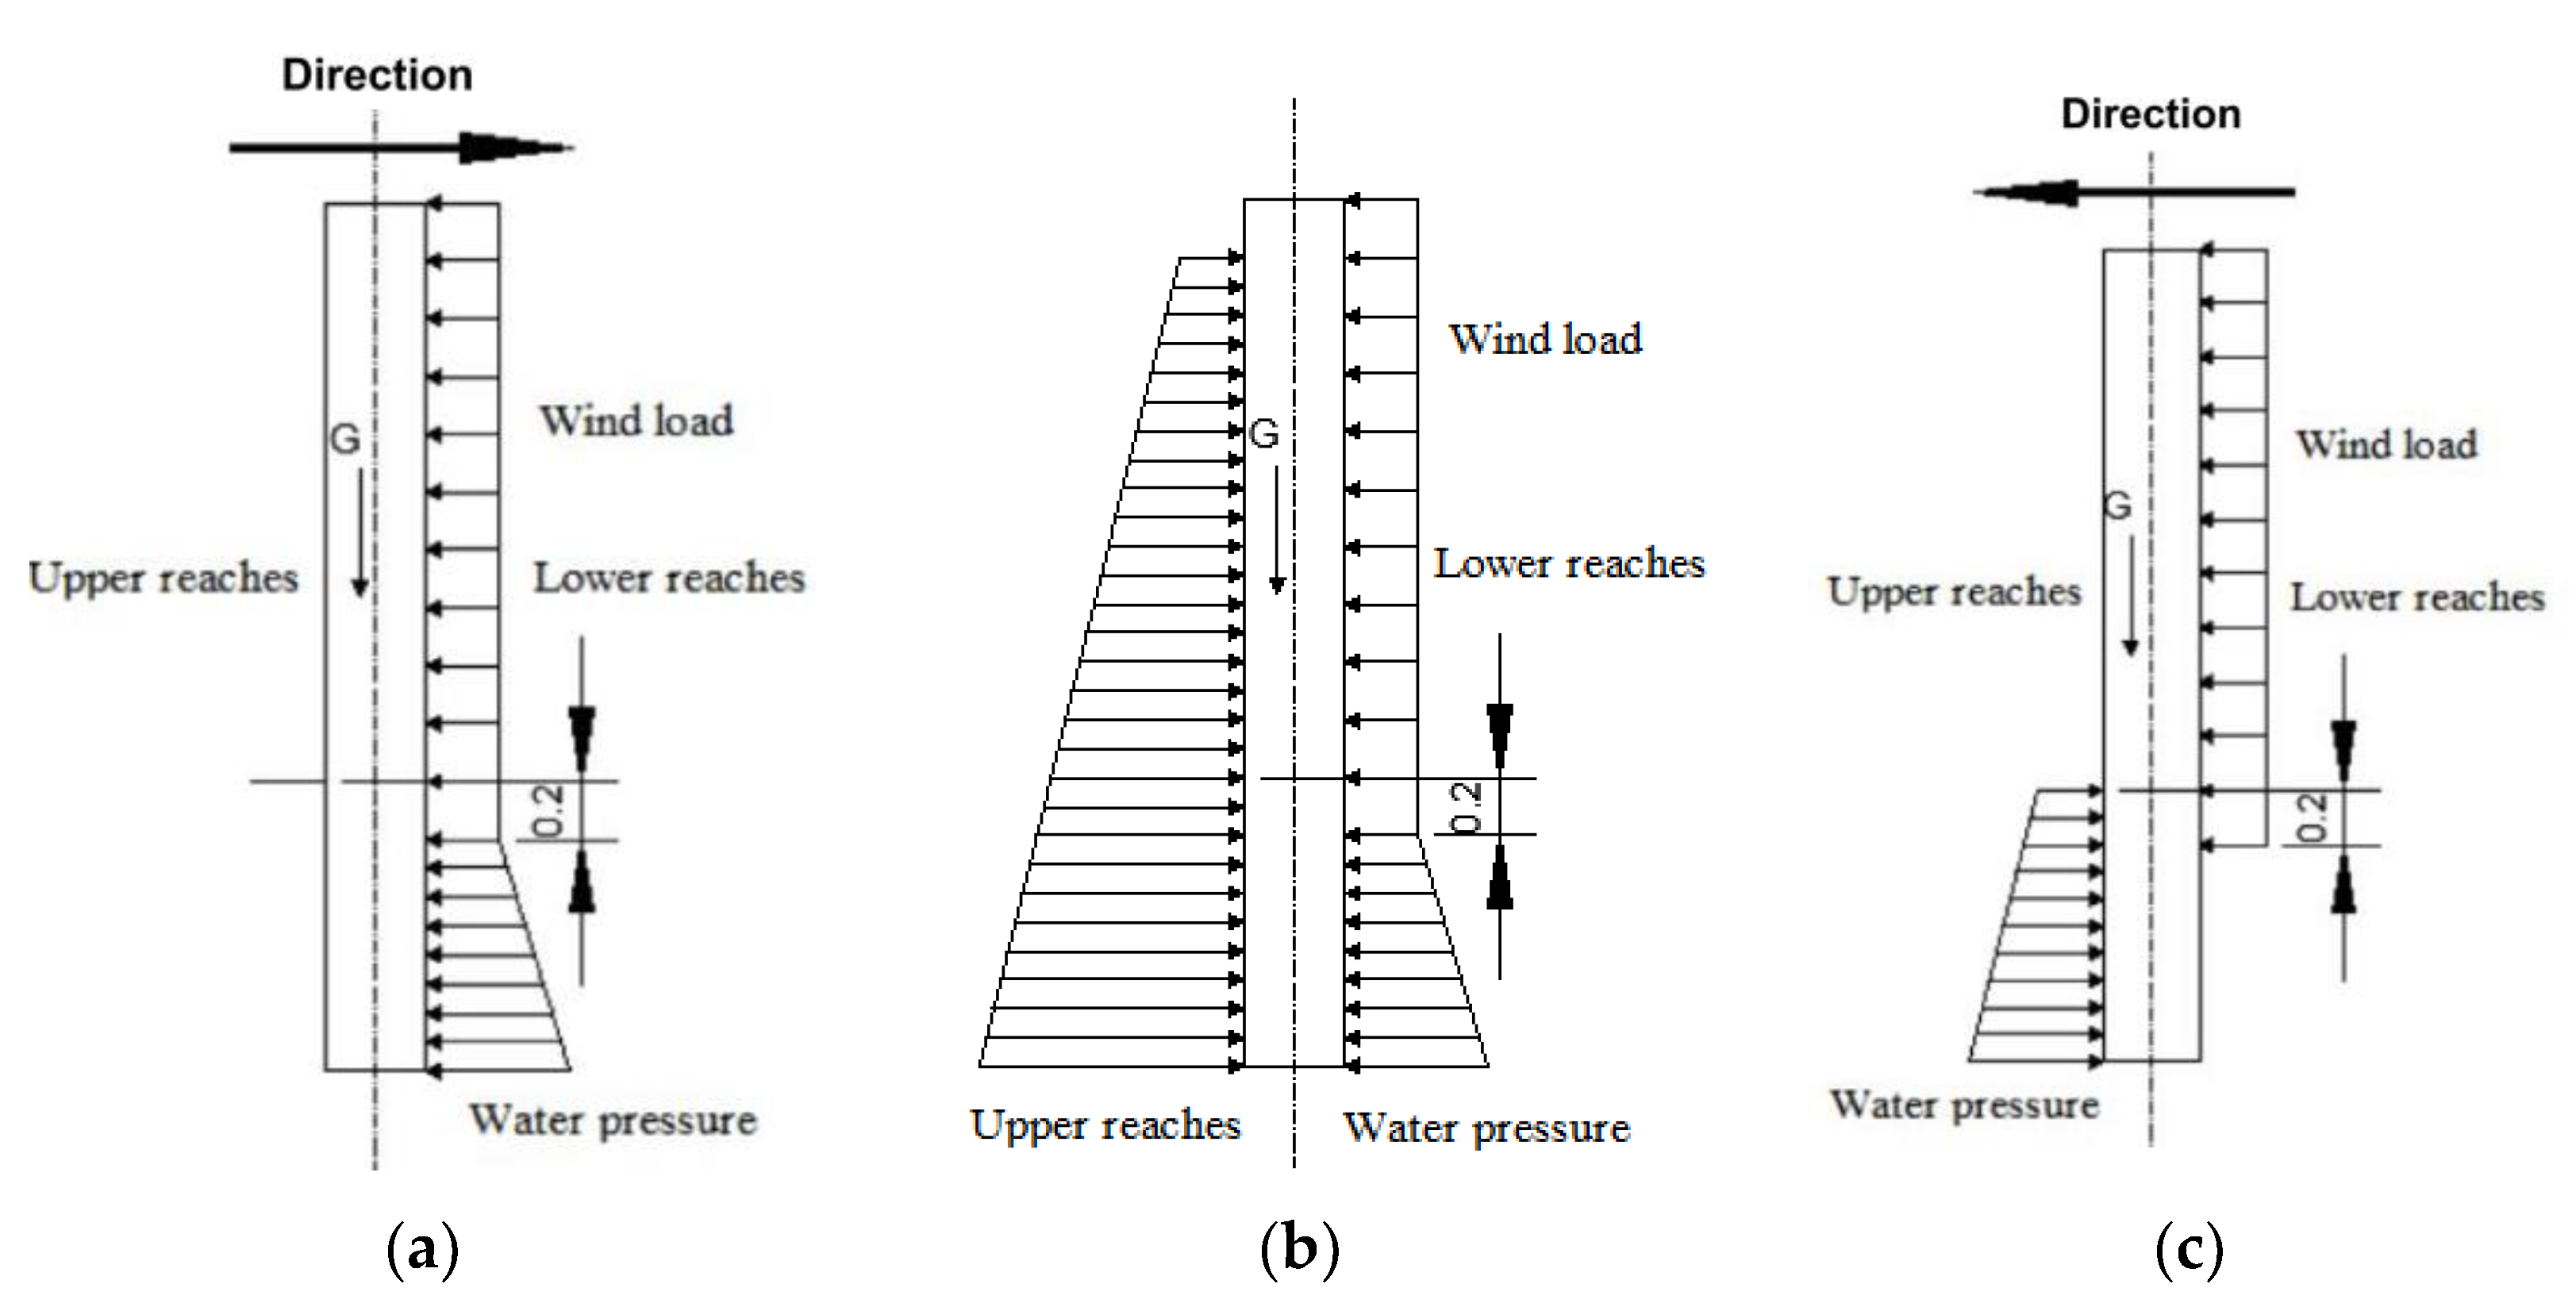
3.2. Setting of Load and Boundary Conditions

The finite element simulation boundary conditions are set based on the gate operation force situation in Figure 5. Because the surge and the friction of the top pivot and bottom pivot on the gate operation are relatively small, we ignored them in the analysis process. There is no corresponding support for the gate shaft column and tilt joint column during the opening process, therefore no constraints are set. The forces of the miter gate under different working conditions are shown in Figure 5.
Load setting: (1) Considering the effect of the gravity of the gate, gravitational acceleration g = 9.8 m/s2 is applied at the center of the gate weight along the negative direction of the gate axis. (2) Wind pressure 159.7 kN, blowing from downstream to upstream. (3) The upstream water level is 5 m when the door is opened, and the dynamic water pressure is 191.1 kN.
Boundary conditions: According to the operation and components of the herringbone gate, the top pivot, bottom pivot, push–pull rod, and gate body are set with constraints. (1) The top pivot is constrained with 5 degrees of freedom, and the Z-direction movement is not constrained. (2) The bottom pivot is constrained with 6 degrees of freedom. (3) Push–pull rod on the door body role part of the constraint 6 degrees of freedom. The above is the load and constraints under the gate opening condition. The other three states can be obtained in Table 1. At rest, the gate is in a closed state, and the fixed restraint of the inclined joint column is increased within 6 degrees of freedom.

3.3. Finite Element Analysis

The finite element model of the No. 2 miter gate was established. The forces of the gate under the three working conditions were determined according to previous research [25,26]. The stress–strain distribution of the gate under different working conditions was calculated, respectively, as shown in Figure 6.
As seen in Figure 6, the stress concentration area is in the lowermost transverse rear flange plate and the vertical door shaft column under the closing condition; the stress range is 60~120 MPa, and the maximum stress point is near the bottom pivot of the gate. The stress concentration area is on the door pivot, the door center seam, and the central transverse rear flange plate under the filling water condition. The stress range is 120~250 MPa, and the maximum stress appears at the intersection of the rear flange plate of each layer along the door pivot direction. The stress concentration area under the opening condition is similar to the closed condition, the stress range is 250~401 MPa, and the maximum stress point is near the door bottom pivot.

4. Signal Analysis and Discussion

4.1. Analysis of Stress Signals

The finite element model analysis found that, during the operation of the miter gate, the primary stress is distributed near the gate shaft column and the bottom pivot of the gate, as well as the middle and lower layers of the rear flange plate. Then, we compared and analyzed the finite element simulation results and the monitoring stress data.
The specific locations of the stress sensors near the gate shaft column (marked red) are shown in Figure 7.
Each group of three sensors was installed at the longitudinal, transverse, and connection points of the rear flange plate, and the stress sensors near the gate shaft column and on the first to the 27th layer on the rear flange plate were selected for analysis. In this paper, the stress signals were extracted from when the miter gate finished closing, filling, draining, and opening during the navigation upstream of the ship on 3 May 2022. Since the operation of the miter gate constantly repeats the action within the above period, this is called the miter gate navigation cycle. The stress signal waveform of the SYM78, SYM79, and SYM80 sensors during this navigation cycle is shown in Figure 8.
It is found that the stress curves fluctuate differently under different operating conditions. This paper uses the peak-to-peak stress (wave peak–wave trough) to express the degree of stress fluctuation of the miter gate under each operating condition. As shown in Table 2, the stress peak-to-peaks are recorded by the stress sensors near the gate shaft column in an operating cycle under each working state.
Table 2 shows that the stresses at different locations in the axial direction near the axial column from the first to the 27th layer of the miter gate have a significant difference in each operating condition. The stresses of the locations at the longitudinal and the transverse rear wing flanges fluctuate more under the water filling and draining conditions. The stress fluctuation is relatively low under the closed and opening conditions, as shown in Figure 9.
Comparing the stress fluctuation at different positions during the gate operation, it is found that the stress change of the first layer of the rear flange plate is larger during the gate’s opening and closing. However, it gradually decreases when increasing the number of gate layers. The stress-concentrated locations and magnitude are similar in the water filling and draining conditions. The water level inside the gate rises and falls under the filling water and draining condition, therefore the stress fluctuation of the rear flange plate is more intense, the maximum of which being 318 MPa. The impact of the lower flange plate is smaller than that of the middle layer. The stress fluctuation in the X-axis direction of the rear flange plate is greater, i.e., it is most affected by the drop in the water level in the gate chamber. The stress magnitude and distribution are consistent with the results of the finite element calculations in Figure 6, therefore it can be judged that the vicinity of the above sensor locations is the weak point of the structure. It is necessary to build long-term monitoring and assess the status of the components at these locations.

4.2. Crack Signal Analysis

Based on the new cracks found during the gate maintenance in the past years, it was found that the cracks mainly occurred in the 23rd to 27th layers of the gate, which have been submerged for a long time. At the same time, according to the stress signal analysis and finite element model calculation, it was found that the stress concentration area during the gate operation was on the gate shaft column and the transverse rear flange plate, which were chosen to install the crack sensors. Therefore, the relevant crack sensors are mainly installed in these five layers, and the discovered cracks are numbered 1–7, as shown in Figure 10. The distributed FBG crack sensors were installed to collect the crack propagation displacement, and three sensors were grouped on one crack. The collected signal waveform is shown in Figure 11, and the peak–peak value of the signal waveform indicates the maximum crack width. Therefore, here, we collected the waveform peak–peak of the different location sensors. Four sets of crack sensor data collected during the navigation cycle in different sampling times were selected to analyze the fatigue crack degree of the miter gate and the crack propagation displacement variation, which is the peak–peak value of the signal waves, as shown in Table 3.
From Table 3, there is one sensor (marked by font-weight) in every group, in which displacement variation is always the biggest in four-time sampling, so that this sensor data can present the crack state. According to Table 3, the sensors LY60, LY64, LY70, LY71, LY98, LY72, and LY89 are selected from every group to analyze the crack state near the door shaft column of the miter gate. The maximum variation of crack propagation displacement at the different positions is shown in Figure 12.
As seen from Figure 12a, the displacement of every crack propagation fluctuates a little in one year. The data collected the second time are the biggest; possibly, the reason for this is seasonal water level fluctuations. We can find that the crack variation located near the bottom (sensor LY89) and the right of the door shaft column (sensor LY72 and LY98) of the gate is more significant, as shown in Figure 12b. The result is consistent with the location and the degree of actual cracks found in maintenance, also with the maximum stress distribution of the gate obtained by simulation. In Figure 12c, for the No. 1 crack located near the gate shaft column, the sensor (LY60) data waveform on the bottom of the crack has the most significant fluctuation compared to the upper sensors (LY61 and LY62), which indicates the direction of crack propagation from the bottom to the top of the crack. Similarly, the No. 5 crack propagation direction is from the bottom of the crack, and the crack width increases with time cumulatively, as shown in Figure 12d. Comparing the stress distribution at different locations, it can be found that the stress is more significant in the transverse rear flange plate area, and the crack width expansion is fastest.

5. Conclusions

As an essential part of Gezhouba dam locks, miter locks have so far undertaken tens of thousands of navigational transport tasks. Frequent opening and closing of the miter gate long-term working in the complex watershed caused fatigue damage to the miter gates. The establishment of the on-line monitoring system is not only a critical method of detecting miter gate failure, it is also an essential basis for miter gate maintenance planning.
In this paper, the stress distribution of the Gezhouba dam No. 2 miter gate under the closed, opening, filling, and draining water conditions are calculated by using finite elements. At the same time, the online monitoring system obtained stress and crack signals. We research the diagnostic method of miter gate working states by combining the theory modeling and signal analysis and draw some conclusions. The stress concentration area in opening and closing the miter gate is near the bottom pivot of the gate, and the stress fluctuation of the gate body caused by two working conditions is minimal. There is a significant difference in the stress distribution of the gate body under the filling and draining water conditions. The stress concentration area under the filling water condition is on the door shaft column, the gate’s middle seam, and the submerged part’s rear flange plate. The stress on the horizontal rear flange plate is more significant than that in the vertical direction, where the maximum value is 318 MPa. The crack width expansion is the largest on the lowermost layer, and the crack extends outward from the tip. The stress magnitude and crack width expansion are correlated in that the stress on the transverse rear flange plate is greater, and the crack width increment is greater.

Supplementary Materials

The following supporting information can be downloaded at: https://www.mdpi.com/article/10.3390/app13010381/s1.

Author Contributions

Signal collection and analysis, Writing paper, R.L.; Finite element modeling and analysis, J.Z.; Research method guidance, J.X. All authors have read and agreed to the published version of the manuscript.

Funding

The research was financially supported by Transportation Research Projects of China no. 2020-MS1-034.

Institutional Review Board Statement

Not applicable.

Informed Consent Statement

Informed consent was obtained from all subjects involved in study.

Data Availability Statement

Data Availability are available on Supplementary Materials.

Conflicts of Interest

The authors declare no conflict of interest.

References

  1. Yin, Z.Y. Preliminary study on quick repair technology of Gezhouba ship Lock. China Water Transp. 2013, 10, 22–23. (In Chinese) [Google Scholar]
  2. Ou, J.P.; Zhou, Z.; Wu, S.J.; Zhao, X.F.; Mo, S.H. Intelligent fiber grating monitoring technology for Hulan River Bridge in Heilongjiang. J. Civ. Eng. 2004, 01, 45–49+64. (In Chinese) [Google Scholar]
  3. Liang, L. Research on the Theory and Application of Fiber Grating Smart Materials and Structures; Wuhan University of Technology: Wuhan, China, 2005. (In Chinese) [Google Scholar]
  4. Wang, L.J. Three-dimensional finite element analysis of the structure of the lower lock head of the Five River Locks. Jianghuai Water Resour. Sci. Technol. 2017, 05, 14–15. (In Chinese) [Google Scholar]
  5. Xiao, X.; Joshi, S. Process planning for five-axis support free additive manufacturing. Addit. Manuf. 2020, 36, 101569. [Google Scholar] [CrossRef]
  6. Xiao, X.; Joshi, S. Automatic toolpath generation for heterogeneous objects manufactured by directed energy deposition additive manufacturing Process. J. Manuf. Sci. Eng. 2018, 140, 071005. [Google Scholar] [CrossRef]
  7. Xiao, X.; Joshi, S. Decomposition and Sequencing for a 5-Axis Hybrid Manufacturing Process. In Proceedings of the ASME 2020 15th International Manufacturing Science and Engineering Conference, Virtual, 3 September 2020. [Google Scholar]
  8. Xiao, X.; Waddell, C.; Hamilton, C.; Xiao, H. Quality Prediction and Control in Wire Arc Additive Manufacturing via Novel Machine Learning Framework. Micromachines 2022, 13, 137. [Google Scholar] [CrossRef]
  9. Xiao, X.; Xiao, H. Autonomous Robotic Feature-Based Freeform Fabrication Approach. Materials 2021, 15, 247. [Google Scholar] [CrossRef]
  10. Tahmasebinia, F.; Doskey, R.; Elrich, O.; Kelly, D.; Sepasgozar, S.; Marroquin, F. Assessment of the Local and Global Stability of the Luzzone Arch Dam Including Visualisation of the Data Analysis. Sustainability 2021, 13, 4062. [Google Scholar] [CrossRef]
  11. Chu, H.P.; Zhou, K.M.; Xie, H.L. Application of all-fiber optic dam monitoring automation system in earth and rock dams. Water Hydrol. Autom. 2003, 04, 11–15. (In Chinese) [Google Scholar]
  12. Chen, M.; Cao, Q.L. Research on structural stress analysis based on finite element ship lock. J. Water Resour. Constr. Eng. 2012, 10, 114–119. (In Chinese) [Google Scholar]
  13. Wen, X.K.; Deng, F.M.; Zhang, Y.L. Three-dimensional non-linear analysis of the lower lock head structure based on ANSYS finite element software. Waterw. Ports 2021, 42, 670–675+682. (In Chinese) [Google Scholar]
  14. Xiao, X.; Joshi, S.; Cecil, J. Critical assessment of Shape Retrieval Tools (SRTs). Int. J. Adv. Manuf. Technol. 2021, 116, 3431–3446. [Google Scholar] [CrossRef]
  15. Xiao, X.; Roh, B.M.; Hamilton, C. Porosity management and control in powder bed fusion process through process-quality interactions. CIRP J. Manuf. Sci. Technol. 2022, 38, 120–128. [Google Scholar] [CrossRef]
  16. Xiao, X.; Roh, B.-M.; Zhu, F. Strength Enhancement in Fused Filament Fabrication via the Isotropy Toolpath. Appl. Sci. 2021, 11, 6100. [Google Scholar] [CrossRef]
  17. Sun, B.H.; Huang, Y.D.; Xu, H.Q. Ansys-based pre-stressing design of back ties for large ship lock herringbone gates. Water Transp. Eng. 2018, 12, 143–146. (In Chinese) [Google Scholar]
  18. Cheng, X.L. Finite Element Analysis of Herringbone Gate Structure of Ship Lock; Chongqing Jiaotong University: Chongqing, China, 2013. (In Chinese) [Google Scholar]
  19. Department of the Army U.S. Army Corps of Engineers. Engineering and Design of Lock Gates and Operating Equipment EM 1110-2-2703S; Department of the U.S. Army Corps of Engineers: Washington, DC, USA, 1984. [Google Scholar]
  20. Zhang, J.B.; Wei, Z.; Wang, P.F. Research and Application of Cross Spatial Grid Method in Combined Box Girder Bridge with Corrugated Steel Webs. IOP Conf. Ser. Earth Environ. Sci. 2020, 1, 587. [Google Scholar]
  21. Liu, Z.J. Management practice for operation and maintenance of hydraulic structure of Gezhouba ship lock. China Water Transp. 2020, 2, 9–13. (In Chinese) [Google Scholar]
  22. Riveros, G.A.; Ayala-Burgos, J.L.; Dixon, D.A. Numerical Investigation of Diagonals in Miter Gates: Looking for the Optimum Prestressing. J. Perform. Constr. Facil. 2017, 31, 04016073. [Google Scholar] [CrossRef]
  23. Riveros, G.A.; Acosta, F.J.; Lozano, C.M.; Glynn, E. The Effects of Deteriorated Boundary Conditions on Horizontally Framed Miter Gates. Metals 2022, 12, 37. [Google Scholar] [CrossRef]
  24. Ji, Y.J. Study on the Duration of Closure and Overhaul of Gezhouba Shiplock. China Water Transp. 2013, 05, 19–21. (In Chinese) [Google Scholar]
  25. Li, R.; Xiao, H.B.; Xiao, X.X.; Zhang, J.; Pan, L. Deformation Analysis of Large Miter Gate under Different Operating Conditions. Energies 2022, 15, 978. [Google Scholar] [CrossRef]
  26. Zhang, Z.Y.; Luo, Y.Z. Restoring method for missing data of spatial structural stress monitoring based on correlation. Mech. Syst. Signal Process. 2017, 91, 266–277. [Google Scholar] [CrossRef]
Figure 1. Gezhouba No. 2 miter gate structure.
Applsci 13 00381 g001
Figure 2. On-line monitoring system for the miter gate.
Applsci 13 00381 g002
Figure 3. Layout of sensors on miter gate.
Applsci 13 00381 g003
Figure 4. Middle section of thin plate in rectangular coordinate system.
Applsci 13 00381 g004
Figure 5. Schematic diagram of the force under the operation of the herringbone door under different working conditions: (a) closed condition, (b) filling water condition, (c) opening condition.
Applsci 13 00381 g005
Figure 6. Finite element model of the gate and stress distribution under different working conditions: (a) finite element model; (b) closing condition; (c) filling water condition; (d) opening condition.
Applsci 13 00381 g006
Figure 7. Schematic diagram of the strain sensor layout on the gate pivot axis of the gate.
Applsci 13 00381 g007
Figure 8. Stress signal waveform in a navigation cycle of miter gate.
Applsci 13 00381 g008
Figure 9. Stress variation at locations of (a) longitudinal rear wing flange; (b) transverse rear wing flange; (c) crossed rear wing flange under different working conditions.
Applsci 13 00381 g009
Figure 10. Schematic diagram of crack sensors layout near the door shaft area.
Applsci 13 00381 g010
Figure 11. Crack signal waveform collected by distributed fiber Bragg grating crack sensor.
Applsci 13 00381 g011
Figure 12. (a) The maximum variation of crack propagation displacement of the miter gate at the different positions as time; (b) the displacement variation of the cracks at different locations in the second time sampling; (c) No. 1 crack and (d) No. 5 crack displacement variation in four time sampling.
Applsci 13 00381 g012aApplsci 13 00381 g012b
Table 1. Stress load and constraint of the gate under different states.
ConditionGravityWind LoadThe Minimum Water Pressure in Upper ReachesWater Pressure in Lower ReachesThe Maximum Water Pressure in Upper ReachesBottom Pivot ConstraintTop Pivot ConstraintMiter Column ConstraintPush–Pull Rod Restraint
Closed condition
Gate filling water condition
Open condition
Table 2. Stress variation at different locations under different working conditions (MPa).
ConditionsClosingFilling WaterDrainingOpening
Sensors
Longitudinal rear wing flangeSYM85.76.87.32.7
SYM131.016.729.37.6
SYM800.4211.4216.72.5
SYM840.1177.2178.74.0
SYM1131.4142.8143.70.9
SYM1410.2194.2192.80.1
Transverse rear wing flangeSYM106.244.621.95.6
SYM111.01.56.73.6
SYM781.1318.4291.10.9
SYM821.2193.6191.14.1
SYM1110.864.673.20.2
SYM1390.2154.7153.90.8
Crossed rear wing flangeSYM97.625.27.46.4
SYM124.013.818.510.0
SYM791.296.8100.83.6
SYM830.219.818.66.3
SYM1120.251.030.40.2
SYM1401.017.718.00.5
Table 3. Crack propagation displacement variation of the miter gate at the different positions by four times of sampling (mm).
SensorCrack Propagation Displacement Variation (mm)
First TimeSecond TimeThird TimeFourth Time
Group1LY600.07500.11600.12400.0870
LY610.05600.07300.04200.0530
LY620.02400.03500.02500.0390
Group2LY640.10500.14700.16400.1550
LY650.10300.10700.10600.1040
LY660.02100.05200.03400.0480
Group3LY680.04000.05300.03700.0370
LY690.03400.05600.03900.0480
LY700.06500.07100.04900.0510
Group4LY710.08300.08400.07500.0870
LY780.04200.07100.04500.0600
LY970.06000.06000.02700.0450
Group5LY830.04100.04700.04100.0510
LY980.13700.25200.22700.2560
LY990.08200.12600.10400.1190
Group6LY720.09600.21200.17100.1720
LY1050.07100.08900.07500.0730
Group7LY880.08600.16000.13400.1520
LY890.20600.33700.29700.3110
Note: The first sampling time is 5 July 2021, the second sampling time is 14 April 2022, the third sampling time is 5 May 2022, and the fourth sampling time is 4 July 2022.
Disclaimer/Publisher’s Note: The statements, opinions and data contained in all publications are solely those of the individual author(s) and contributor(s) and not of MDPI and/or the editor(s). MDPI and/or the editor(s) disclaim responsibility for any injury to people or property resulting from any ideas, methods, instructions or products referred to in the content.

